Project Image Pool
There are 419 results.
Terms of use: The pictures on this site originate from the projects in the frame of the programmes City of Tomorrow, Building of Tomorrow and the IEA Research Cooperation. They may be used credited for non-commercial purposes under the Creative Commons License Attribution-NonCommercial (CC BY-NC).
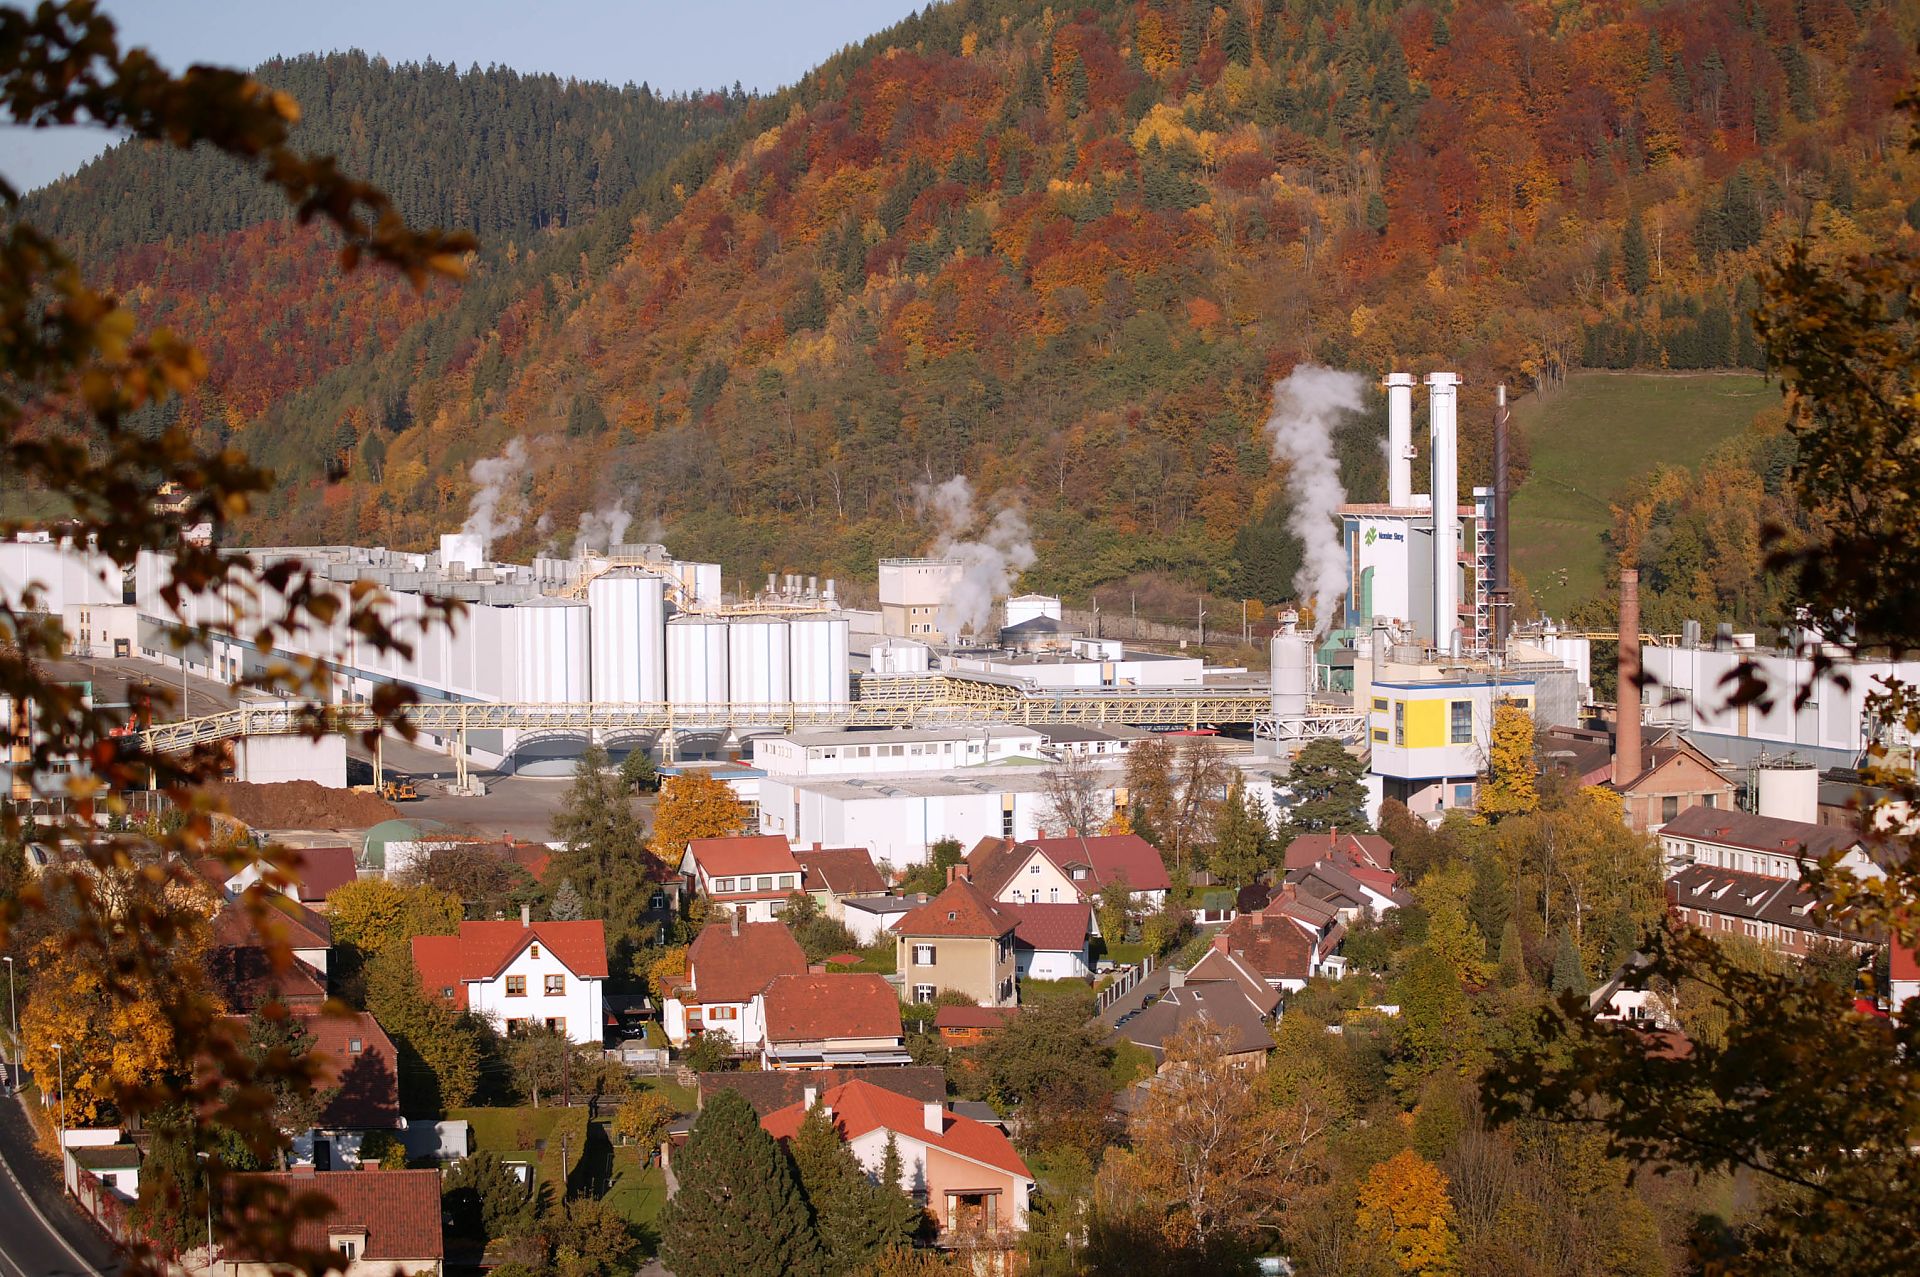
Aerial view of the Norske Skog paper mill in Bruck an der Mur
A residual-matter power plant resumed operation on the paper mill site in March 2022. The power plant is a fluidized bed unit that will enable Norske Skog to reduce CO2 emissions by up to 150,000 tons per year.
Copyright: Norske Skog Bruck GmbH

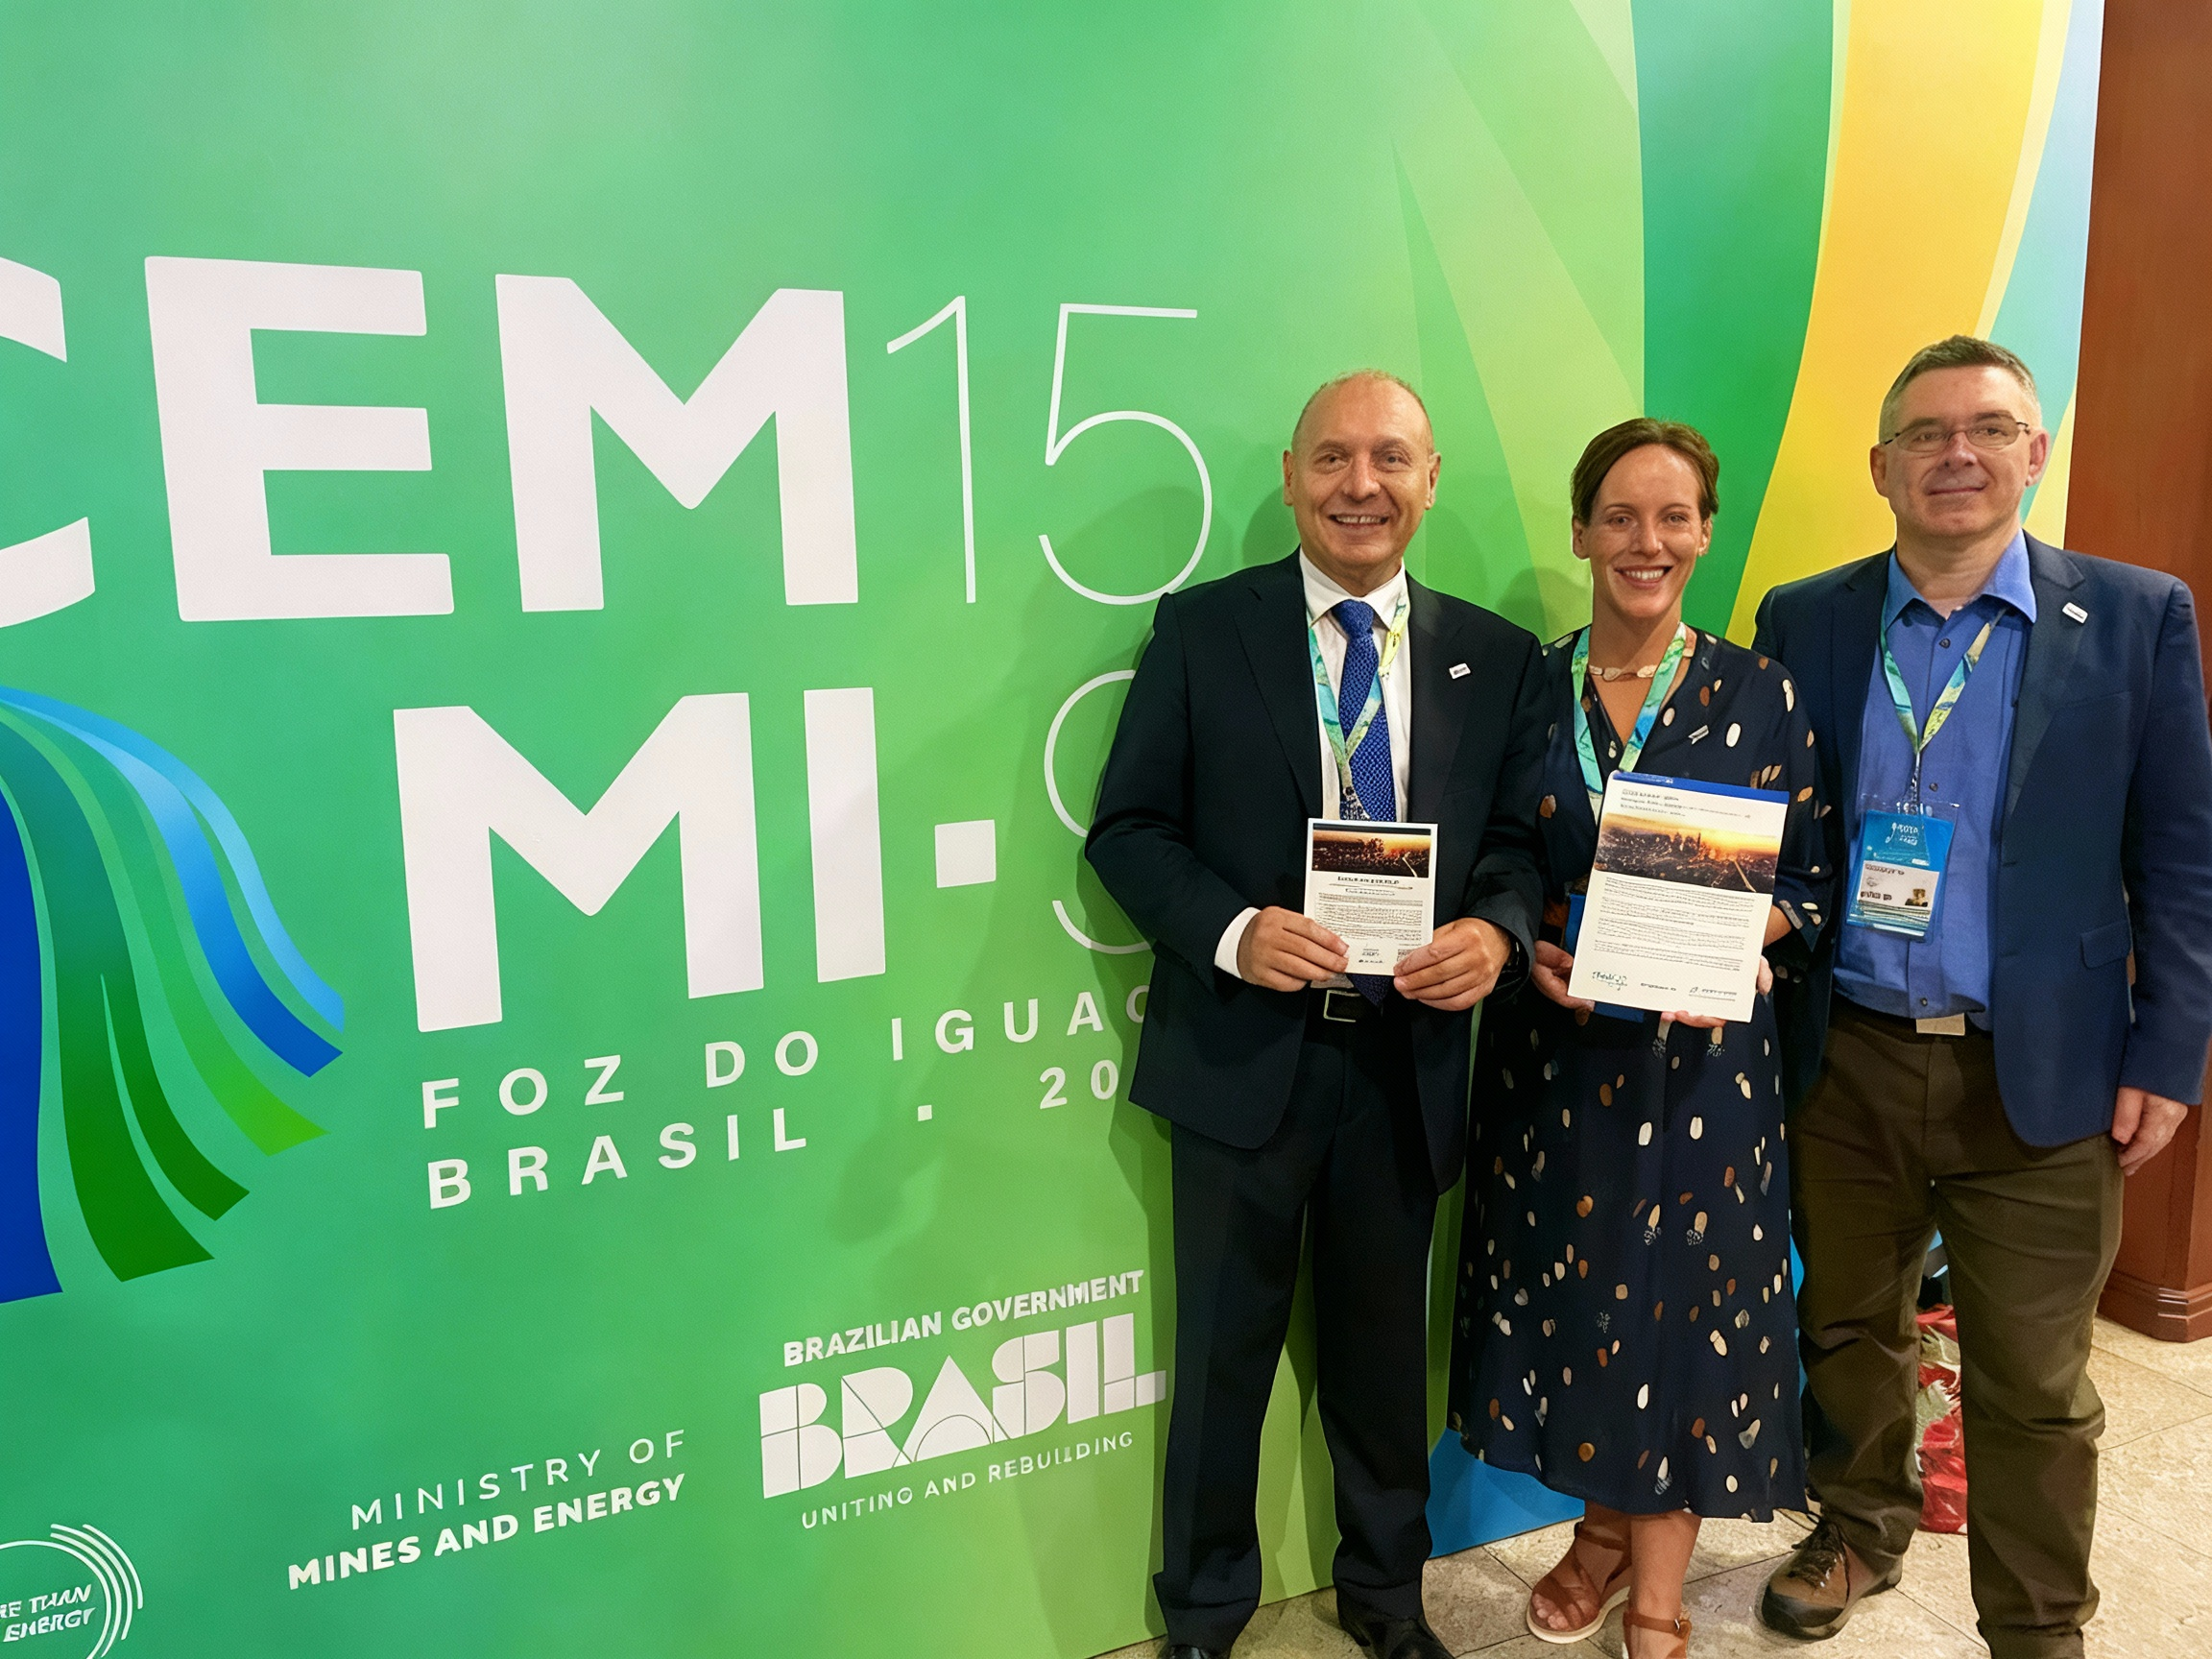
Policy Brief 2024
Policy Brief: presentation at CEM15/MI-9
Copyright: Helena Lindquist

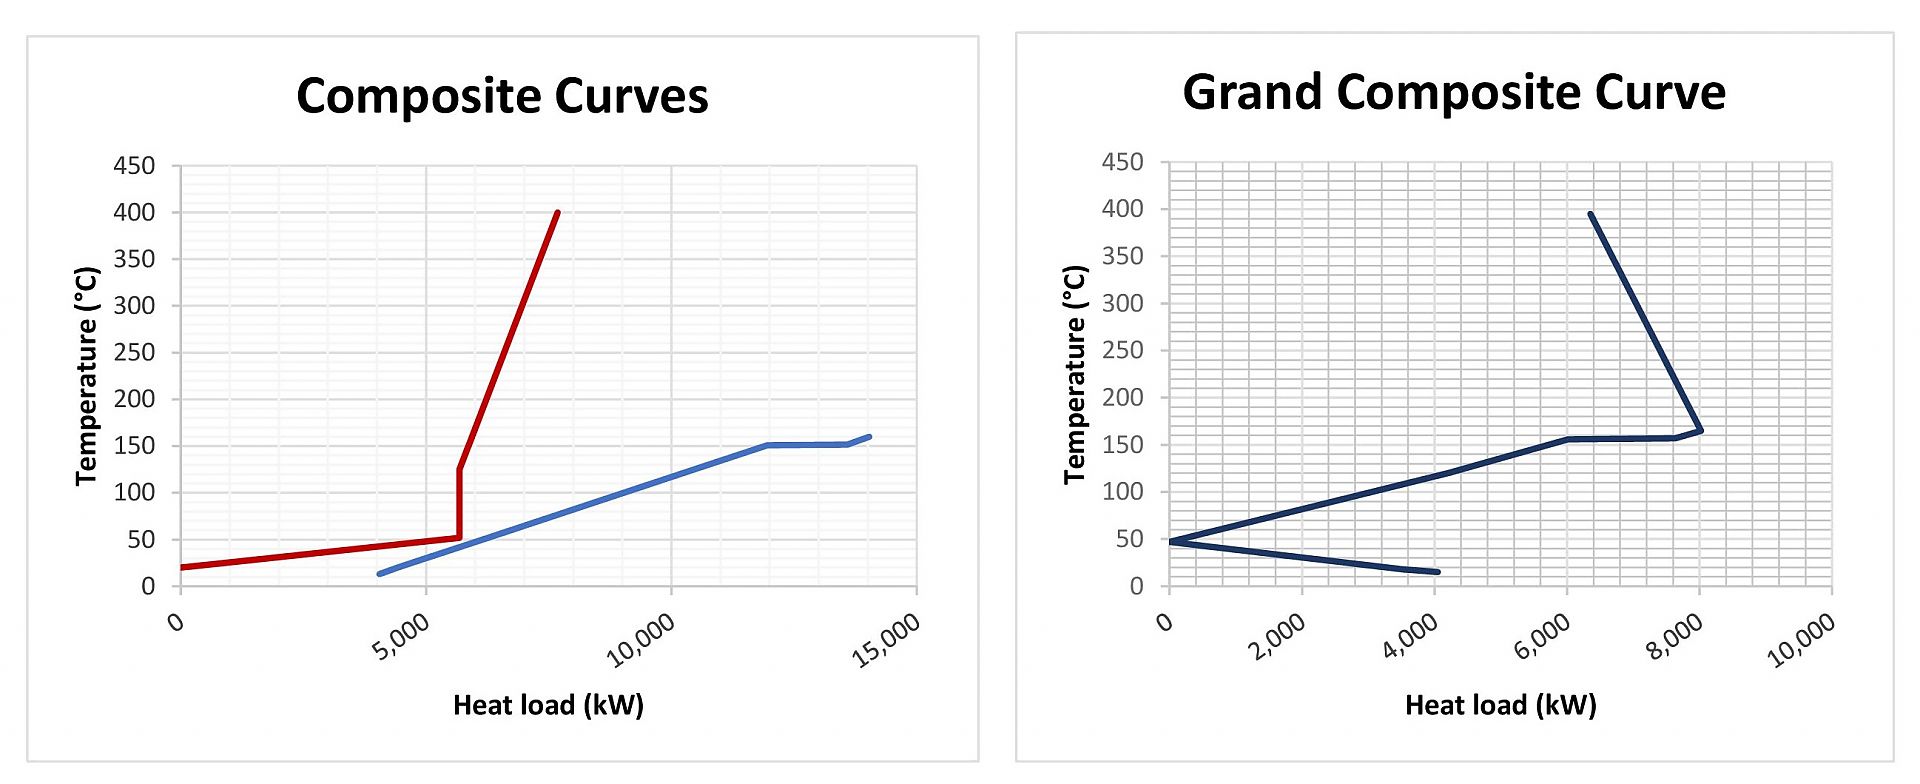
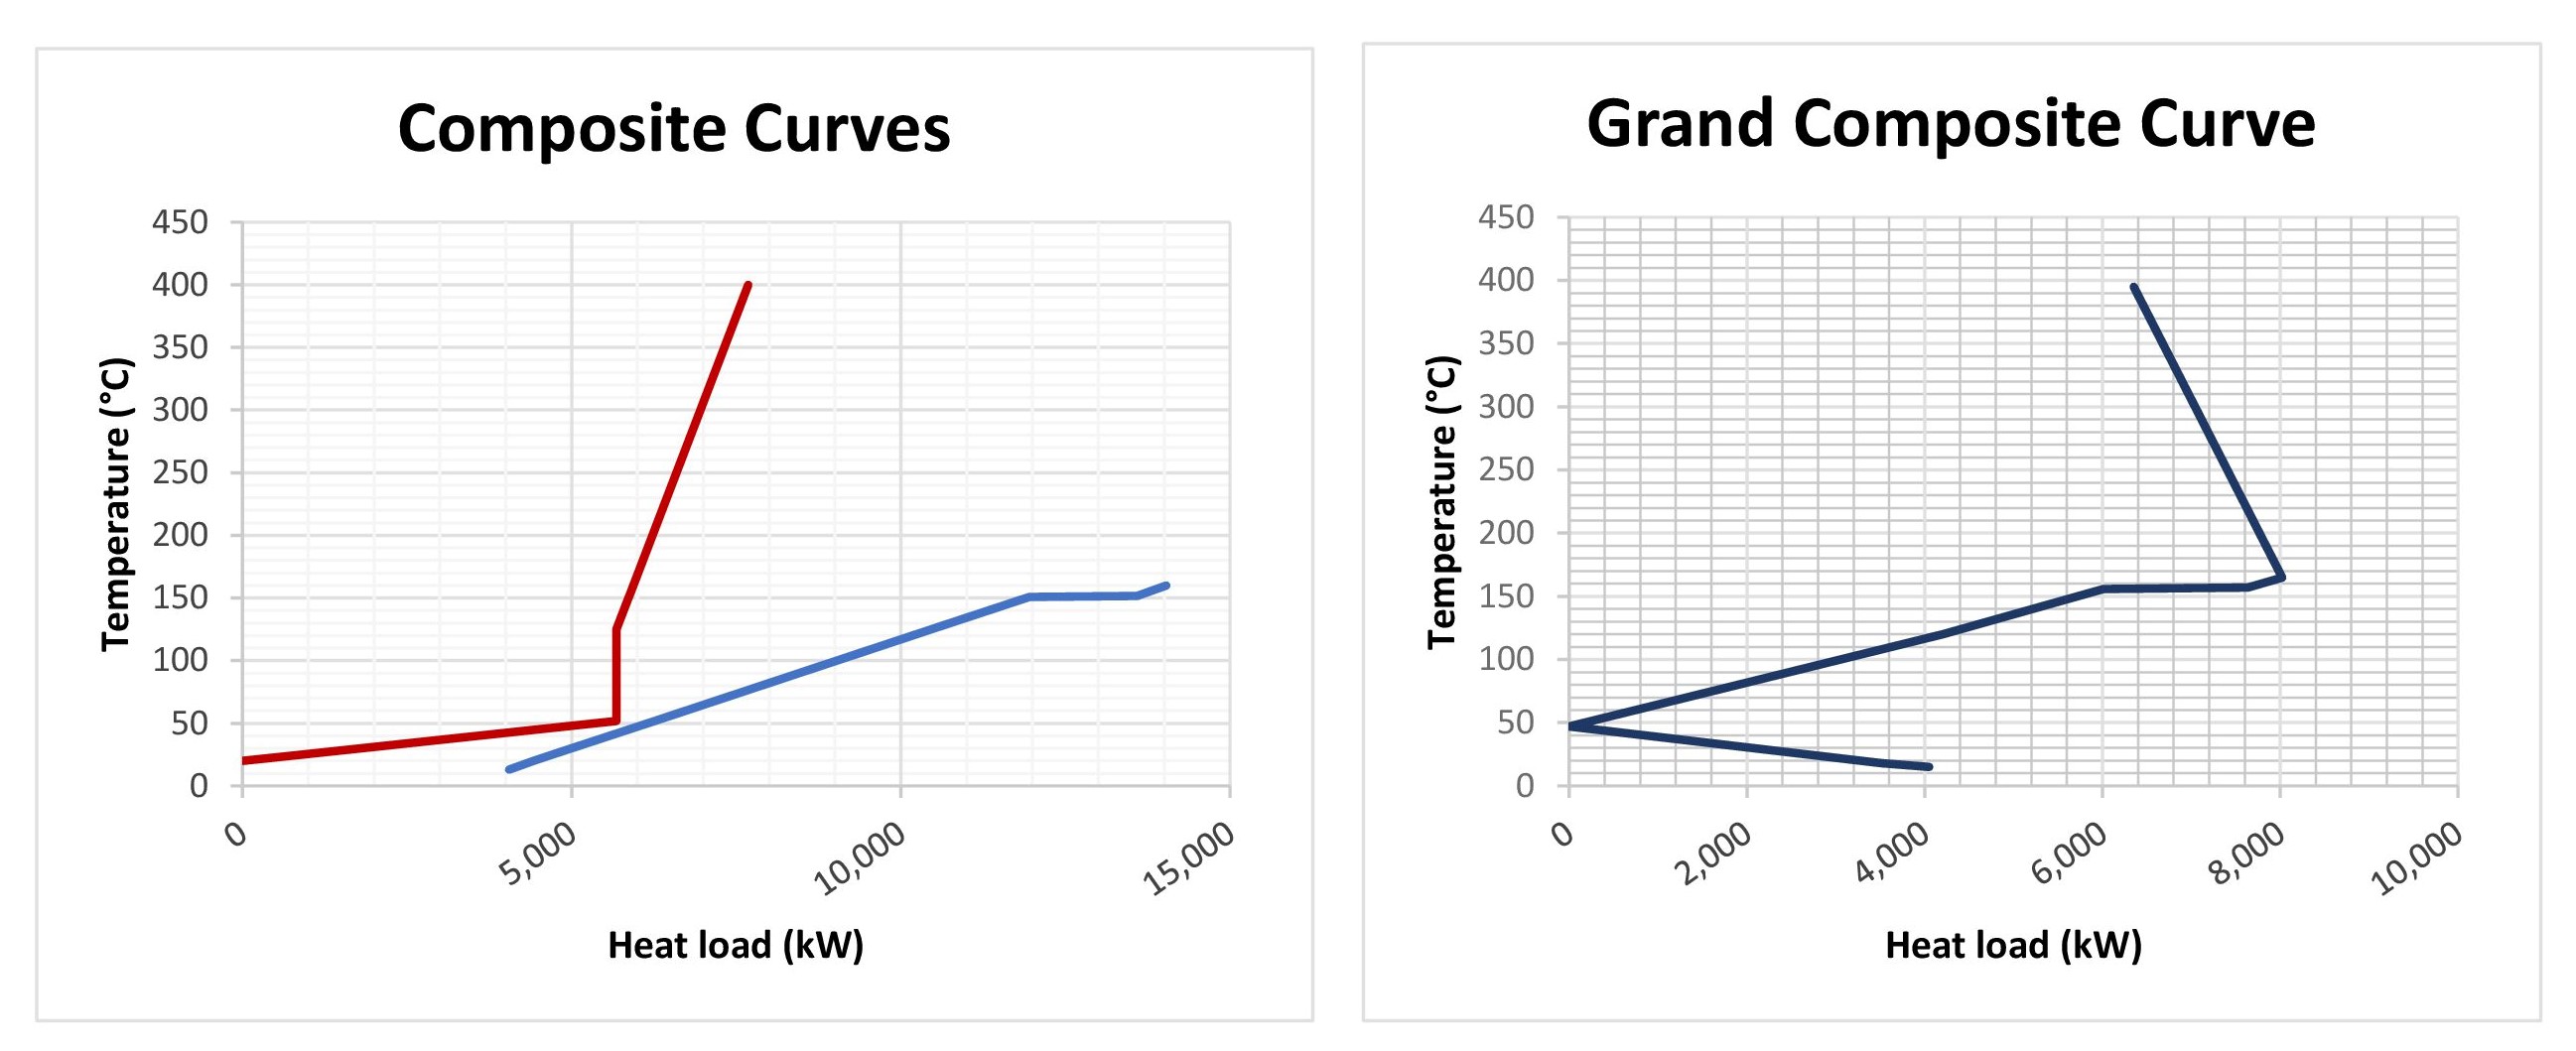
Composite Curves for an Example Case
The figure shows Composite Curves from Pinch Analysis for an Example Case that was evaluated within the project.
Copyright: Austrian Institute of Technology GmbH

Word cloud Annex 15 Projects
The figure shows a word cloud with the most common words occuring in the project descriptions of Annex 15 partners.
Copyright: Austrian Institute of Technology GmbH
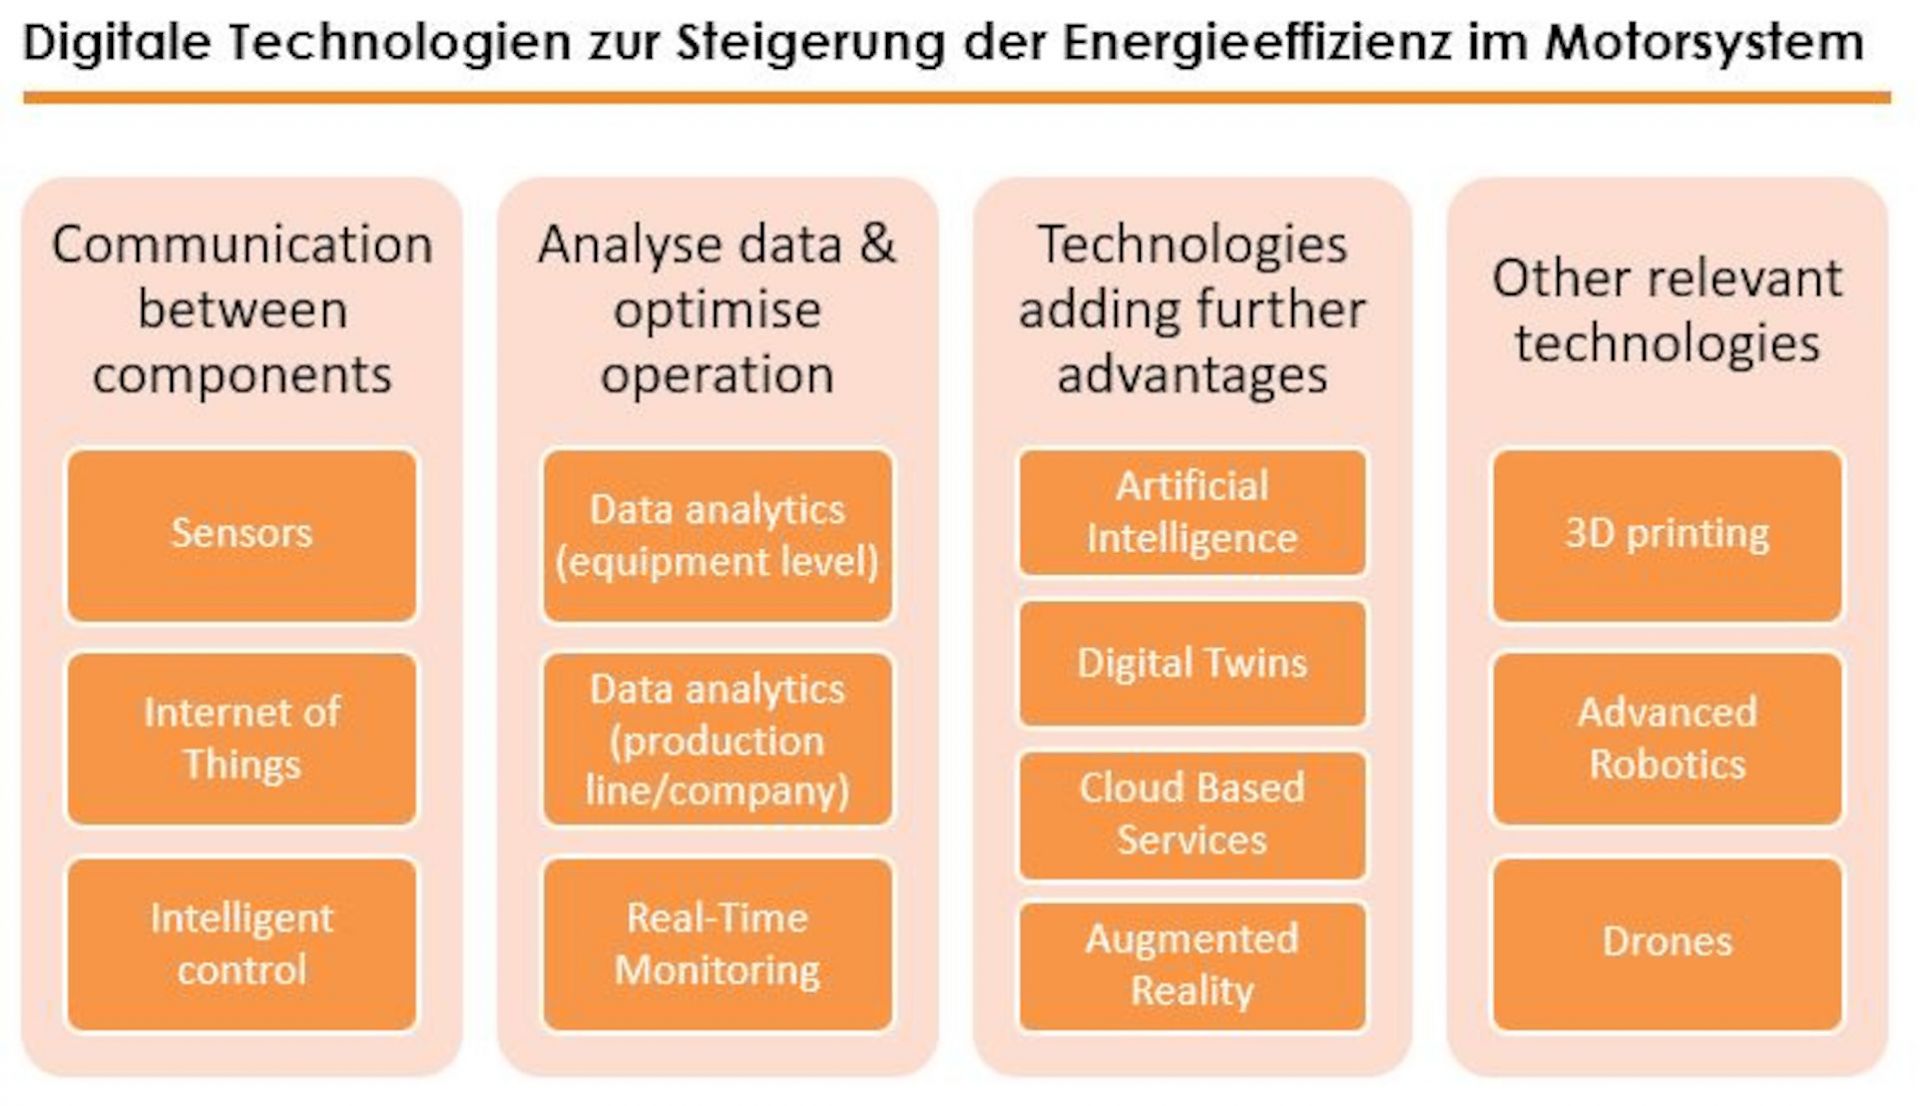
Digital Technologies to Increase the Energyefficiency in Electric Motor Systems
This figure gives an overview of the technologies that were identified as relevant for energy efficiency in electric motor systems in several workshops, in the survey and interviews. Starting on the left-hand side, technologies listed are smart sensors, advanced control on the level of machines and the Internet of things enabling communication between the different levels and components (in dark blue). Furthermore, the next level is the use of possibilities to analyse data and optimize operation (in green): data analytics on both the level of motor systems and on the level of production lines or even the whole company. Continuous monitoring of the different appliances is also significant. Technologies adding advantages to these applications (in grey) are digital twins, cloud-based services and artificial intelligence. Augmented reality can help to implement the suggested measures. Three technologies that are not directly related to the optimization of motor driven systems, but are of further interest include drones, 3D printing and advanced robotics.
Copyright: Österreichische Energieagentur, impact energy
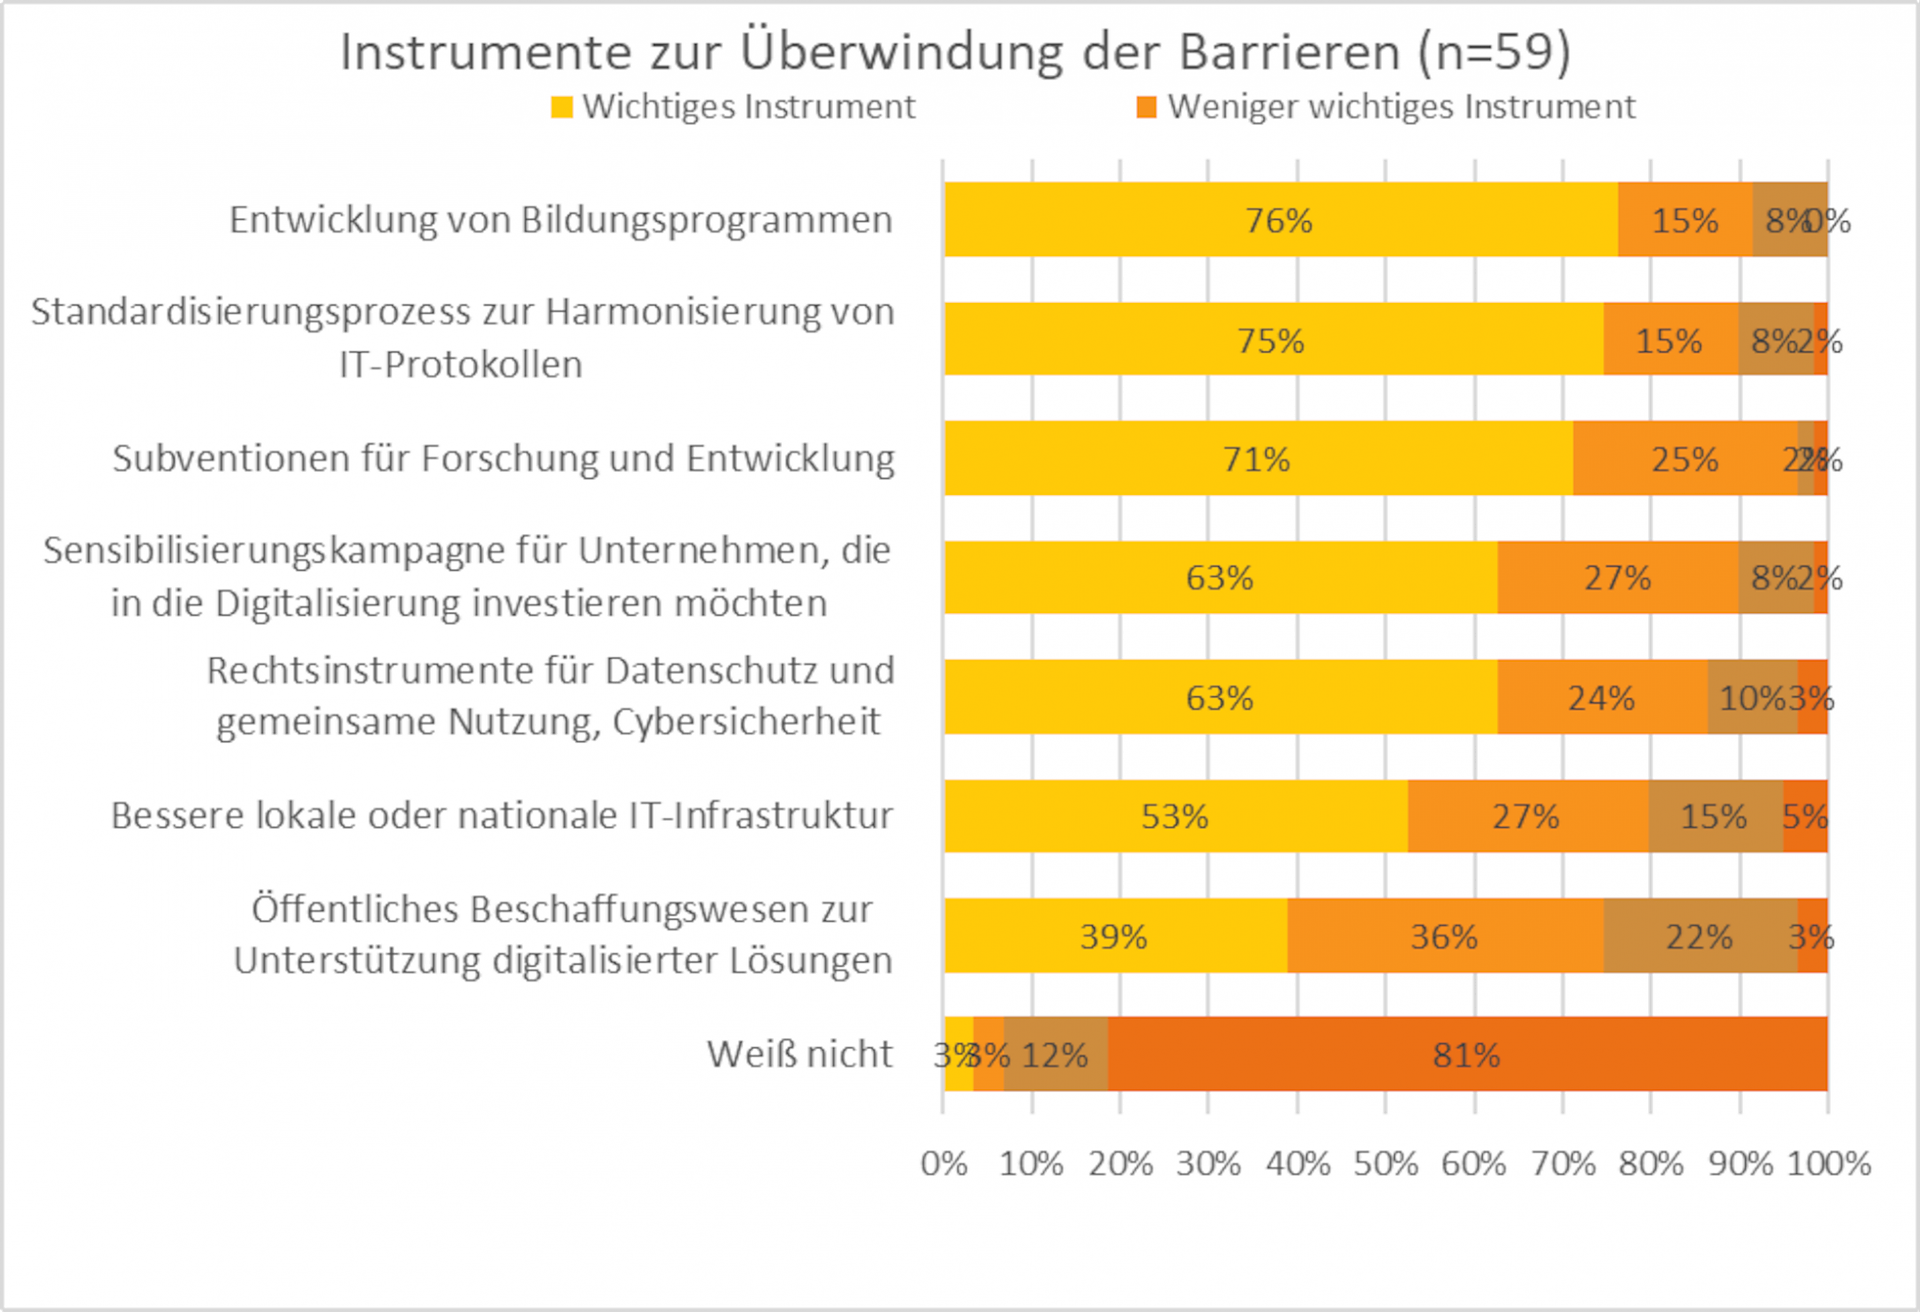
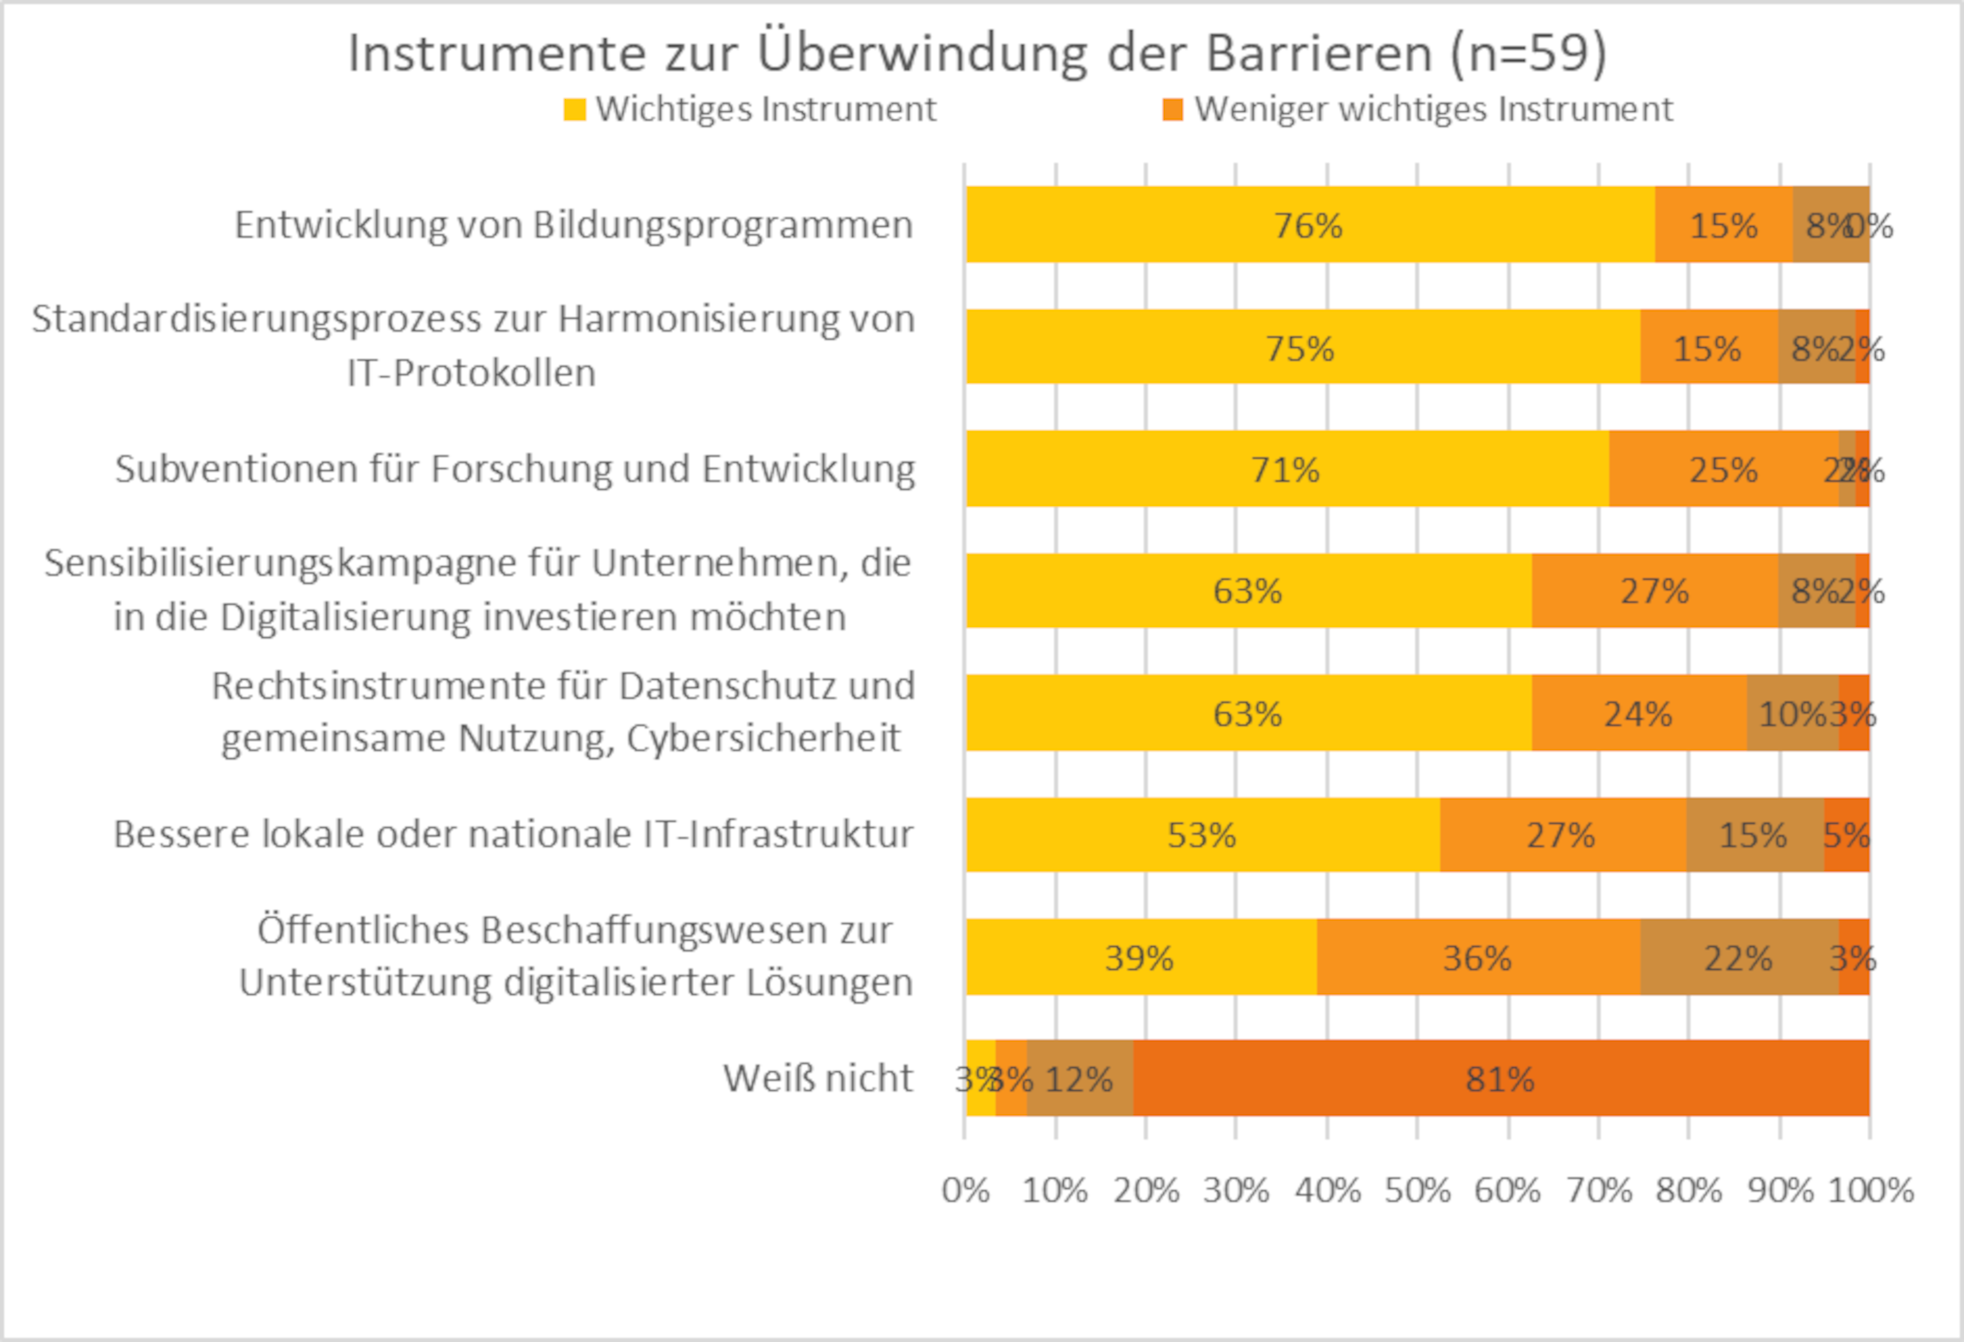
Important instruments to overcome barriers to using digital production technologies
Around three quarters of the respondents consider the development of education programmes and the standardisation process to harmonise protocols, as well as subsidies for research as important policy instruments to overcome these barriers.
Copyright: Österreichische Energieagentur
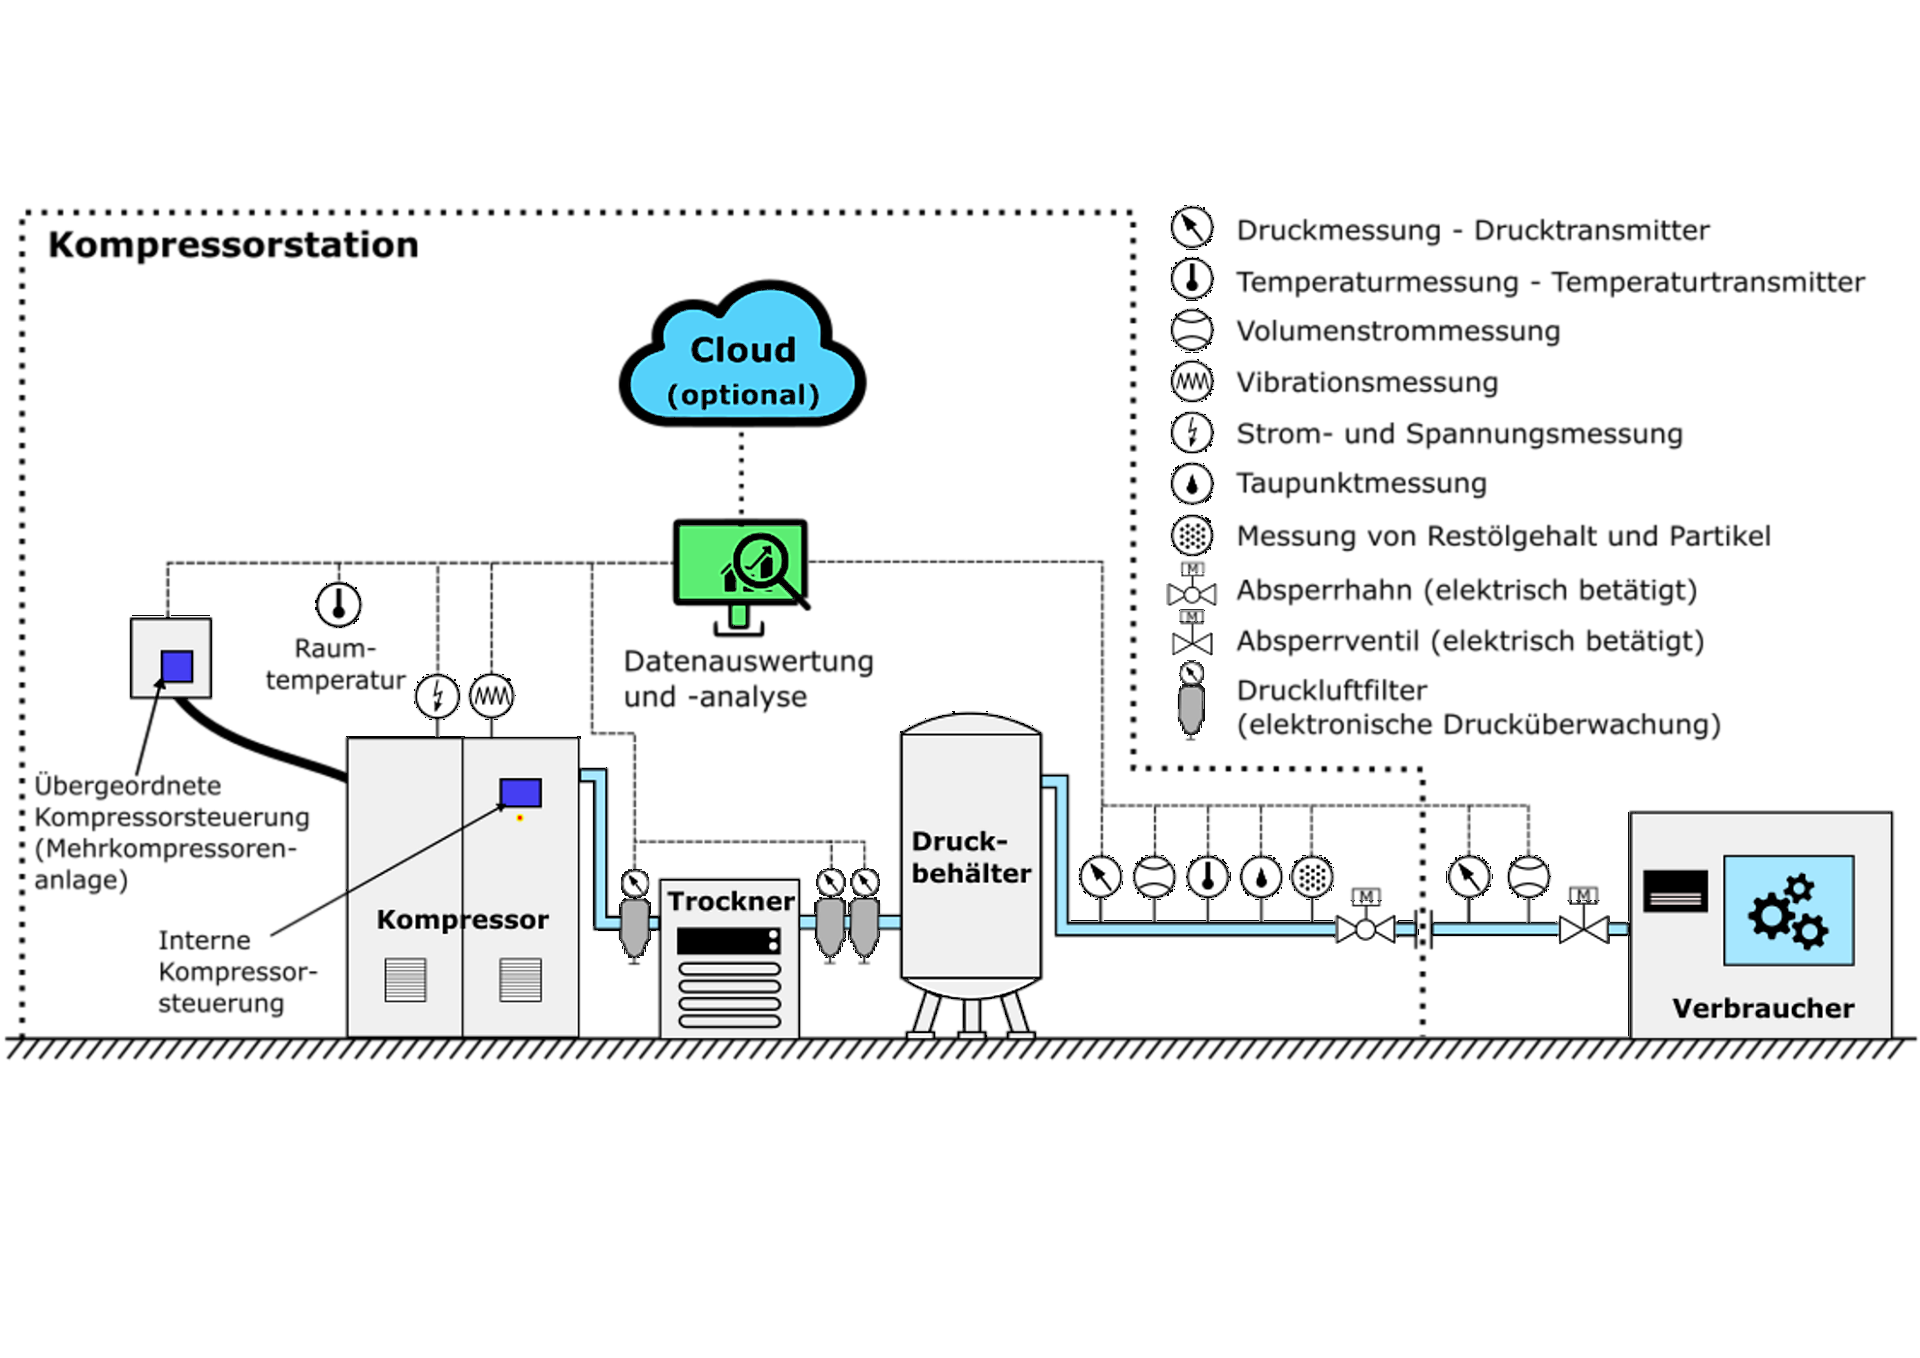
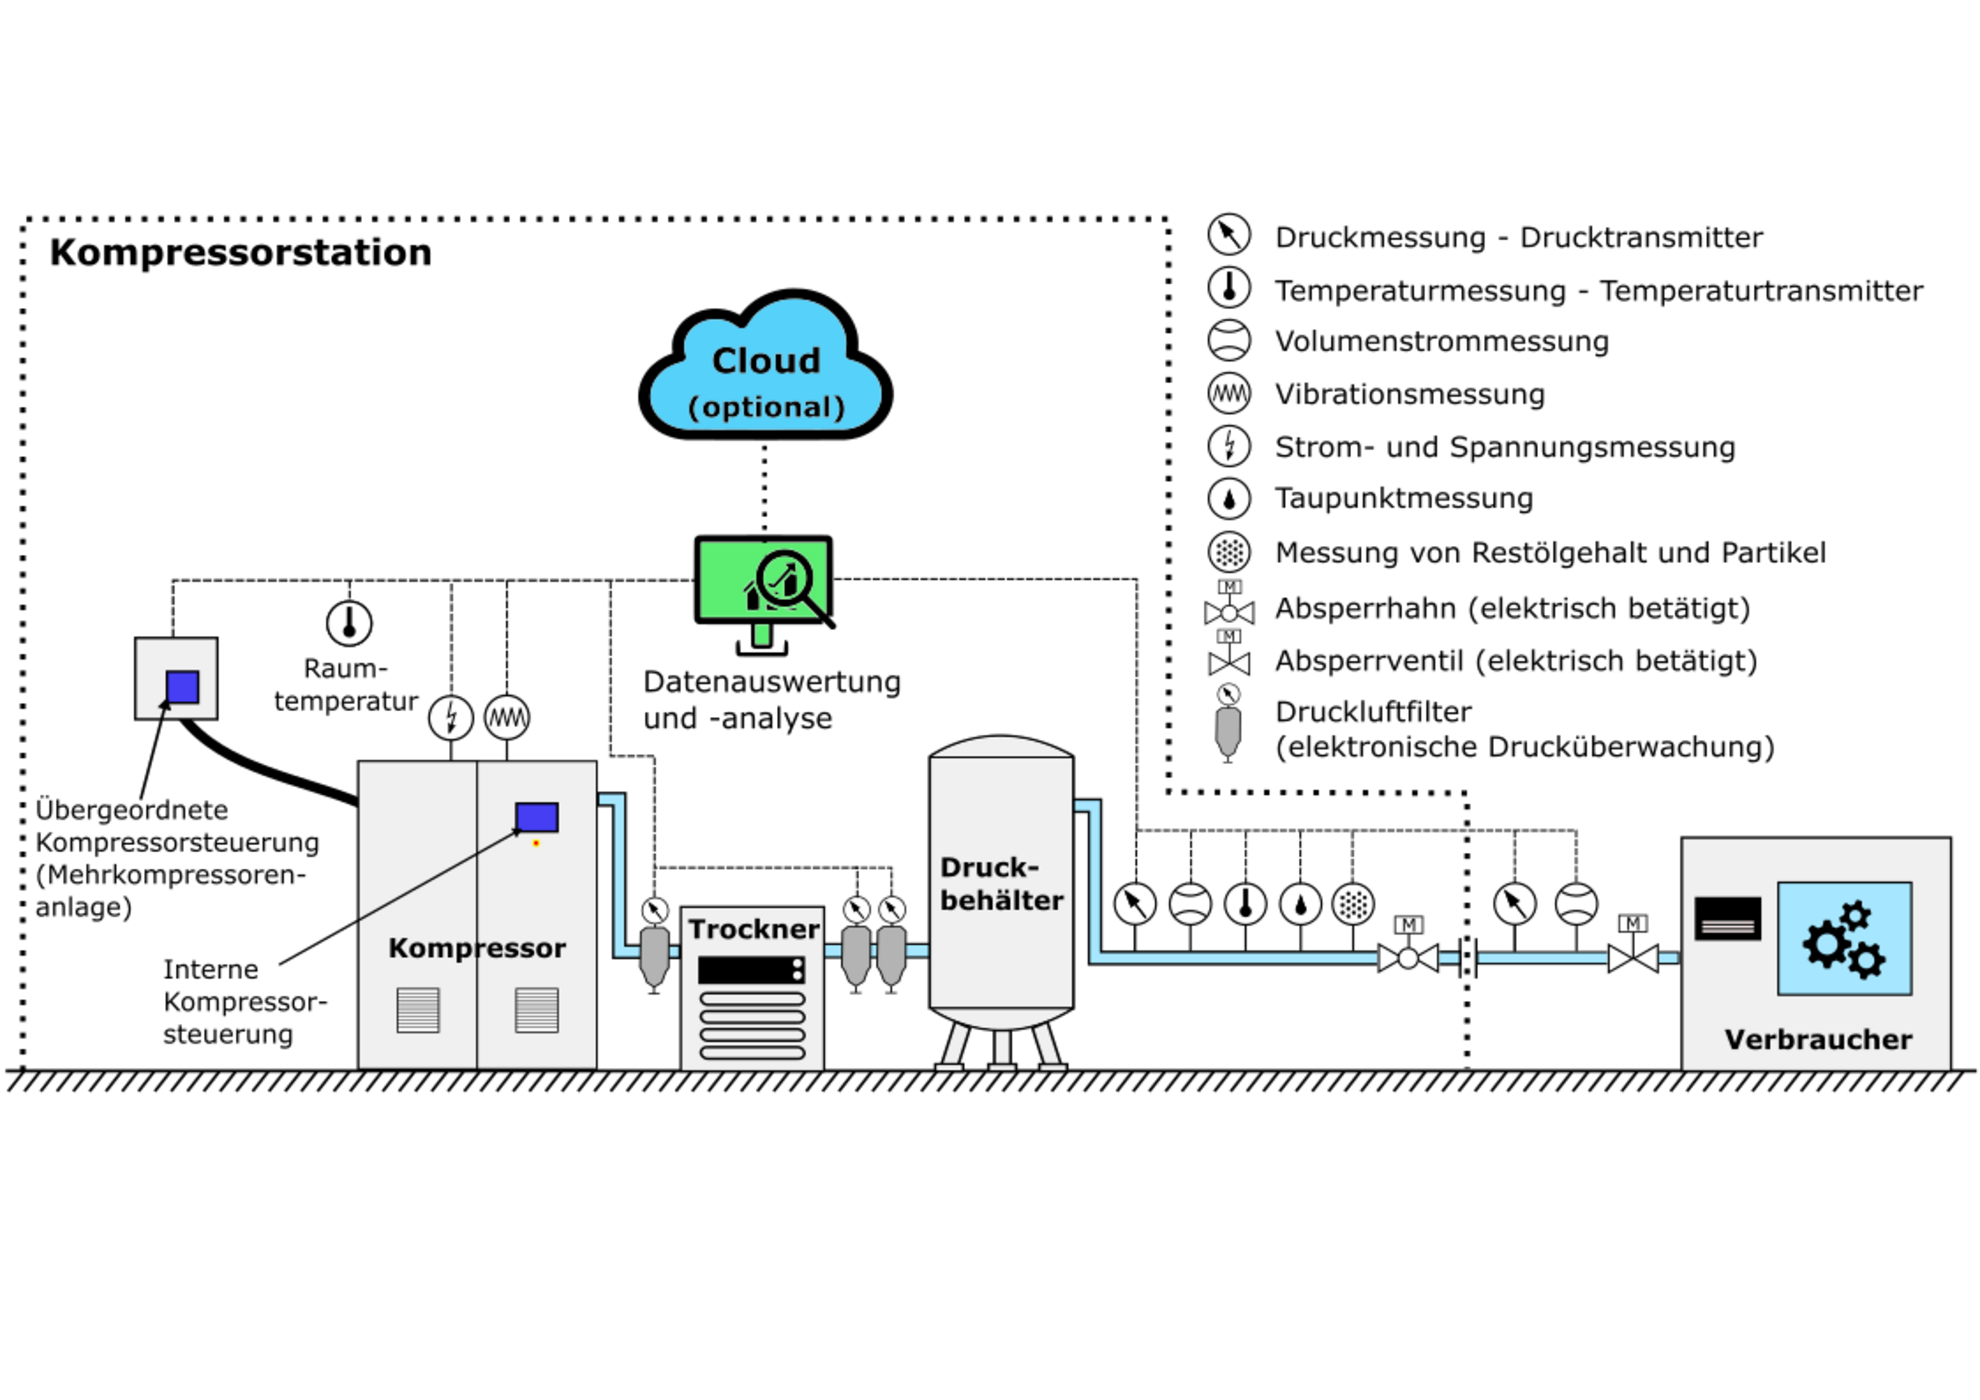
Overview of possible measuring points for the digitalization of compressed air systems
The diagram shows a compressor in the form of a larger square. Virbration measurement and current and voltage measurement are added here as small circles. There is a small rectangle on the square with the note: Internal compressor control. There is also a thick connection to another rectangle for higher-level control. Nearby is a small circle for the room temperature. A line comes out of the compressor to a compressed air filter with electronic pressure monitoring and on to a larger rectangle, the dryer. After two more compressed air filters, the line runs to the pressure tank, a larger oval with three feet. The line continues out of the pressure tank. The small circles with the designations for pressure measurement, volume flow measurement, temperature measurement, wobble point measurement and measurement for residual oil content and particles are then shown here one after the other, and an electrically operated stopcock is also drawn in. A dotted line in the form of a rectangle is drawn around these components for the compressor station. The pipe runs further out of this rectangle. Pressure measurement and volume flow measurement as well as an electrically operated shut-off valve are also drawn. At the end of the line, another rectangle is drawn with the label: Consumer. Within the dotted rectangle above the components mentioned are two symbols, one in the form of a computer screen labeled: Data evaluation and analysis, above it a blue cloud labeled: Cloud (optional). All the measurements mentioned are connected to the data evaluation via a dotted line.
Copyright: Österreichische Energieagentur
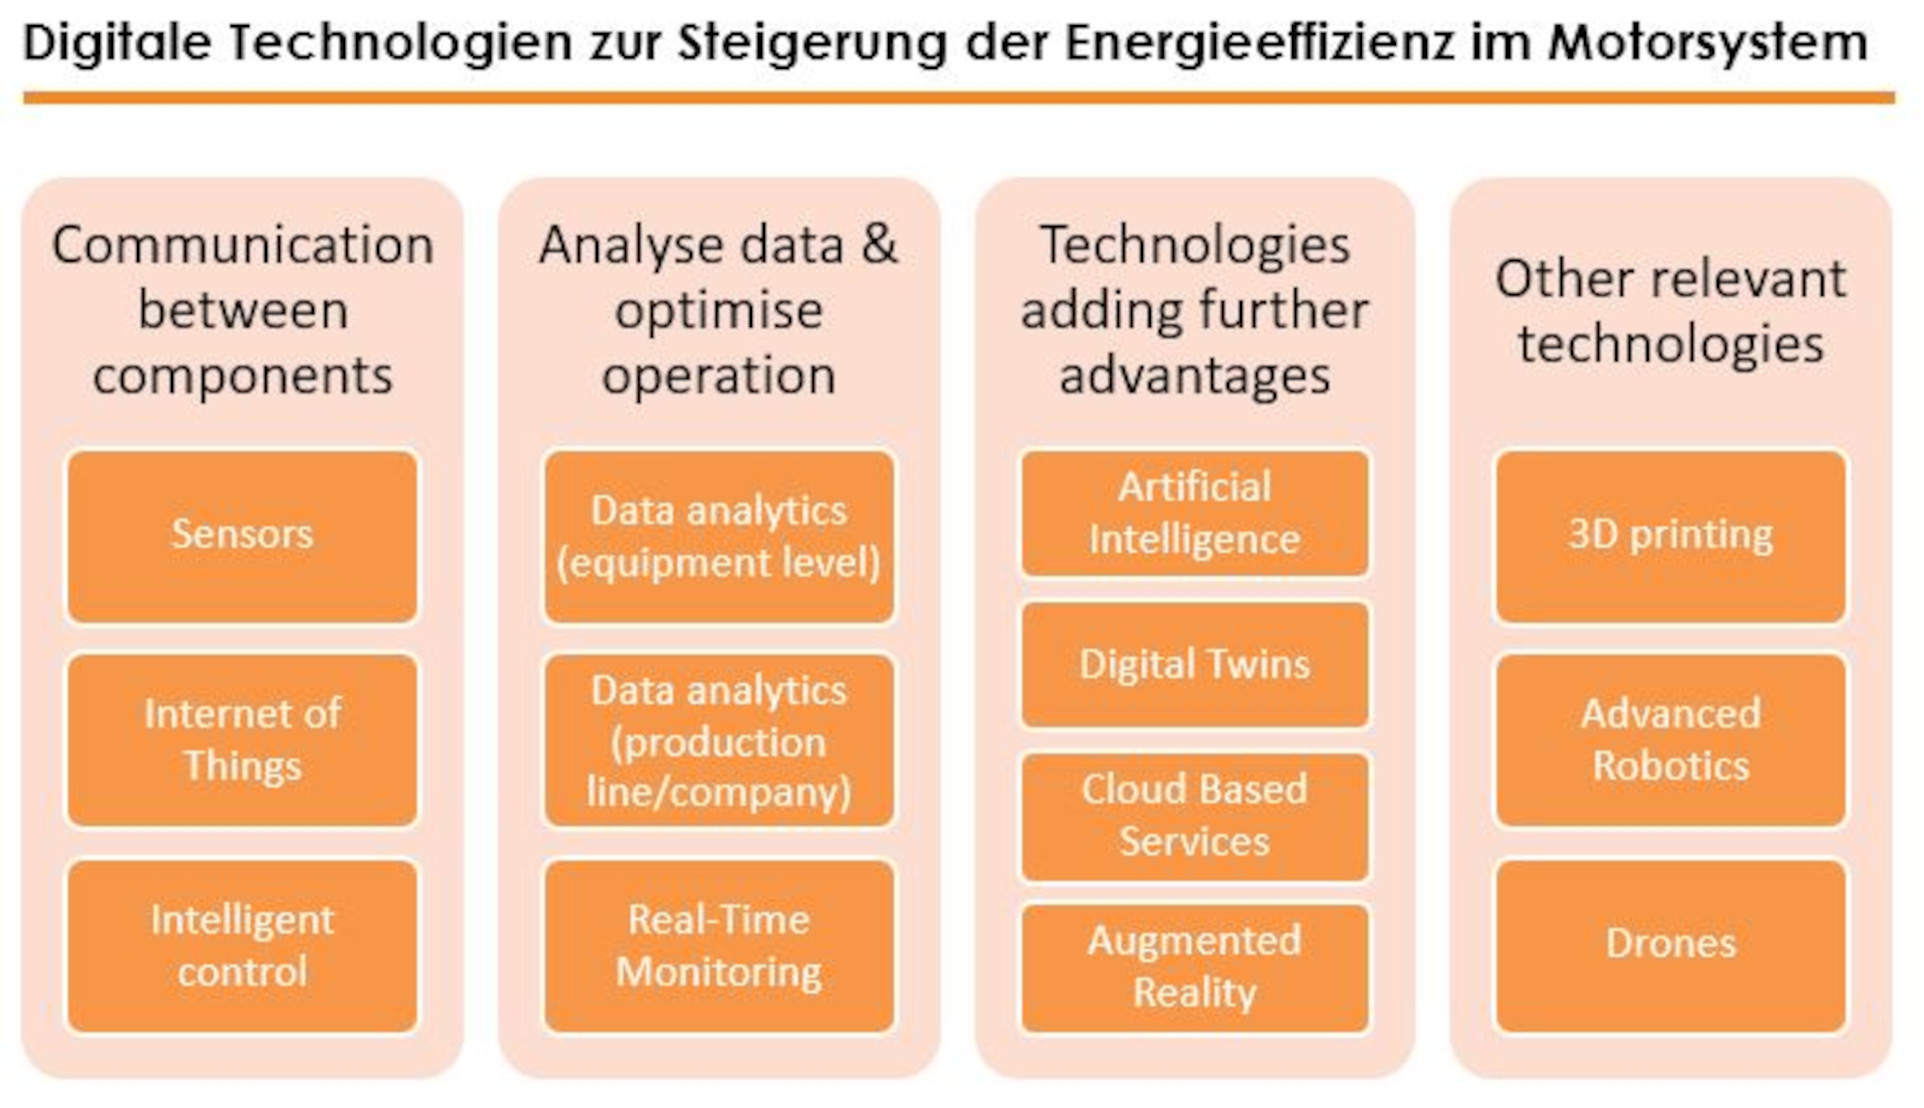
Digital Technologies to Increase the Energyefficiency in Electric Motor Systems
The figure gives an overview of the technologies that were identified as relevant for energy efficiency in electric motor systems in several workshops, in the survey and interviews. Starting on the left-hand side of this picture technologies listed are smart sensors, advanced control on the level of machines and the Internet of things enabling communication between the different levels and components (in dark blue). Furthermore, the next level is the use of possibilities to analyse data and optimize operation (in green): data analytics on both the level of motor systems and on the level of production lines or even the whole company. Continuous monitoring of the different appliances is also significant. Technologies adding advantages to these applications (in grey) are digital twins, cloud-based services and artificial intelligence. Augmented reality can help to implement the suggested measures. Three technologies that are not directly related to the optimization of motor driven systems, but are of further interest include drones, 3D printing and advanced robotics (in dark blue at the right side of Figure 1). Starting on the left-hand side in Figure 1, technologies listed are smart sensors, advanced control on the level of machines and the Internet of things enabling communication between the different levels and components (in dark blue). Furthermore, the next level is the use of possibilities to analyse data and optimize operation (in green): data analytics on both the level of motor systems and on the level of production lines or even the whole company. Continuous monitoring of the different appliances is also significant. Technologies adding advantages to these applications (in grey) are digital twins, cloud-based services and artificial intelligence. Augmented reality can help to implement the suggested measures. Three technologies that are not directly related to the optimization of motor driven systems, but are of further interest include drones, 3D printing and advanced robotics (in dark blue at the right side of Figure 1).
Copyright: Österreichische Energieagentur, impact energy

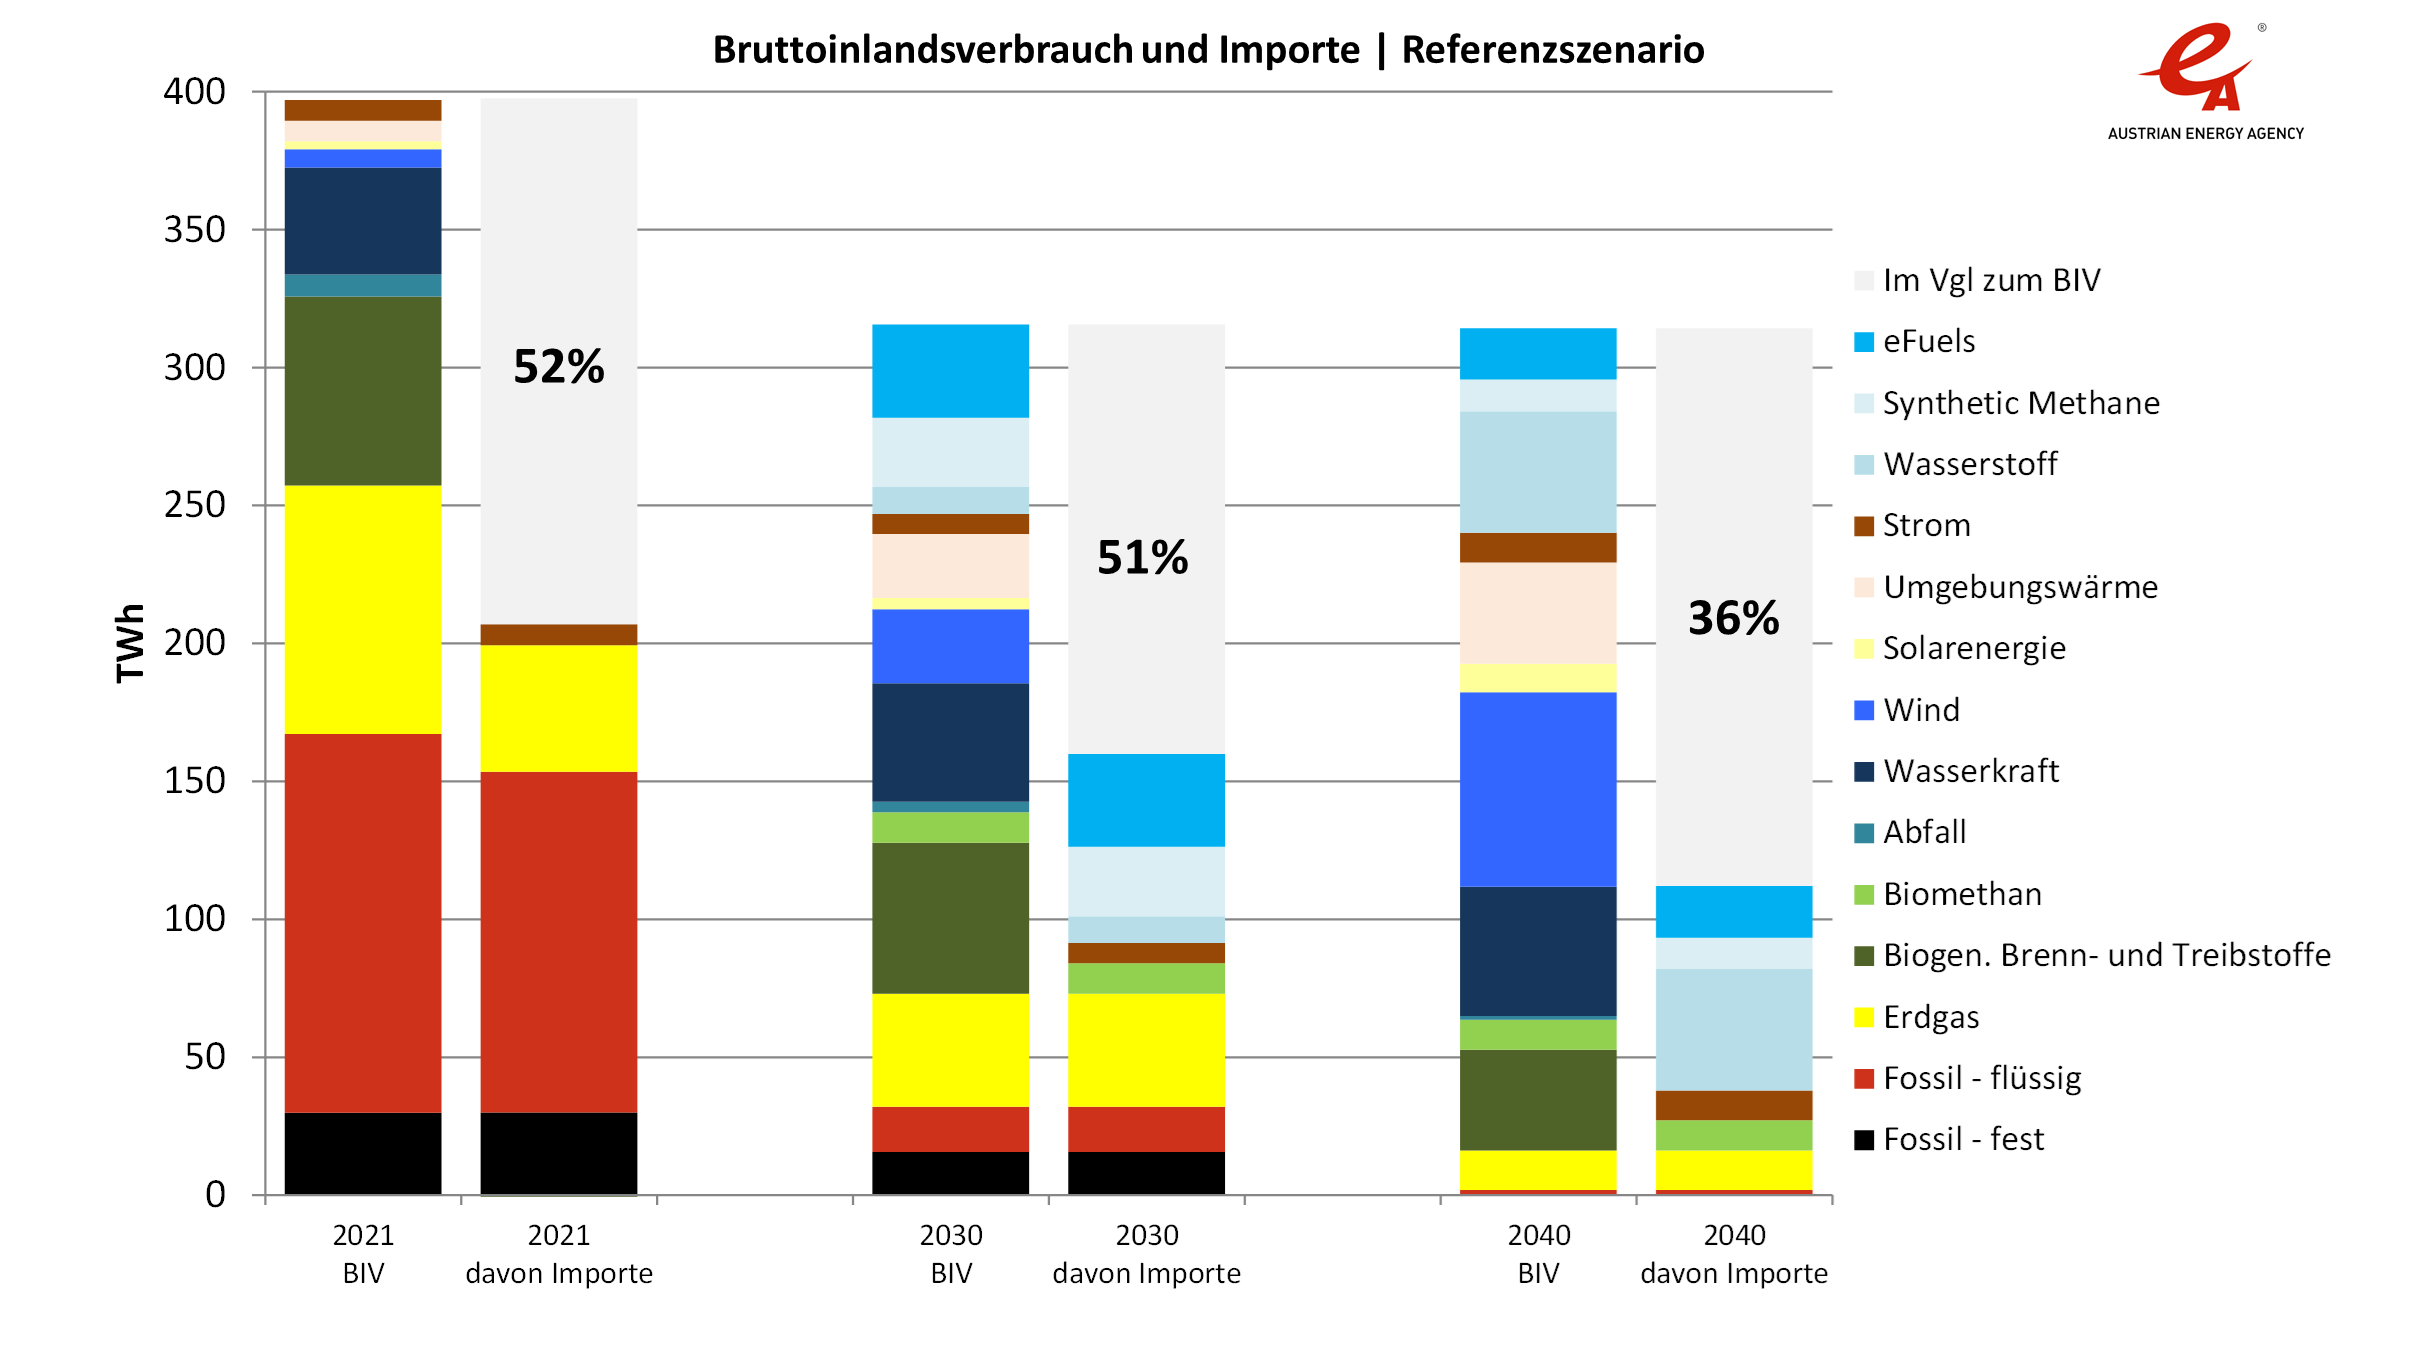
Gross domestic consumption in the reference scenario
The figure shows the gross domestic consumption of the individual energy sources in 2021, 2030 and 2040 in the Reference scenario. The quantitative description of the figure can be found in the report in section 5.4.1 in the text for Figure 9.
Copyright: Martin Baumann/Österreichische Energieagentur

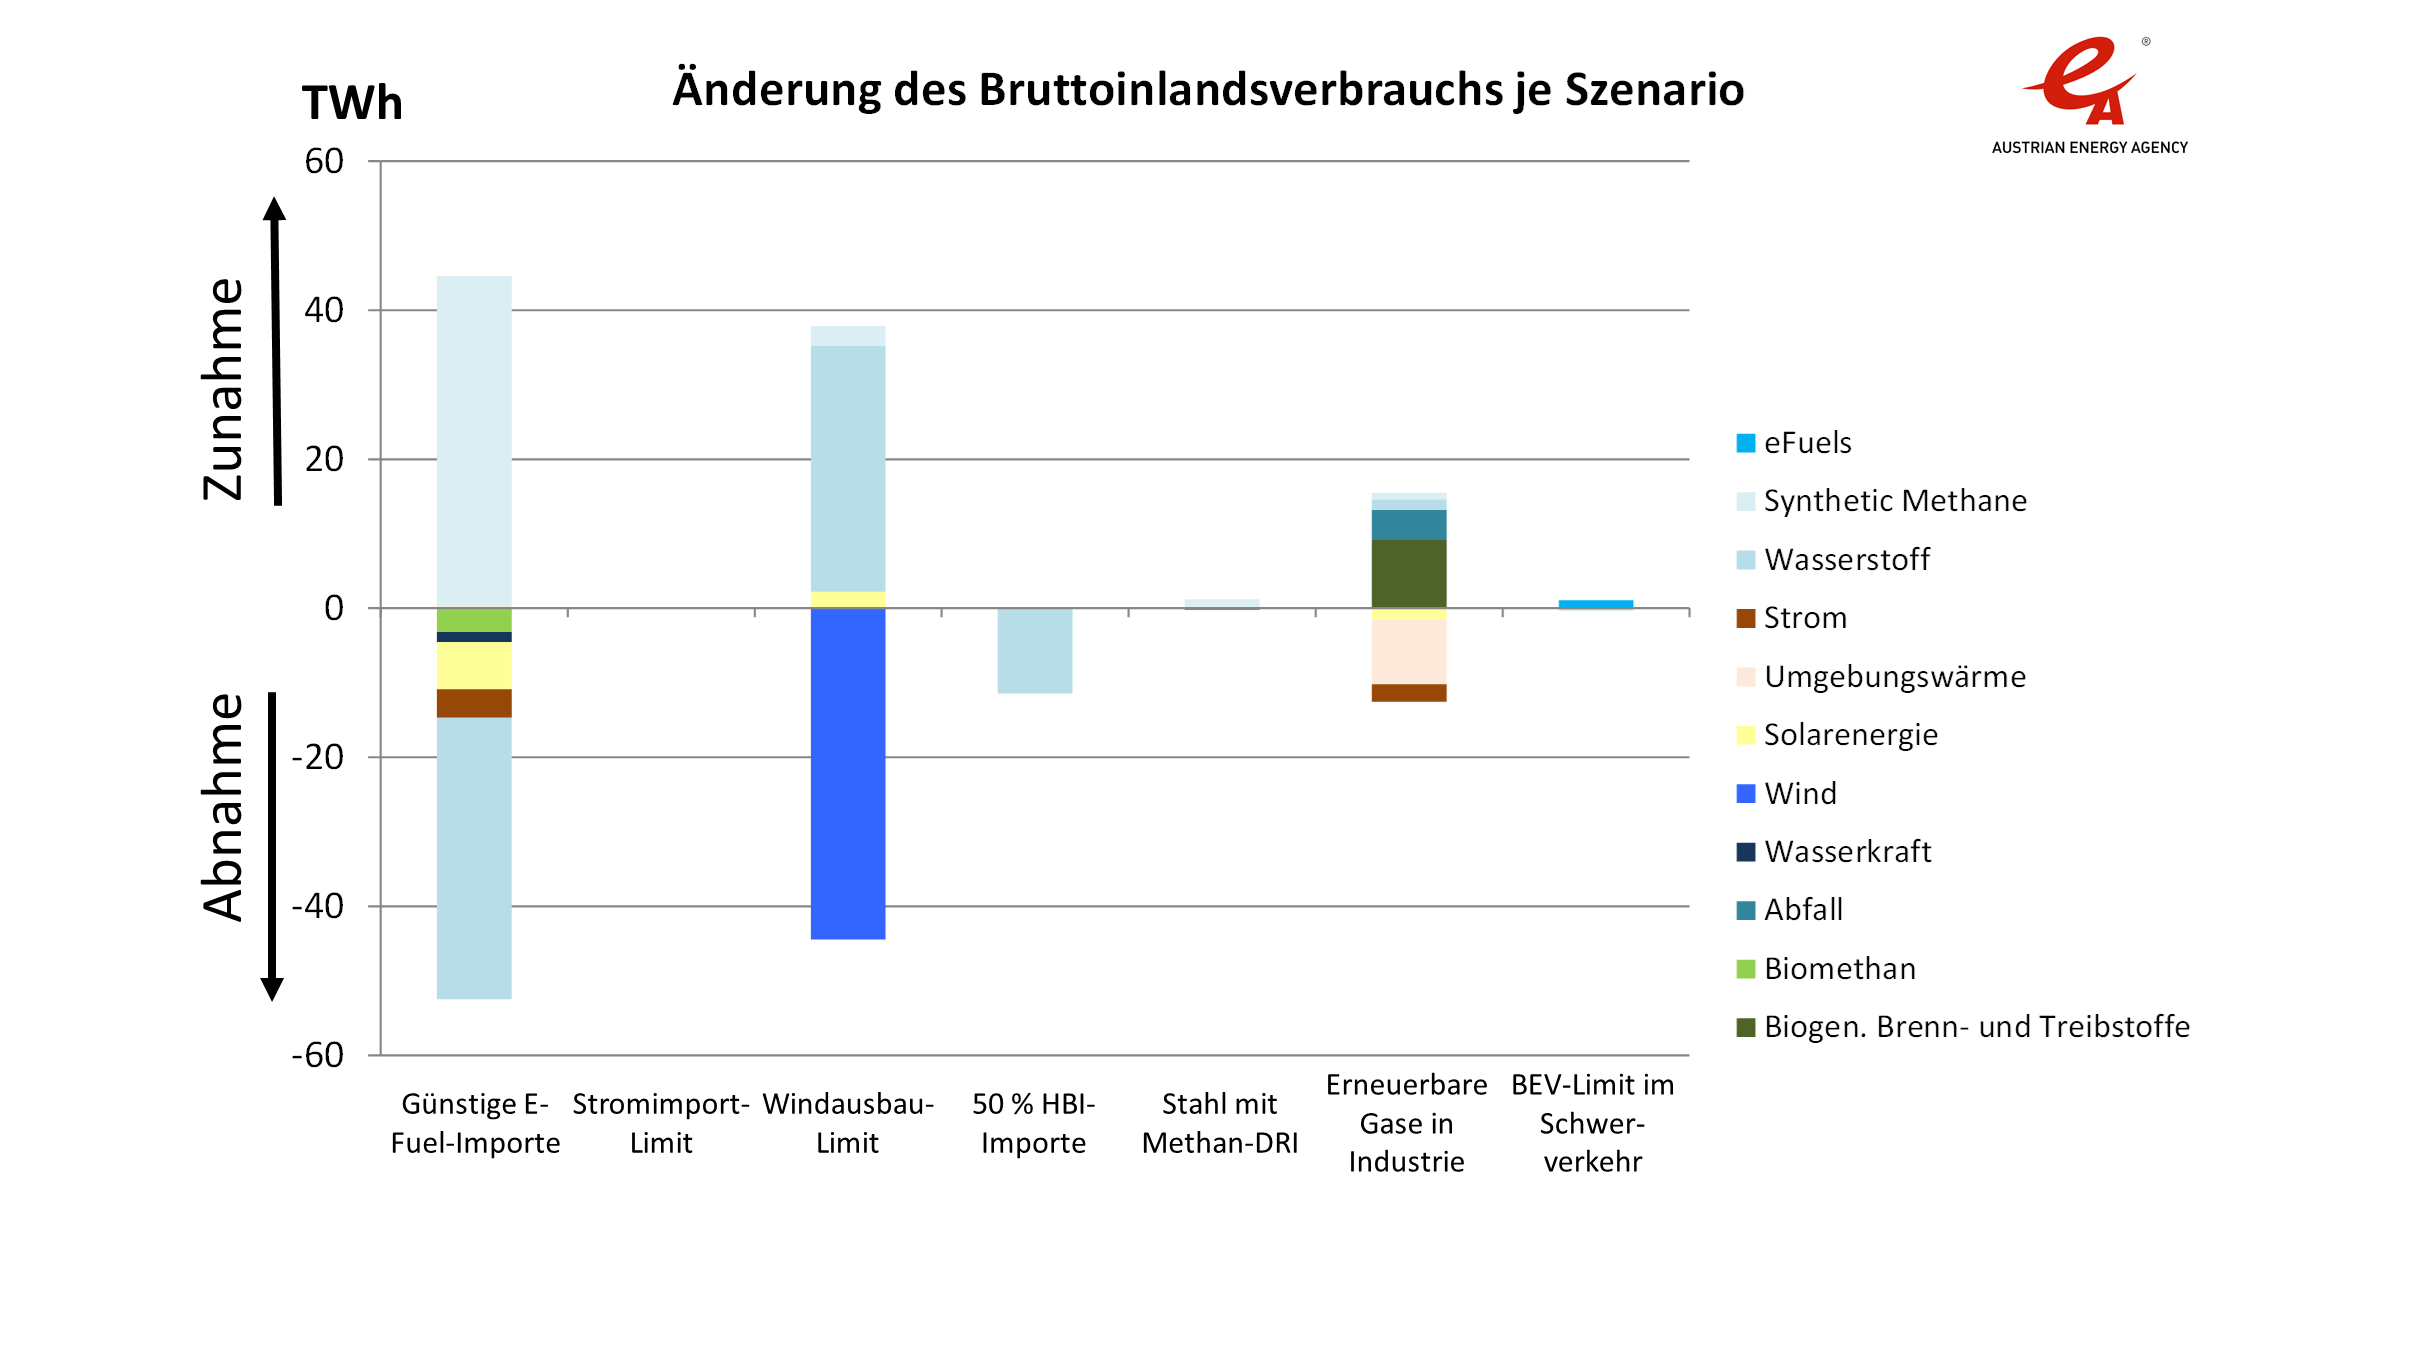
Change in gross domestic consumption in 2040 in the scenario variants
The figure shows the change in gross domestic consumption of the individual energy sources in 2040 due to the variation in scenario assumptions. The quantitative description of the figure can be found in the report in Section 5.4.2 in the text for Figure 15.
Copyright: Martin Baumann/Österreichische Energieagentur
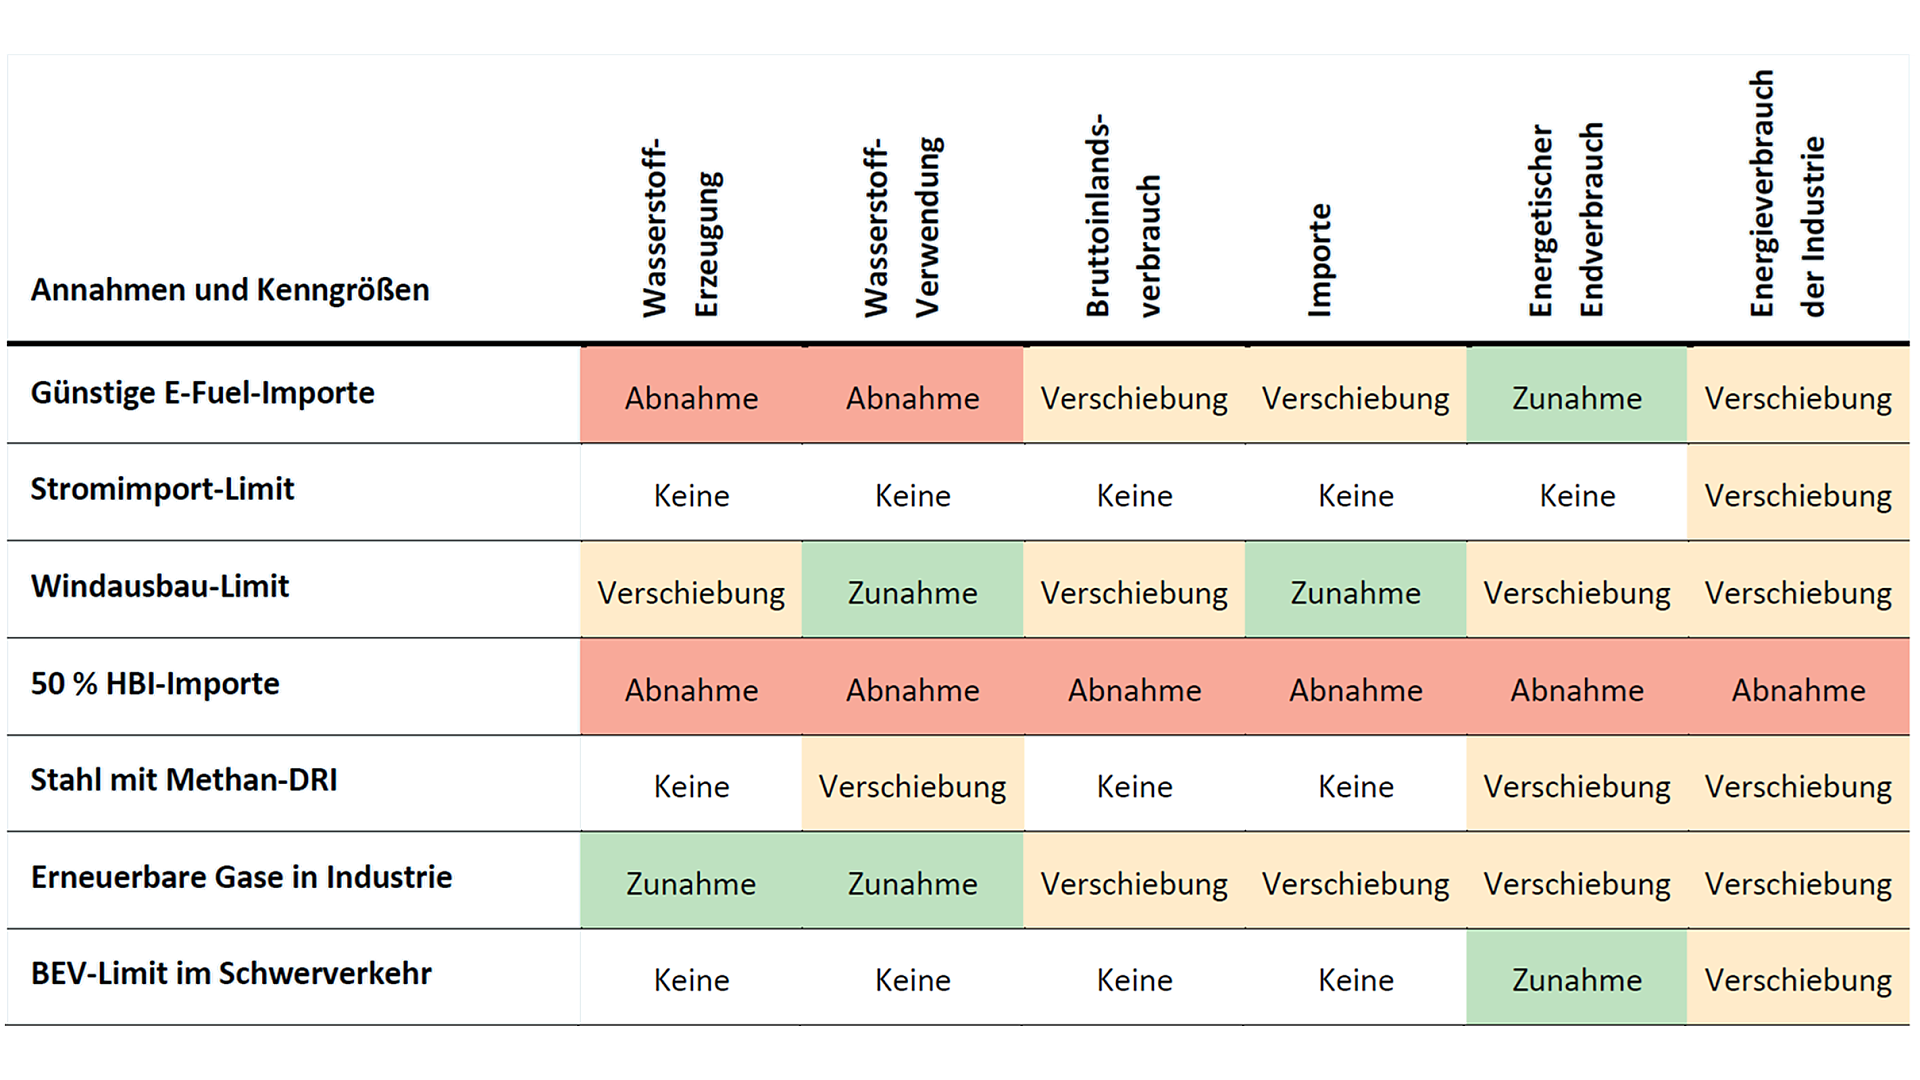
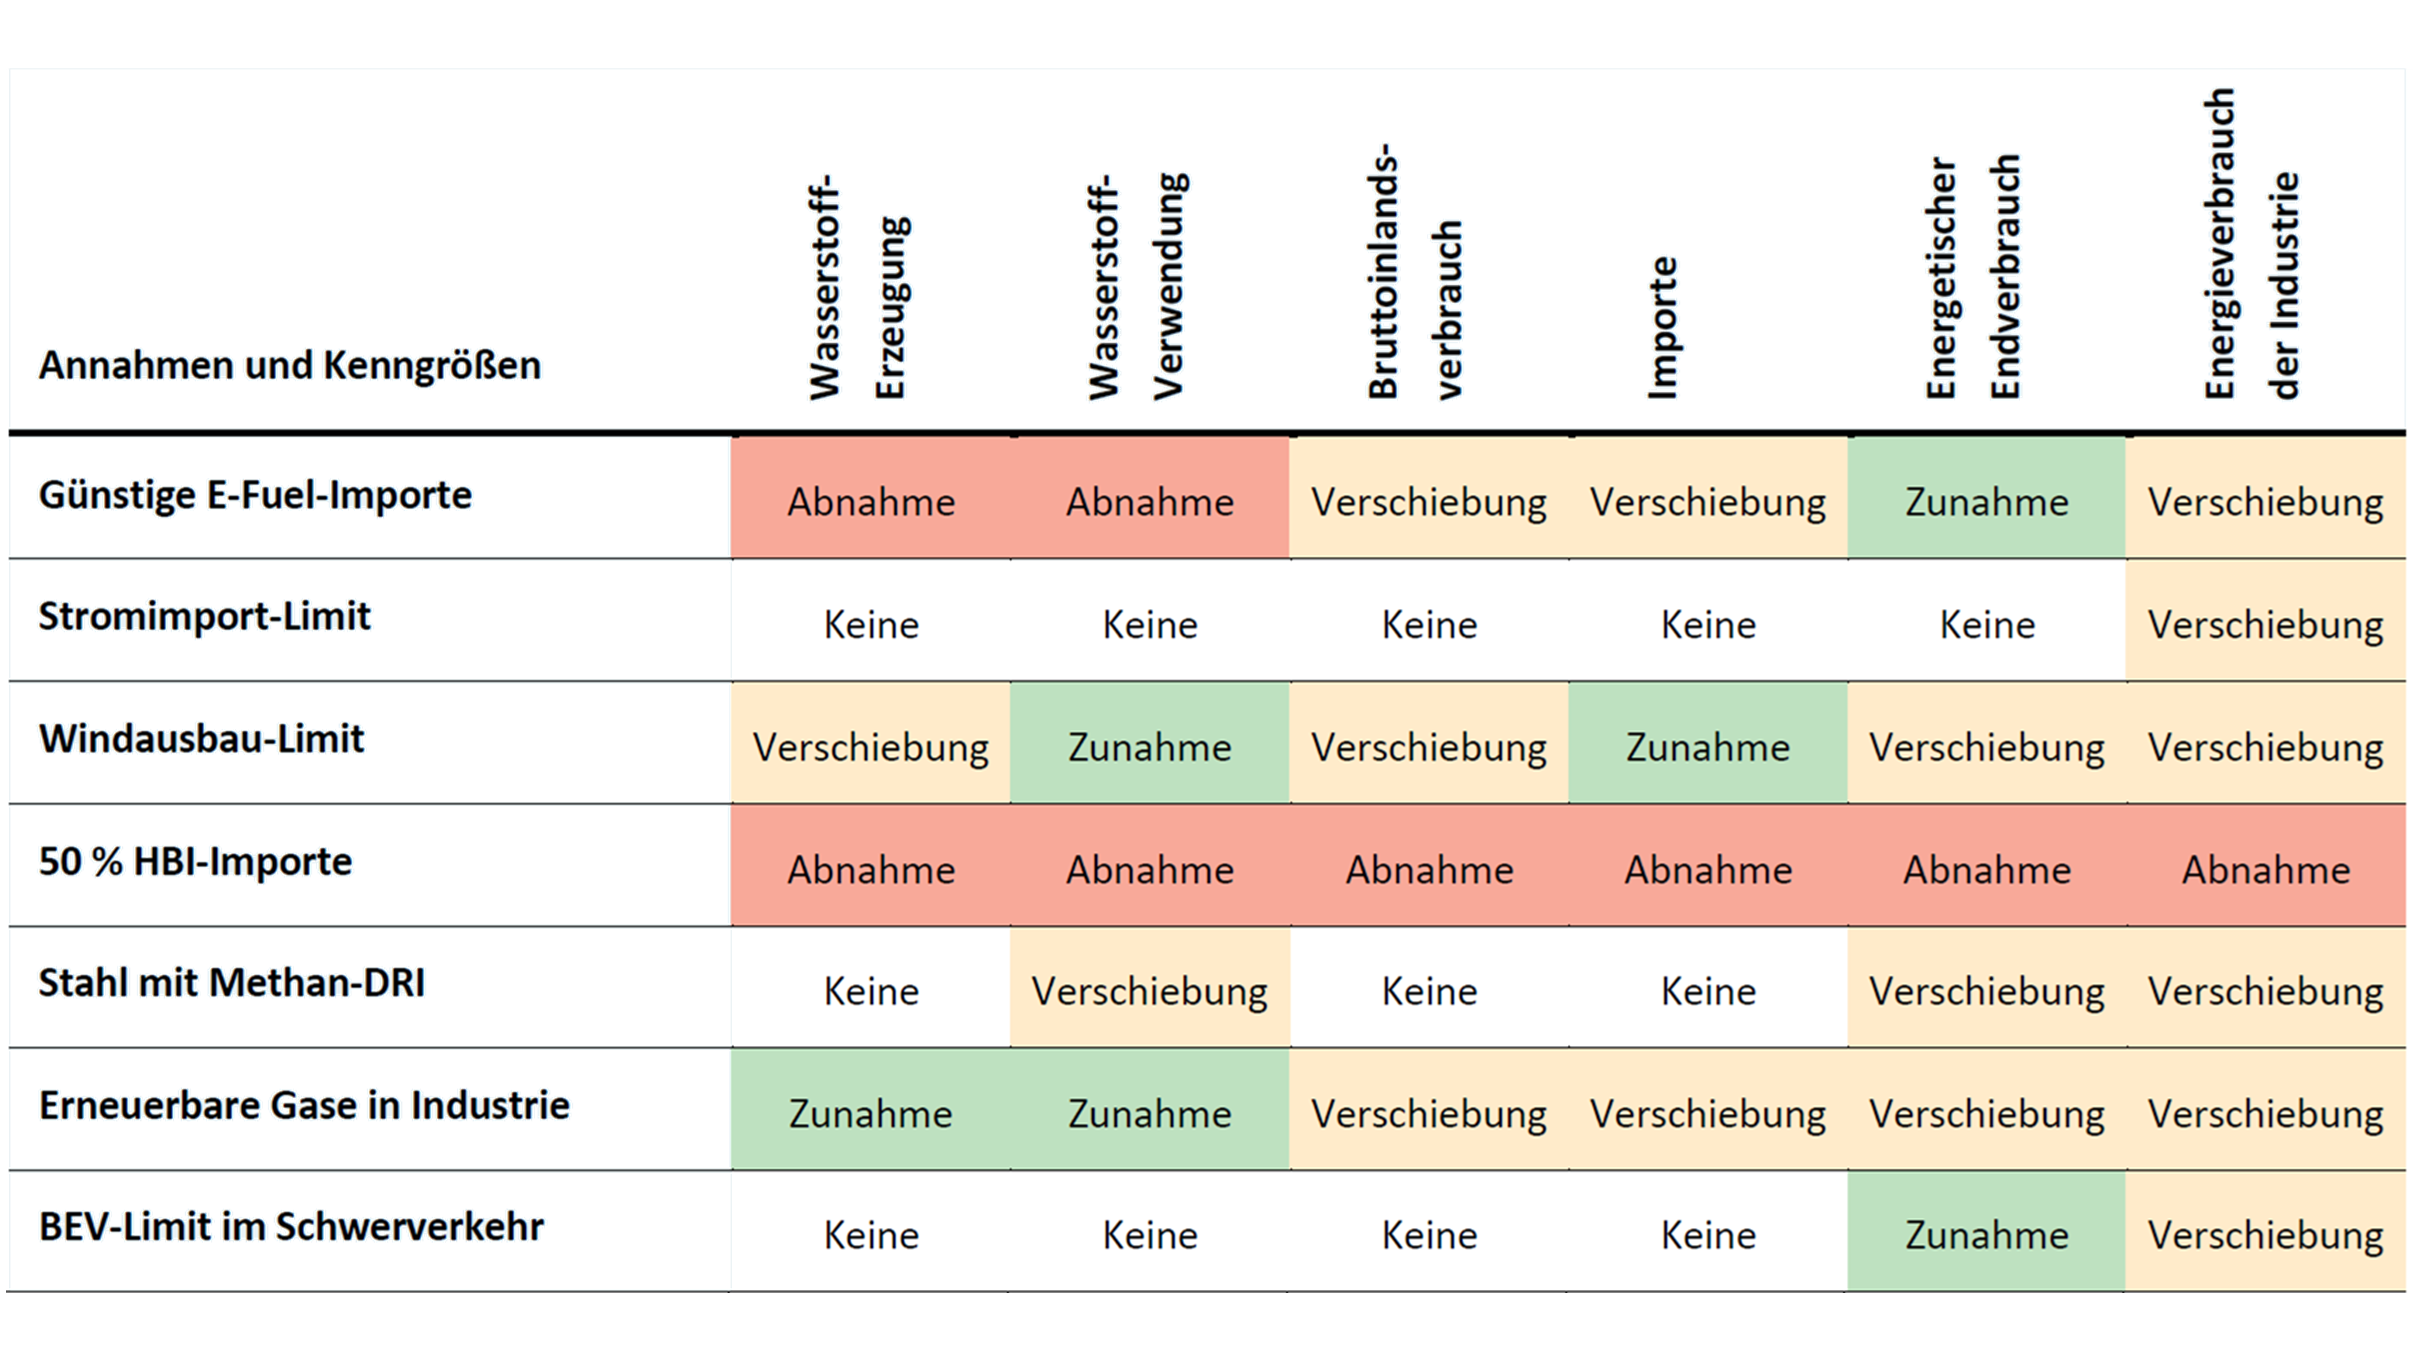
Qualitative effects of varying the scenario assumptions on selected scenario results
The figure shows the qualitative effects of varying the scenario assumptions on selected scenario results in a table. The quantitative description of the figure can be found in the report in Section 5.4.3 in Table 20.
Copyright: Martin Baumann/Österreichische Energieagentur
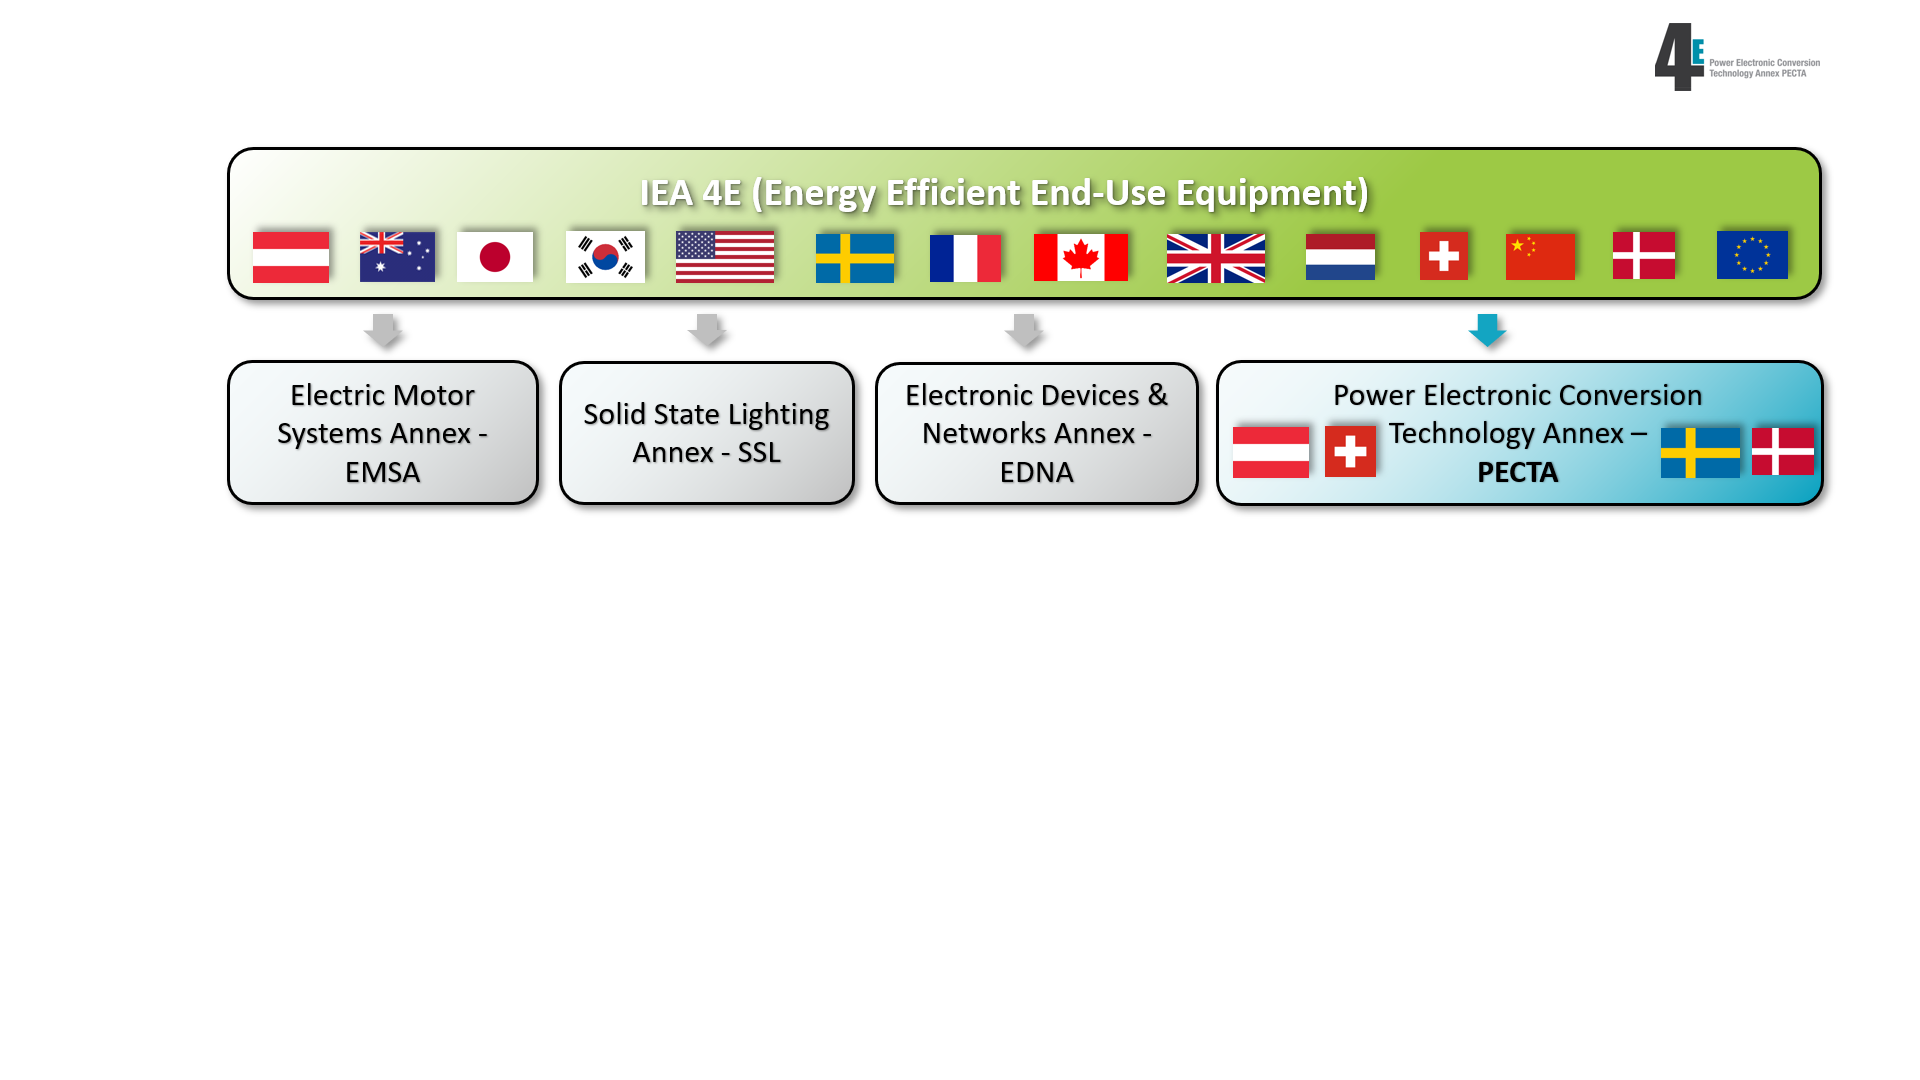
Integration of PECTA within the 4E technology program
Since March 2019, the 4E Technology Program consists of 4 different Annexes: EMSA (Electric Motor Systems Annex), SSL (Solid State Lighting Annex), EDNA (Electronic Devices & Networks Annex) and PECTA (Power Electronic Conversion Technology Annex).
Copyright: 4E PECTA
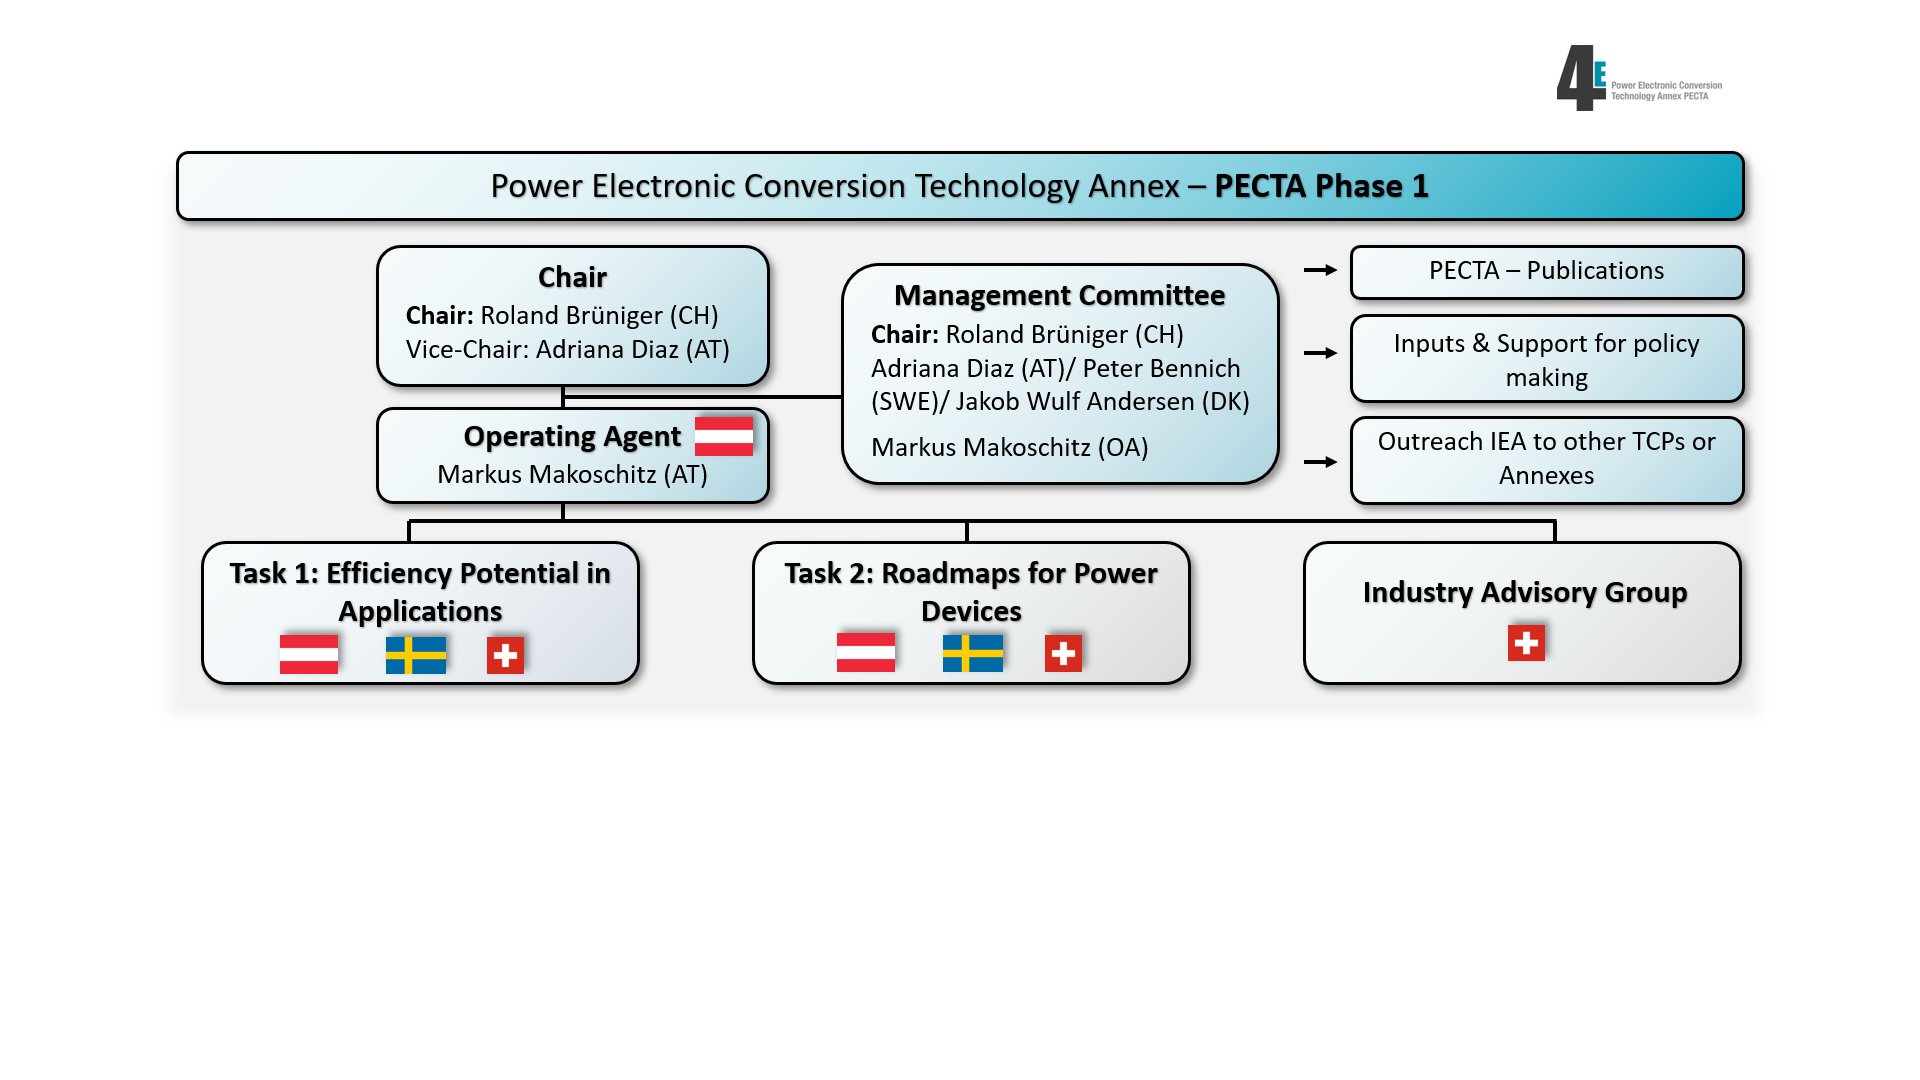
Structure of PECTA during Phase 1
In the course of PECTA's Phase 1, two tasks were processed. Task 1: Efficiency Potential in Applications. Task 2: Roadmaps for Power Devices. The position of the Operating Agent was filled by Austria. Task 1 and Task 2 were carried out with participation from Austria, Sweden and Switzerland. The Industry Advisory Group is coordinated by Switzerland.
Copyright: 4E PECTA
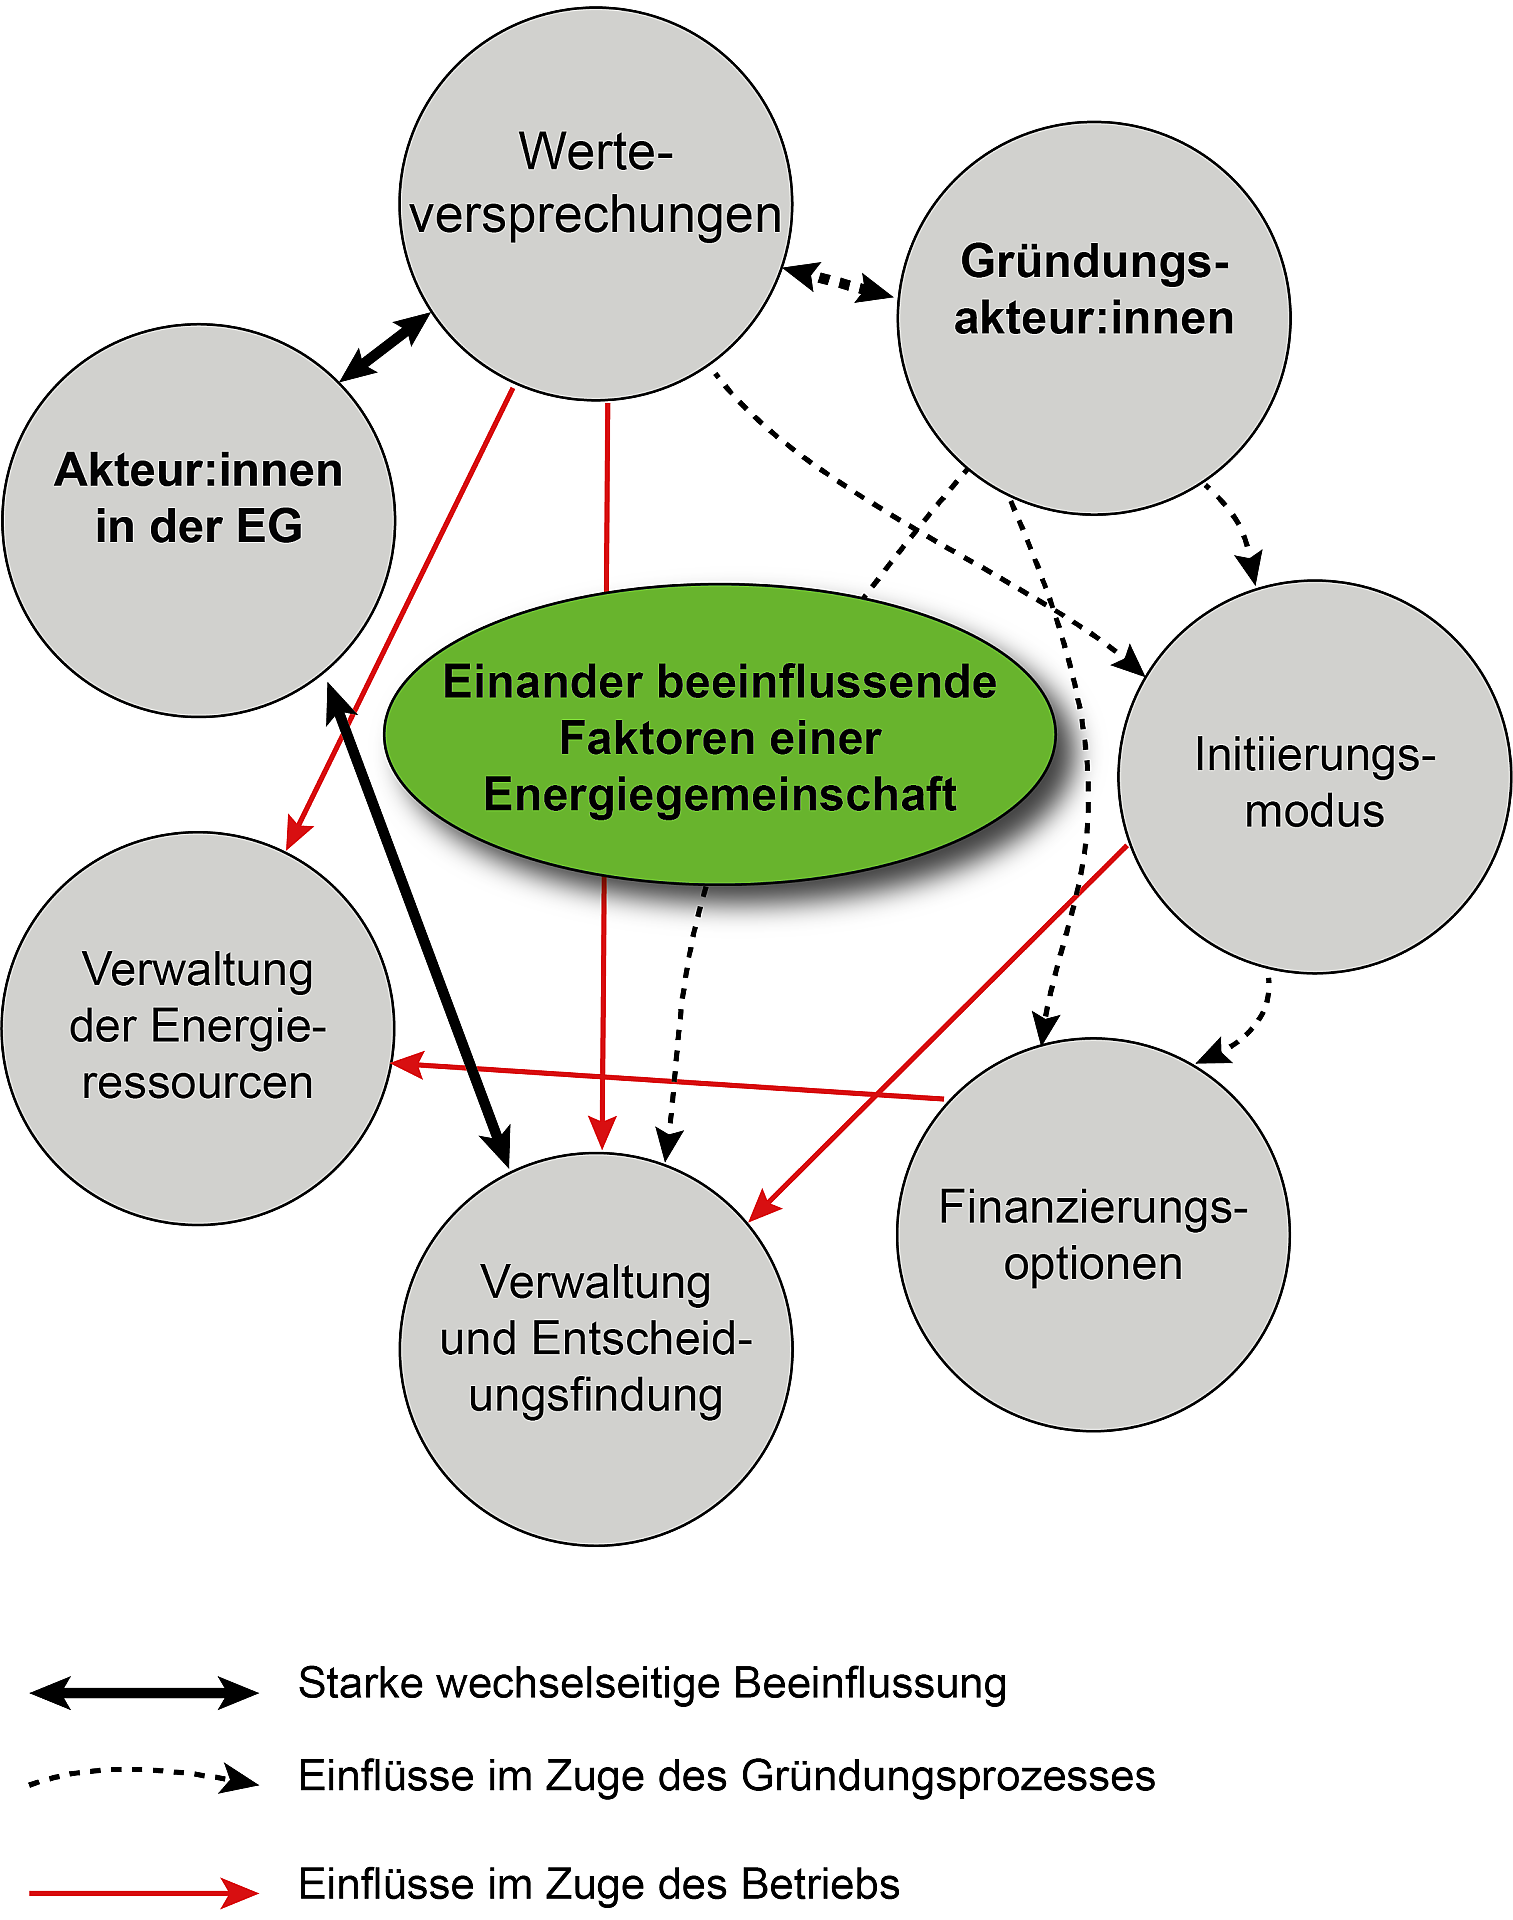
Central Characteristics of Energy Communities and Their Interactions
Representation of the central characteristics of energy communities (ECs) and their interrelationships. A strong mutual influence is found between the actors of the EC and the management and decision-making processes, as well as between the actors and value propositions. Influences during the founding process occur between value propositions and founding actors, value propositions and the initiation mode, and founding actors on the initiation mode, funding options, and management and decision-making. Operational influences include the impact of value propositions on the management of energy resources and general management and decision-making, as well as the influence of the initiation mode on management and decision-making, and of funding options on the management of energy resources.
Copyright: SLA2.0
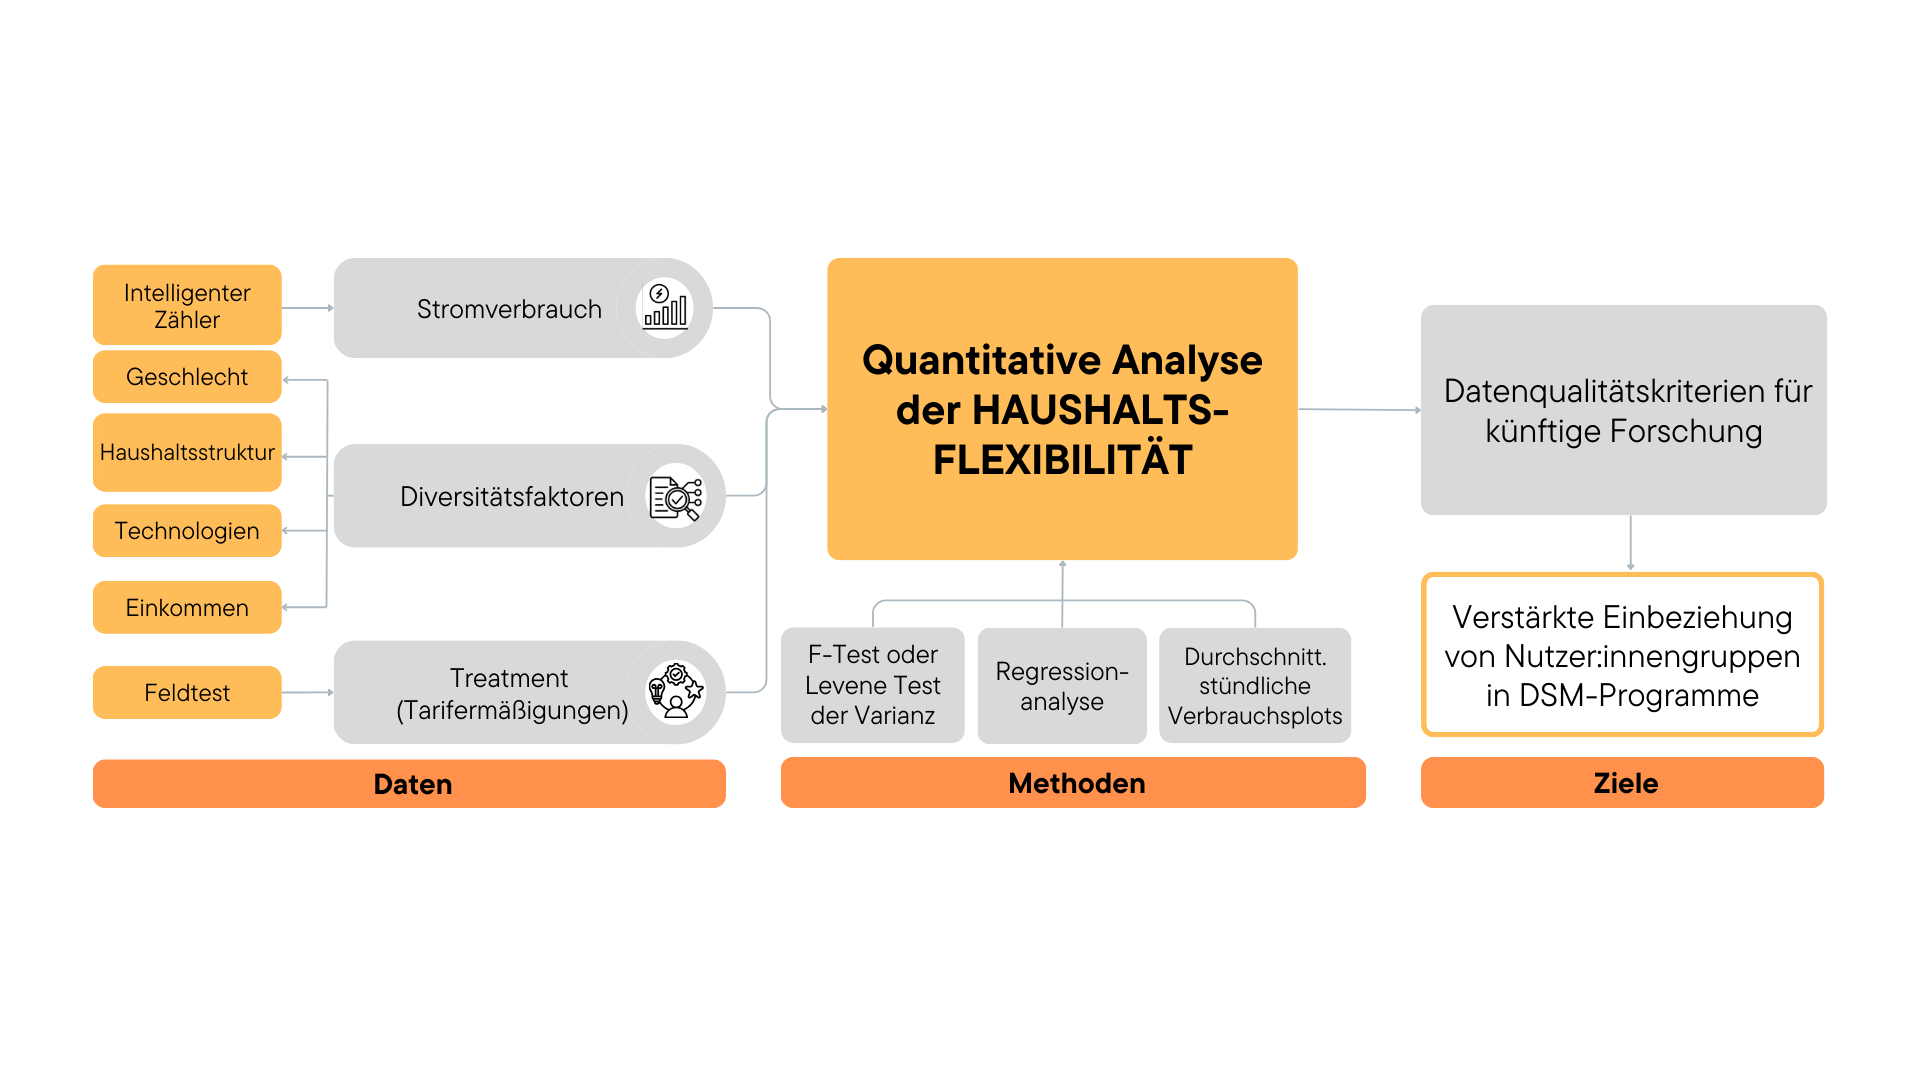
Analysis of Gender and Diversity Factors in Relation to Energy Consumption Flexibility
The graphic provides an overview of the approach to the quantitative analysis of household flexibility and the conclusions derived from it. Electricity consumption, recorded via smart meters, was combined with diversity dimensions and associated aspects such as gender, household structure, income, and available technologies. Treatments implemented during field tests, such as tariff reductions for peak load reductions, were documented in the dataset. Quantitative methods, including F-tests or Levene's test for variance, regression analysis, and plots of average consumption, were used to gain insights into consumption patterns and identify diversity-specific differences. Building on these findings, data quality criteria for future research were formulated, and a stronger inclusion of diverse user groups in demand-side management (DSM) programs was recommended.