Project Image Pool
There are 406 results.
Terms of use: The pictures on this site originate from the projects in the frame of the programmes City of Tomorrow, Building of Tomorrow and the IEA Research Cooperation. They may be used credited for non-commercial purposes under the Creative Commons License Attribution-NonCommercial (CC BY-NC).
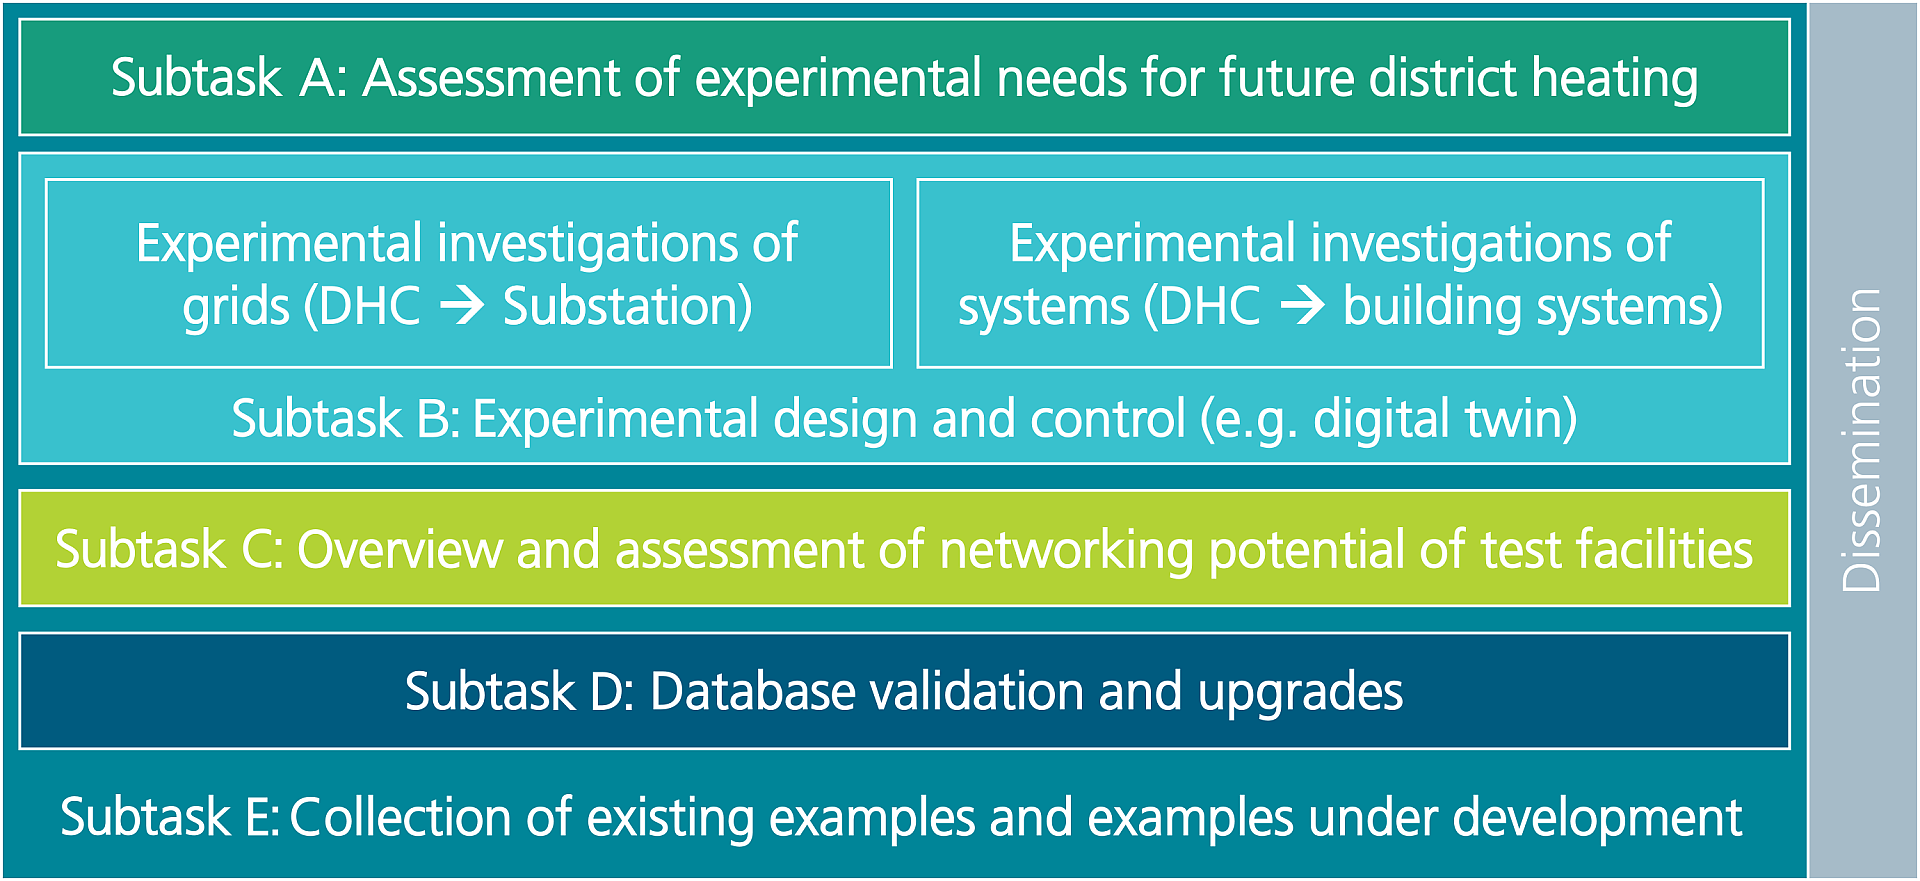
IEA DHC Annex TS8: Overview of subtasks
The international cooperation within the IEA DHC Annex TS8 is structured into 5 work packages (subtasks).
Copyright: IEA DHC Annex TS8
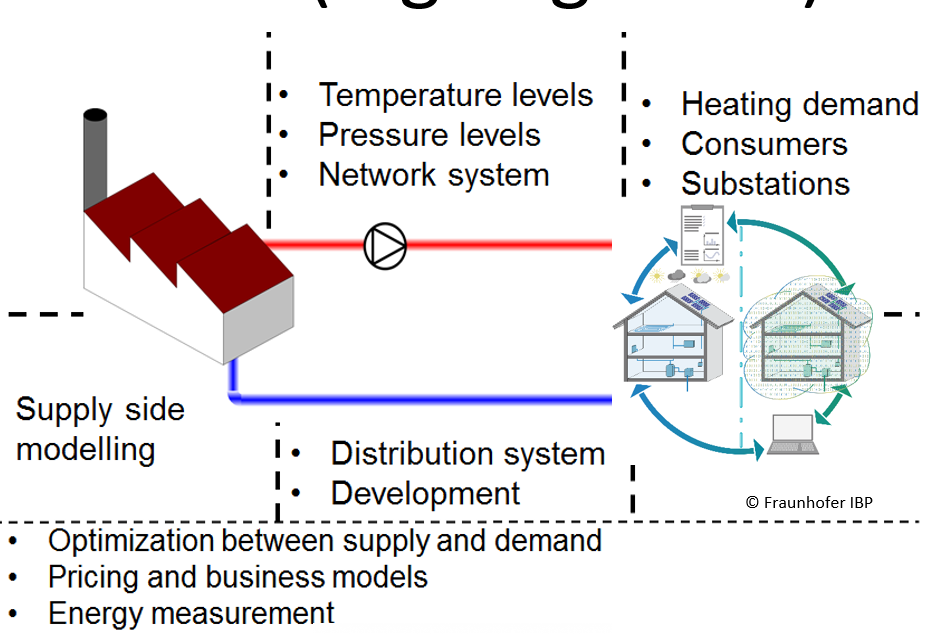
IEA DHC Annex TS8: System boundaries
Overview of the various system boundaries as considered in IEA DHC Annex TS8.
Copyright: IEA DHC Annex TS8
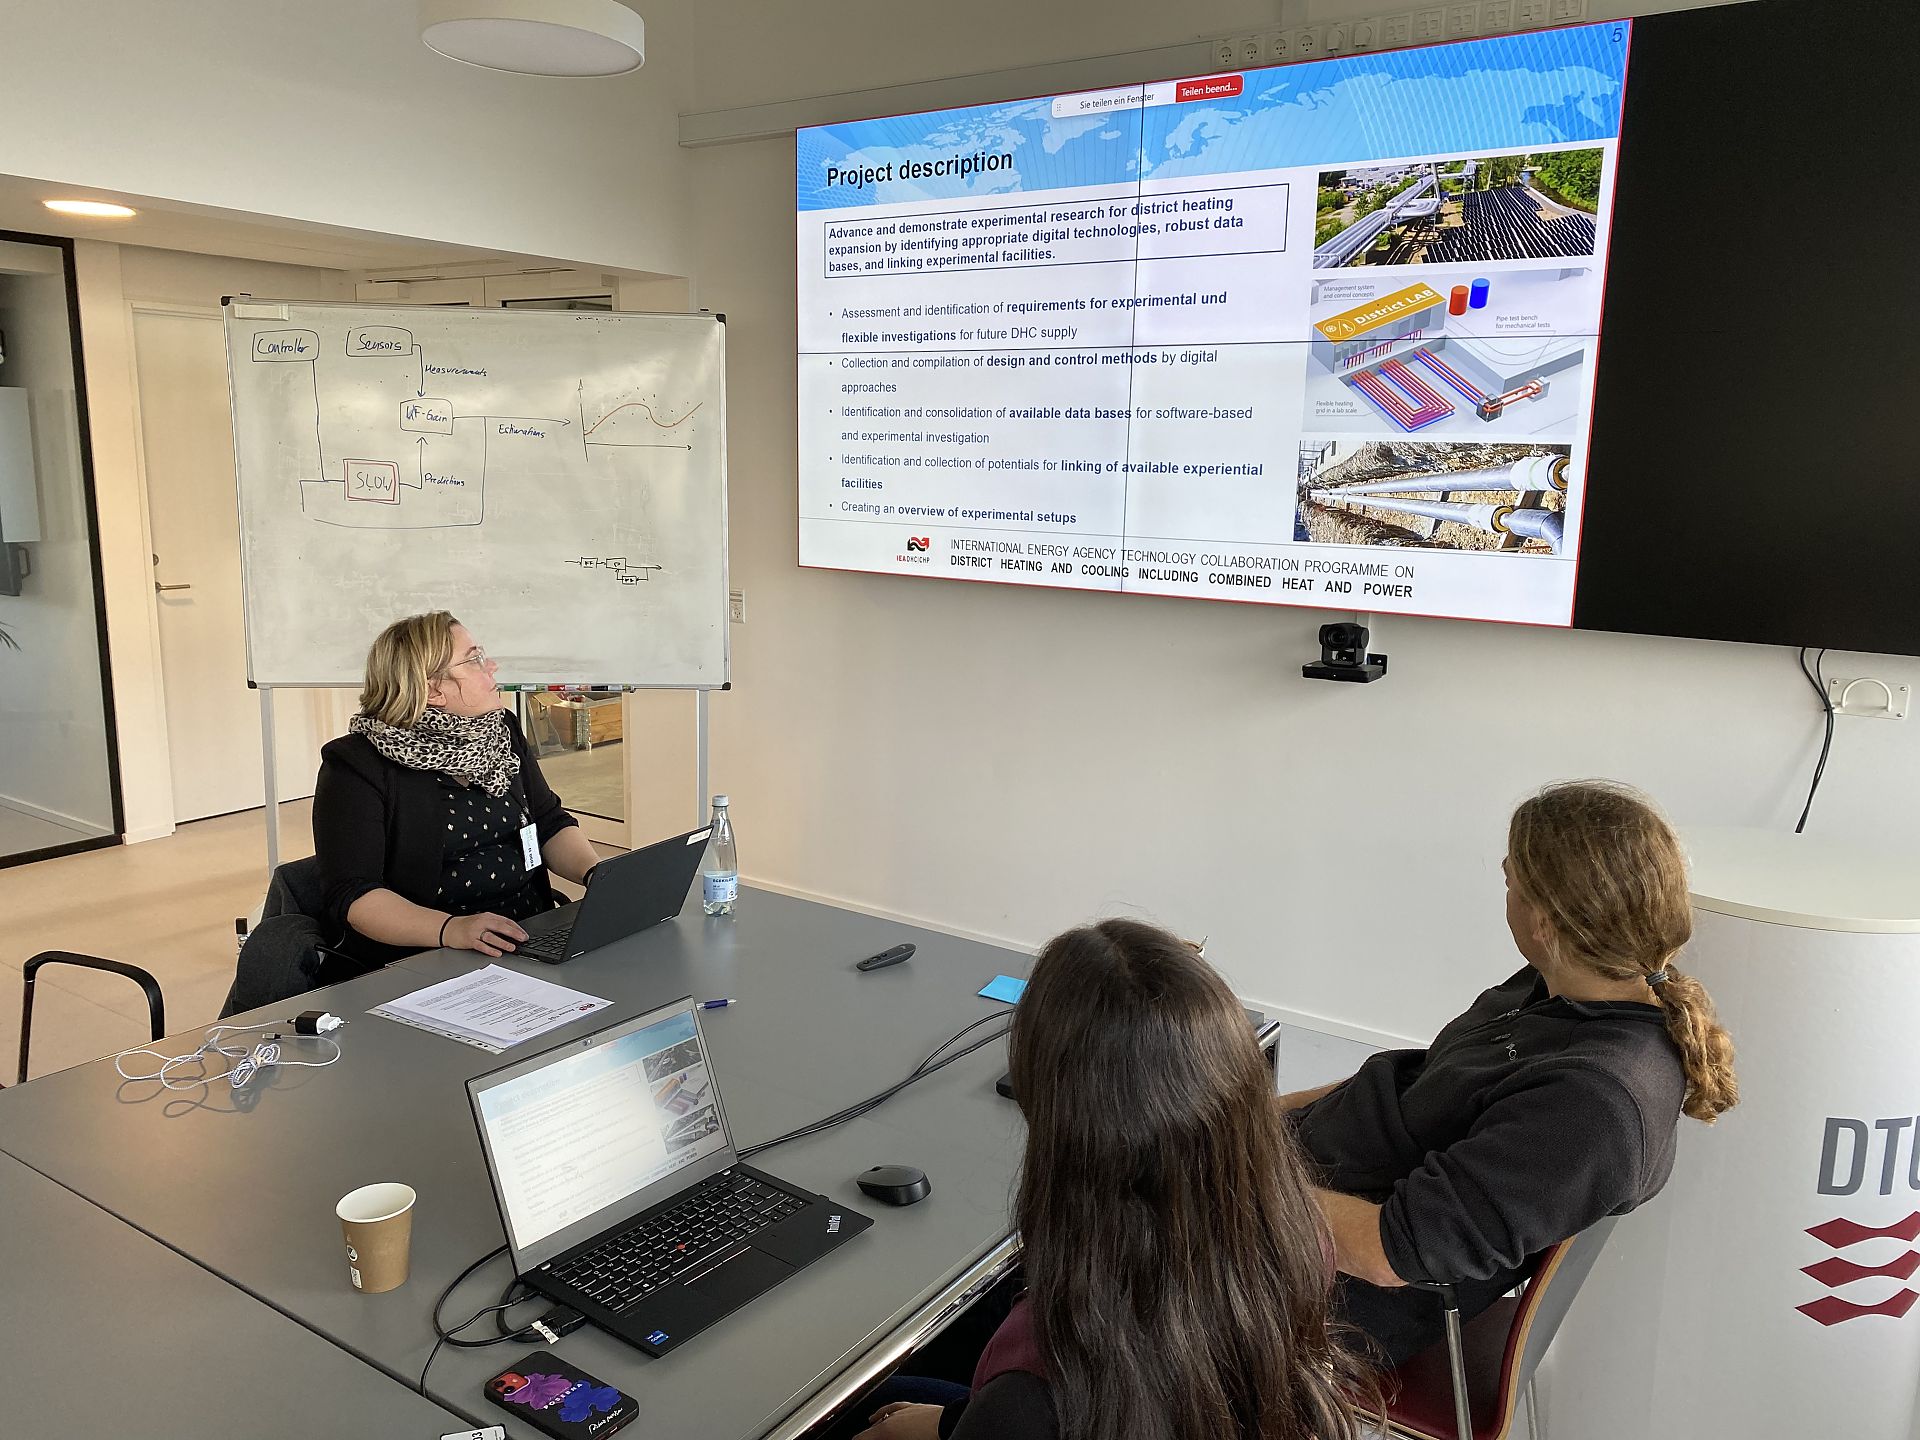
IEA DHC Annex TS8: 2. Working Phase Meeting (Picture 1/2)
The international cooperation in IEA DHC Annex TS8 also includes working meetings. The 2nd working meeting took place on 26/27 November 2024 at the DTU Risø Campus.
Copyright: Edmund Widl

IEA DHC Annex TS8: 2. Working Phase Meeting (Picture 2/2)
The international cooperation in IEA DHC Annex TS8 also includes working meetings. The 2nd working meeting took place on 26/27 November 2024 at the DTU Risø Campus.
Copyright: Edmund Widl
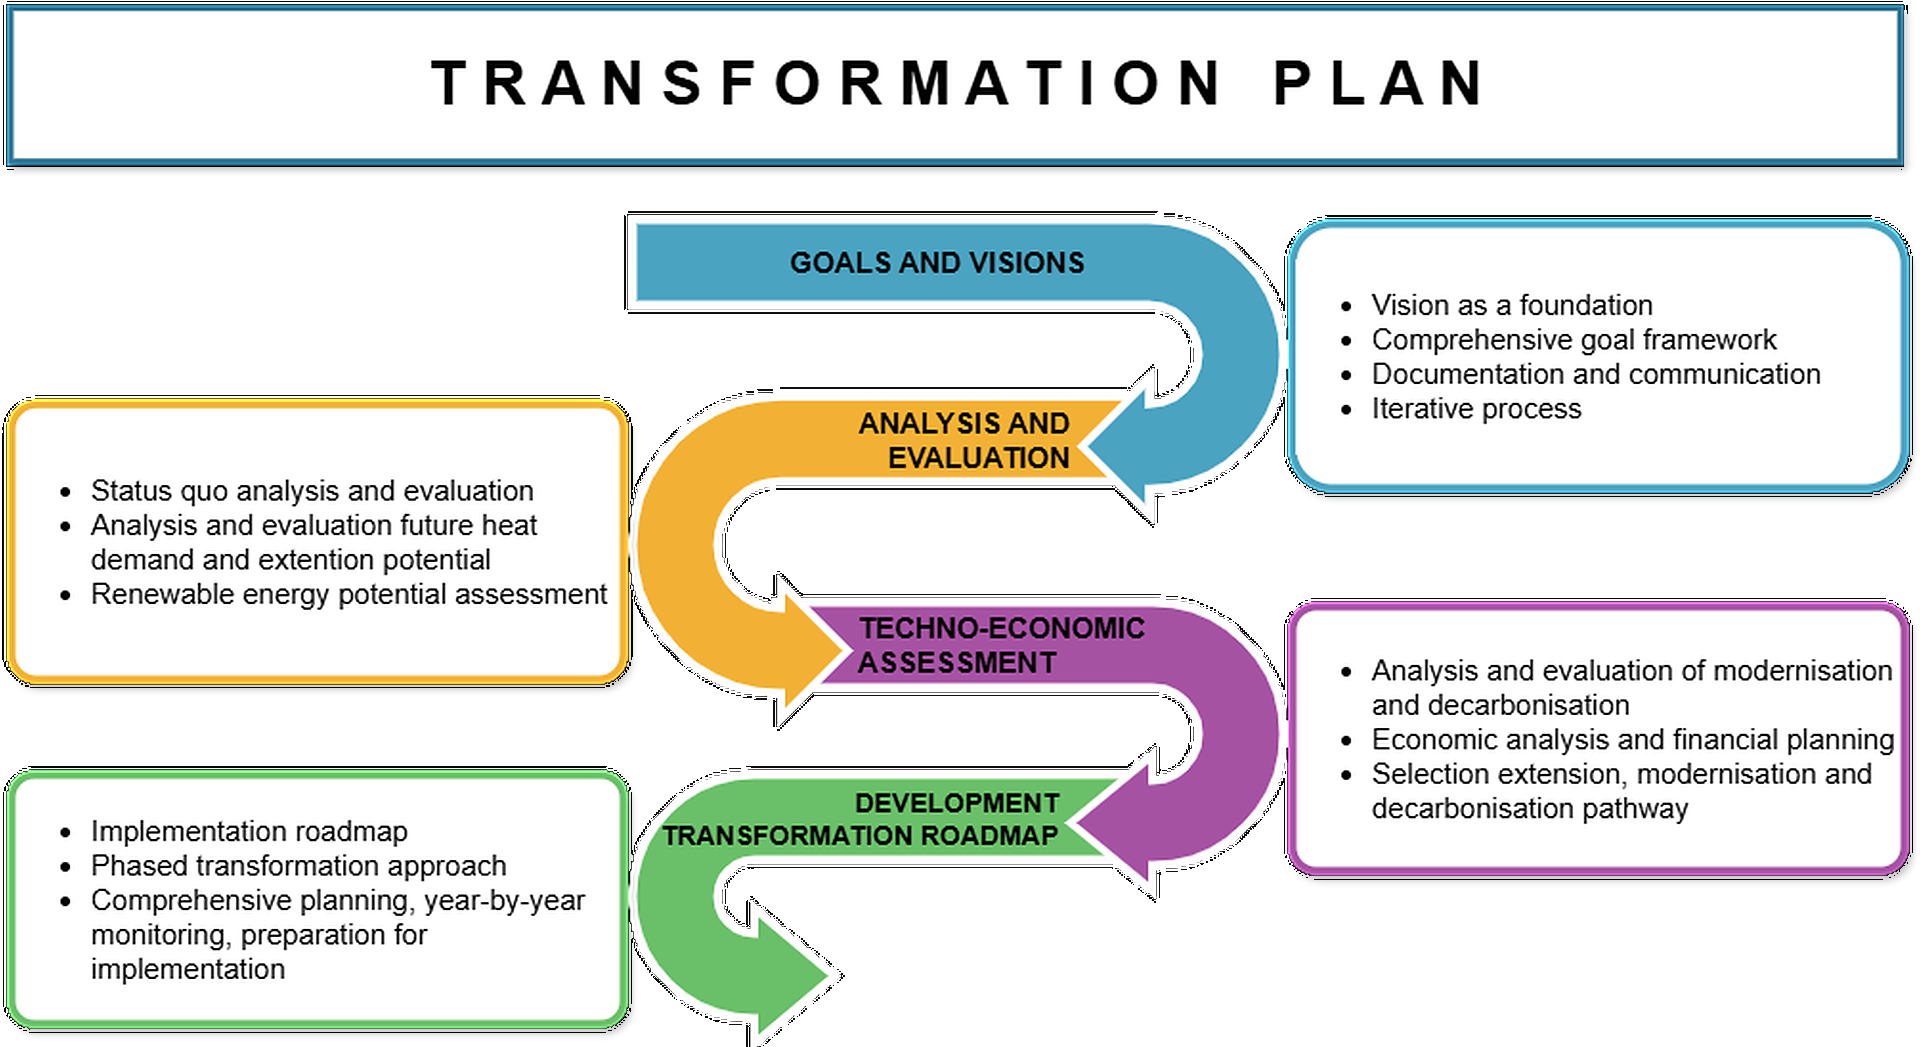
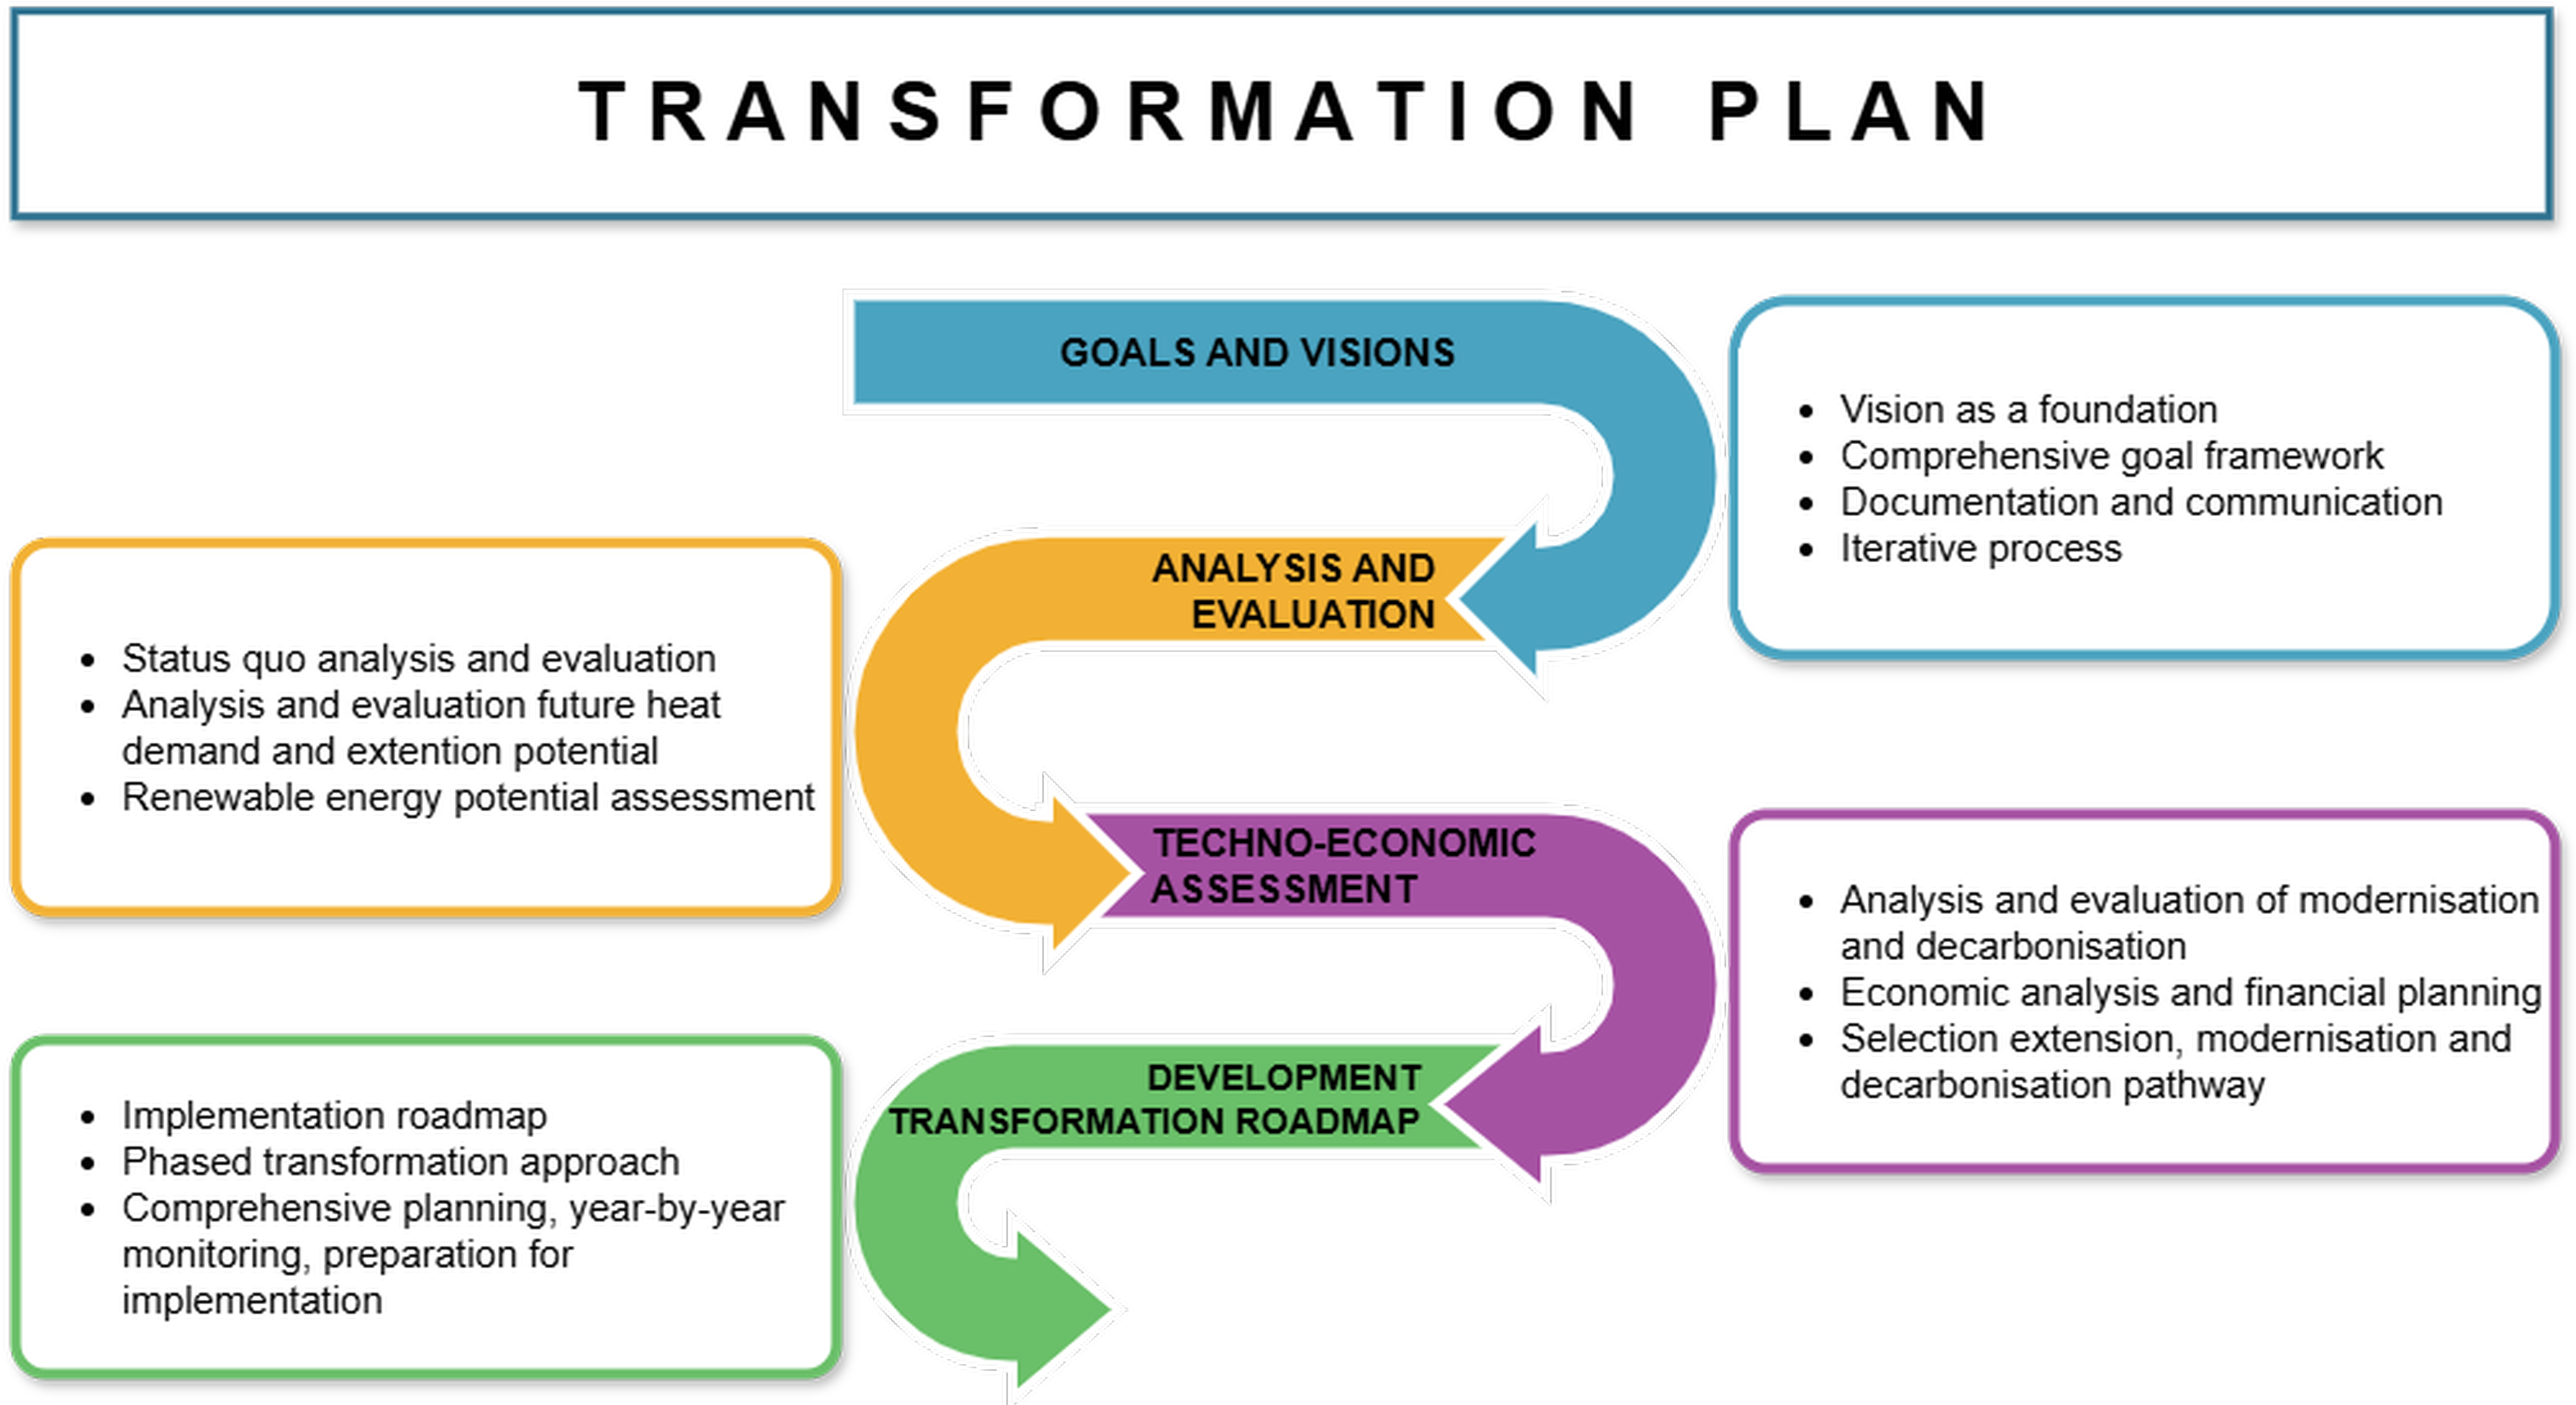
Overview transformation plan
Overview transformation plan
Copyright: AEE INTEC / Ingo Leusbrock
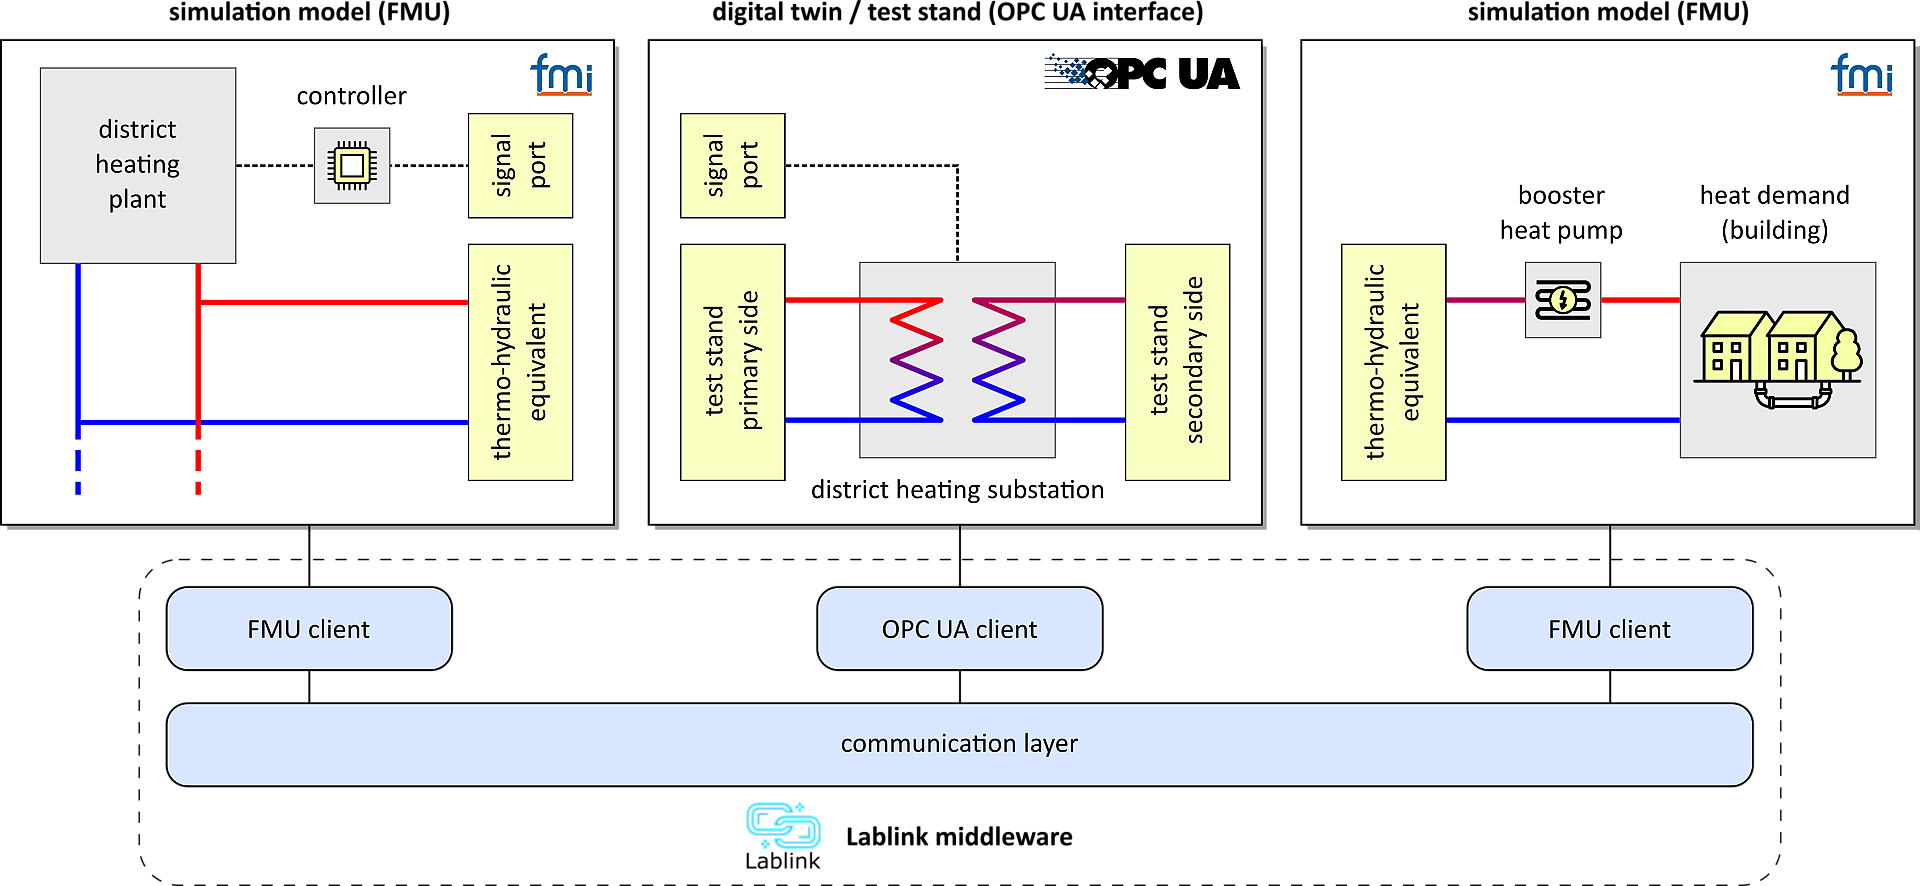
Digital Twins can serve as virtual components in lab setups.
Mapping of a proof-of-concept test case to the DigitalEnergyTestbed setup using the Digital Twin of the DH substation test stand.
Copyright: @ AIT Austrian Institute of Technology GmbH
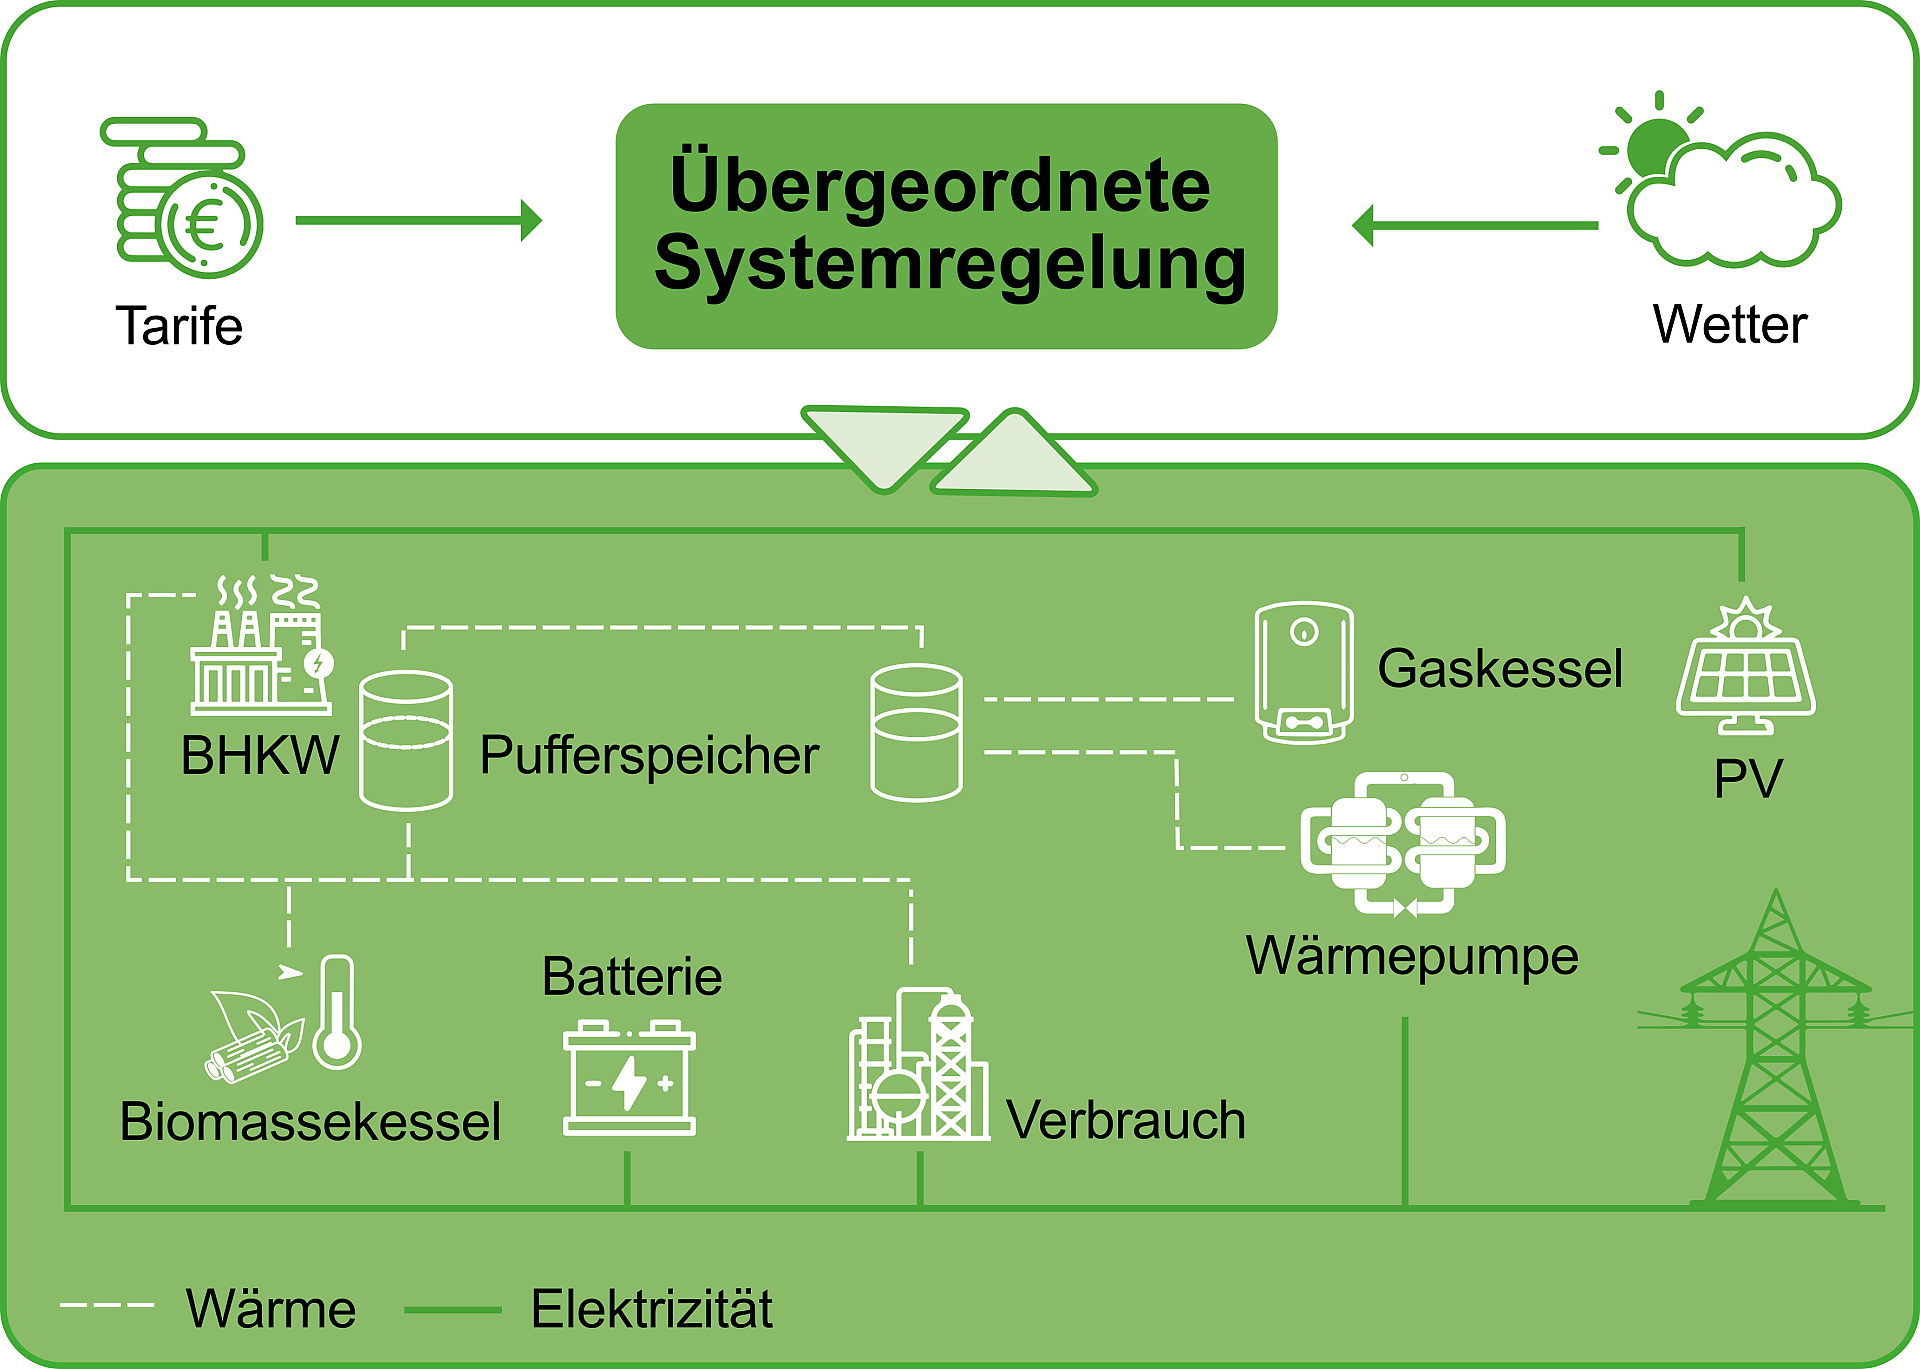
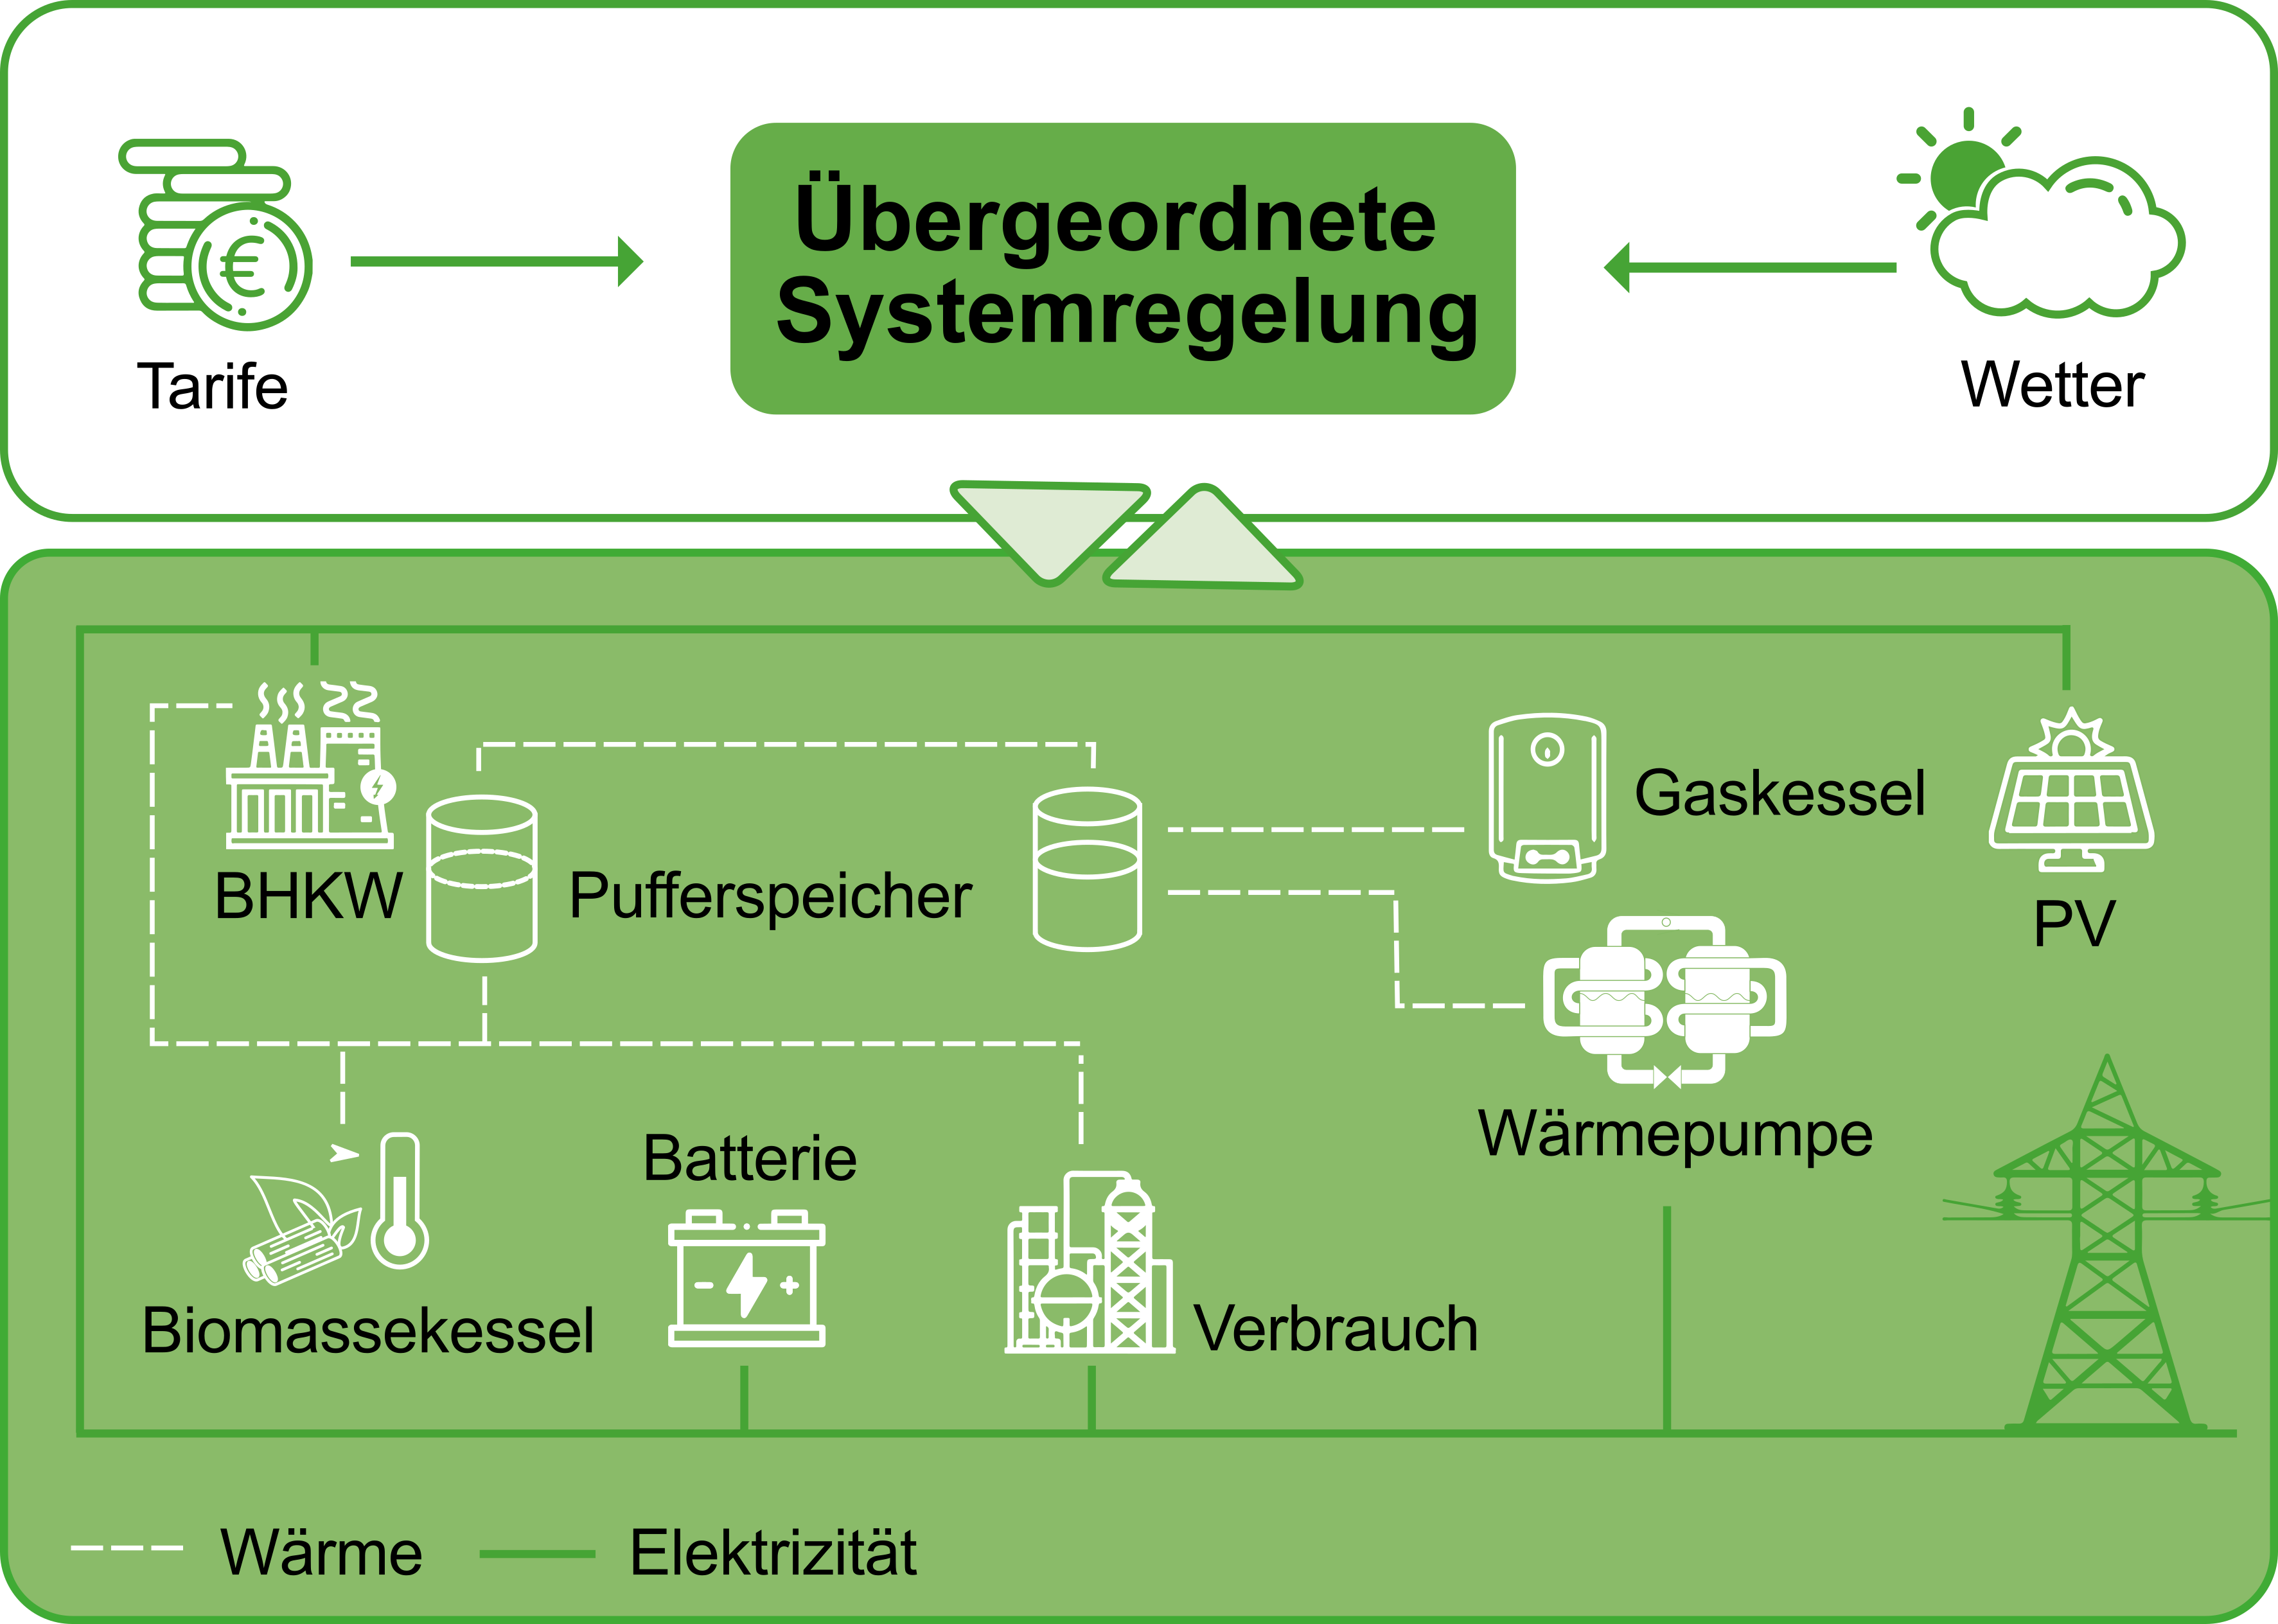
System-level Control of a Heating Grid with Sector Coupling
Exemplary Configuration of a simple heating grid, considering sector coupling through CHP and heat pump by forward-looking system control
Copyright: © BEST – Bioenergy and Sustainable Technologies GmbH

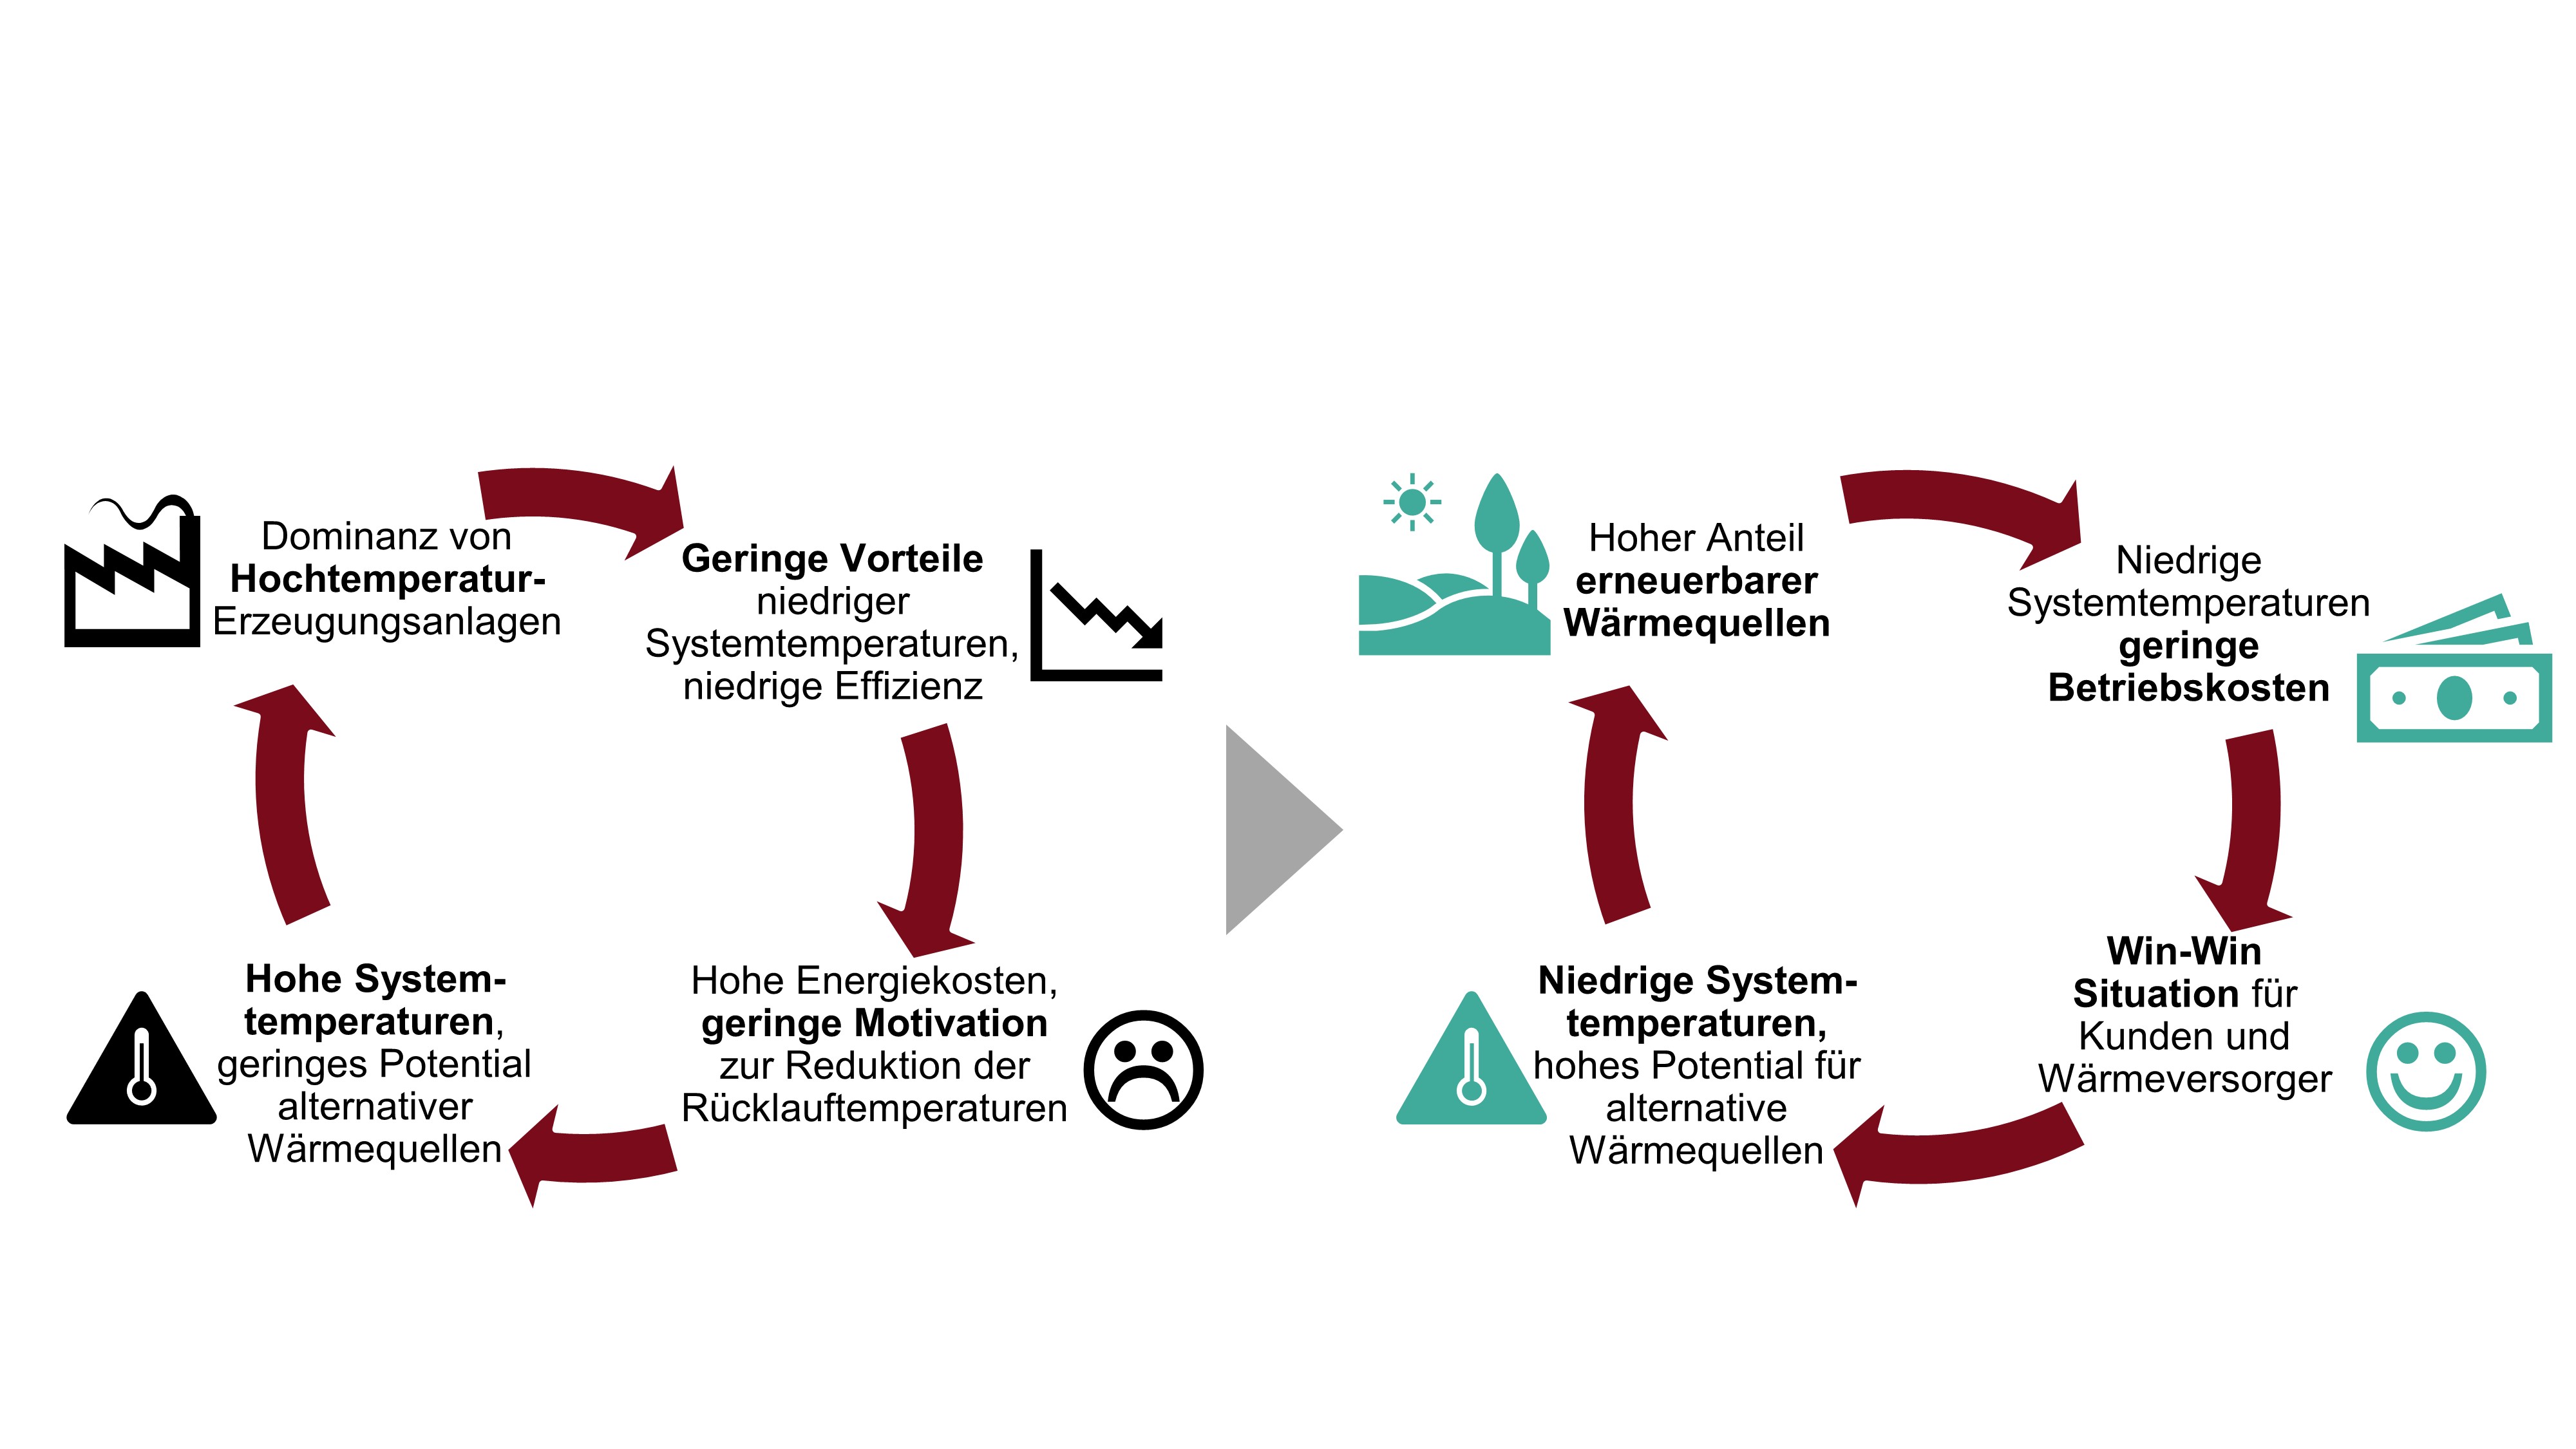
left: The vicious circle of high system temperatures (lock-in), right: The added value of low system temperatures
presentation of the different relations between system temperatures, supply structures, the effect on the system and the end users
Copyright: Ralf-Roman Schmidt, AIT
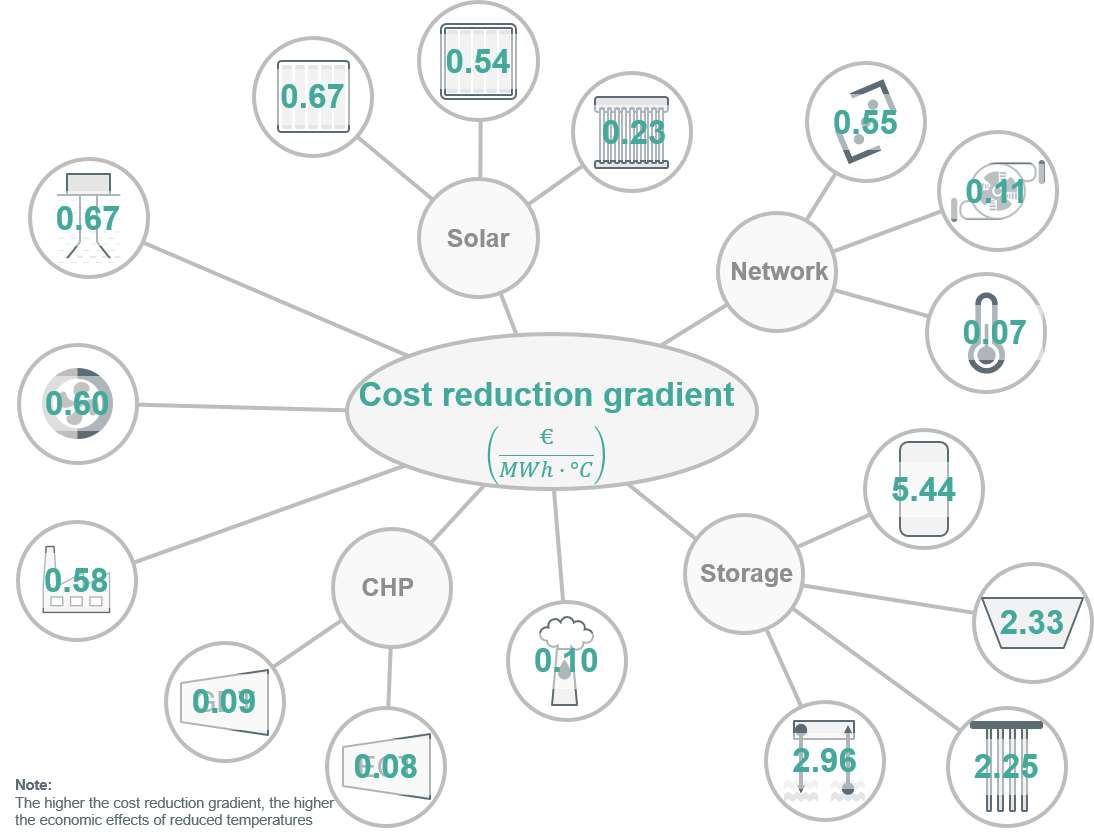
Economic effects of low system temperatures
Overview of the projected economic impact, according to the cost reduction gradient (CRG) in €/(MWh·°C), of reduced system temperatures
Copyright: Roman Geyer


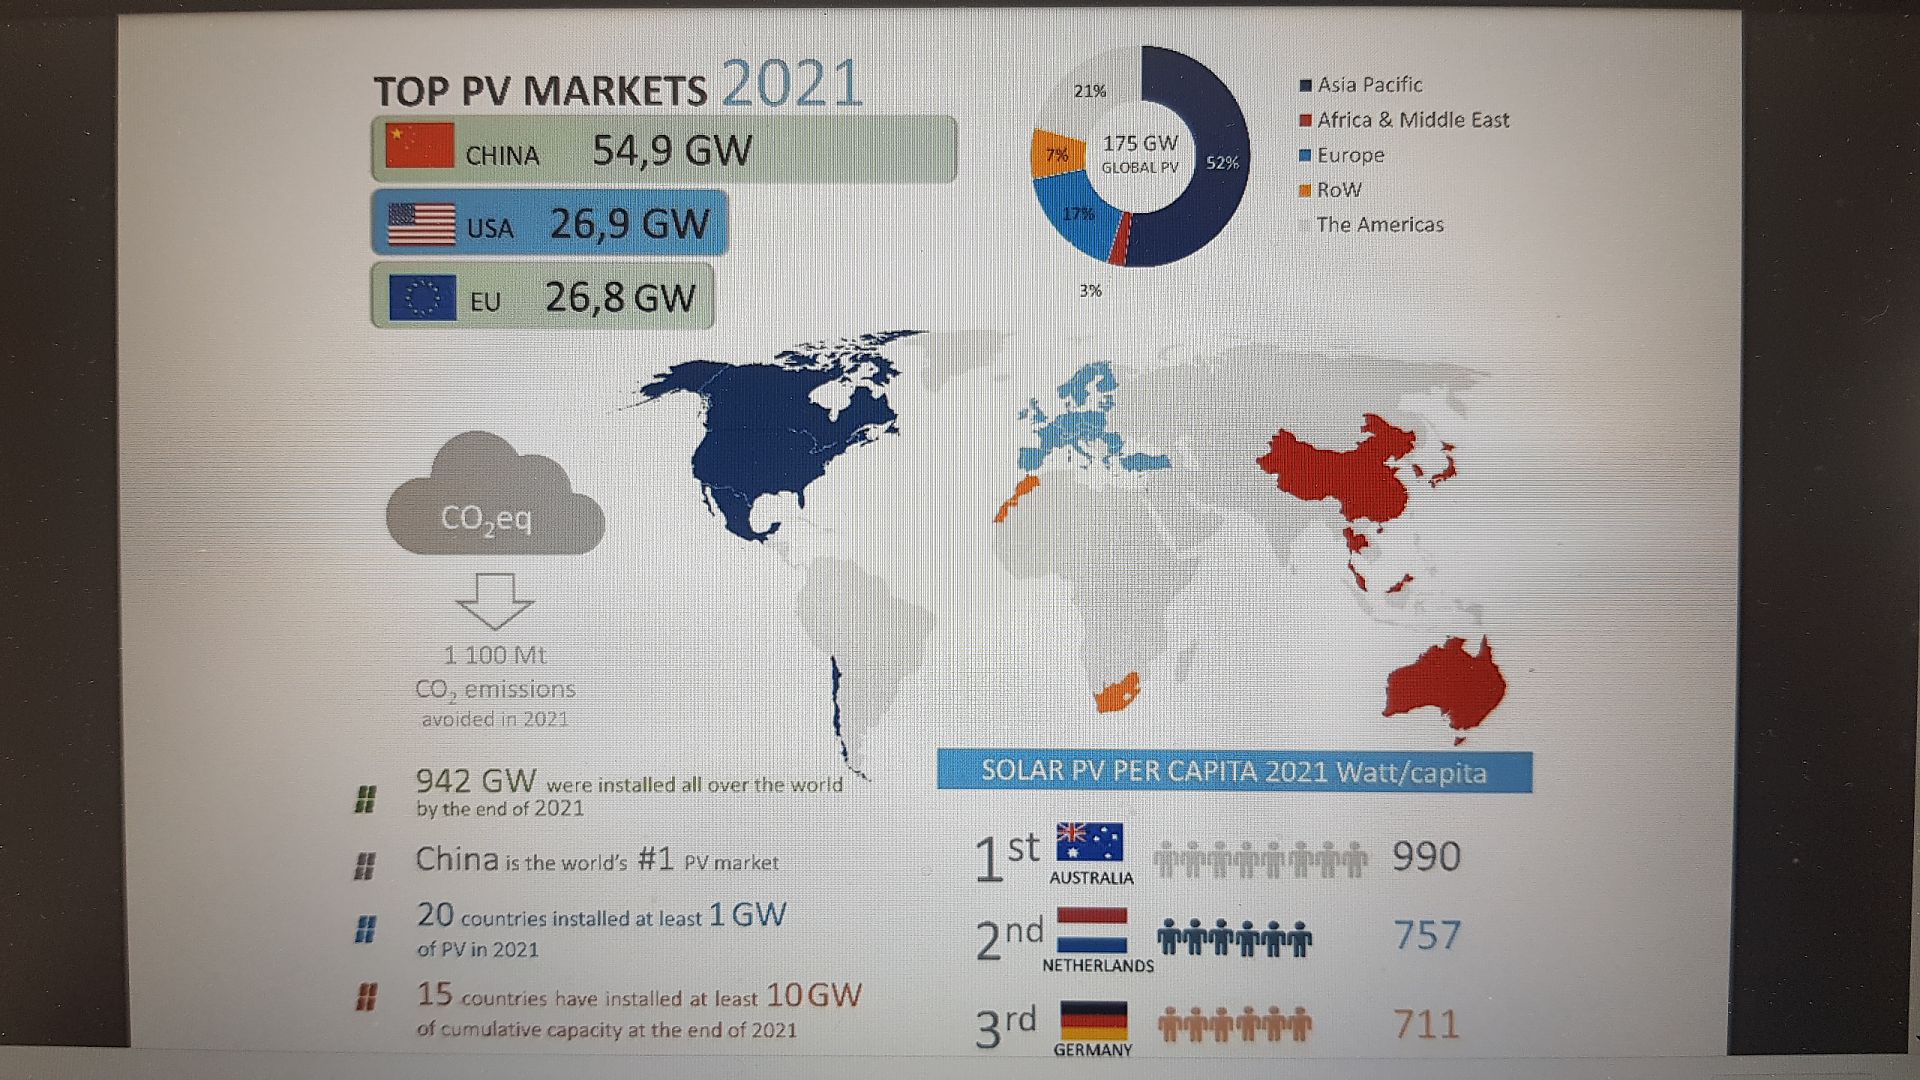
PV Top Photovoltaic Markets - Global
PV Top Photovoltaic Markets - Global
Copyright: IEA PVPS
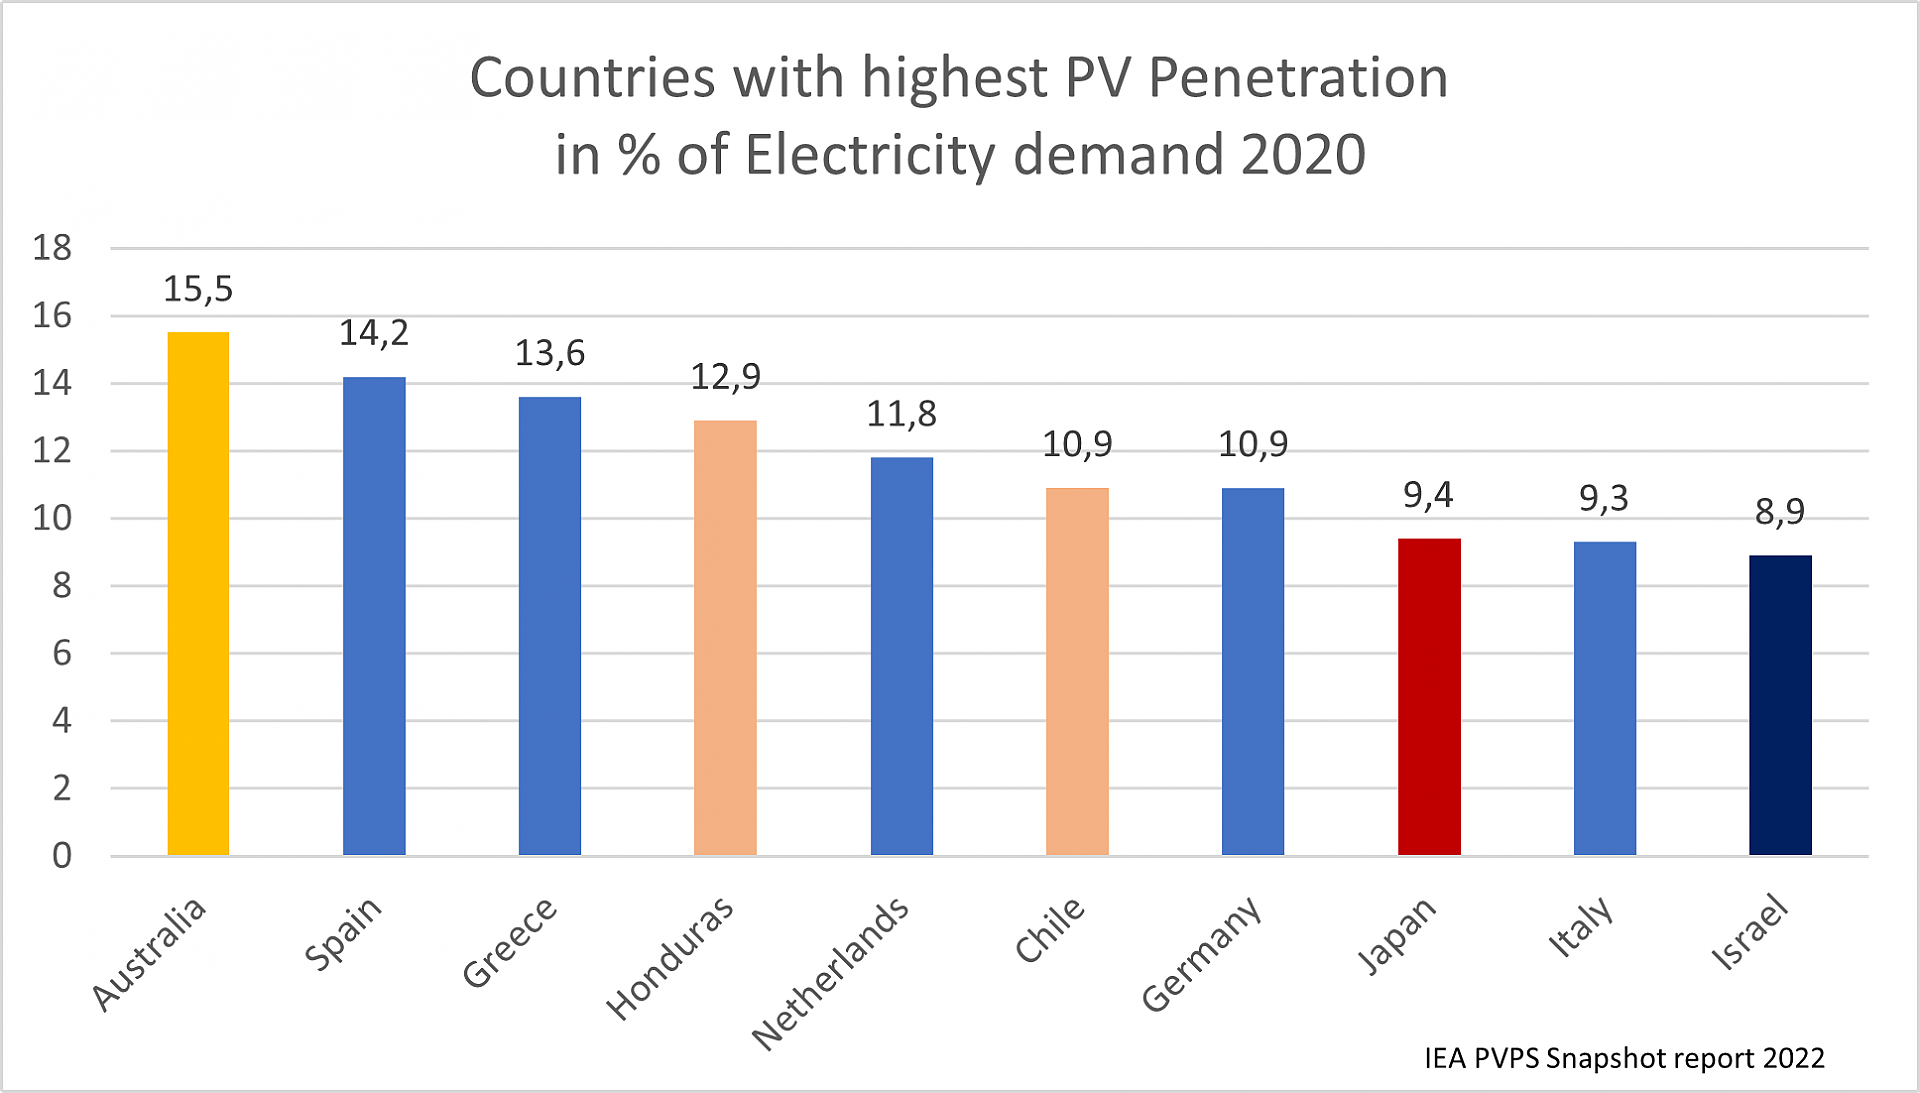
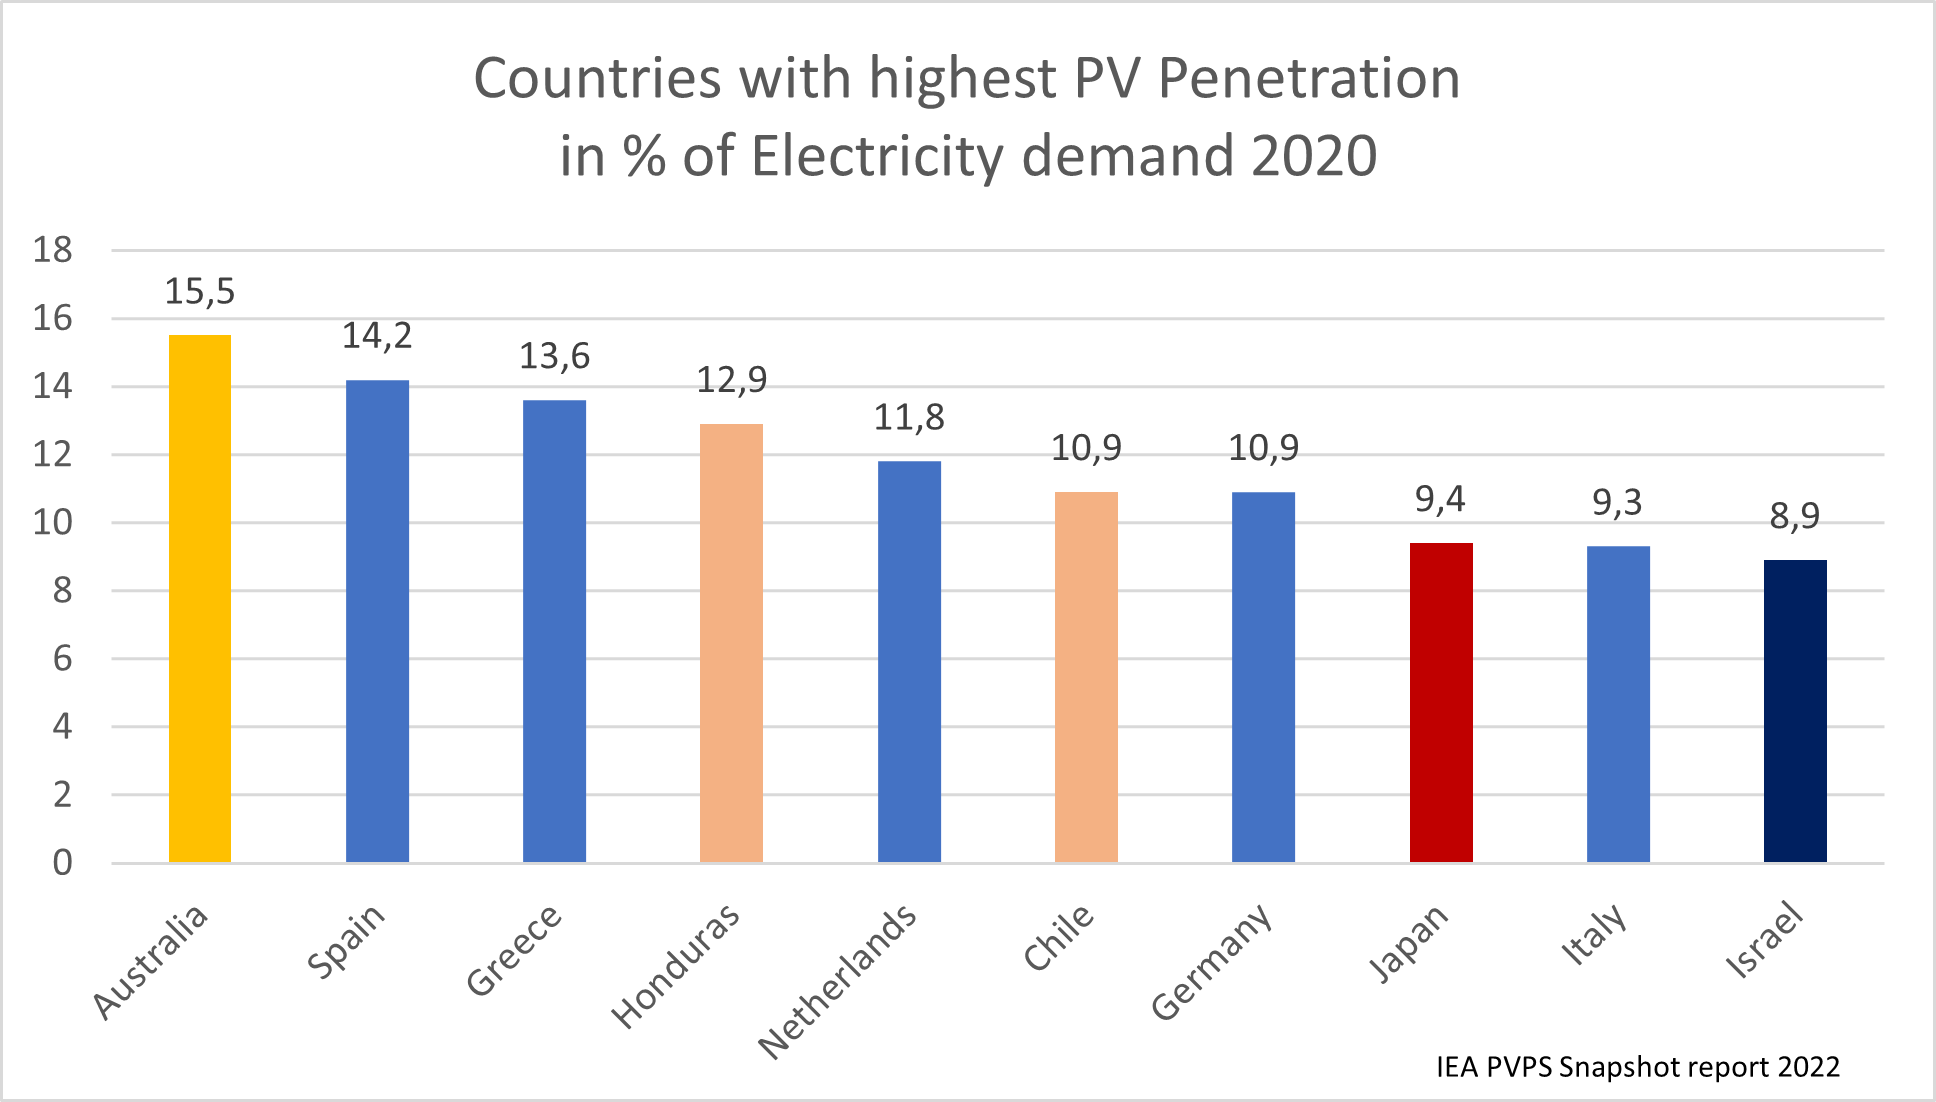
Countries with highest PV penetration 2020 - worldwide
Countries with highest PV penetration 2020 - 5% of the world electricity is 2020 covered by PV
Copyright: IEA PVPS

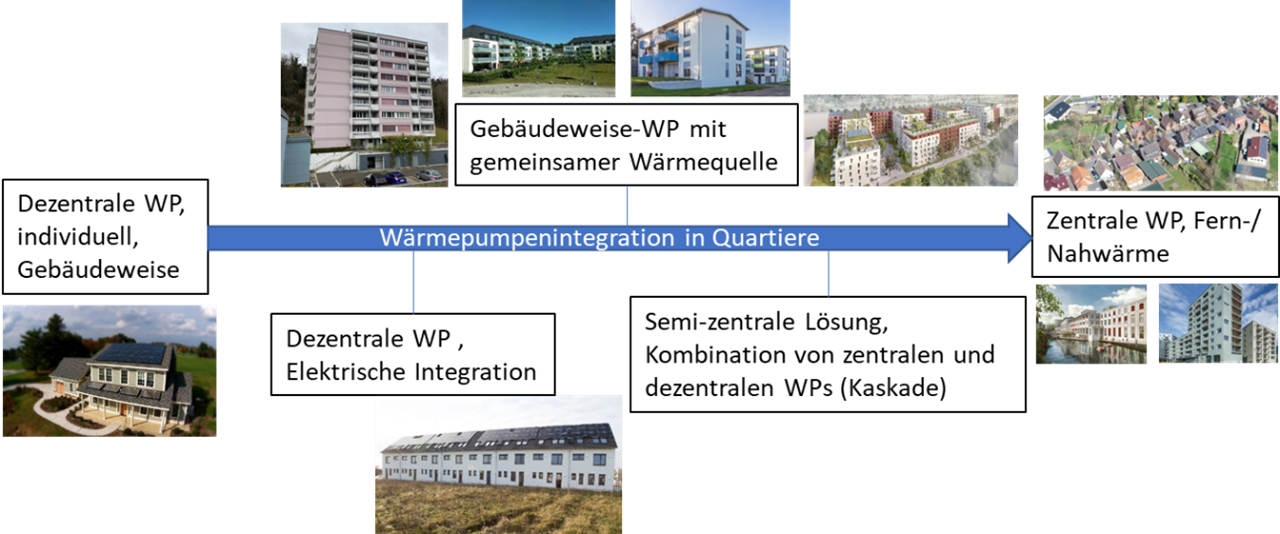
HP Inegration
Integration options of heat pumps in districts
Copyright: OST Wemhoener
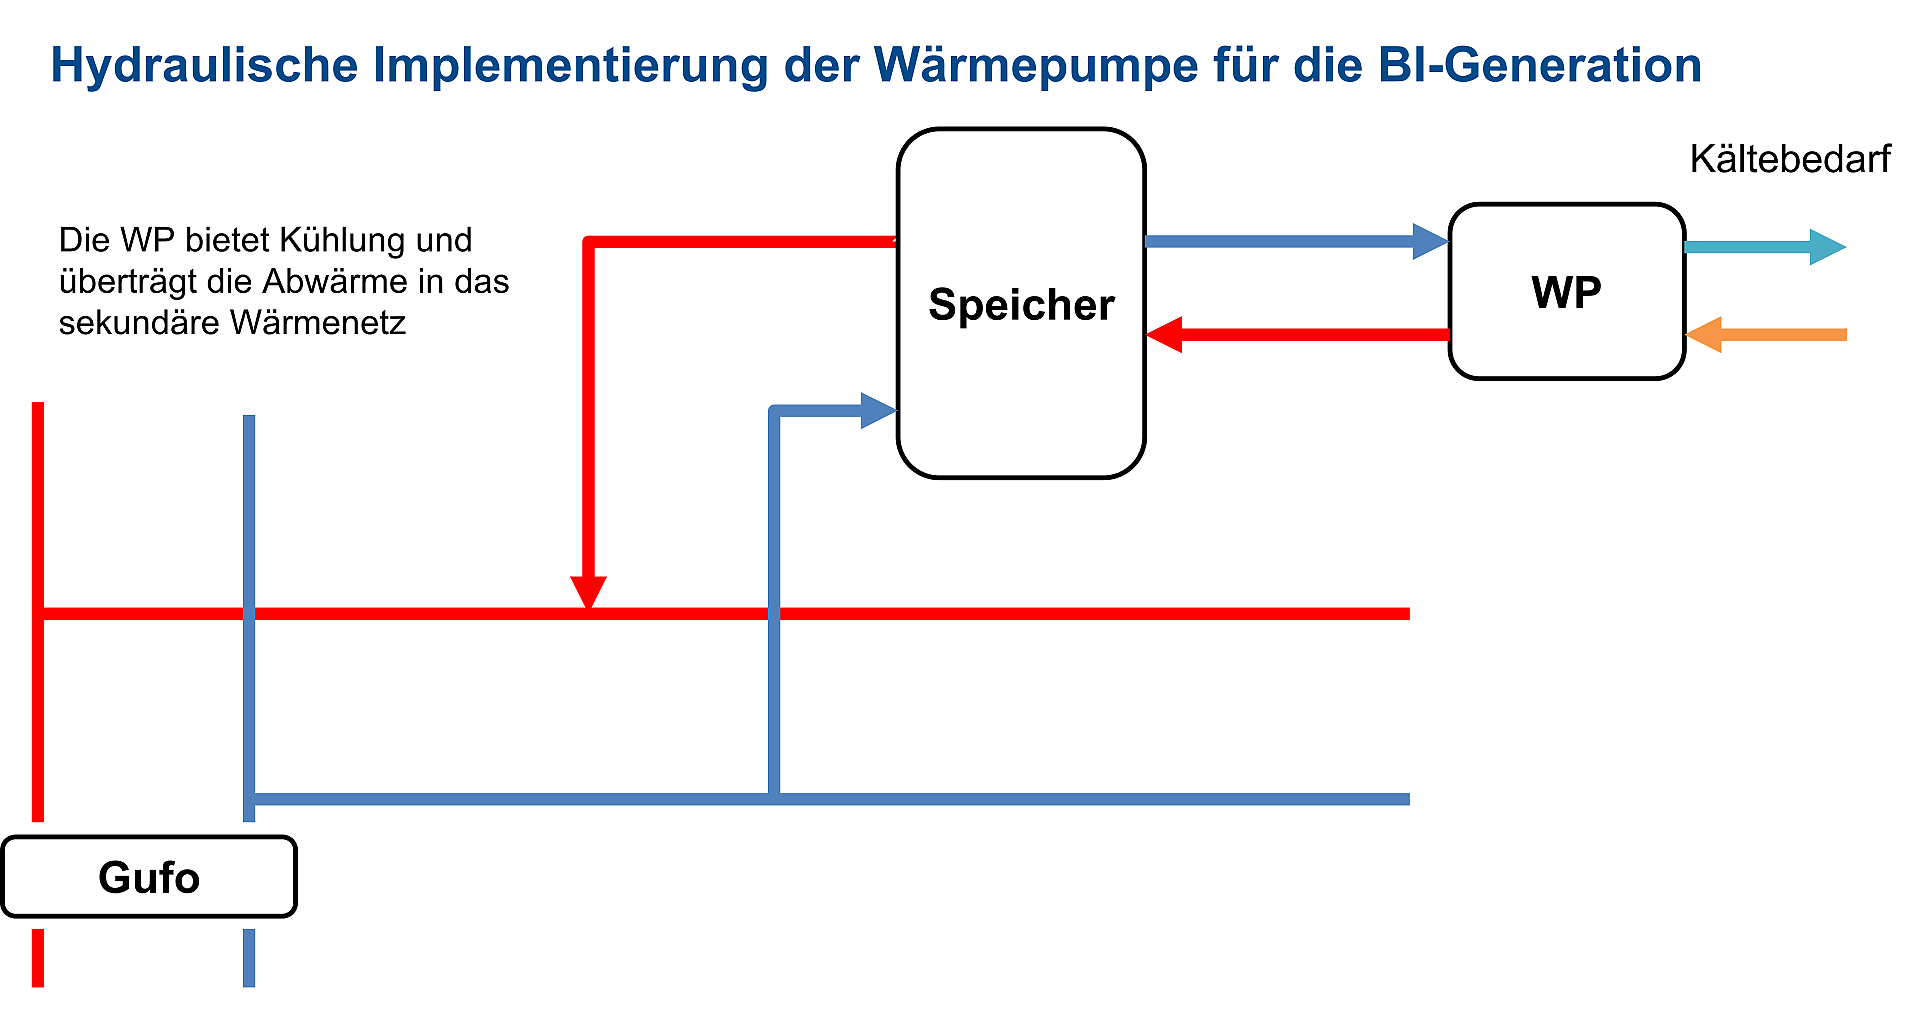
BI-Generation
Hydraulic integration of the heat pump for BI-Generation
Copyright: AEE INTEC Gradl
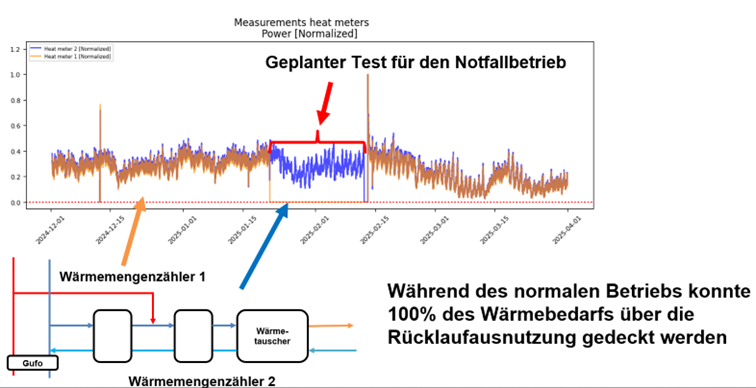
BI-Generation Monitoring Results
Monitoring Data of the Operation of the heat pump
Copyright: AEE INTEC Gradl
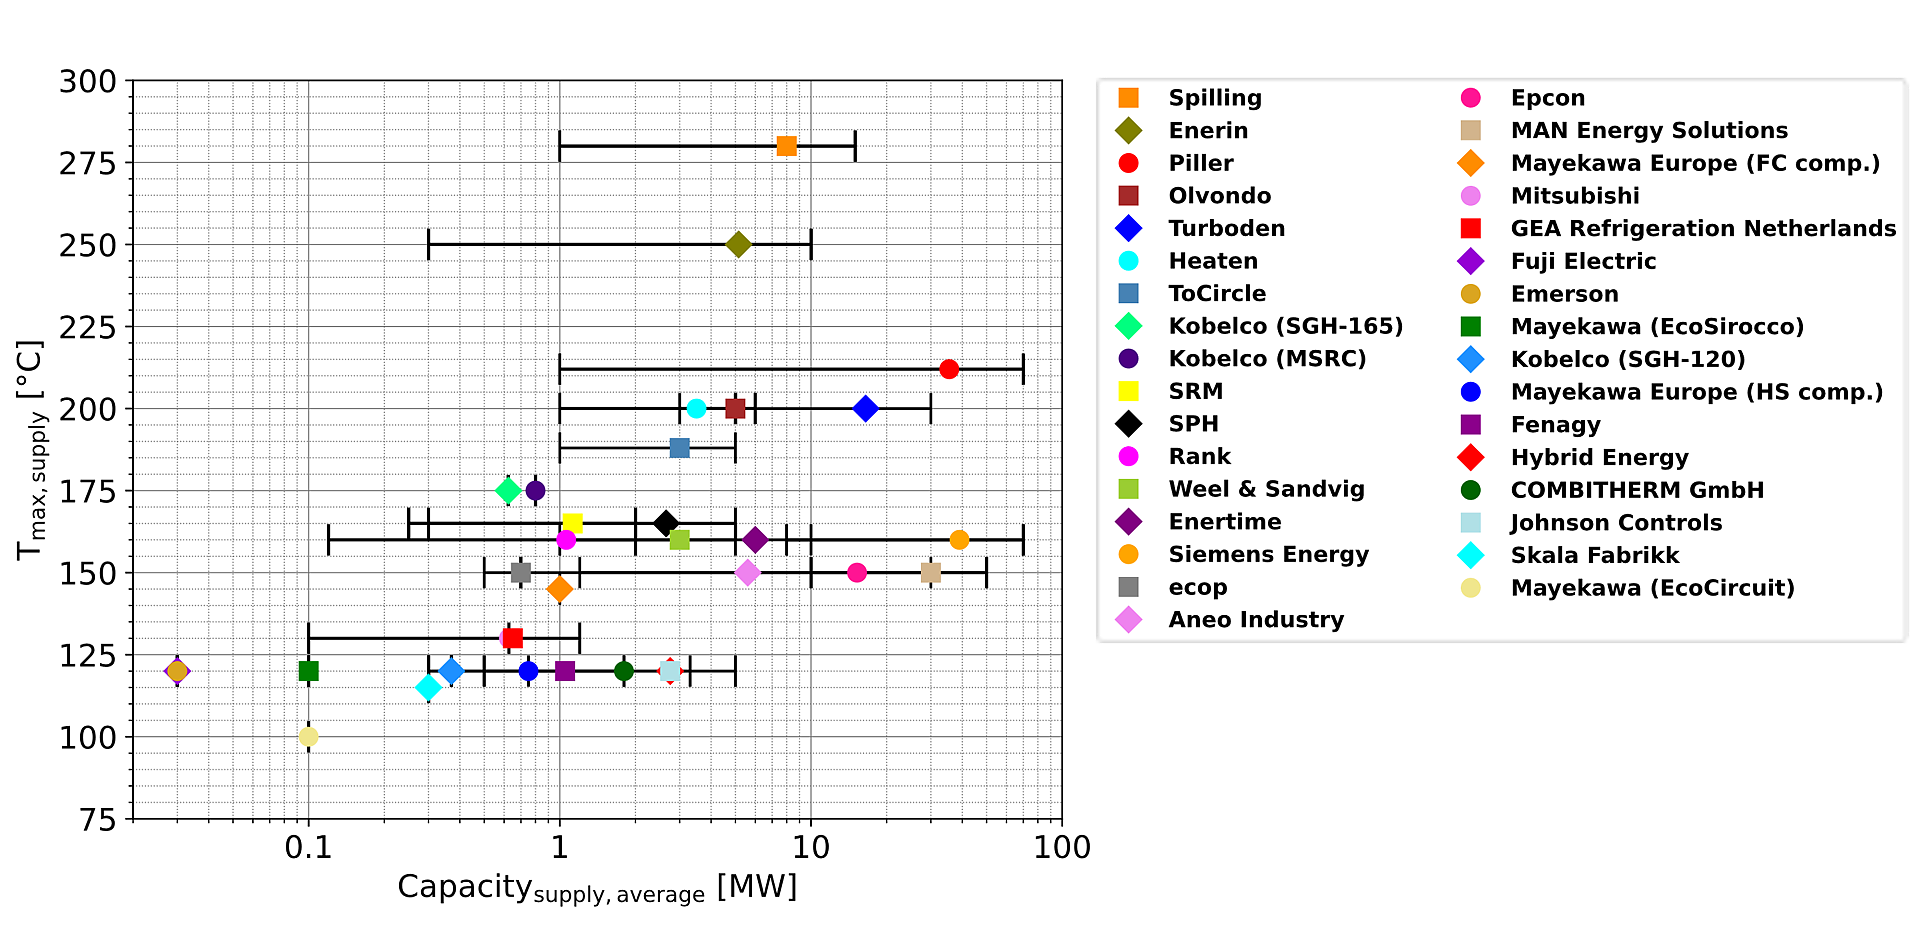
Maximum supply temperature as a function of heat capacity
The graphic shows the maximum supply temperature of high-temperature heat pump technologies from different manufacturers as a function of the heat capacity. More information on the individual technologies is published on the IEA HPT Annex 58 website (https://heatpumpingtechnologies.org/annex58/task1/).
Copyright: Danish Technological Institute
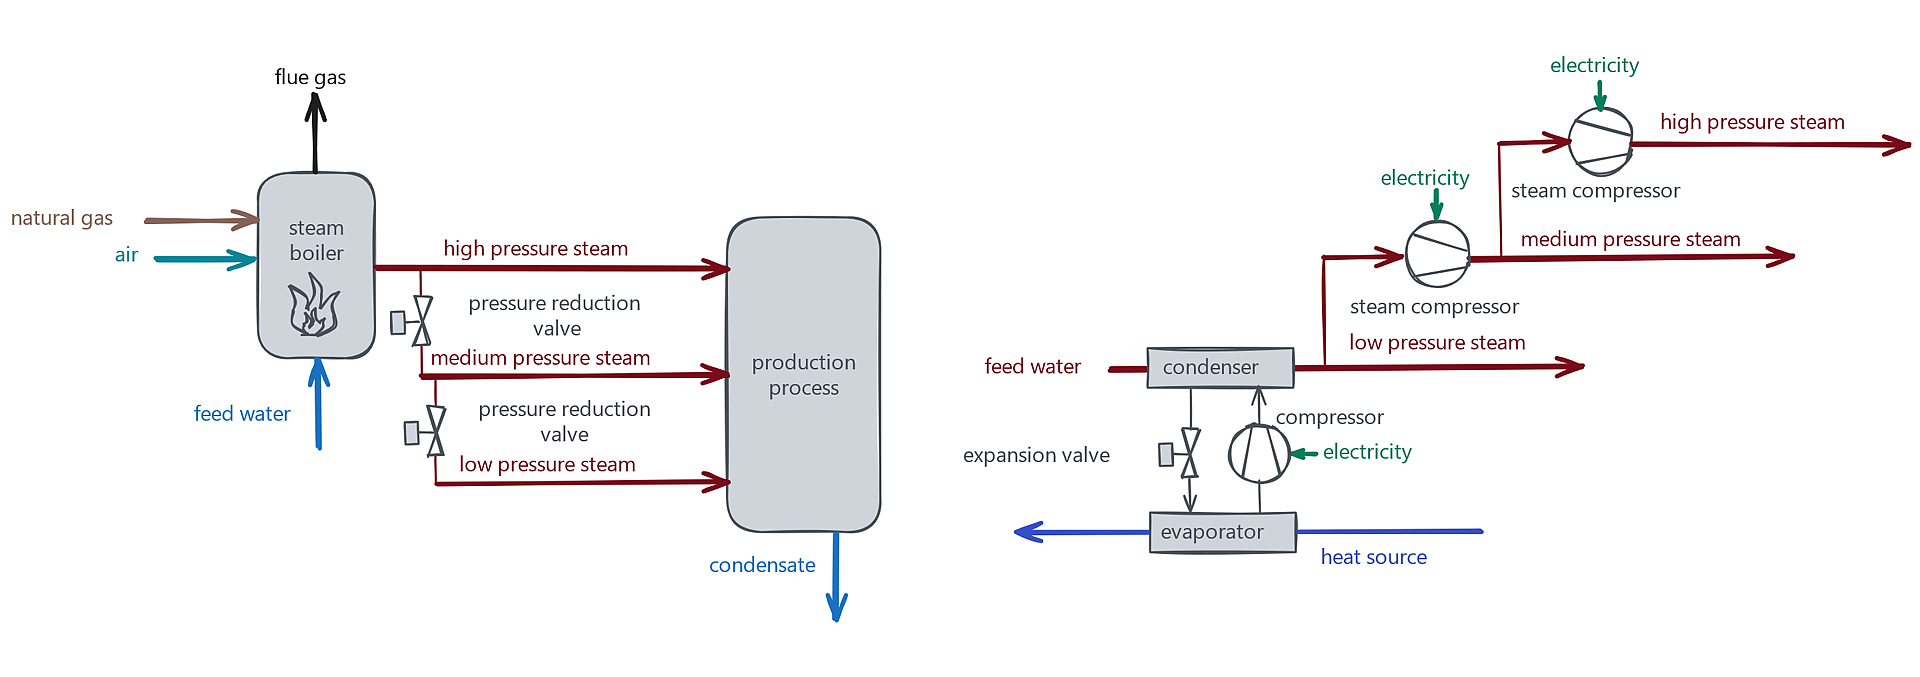
General comparison between steam generation with natural gas-fired boilers and heat pump technologies
The graphic shows conventional steam generation with natural gas-fired boilers compared to steam generation with heat pump technologies. In steam generation with natural gas-fired boilers, the steam is generated at least at the highest pressure level needed in the production process and then expanded to lower pressure levels. In comparison, when generating steam with a heat pump, it is advantageous if only the amount of steam required at the corresponding pressure level is also generated at this pressure level. Expansion to a lower temperature level should be avoided when using heat pumps. More information on steam generation with heat pumps can be found in the IEA HPT Annex 58 Task 2 report (https://heatpumpingtechnologies.org/annex58/task-2-integration-concepts/).