Project Image Pool
There are 410 results.
Terms of use: The pictures on this site originate from the projects in the frame of the programmes City of Tomorrow, Building of Tomorrow and the IEA Research Cooperation. They may be used credited for non-commercial purposes under the Creative Commons License Attribution-NonCommercial (CC BY-NC).
Demoplants Database
Database on facilities for the production of advanced liquid and gaseous biofuels for transport
Copyright: @IEA Bioenergy Task 39 @Open Street Map
Advanced Biofuel Pathways
Principle pathways of advanced biofuels technologies
Copyright: @BEST
Stand of the different baterry technologies (IEA 4E EDNA Task on Batteries).
This graphic shows the state of the art of different battery technologies. 14 types are organized according to their state of development. 10 are lithium-based batteries, the other 4 use various chemistry compositions (Zinc or carbon nano-tubes), or use new concepts to increase their capacity.
Copyright: 4E EDNA
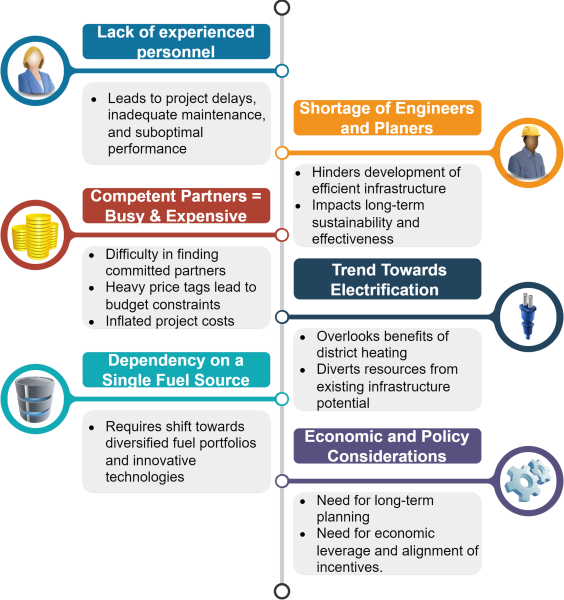
Bottlenecks and challenges in transformation processes
Bottlenecks and challenges in transformation processes
Copyright: AEE INTEC / Ingo Leusbrock
Overview transformation plan
Overview transformation plan
Copyright: AEE INTEC / Ingo Leusbrock
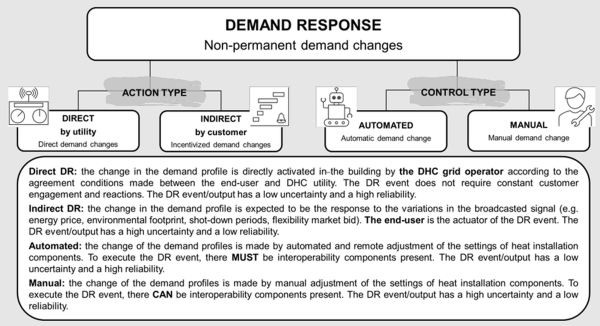
Overview demand response types
Combining the two action and control types there can be four different demand response types: 1) Direct Automated (e.g. action and control types are characterised by high reliability; 2) Indirect Automated (e.g. model predictive control in the building reacting to the DHC broadcasted signal), action and control types are characterised by low & high reliability, respectively; 3) Direct Manual (e.g. DHC operator vising the house or sitting in the control room and pressing the button), action and control types are characterised by high & low reliability, respectively; 4) Indirect Manual (e.g. end users changing the settings physically of via using the remote technology (walking in the house, sitting on the sofa and using app) as the reaction to the broadcasted signal), action and control types are characterised by low reliability.
Copyright: Authors of final report IEA EBC Annex 84
Joint workshop IEA EBC Annex 84 & IEA ES Task 43 („Standardized Use of Building Mass as Storage for Renewables and Grid Flexibility“)
Joint workshop IEA EBC Annex 84 & IEA ES Task 43 („Standardized Use of Building Mass as Storage for Renewables and Grid Flexibility“)
Copyright: Ingo Leusbrock
Terminology used for demand response within the framework of IEA EBC Annex 84
EBC Annex 84 distinguished between different "action types" and "control types".
Copyright: Authors of final report IEA EBC Annex 84
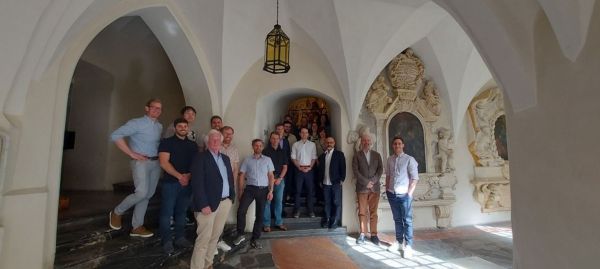
Information exchange before the visit of the fluidized bed unit
Information exchange before visiting the fluidized bed unit of heinzelpaper during the 14th Austrian IEA Fluidized Bed Meeting.
Copyright: TU Wien
Visit of the museum for paper production
Visit of the museum for paper production Laakirchen during the 14th Austrian IEA Fluidized Bed Meeting and the manuel production of paper.
Copyright: TU Wien
Visit of the fluidized bed unit of heinzelpaper
During the 14th Austrian IEA Fluidized Bed Meeting the fluidized bed unit of heinzelpaper was visited.
Copyright: TU Wien
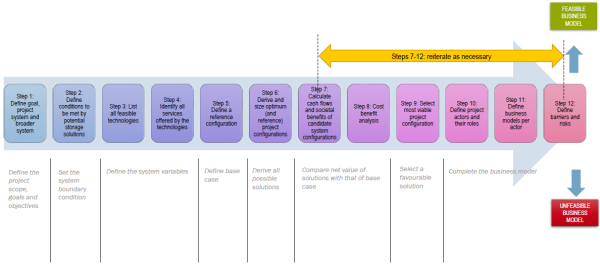
Value creation and business model framework
Development of business cases based on a 12-step approach
Copyright: TNO
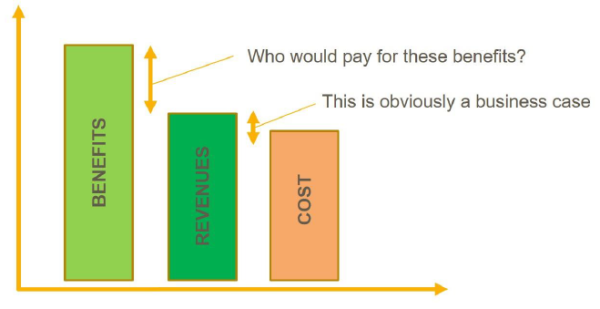
Benefits, revenues, and cost analysis
Benefit, revenue, and cost analysis to evaluate the economic performance
Copyright: Andreas Hauer
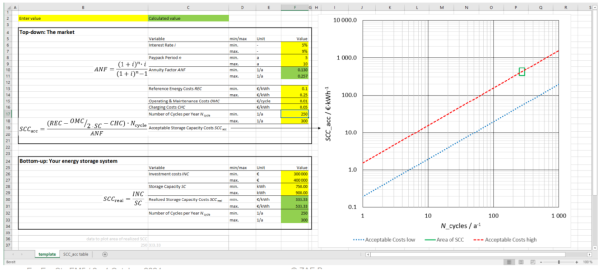
Economic evaluation tool
Economic assessment tool for determining acceptable storage costs
Copyright: Christoph Rathgeber
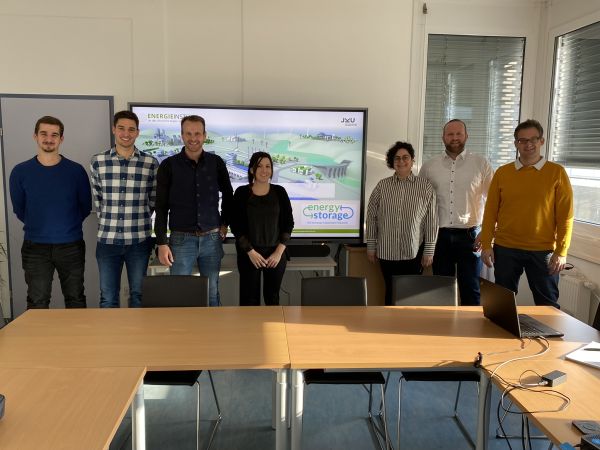
National Task 41 team
Kick-off meeting for Task 41 at the Energieinstitut an der JKU Linz
Copyright: Task 41 Konsortium
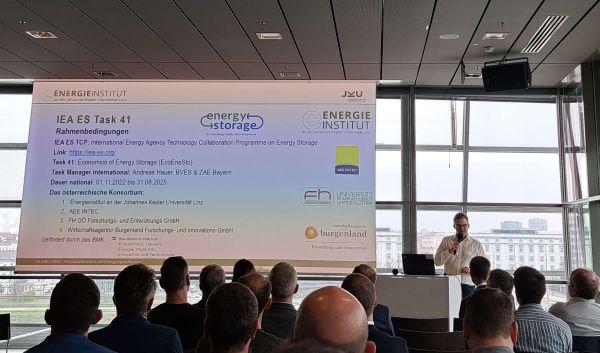
National workshop on the economic feasibility of energy storage
Stakeholder workshop on the economic feasibility of energy storage. Presentations and discussion on thermal, electrical, and chemical storage technologies and their potential applications.
Copyright: Stefan Puschnigg
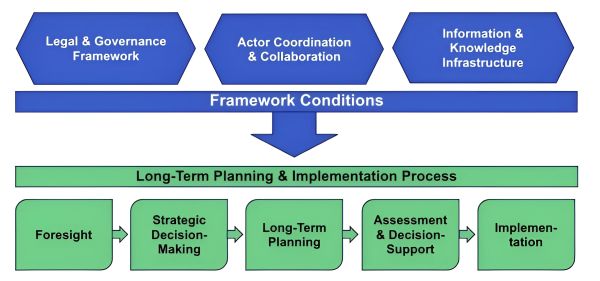
Cross-actor collaboration on forward-looking, long-term grid planning
A new structured methodology to facilitate cross-actor collaboration on forward-looking, long-term grid planning, enabling key actors to explore their respective roles and interdependencies, thereby facilitating development of efficient grid planning strategies.
Copyright: ISGAN Lighthouse Project (Helena Lindquist)
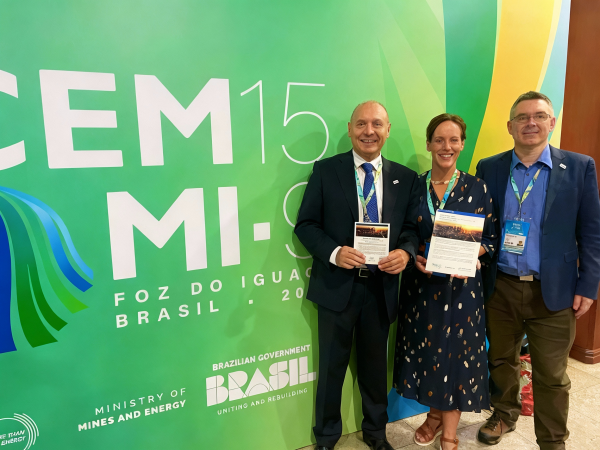
Policy Brief 2024
Policy Brief: presentation at CEM15/MI-9
Copyright: Helena Lindquist
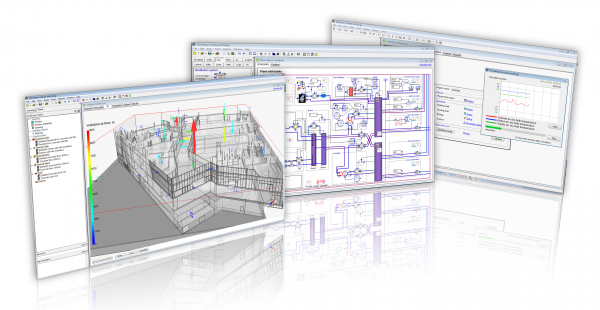
Combined building and plant simulation in real time
In a dynamic building simulation, the zones (rooms) are in contact with their surroundings and with the adjacent building components, the people, equipment and objects located in them. In the combined building and plant simulation, the dynamic interaction between building, plant and control is also taken into account. A building and plant simulation, adapted in real time to the actual weather conditions and current measurement data from the building, can help to optimize the control of the building services and thus reduce energy costs and increase user comfort.
Copyright: EQUA
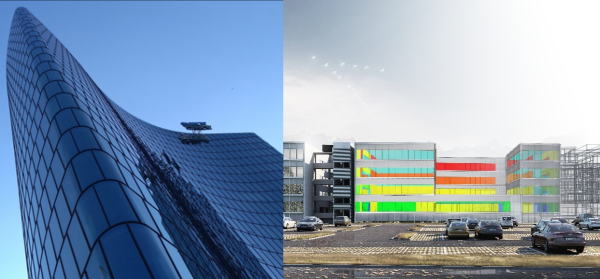
Two Austrian demonstration building digital twin
In recent years, AEE INTEC has completed two projects for the development and initial implementation of a digital twin on real buildings in Austria. This digital twin is a detailed simulation model using IDA ICE software, which is compared in real time with measurement data from a real building. This creates a model that represents the real condition of the building and its building services at any given time. This model can then be used for automated fault detection or to optimize control systems. The aim is to reduce energy consumption and improve user comfort.


