Project Image Pool
There are 106 results.
Terms of use: The pictures on this site originate from the projects in the frame of the programmes City of Tomorrow, Building of Tomorrow and the IEA Research Cooperation. They may be used credited for non-commercial purposes under the Creative Commons License Attribution-NonCommercial (CC BY-NC).
The large-scale thermal solar plant of Silkeborg, Dk
Overview over the large-scale solar thermal plant in Silkeborg, Denmark (left) and schematic showing the different sections and piping of the installation (right)
Copyright: © Silkeborg Forsyning AB
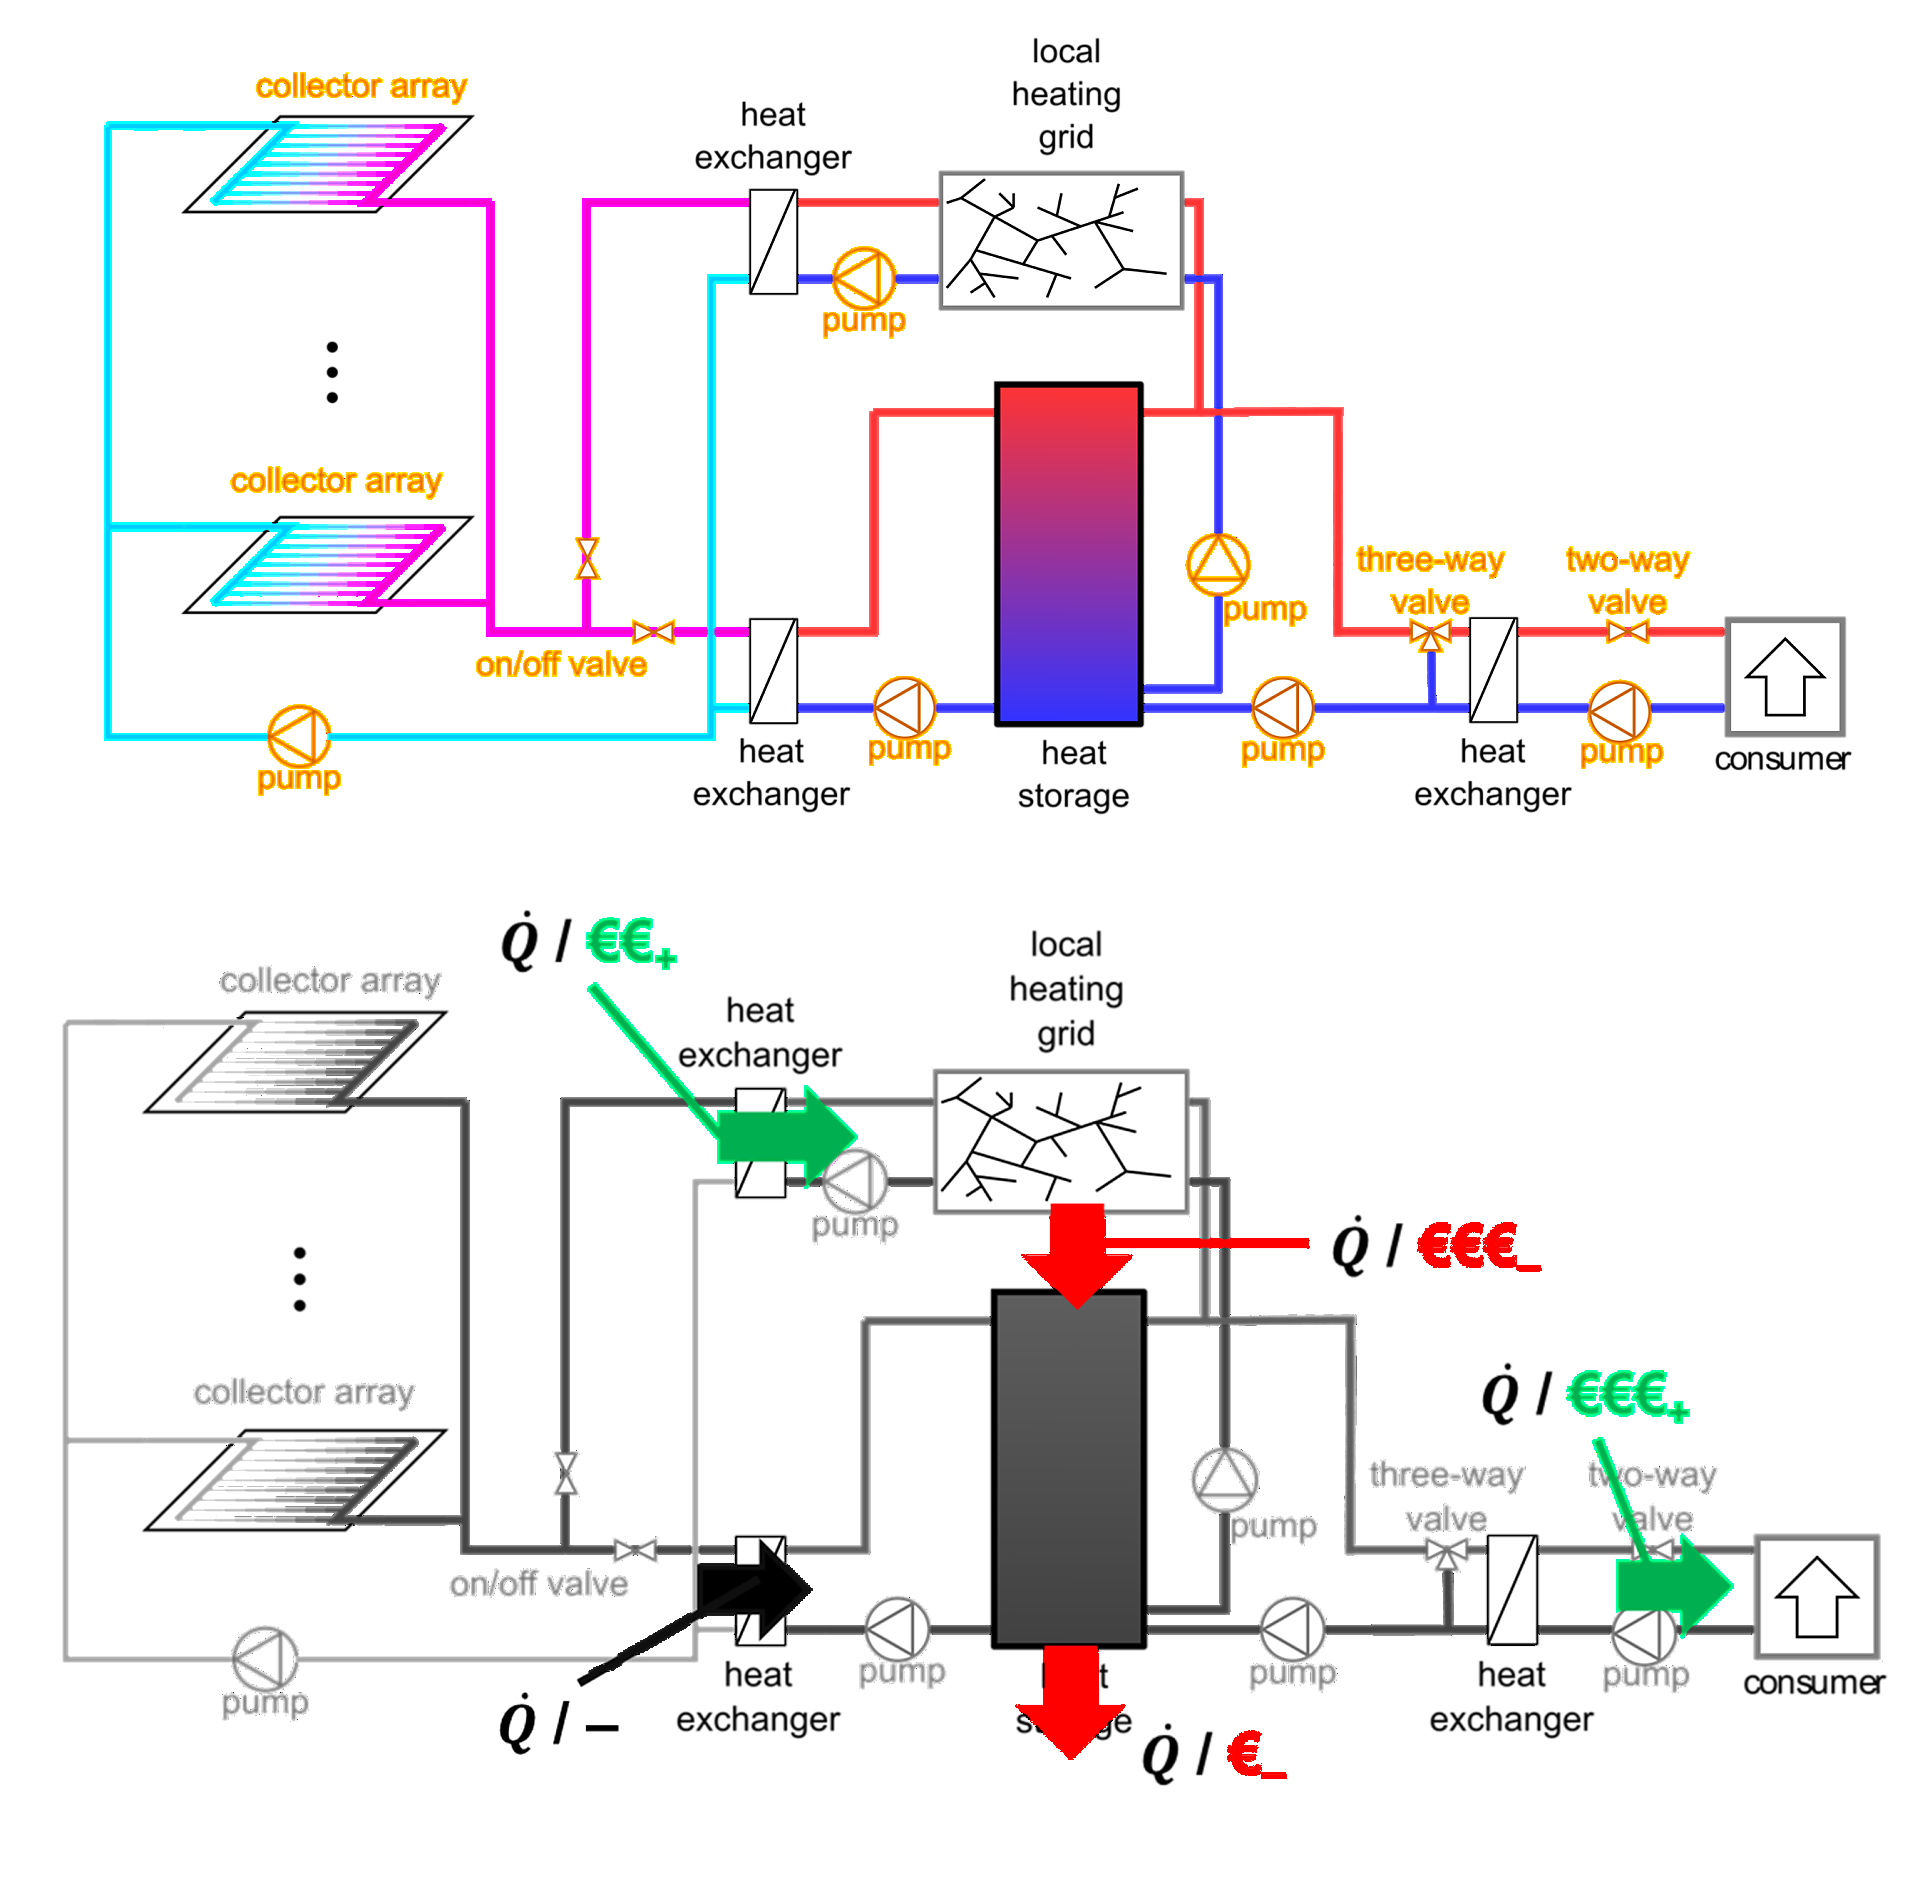
Solare District Heating: Structure, Heat and Revenue Streams
General structure of solar district heating (top) as well as important heat and revenue streams (bottom): The figure shows solar collectors, heat exchangers, a buffer storage, pumps, valves, the grid and consumers.
Copyright: © Dr. Viktor Unterberger / BEST GmbH
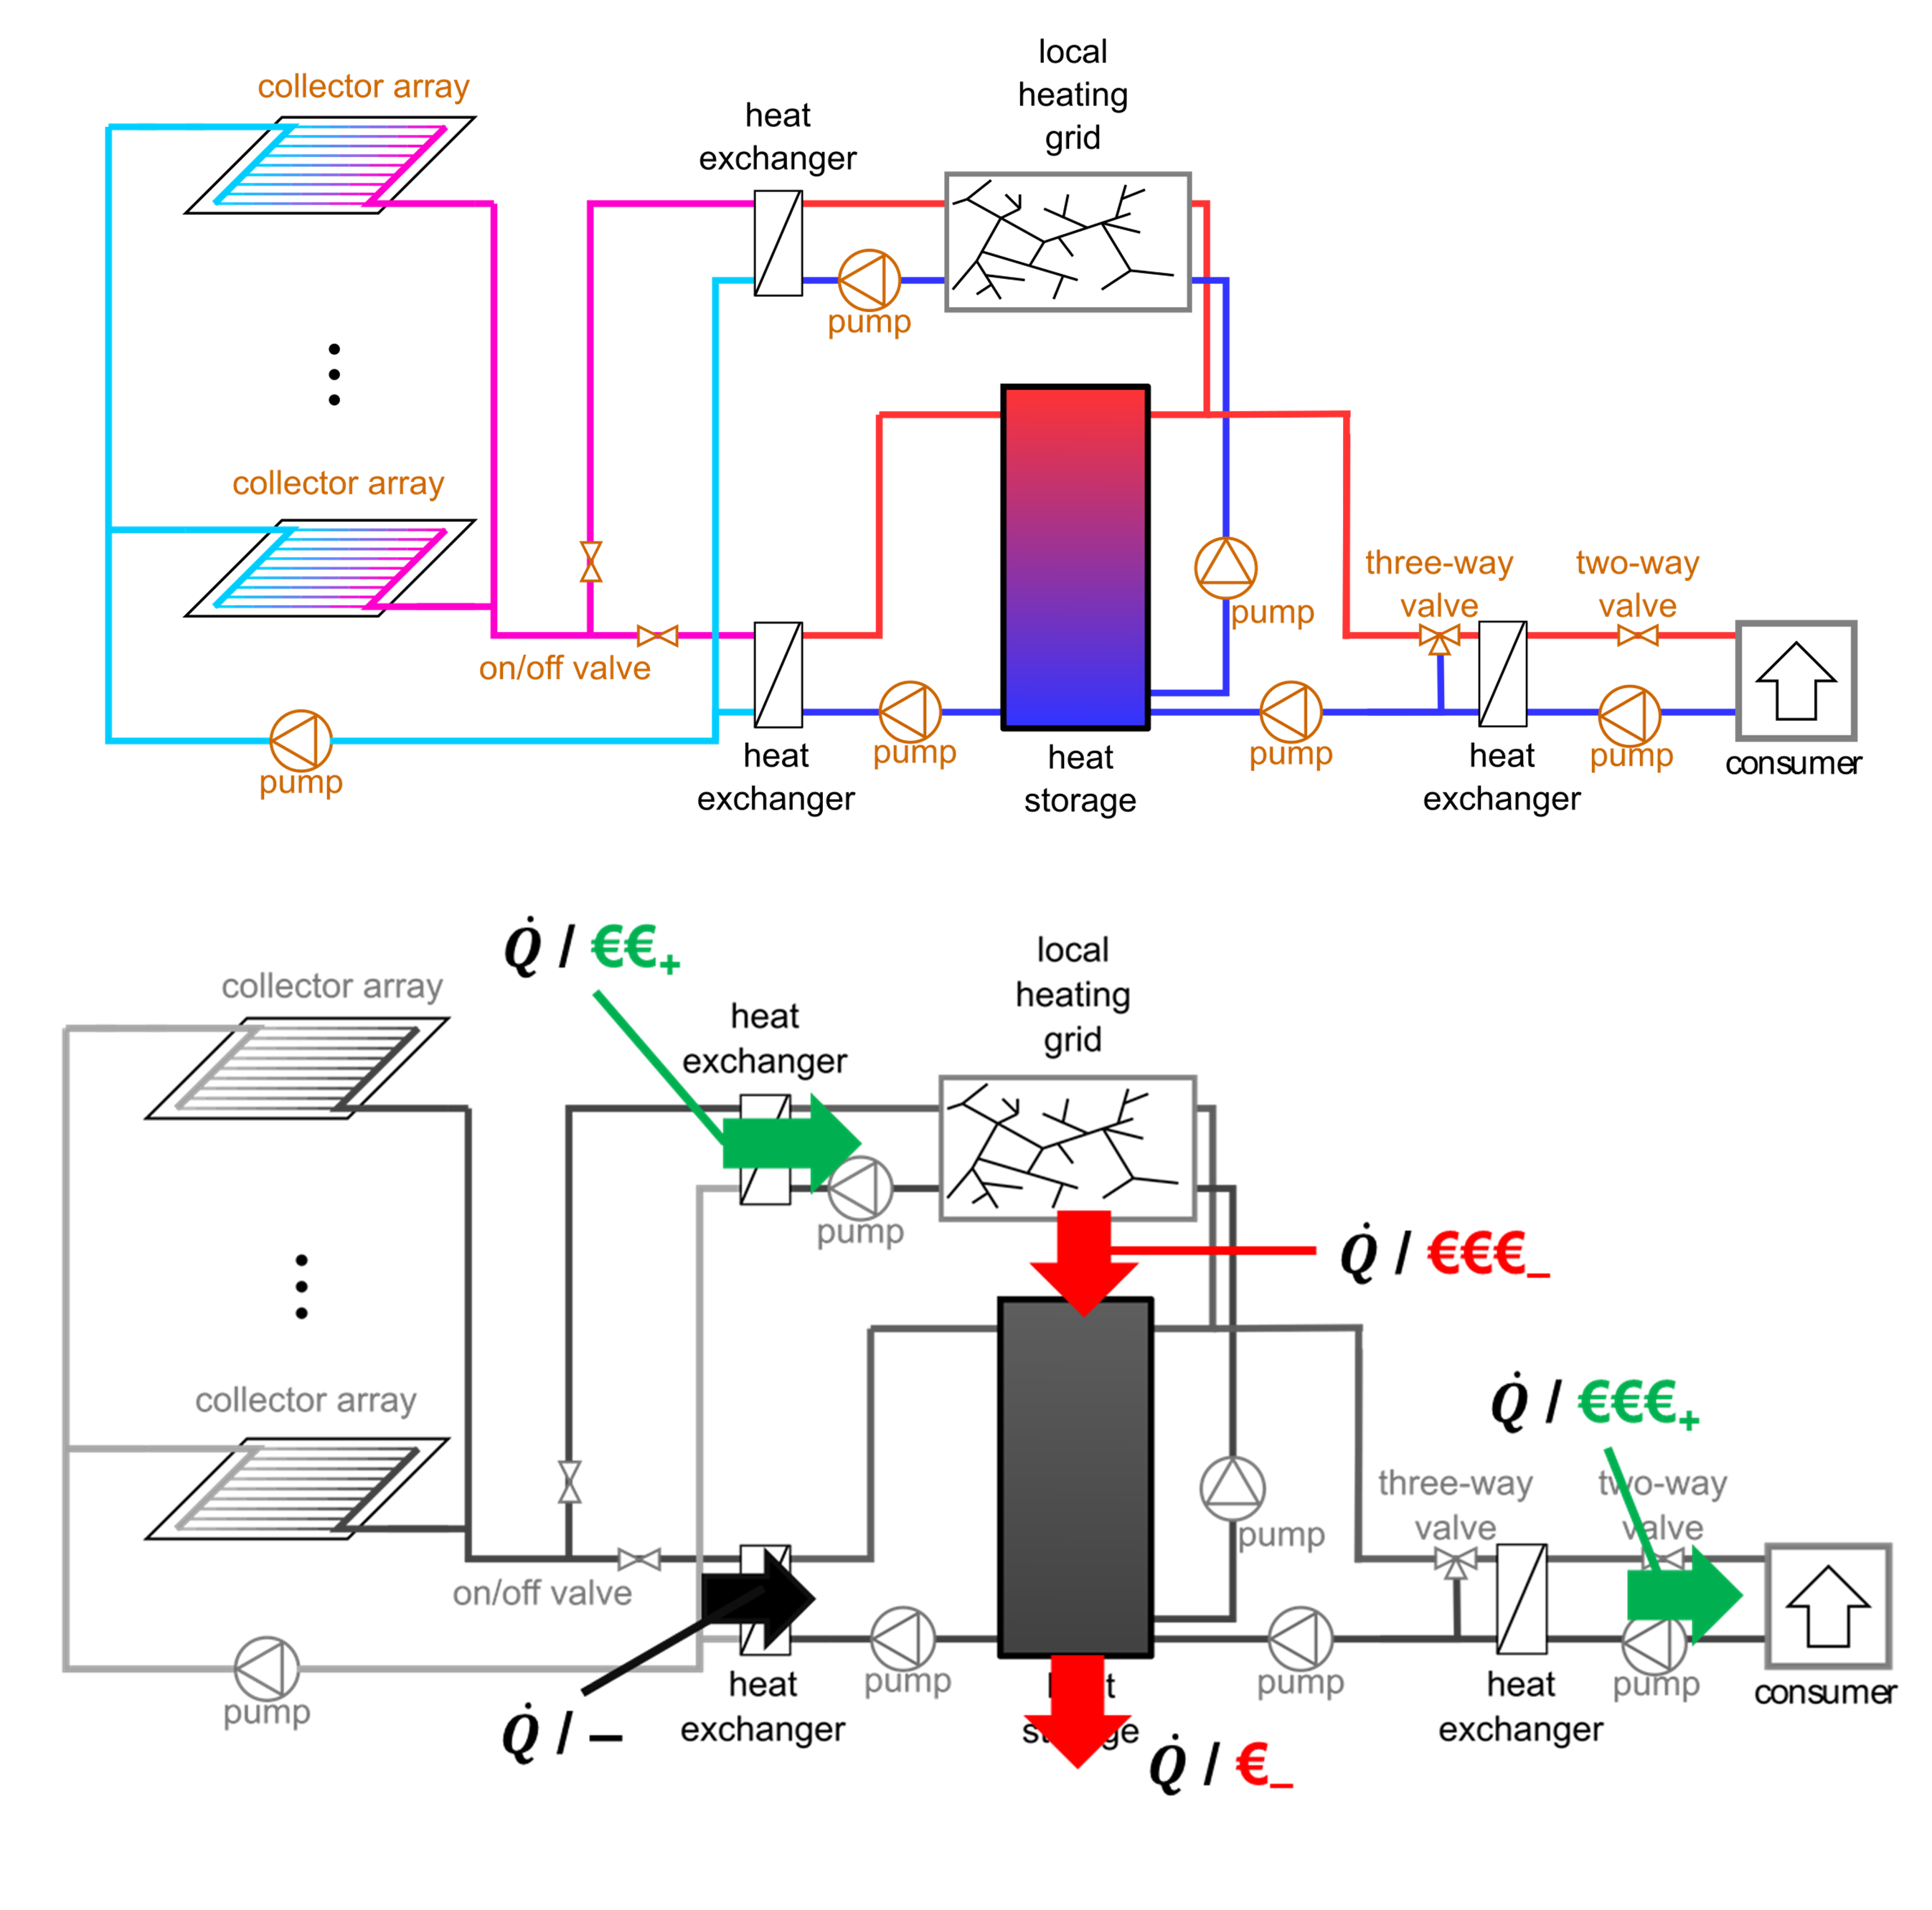
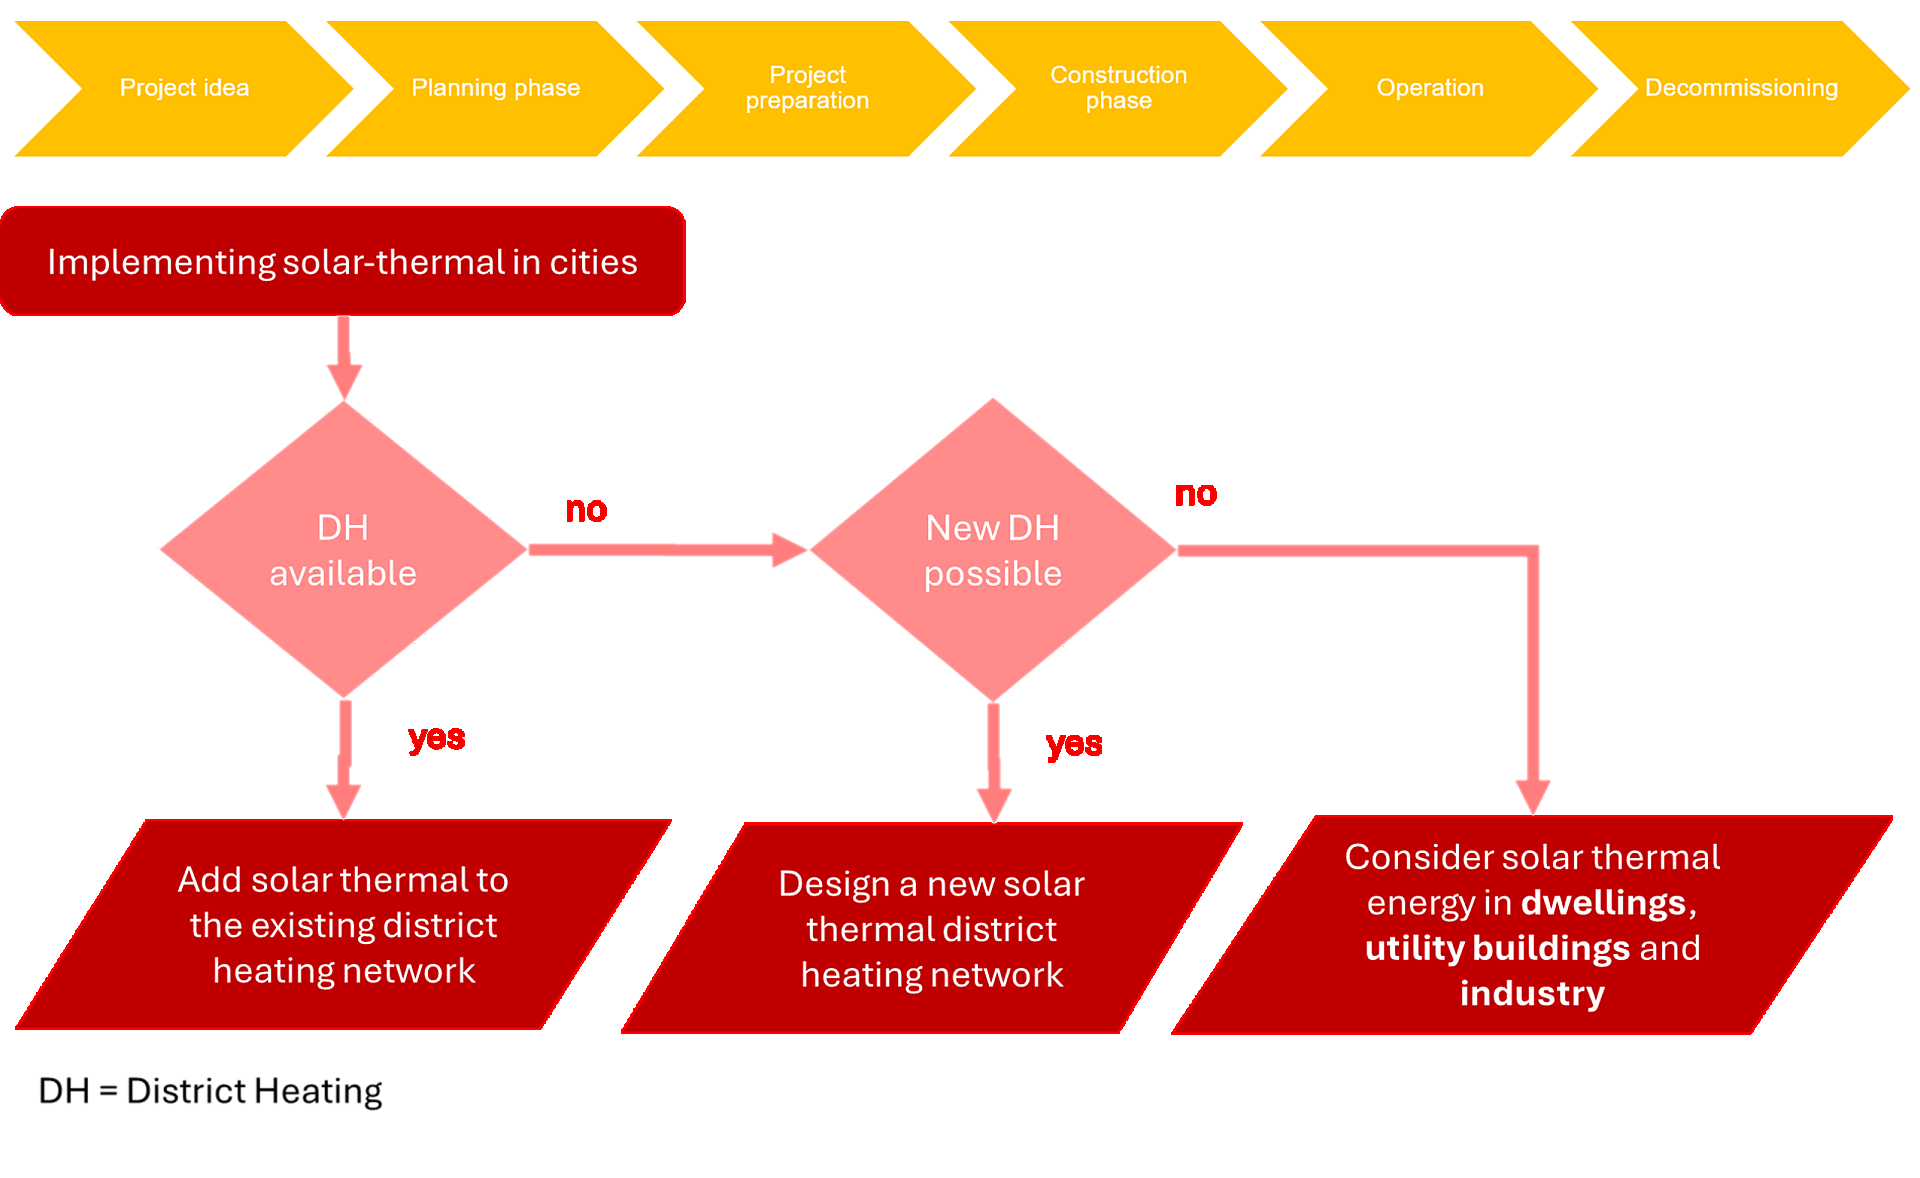
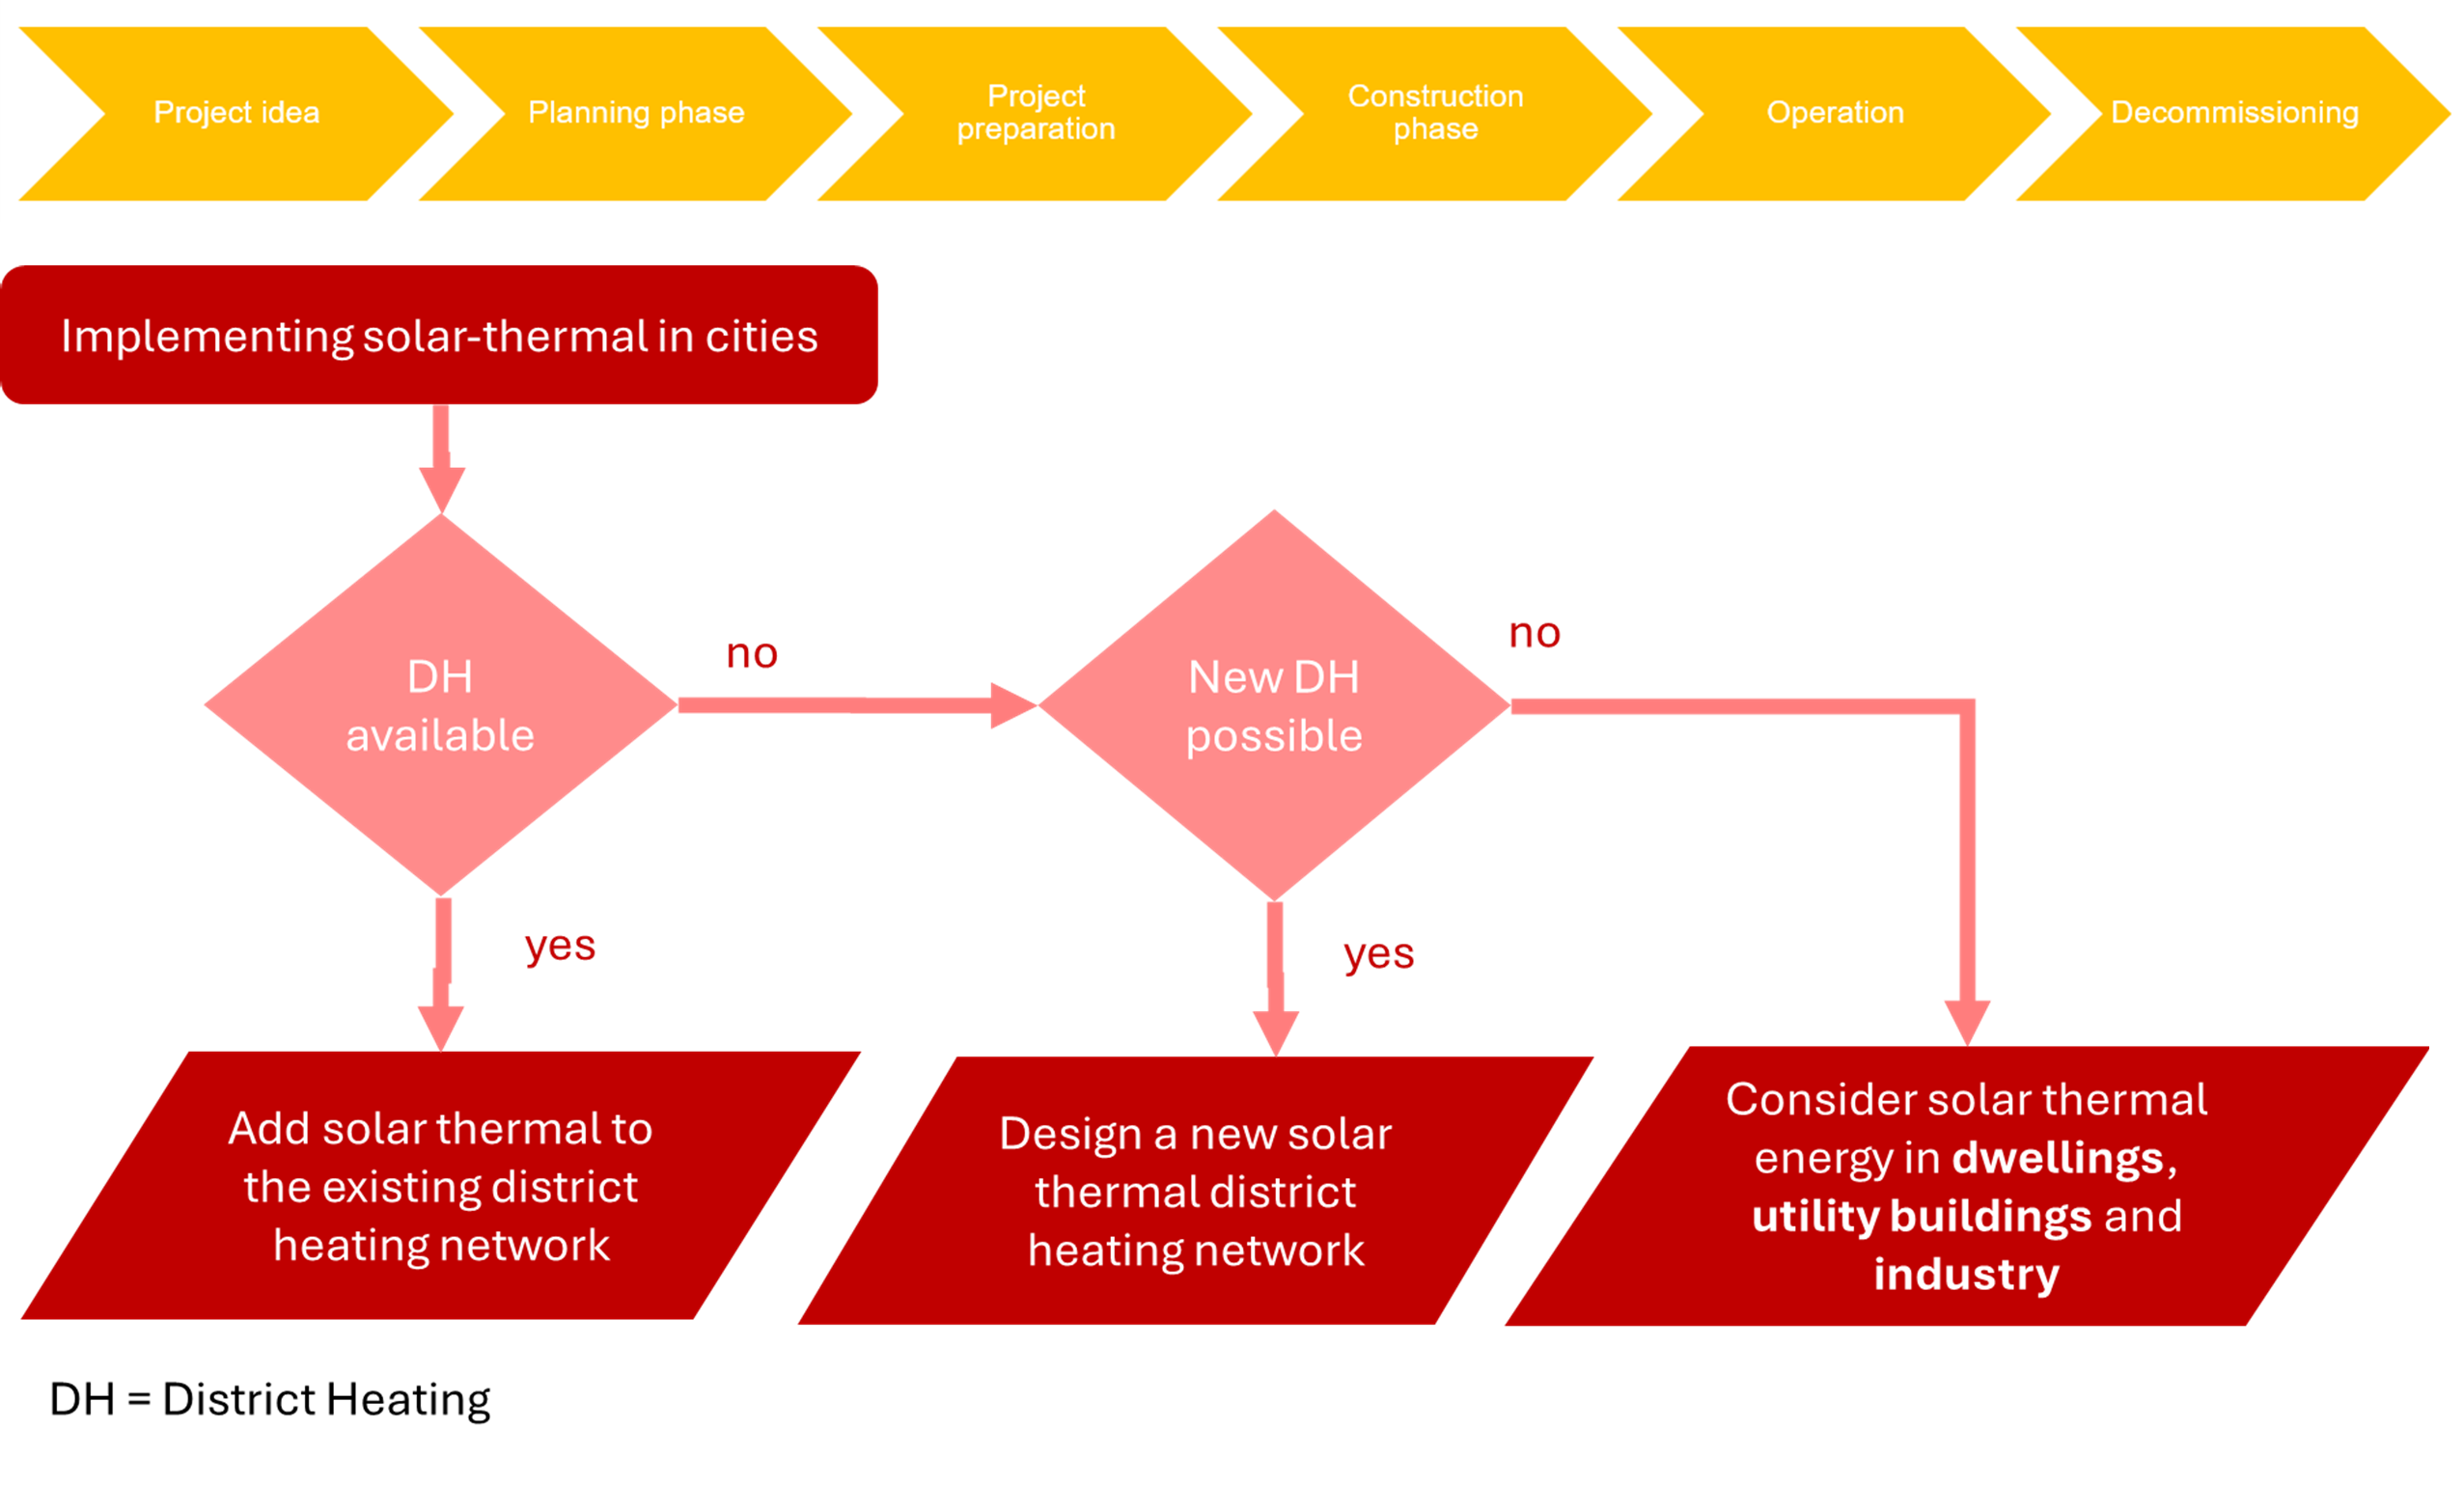
Thermal Solar Plants: Life Cycle and Planning
Stages in the solar thermal plant life cycle (top), flow chart for the decision about implementation of solar district heating (bottom)
Copyright: © IEA SHC Task 68 – Subtask C
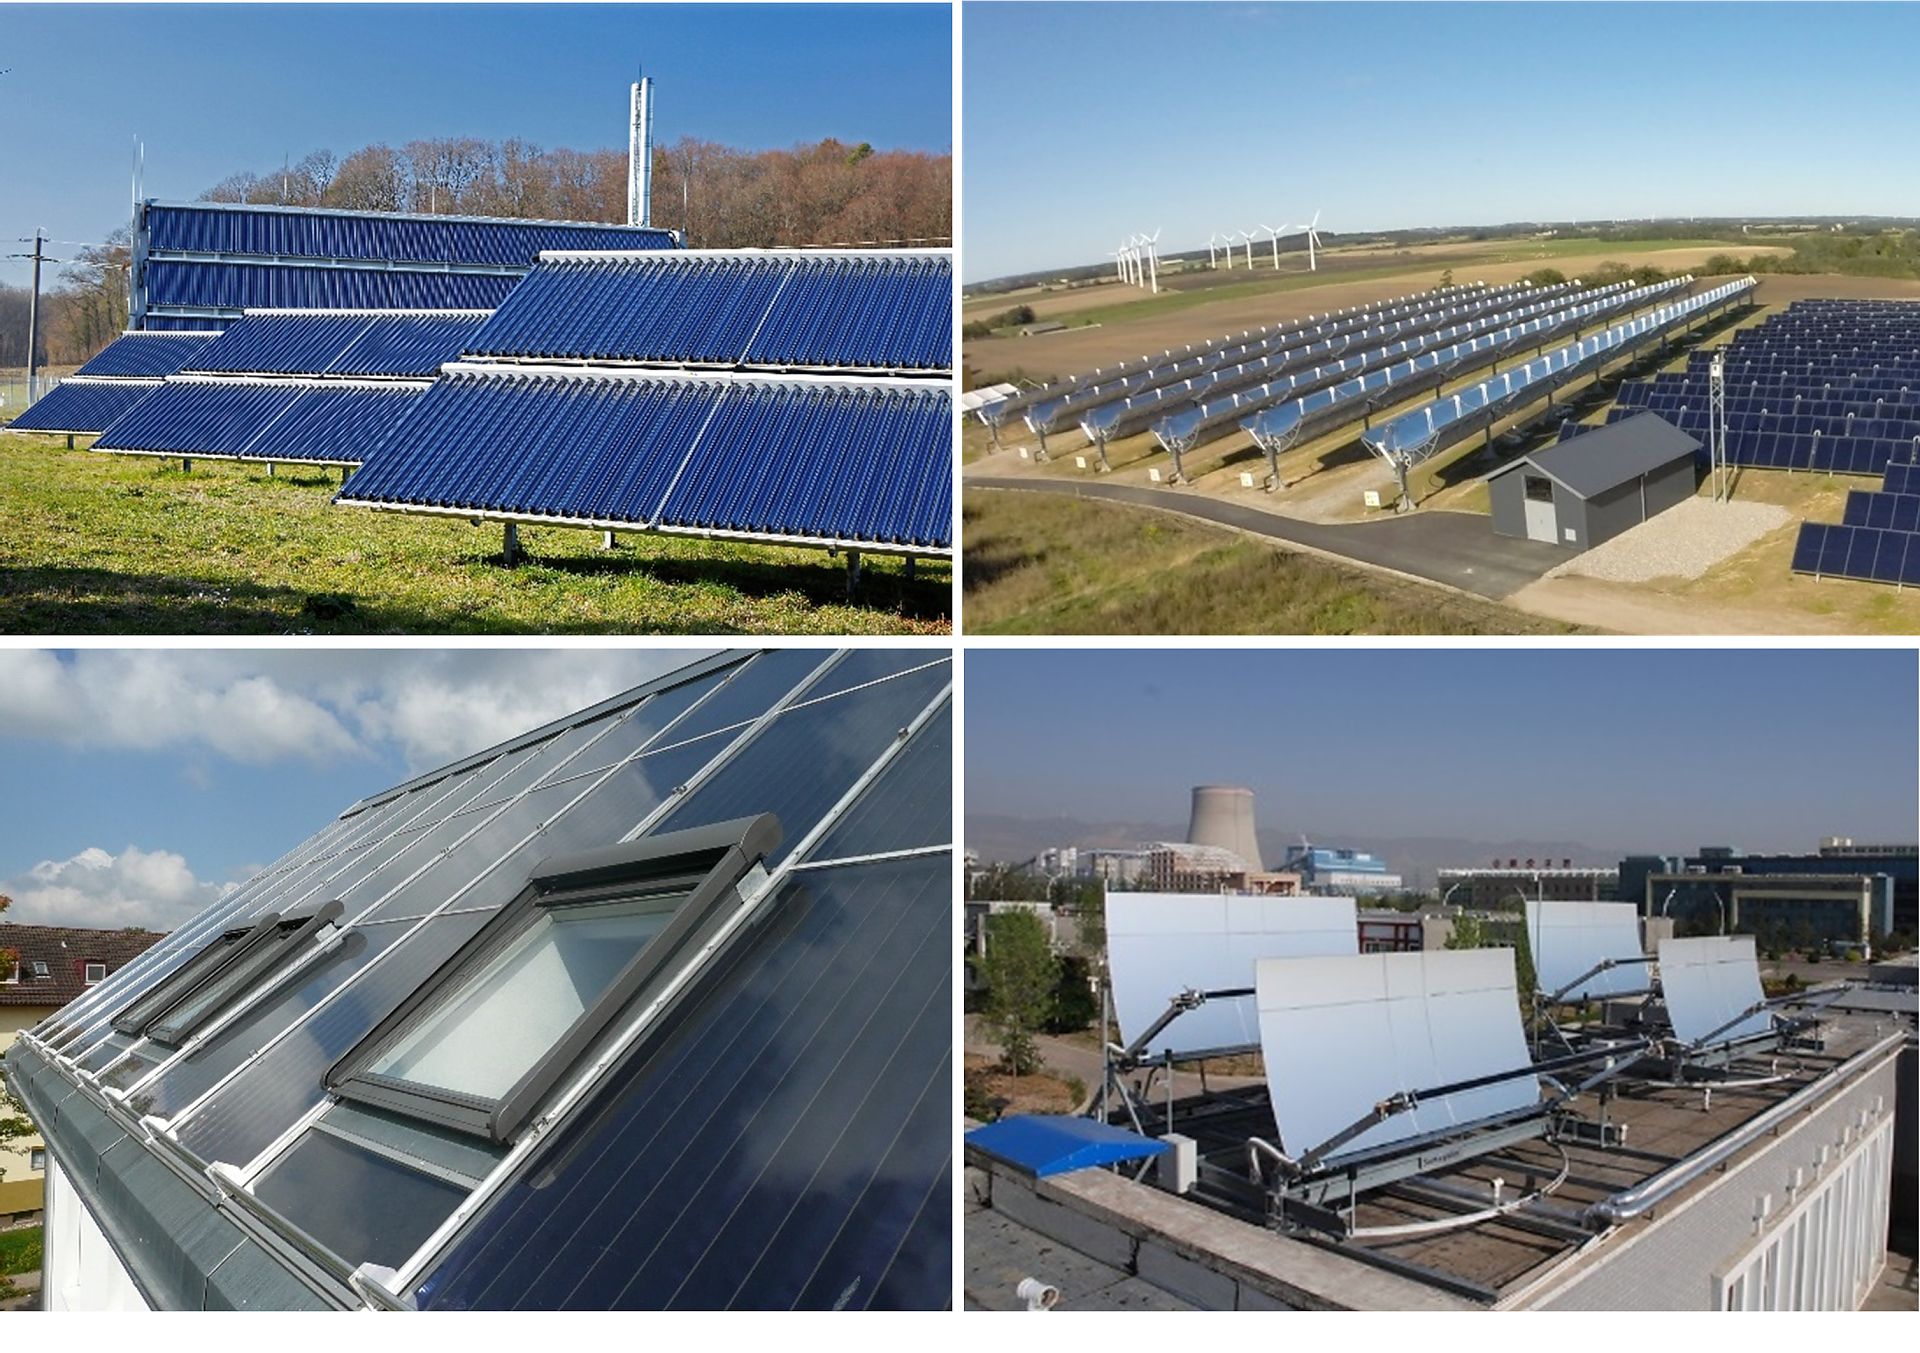
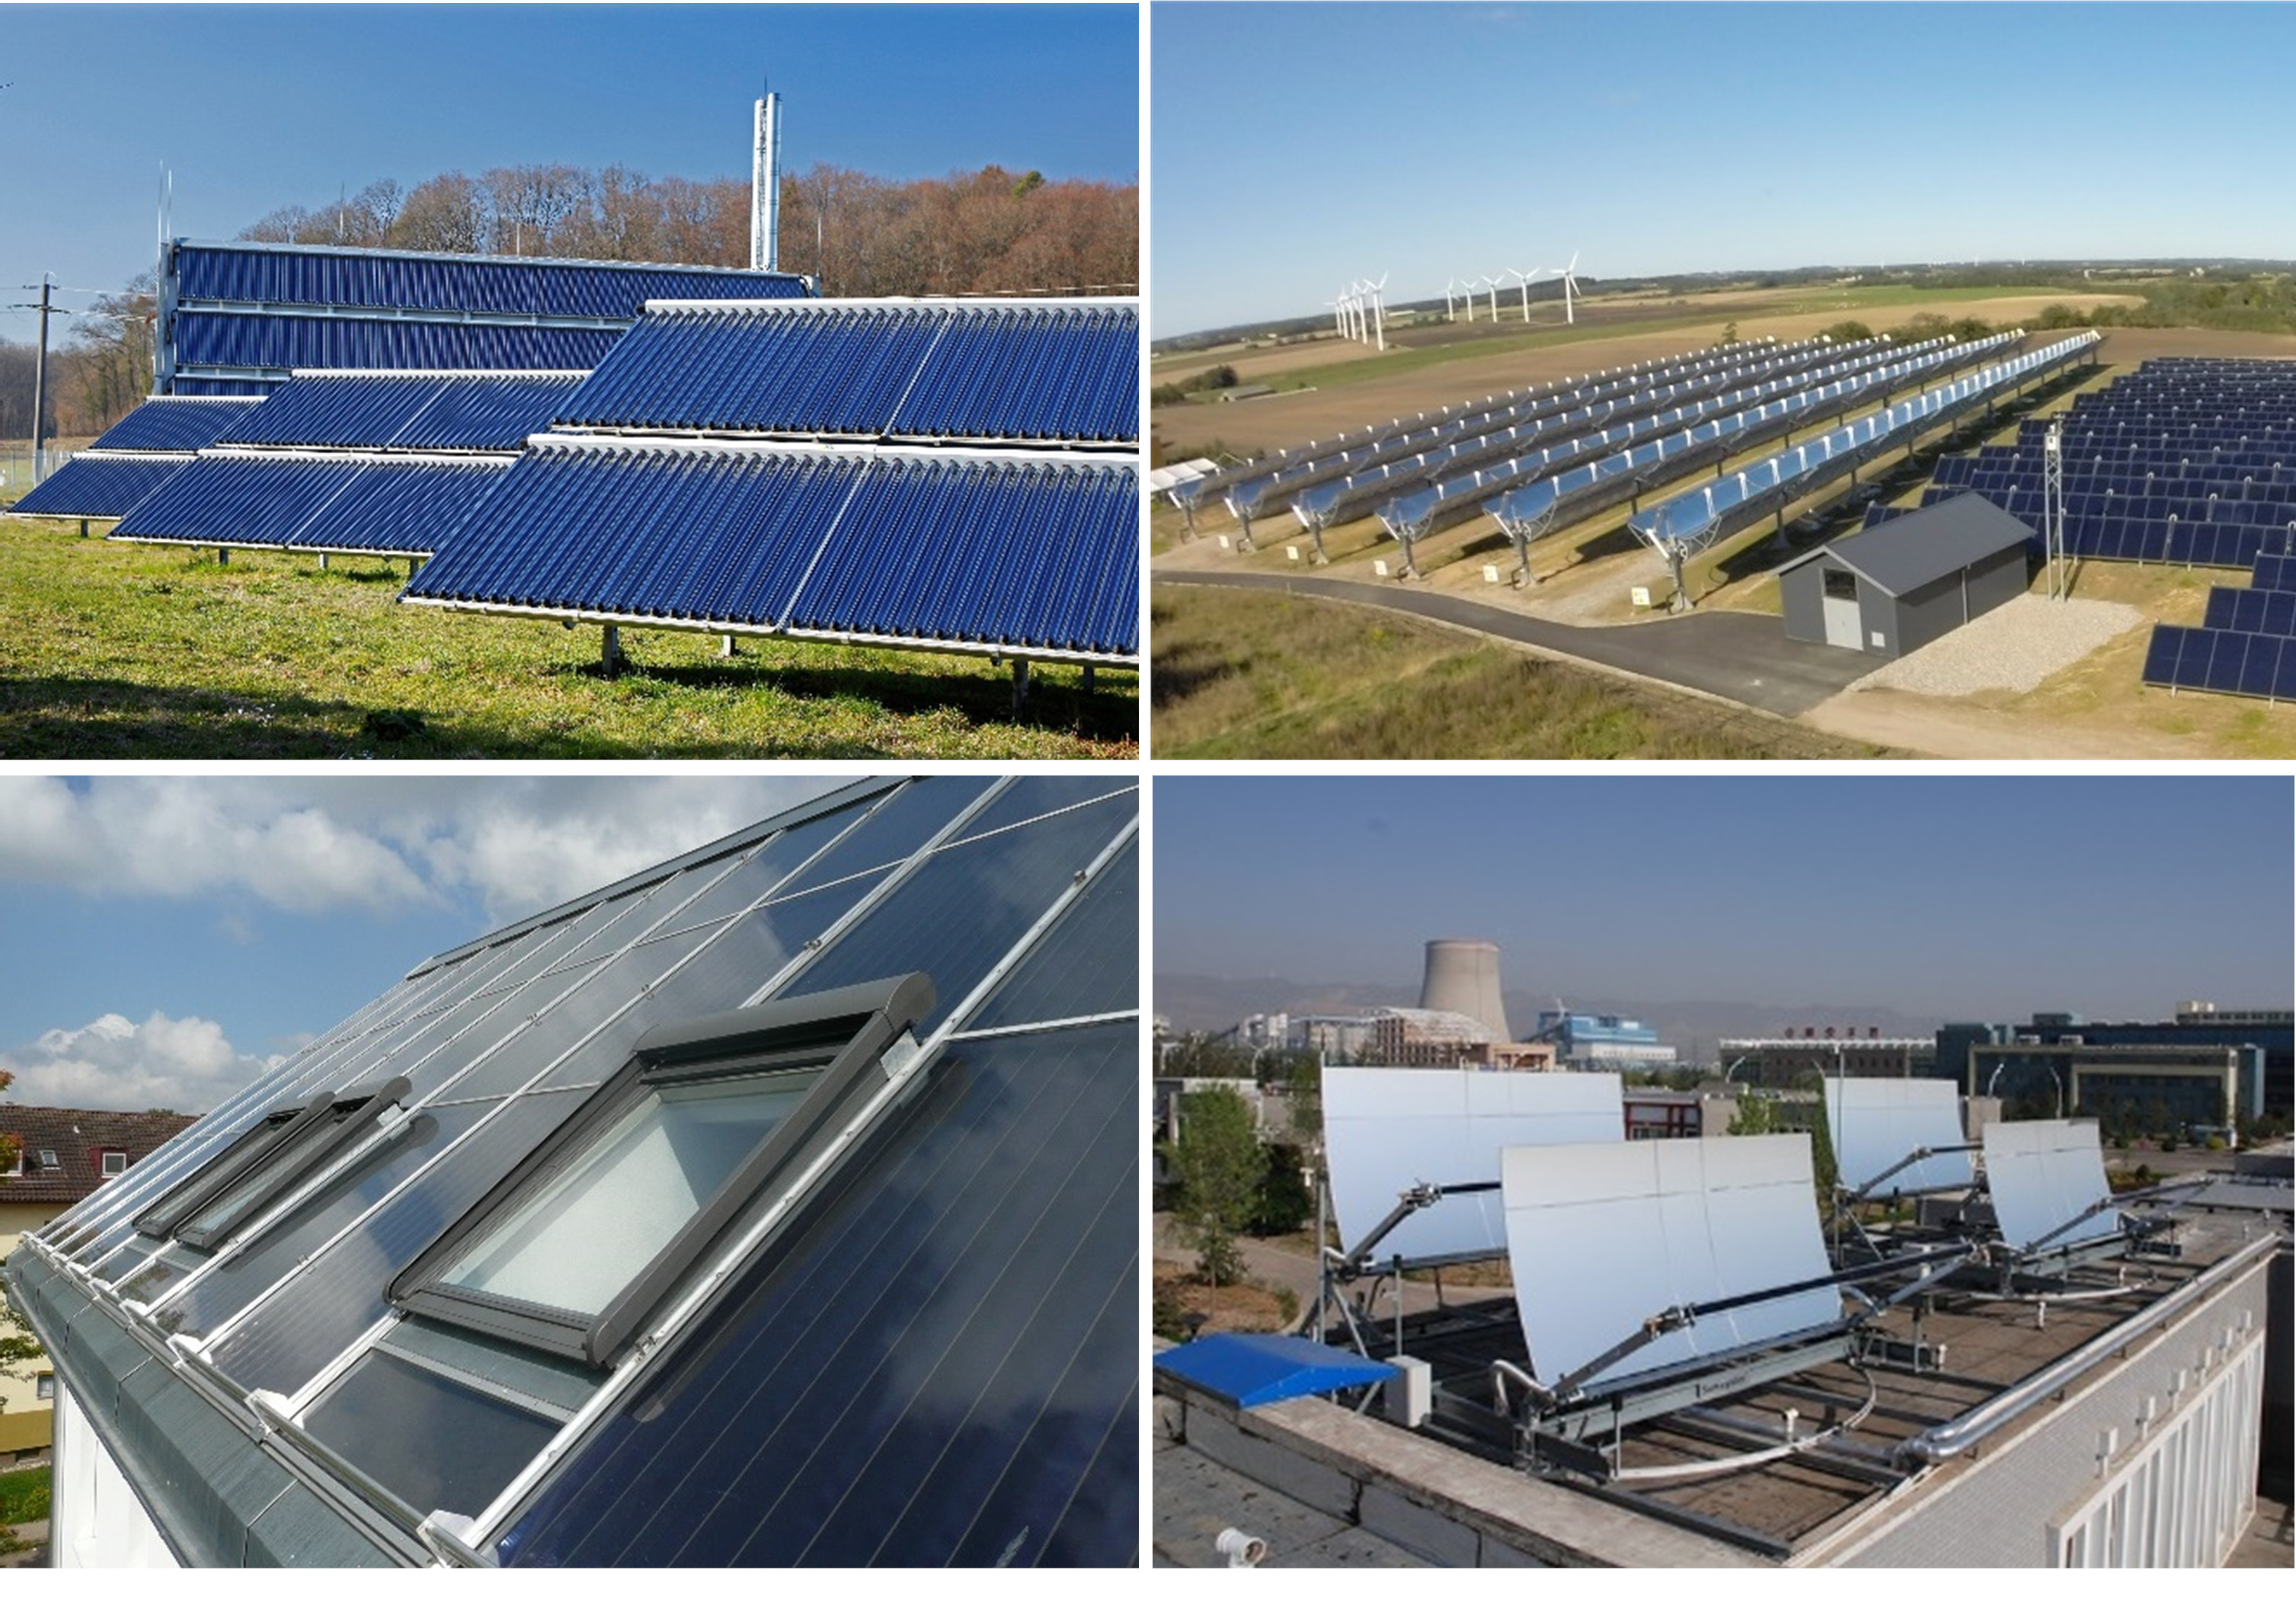
Examples for modern solar thermal collectors
Ground mounted evacuated tube collectors in Büsingen, Germany; combination of flat plate collectors and parabolic trough collectors in Taars, Denmark; roof integrated solar thermal collectors on “solar@home” building in Crailsheim, Germany; demo system of Sun Oyster on a flat roof in Zhangjiakou, China
Copyright: © Solites, Aalborg CSP und sunoyster.com

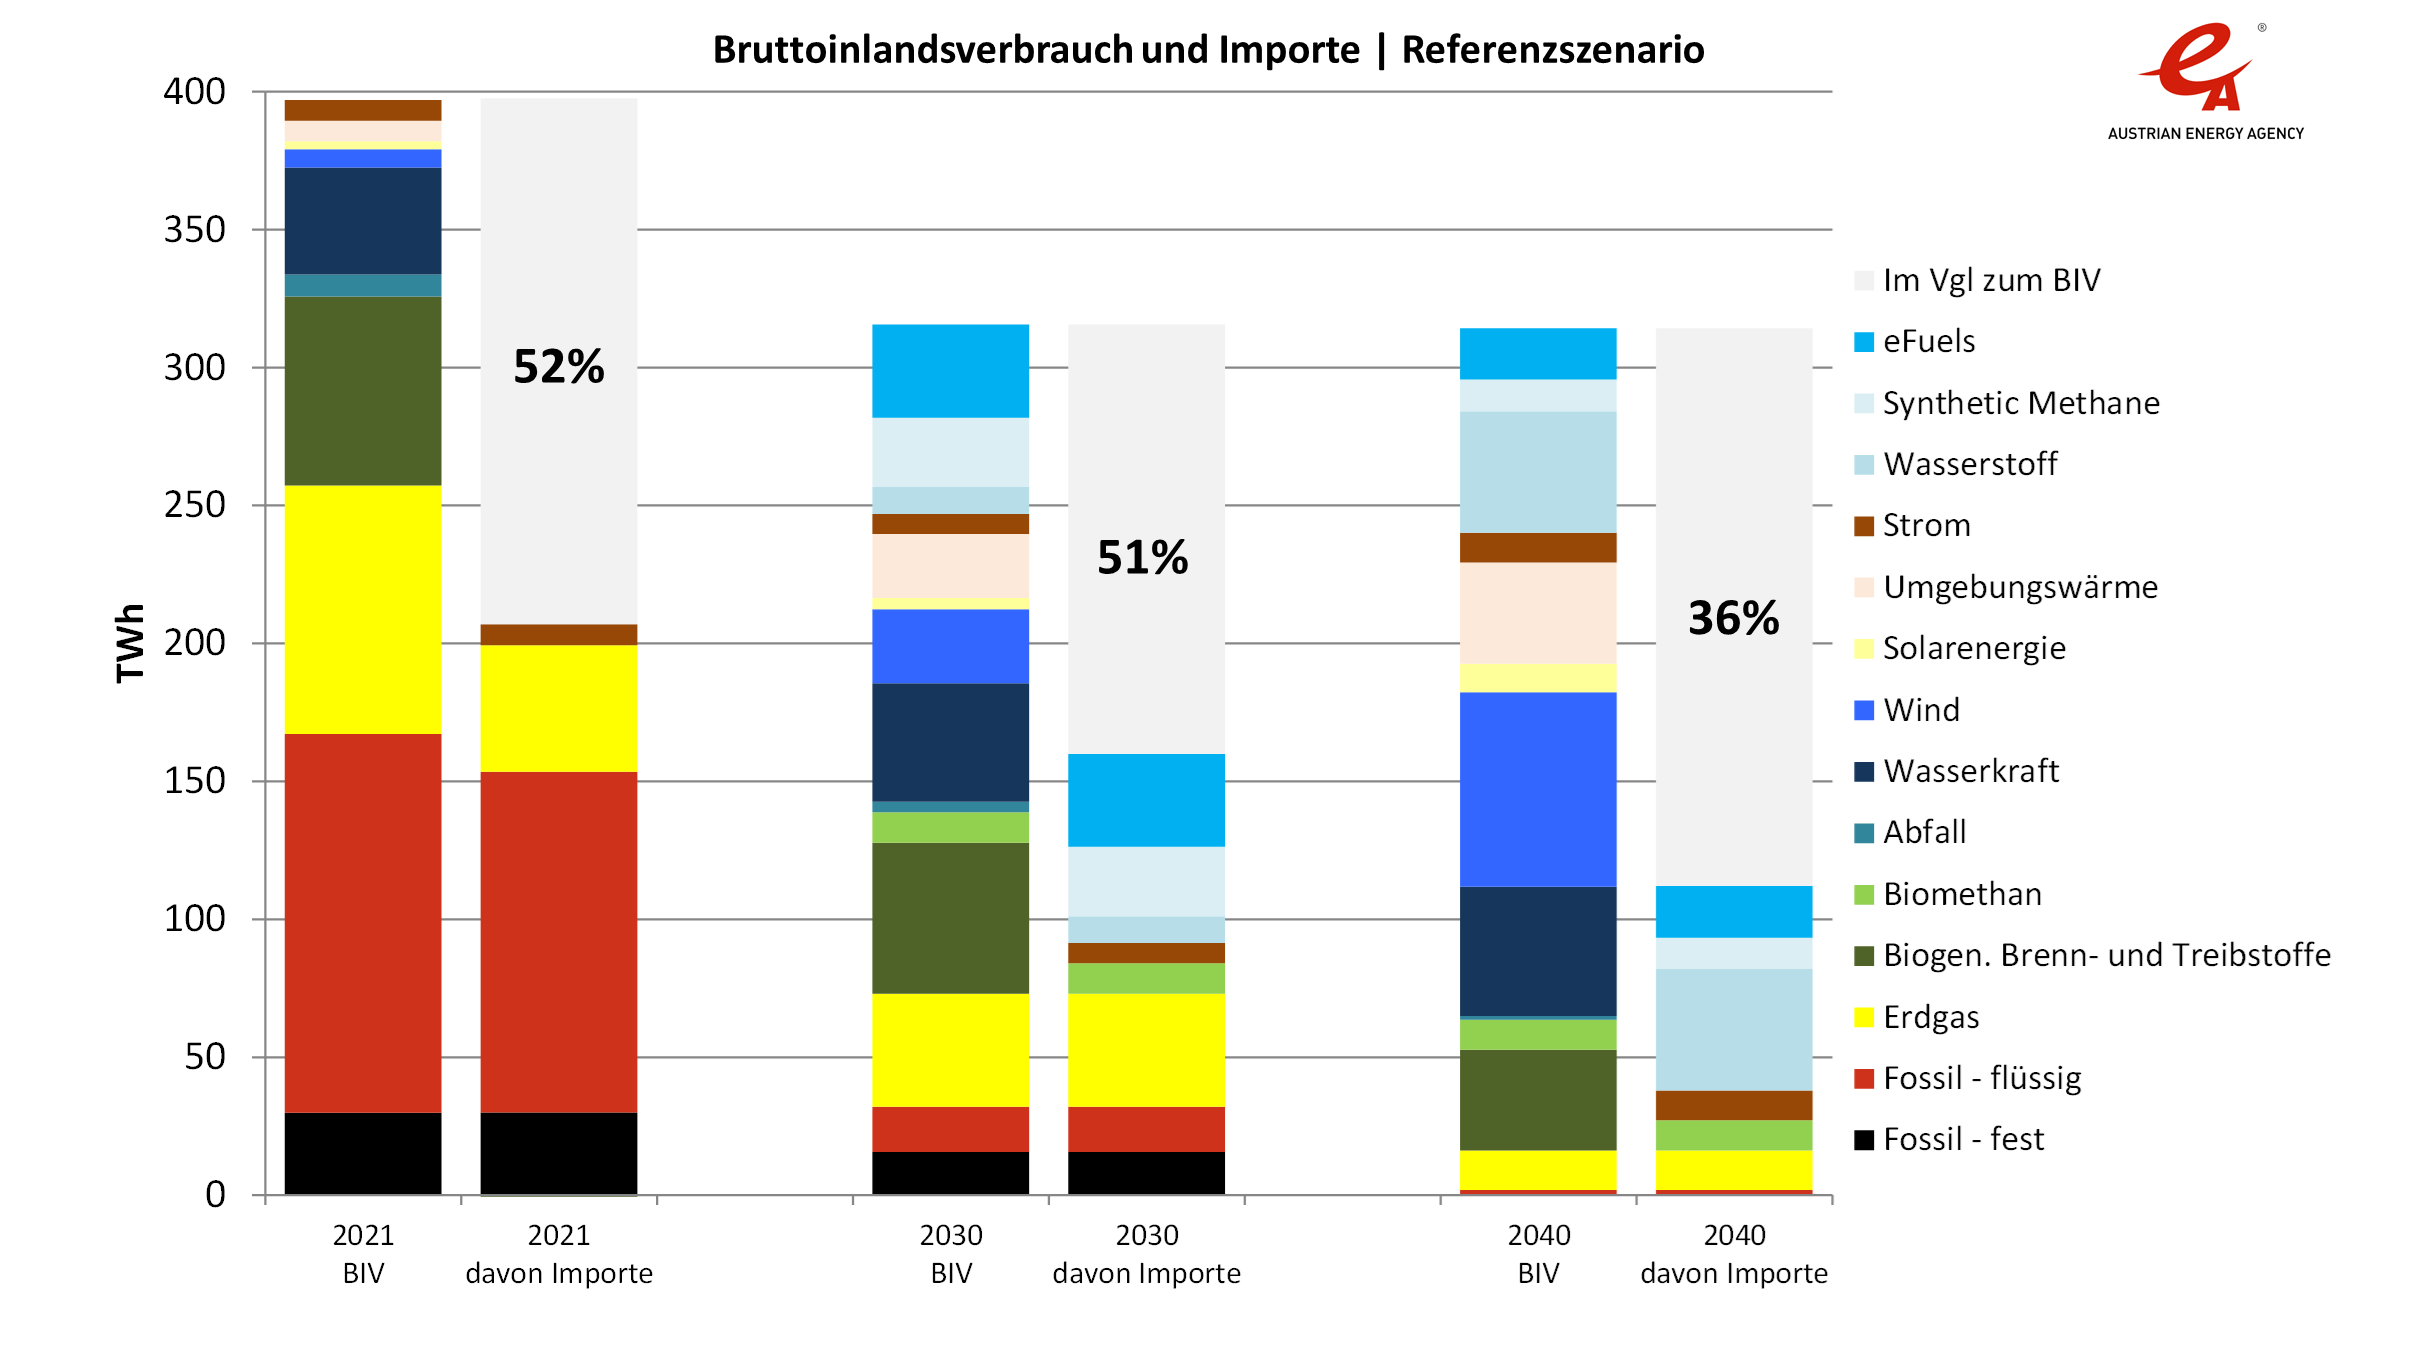
Gross domestic consumption in the reference scenario
The figure shows the gross domestic consumption of the individual energy sources in 2021, 2030 and 2040 in the Reference scenario. The quantitative description of the figure can be found in the report in section 5.4.1 in the text for Figure 9.
Copyright: Martin Baumann/Österreichische Energieagentur

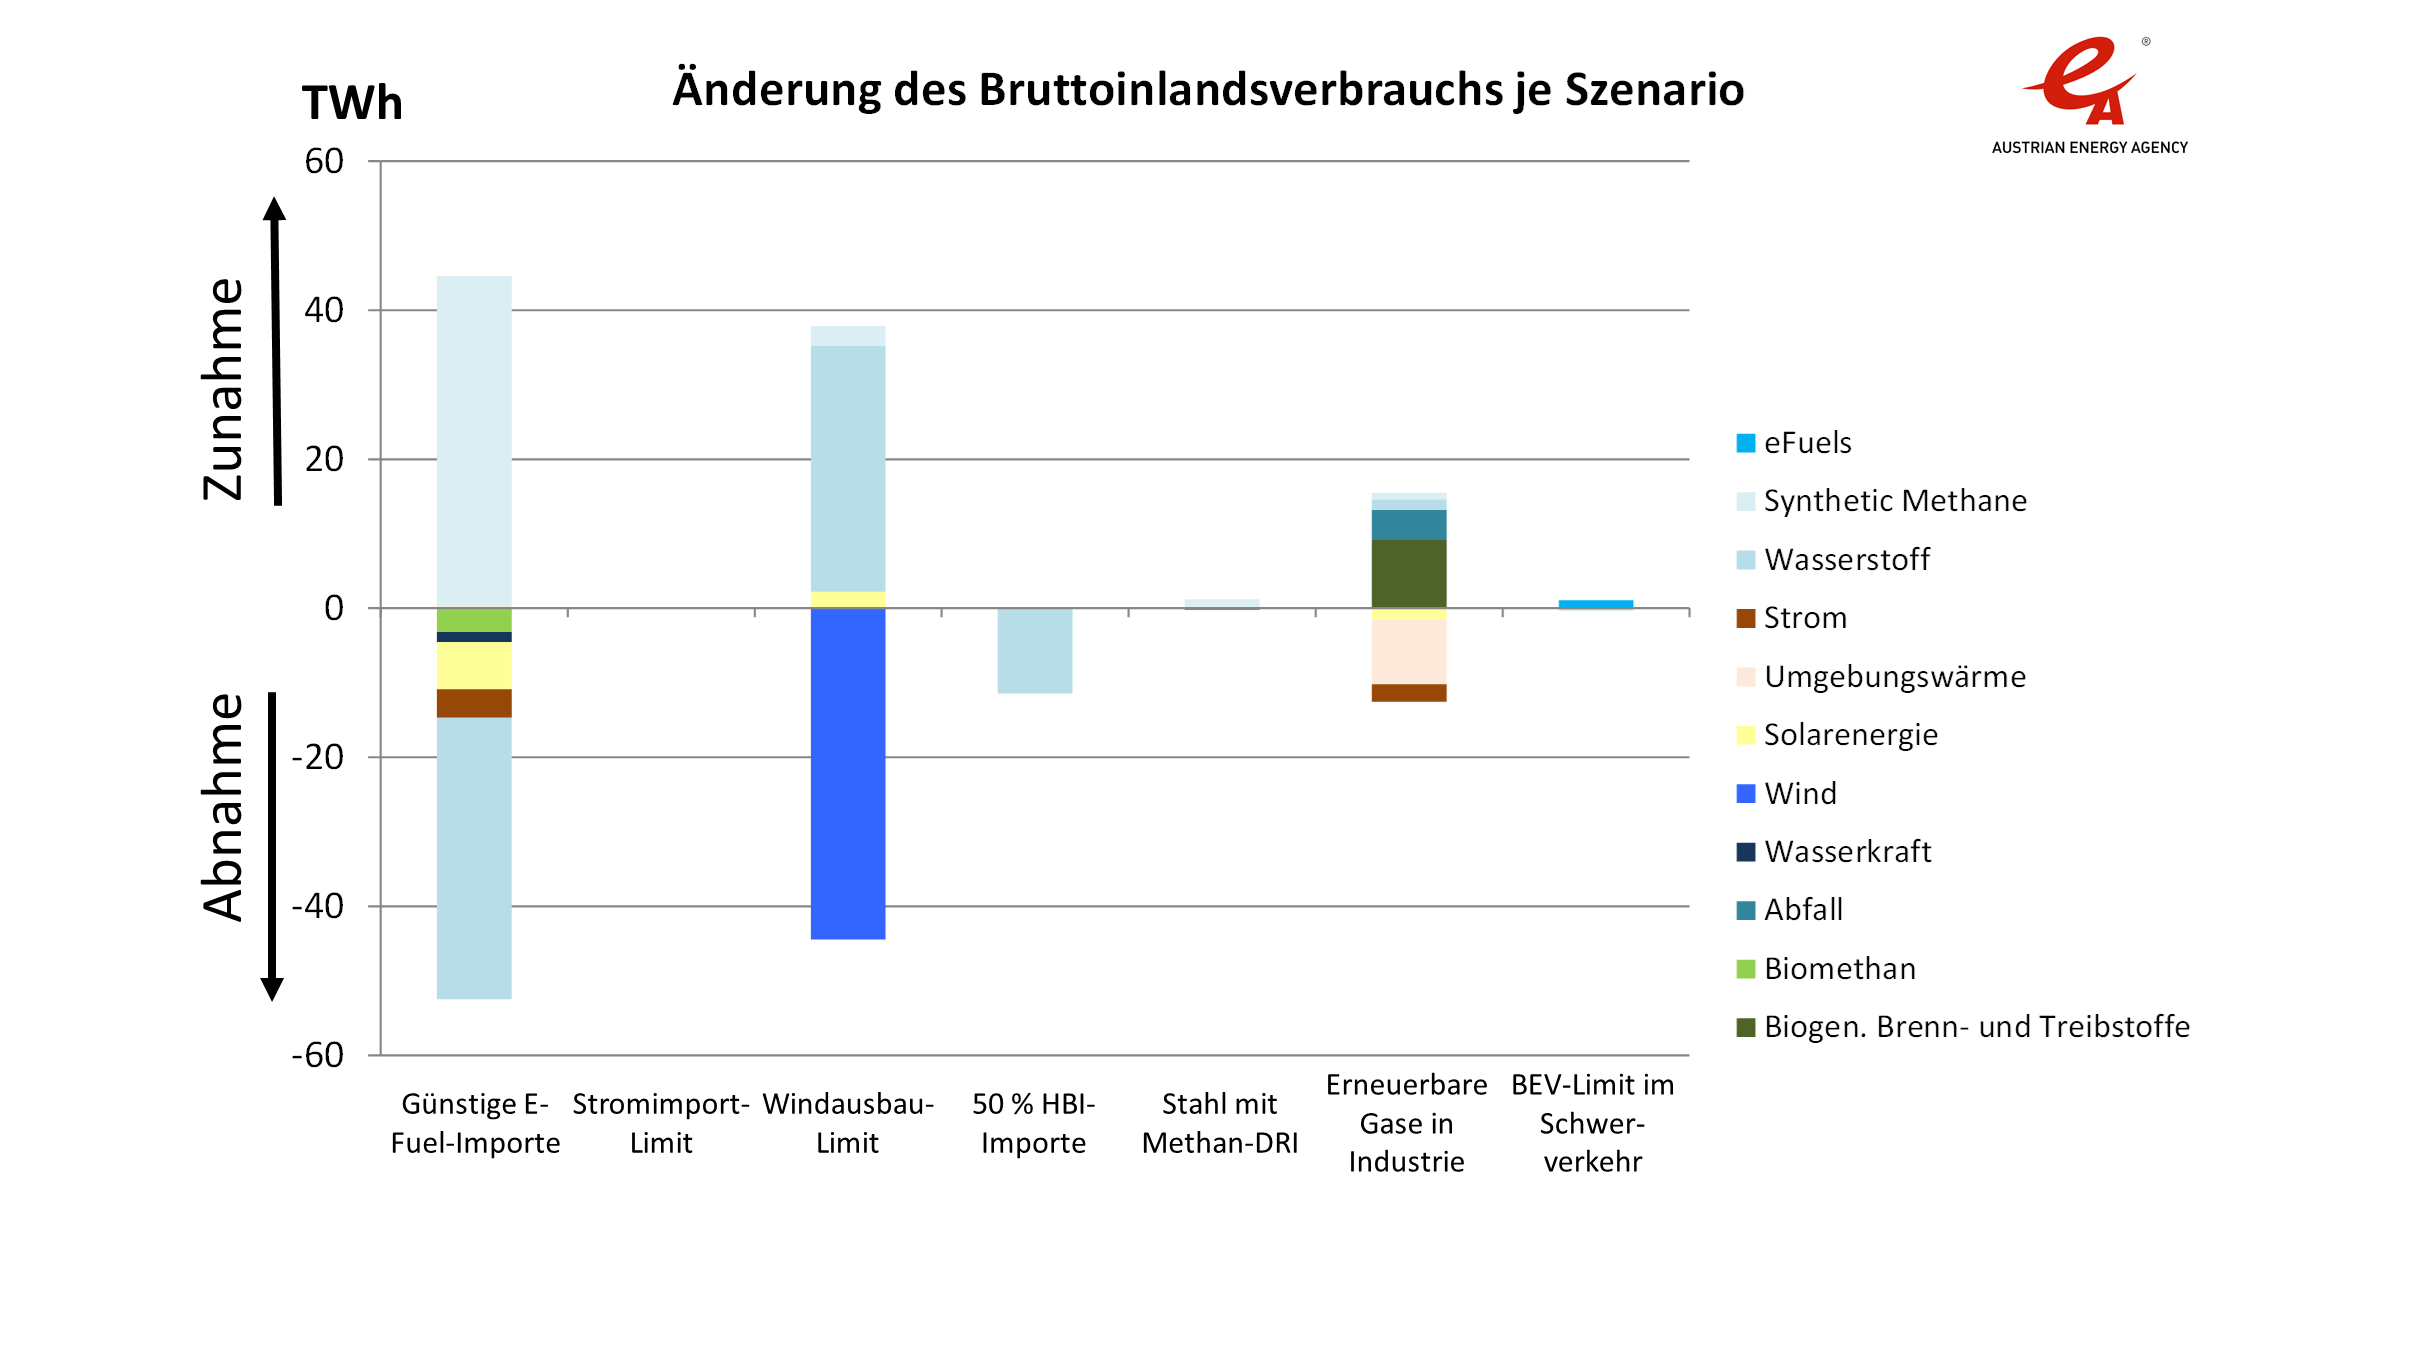
Change in gross domestic consumption in 2040 in the scenario variants
The figure shows the change in gross domestic consumption of the individual energy sources in 2040 due to the variation in scenario assumptions. The quantitative description of the figure can be found in the report in Section 5.4.2 in the text for Figure 15.
Copyright: Martin Baumann/Österreichische Energieagentur
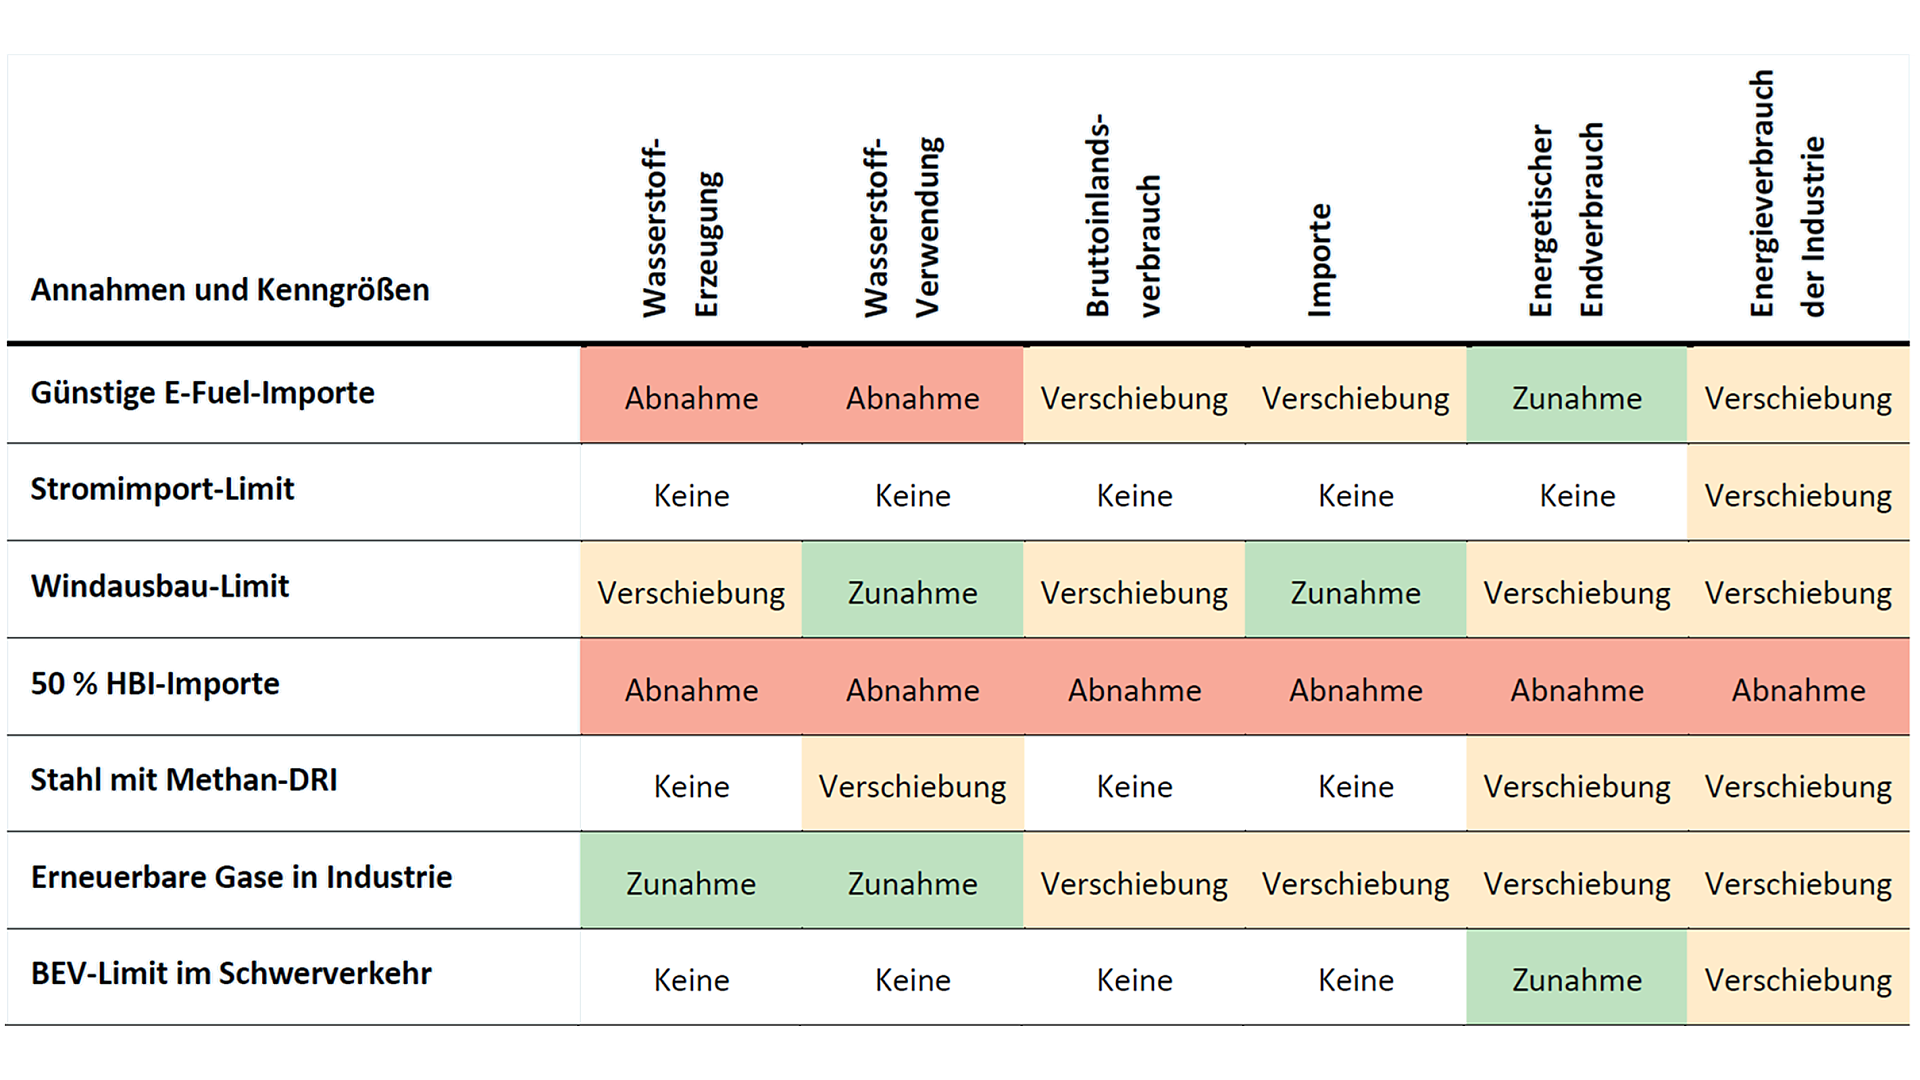
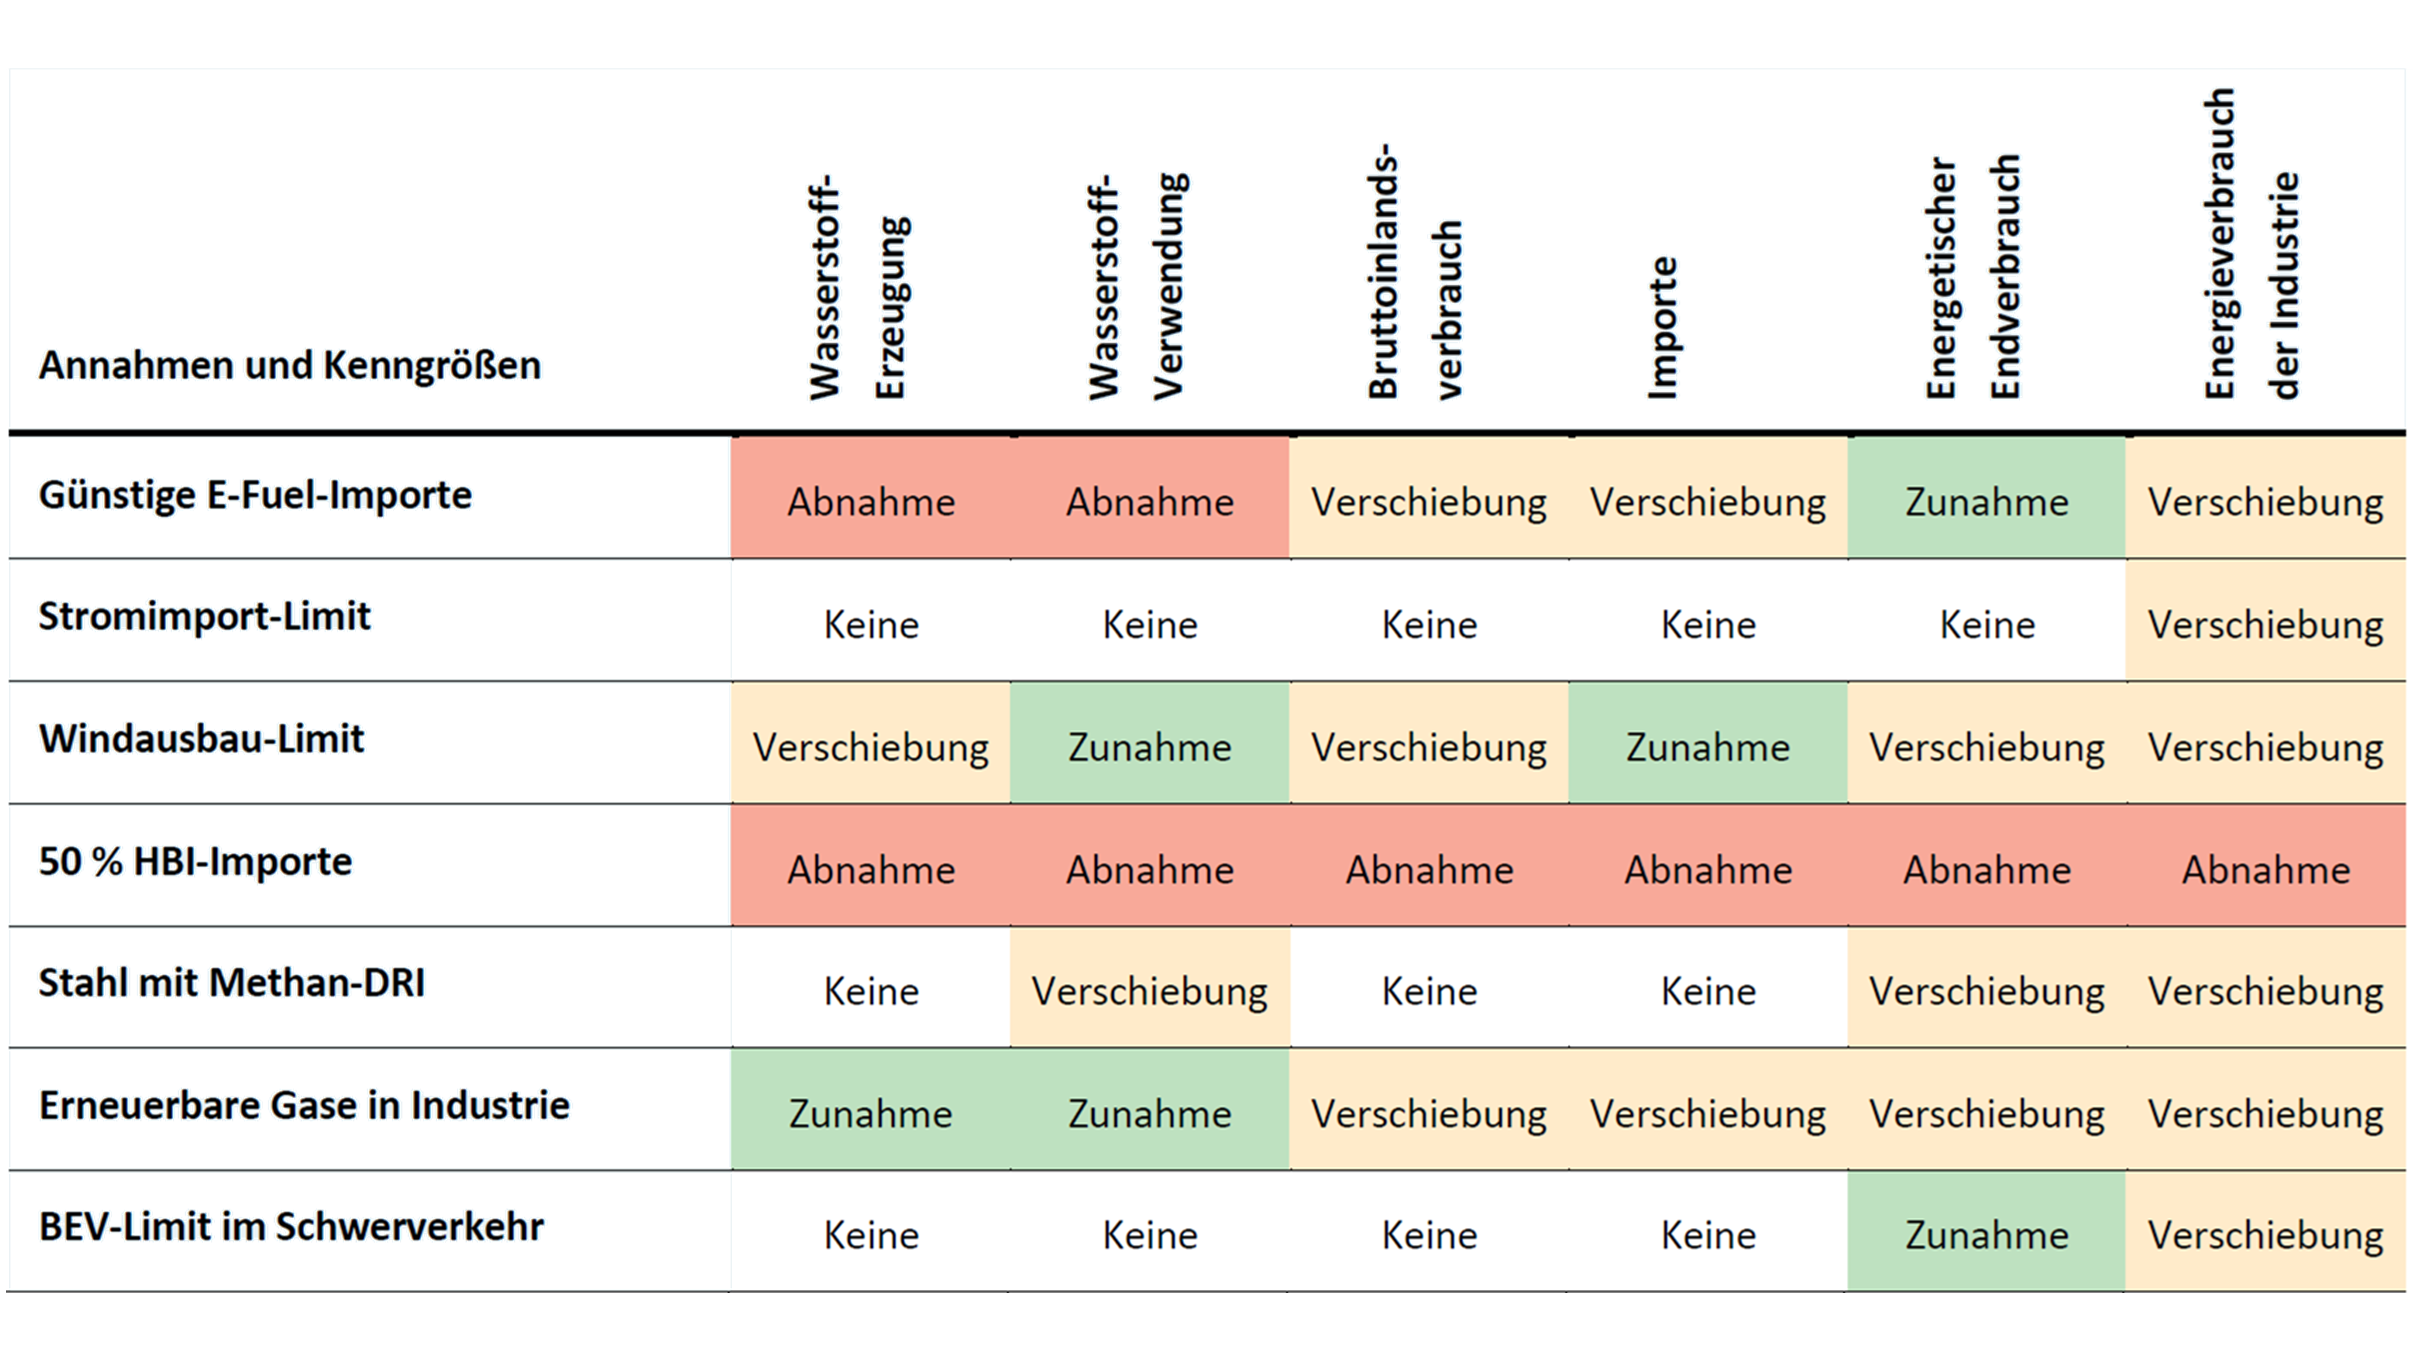
Qualitative effects of varying the scenario assumptions on selected scenario results
The figure shows the qualitative effects of varying the scenario assumptions on selected scenario results in a table. The quantitative description of the figure can be found in the report in Section 5.4.3 in Table 20.
Copyright: Martin Baumann/Österreichische Energieagentur
Methods
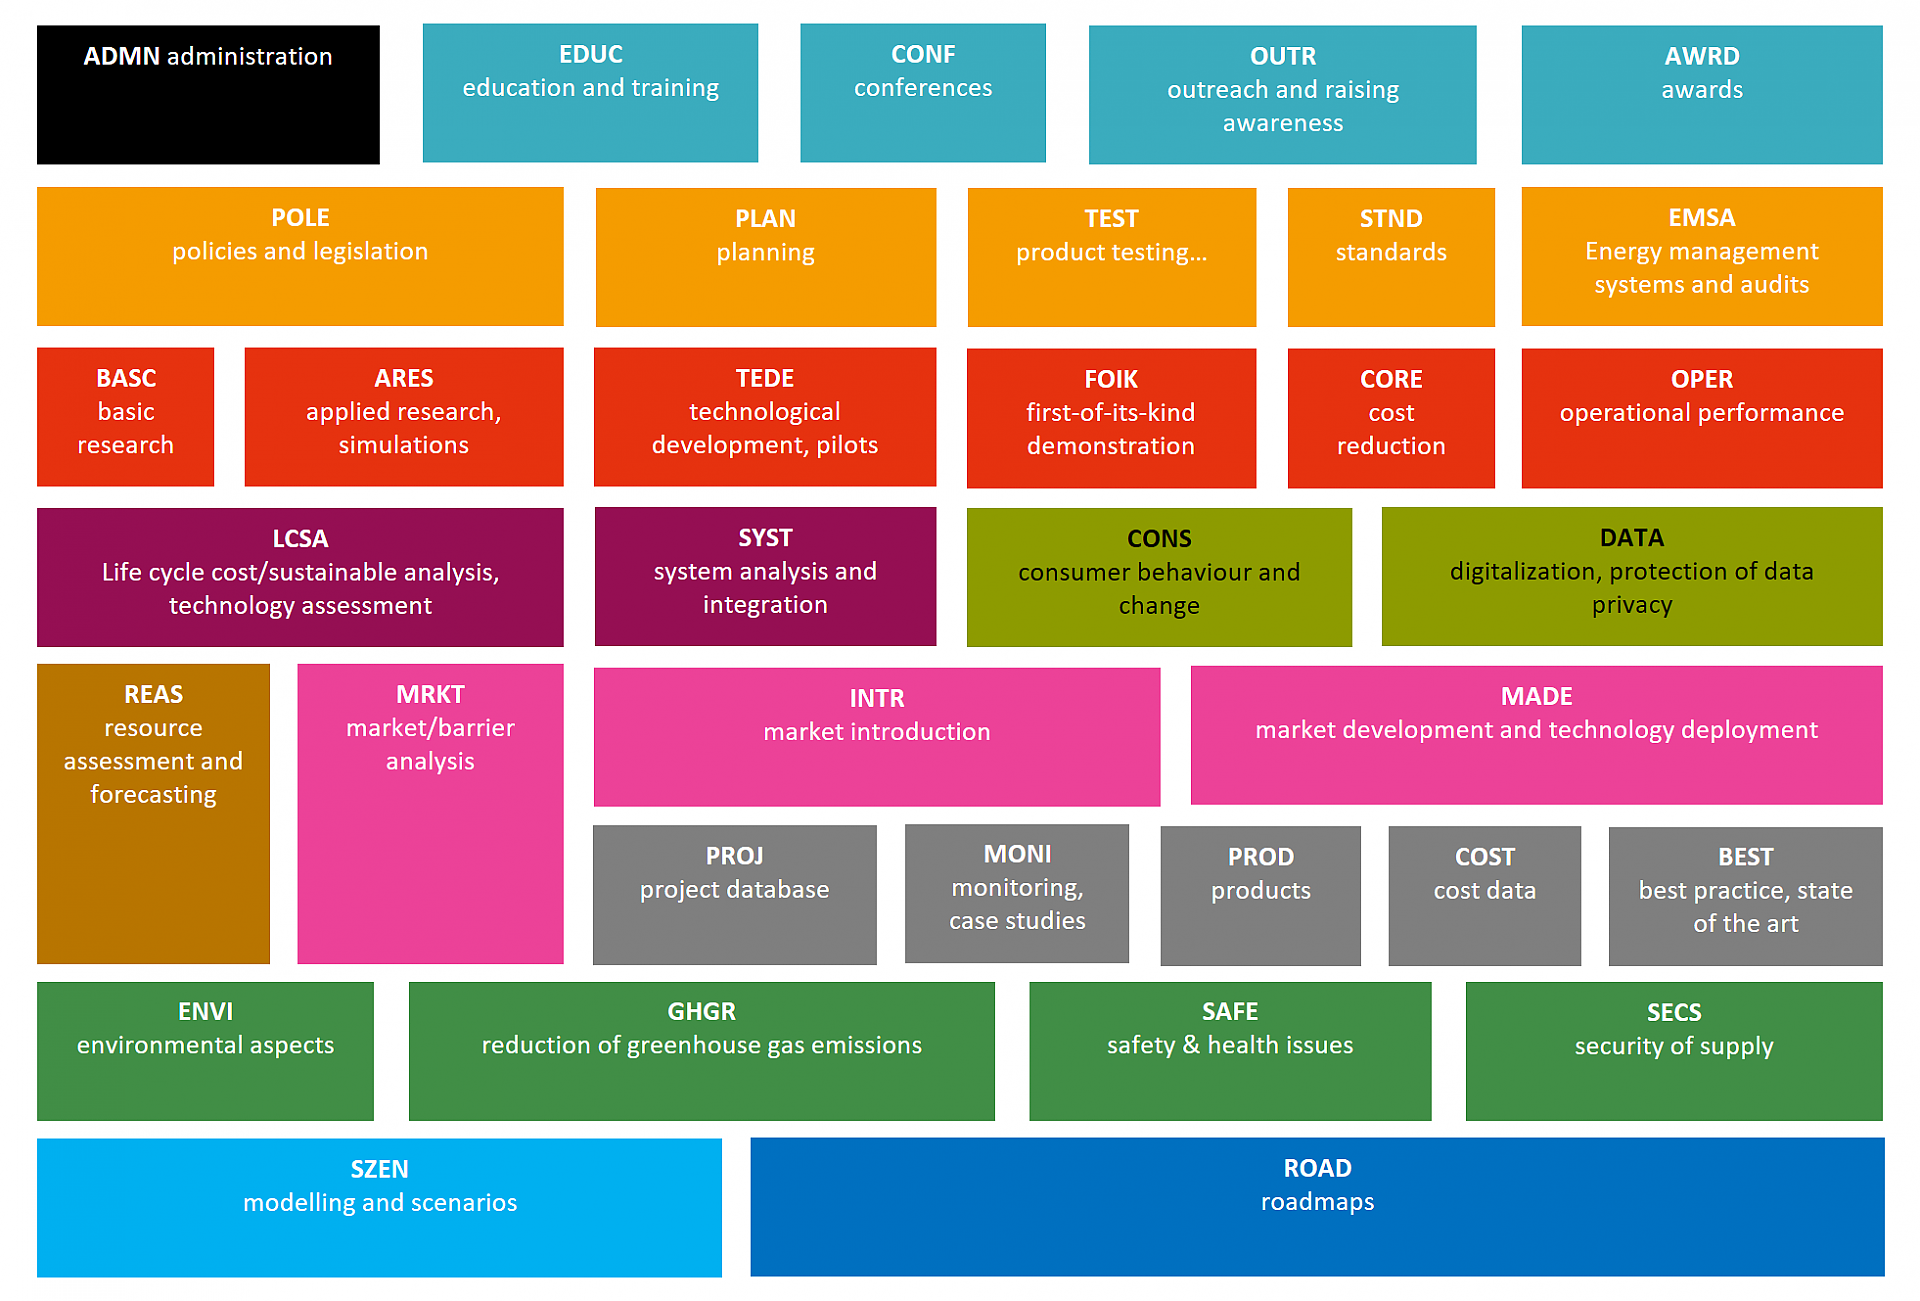
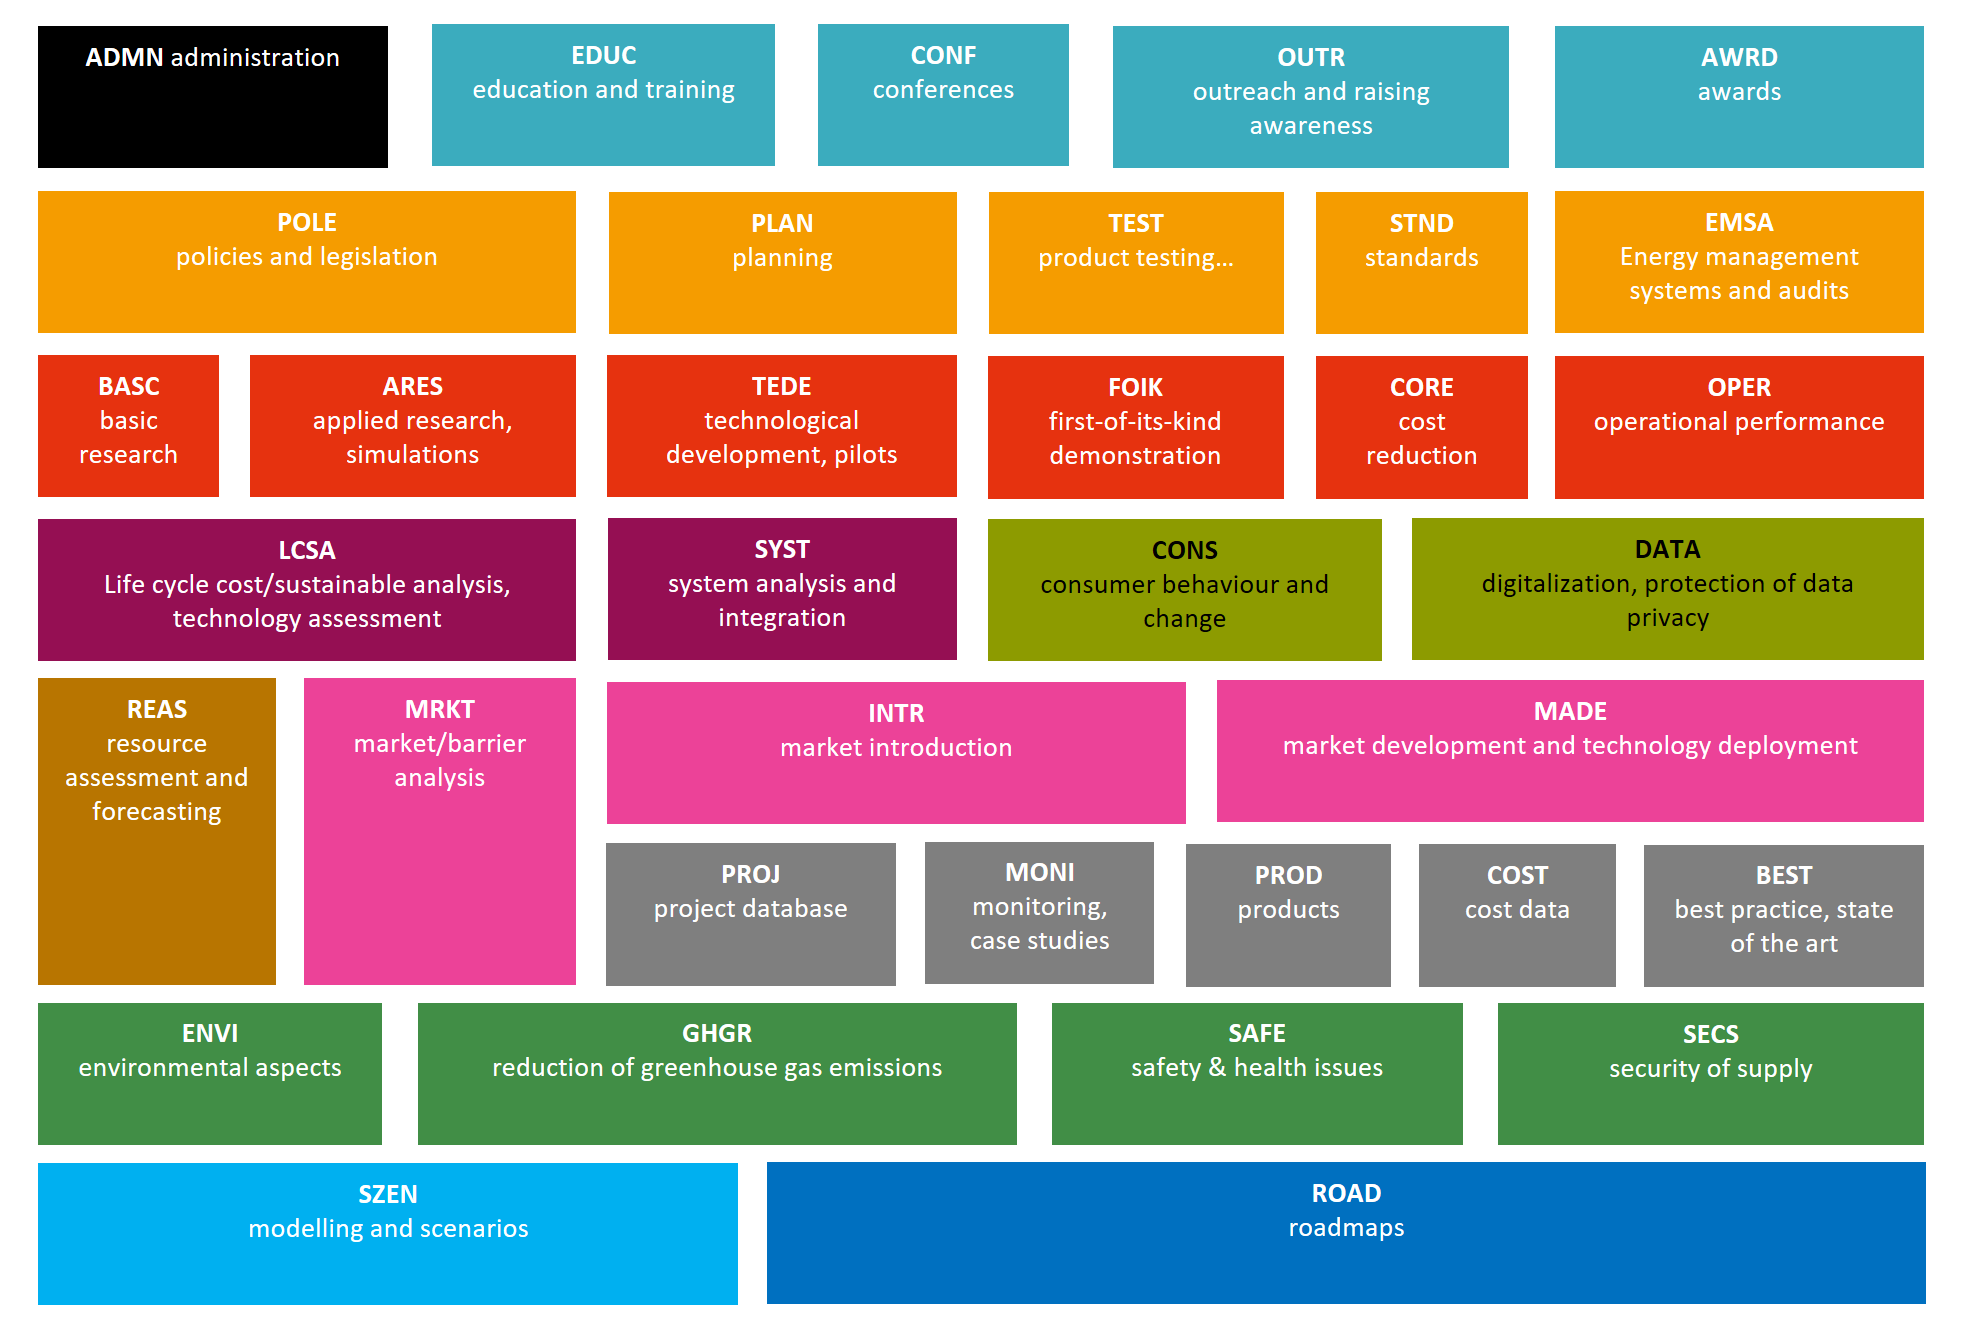
Set of methods to classify the type of activity of TCP Tasks and Annexes.
Copyright: Austrian Energy Agency
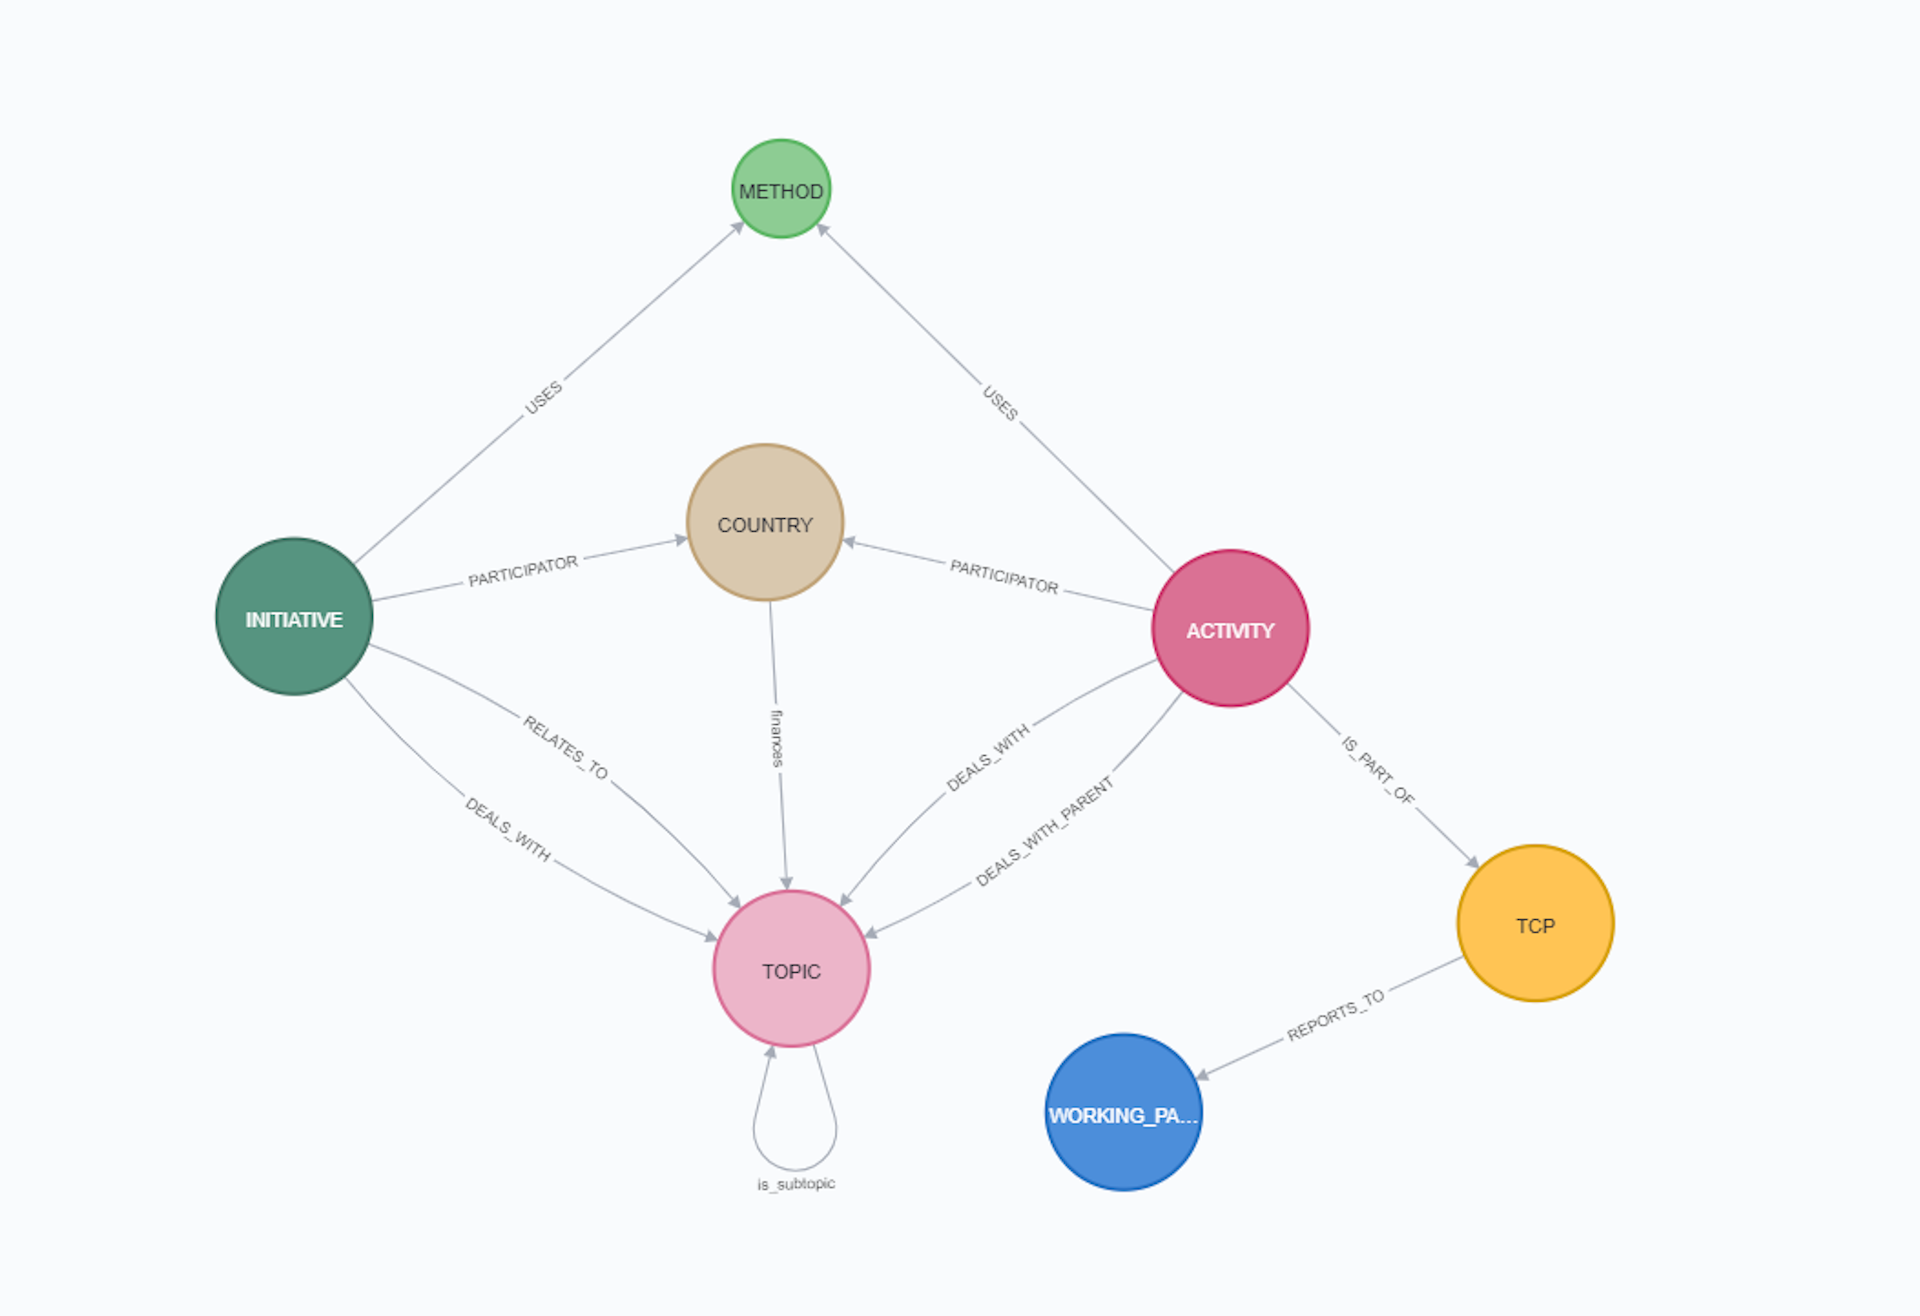
Graph Datastructure
Graphbased datastructure of the open access IEA-TCP dataset.
Copyright: Austrian Energy Agency
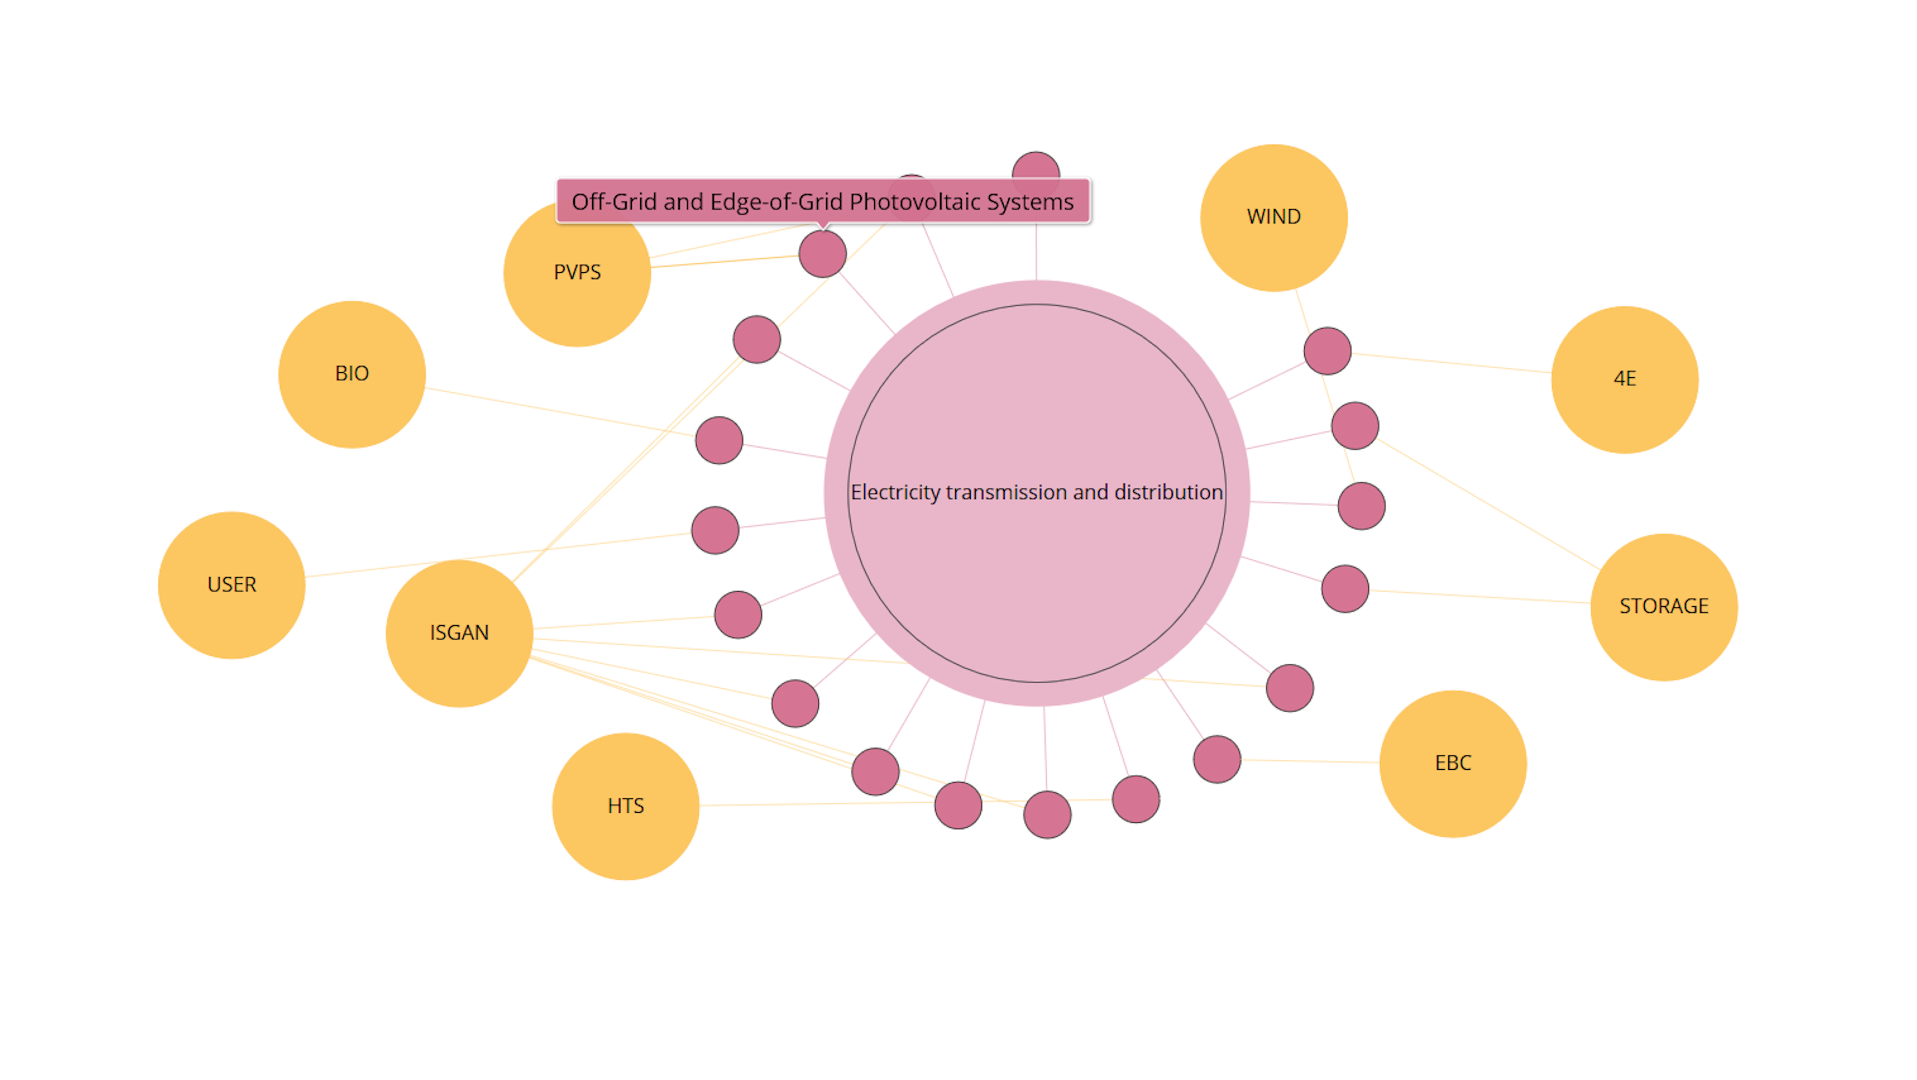
Visualisation of TCPs
After selecting a topic (in this example "Electricity transmission and distribution" was selected), this graph shows all tasks (activities) focussing on the selected topic. The topics are structured according to the IEA energy RD&D budget/expenditure statistics. Additionally, you can see the related Technology Collaboration Programmes (TCPs). Activities which had been ongoing in Summer 2020 from all IEA-TCPs are covered in this analysis. You can re-arrange the different bubbles to better meet the needs of your analysis. If a TCP consists of more than one task (activity), it also contains one entry in the database labelled “ExCo-Activities”. Available at https://nachhaltigwirtschaften.at/en/iea/visualisations/tcps-focussing-on-a-topic.php
Copyright: Austrian Energy Agency
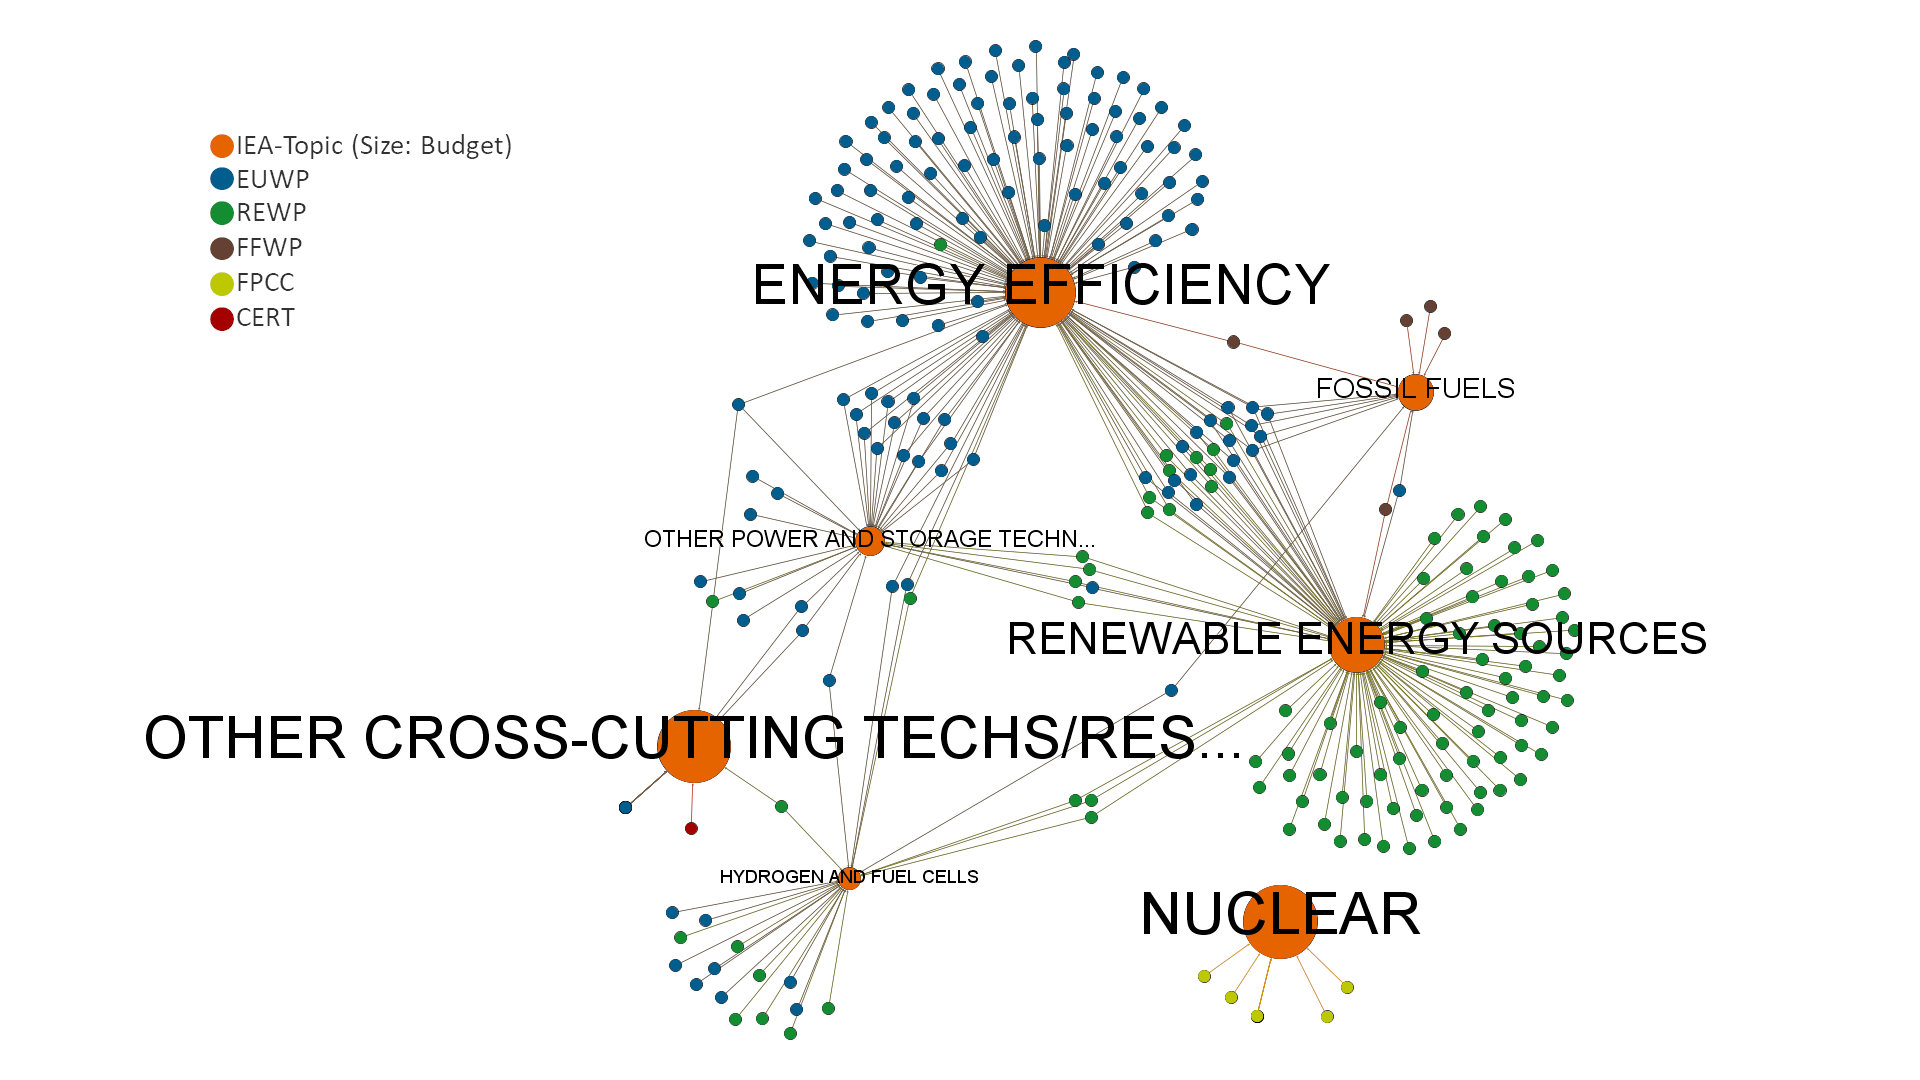
R&D Map
Visualisation of all ongoing Tasks and Annexes ("Activities") and their respective research topics.
Copyright: Austrian Energy Agency
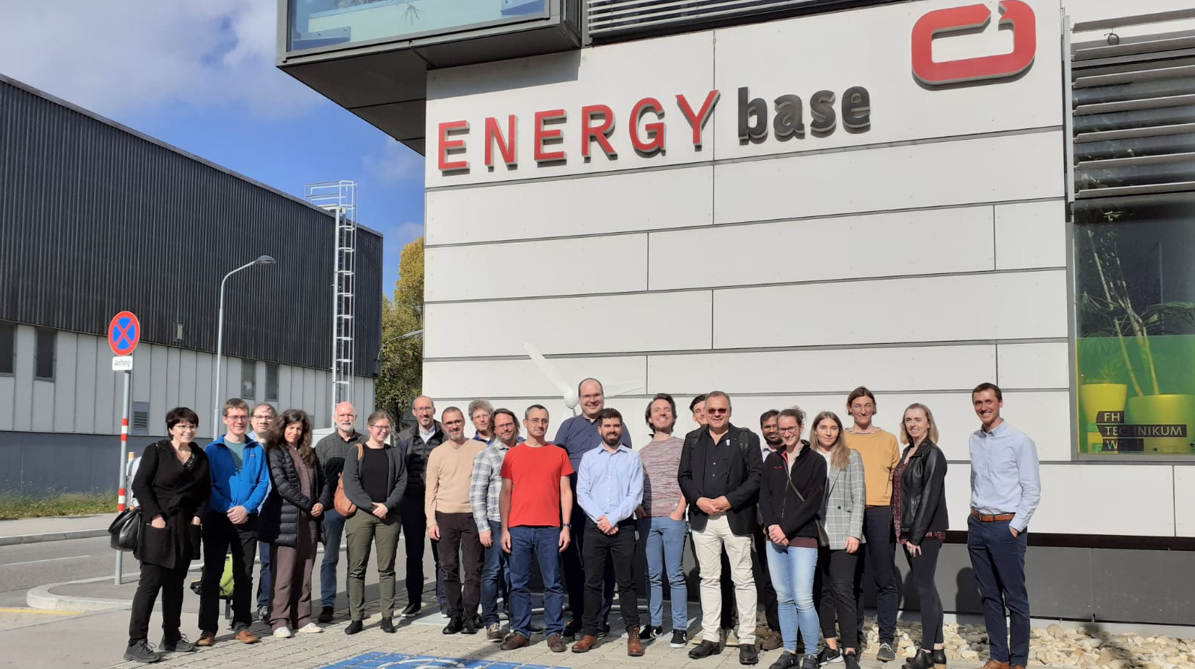
IEA Task Meeting Vienna
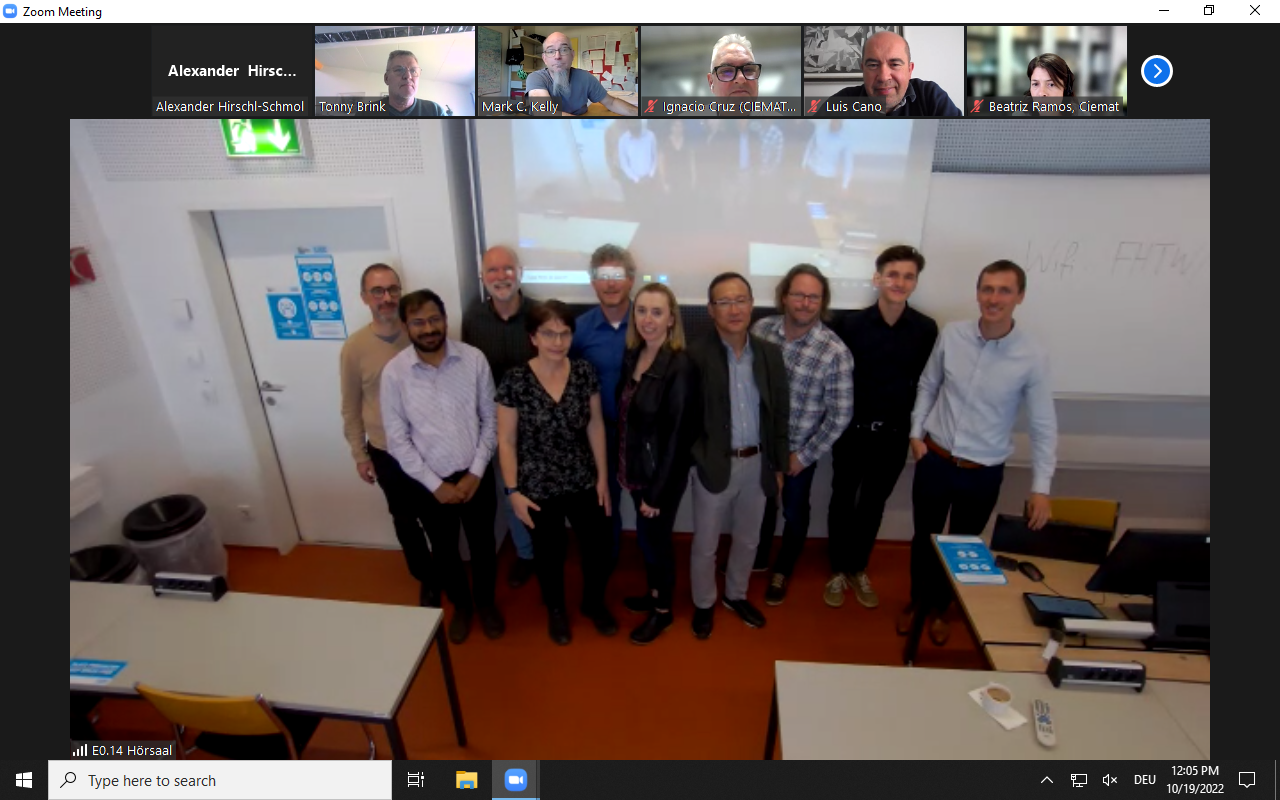
From 19th to 20th October 2022, an IEA Task 41 meeting was held in Vienna at the University of Applied Sciences Technikum Wien after a pandemic-related break, at which future research topics were planned and research results were presented.
Copyright: FH Technikum Wien
IEA Task Meeting Vienna
From 19th to 20th October 2022, an IEA Task 41 meeting was held in Vienna at the University of Applied Sciences Technikum Wien after a pandemic-related break, at which future research topics were planned and research results were presented.
Copyright: FH Technikum Wien
LIDAR measurement device commissioning
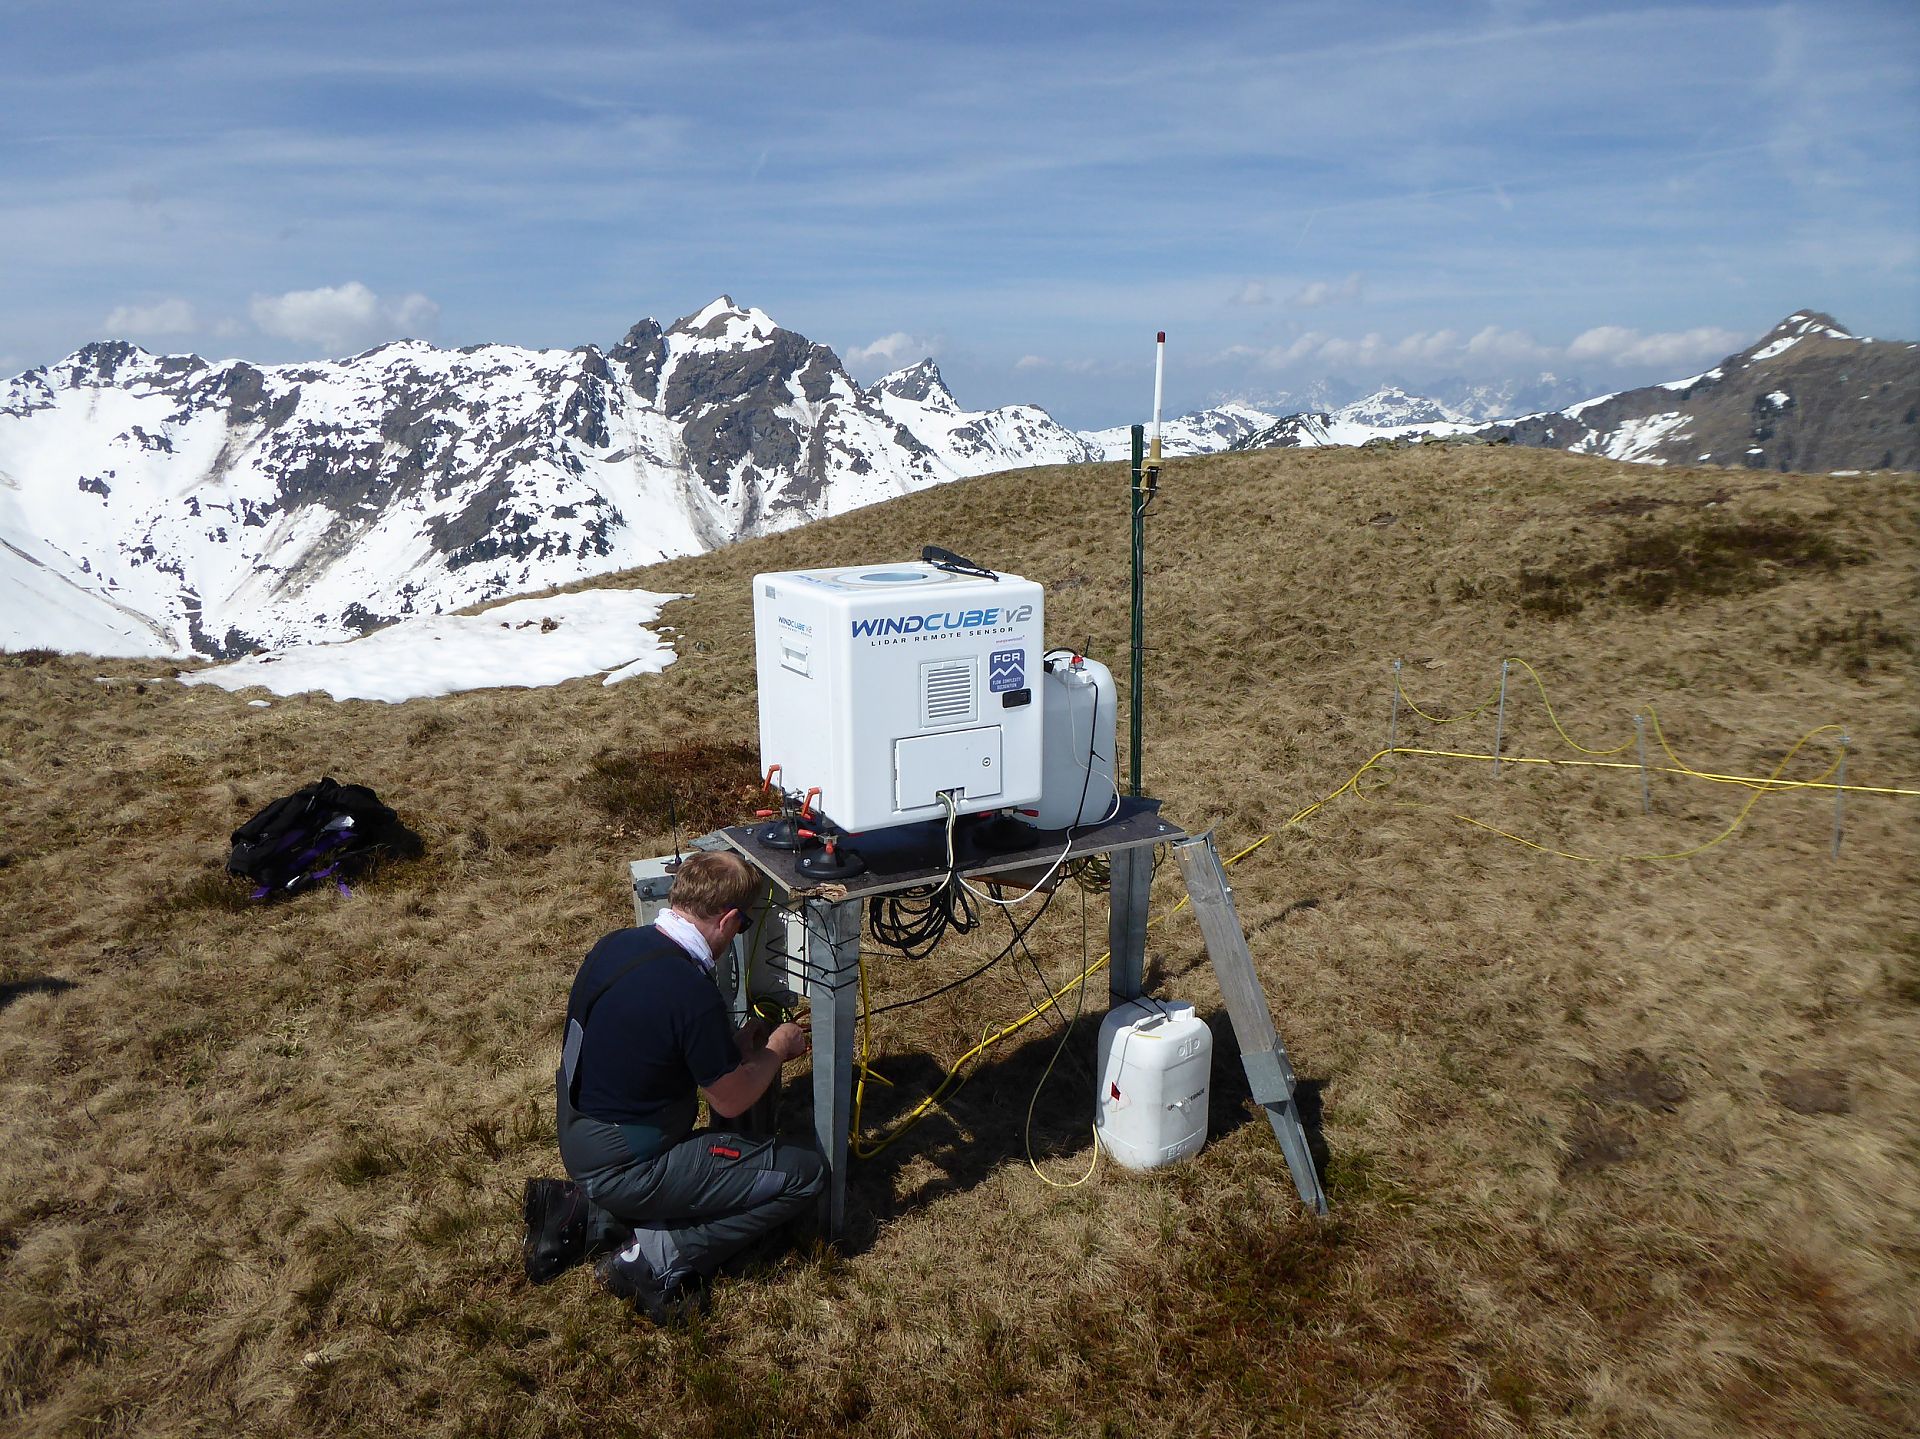
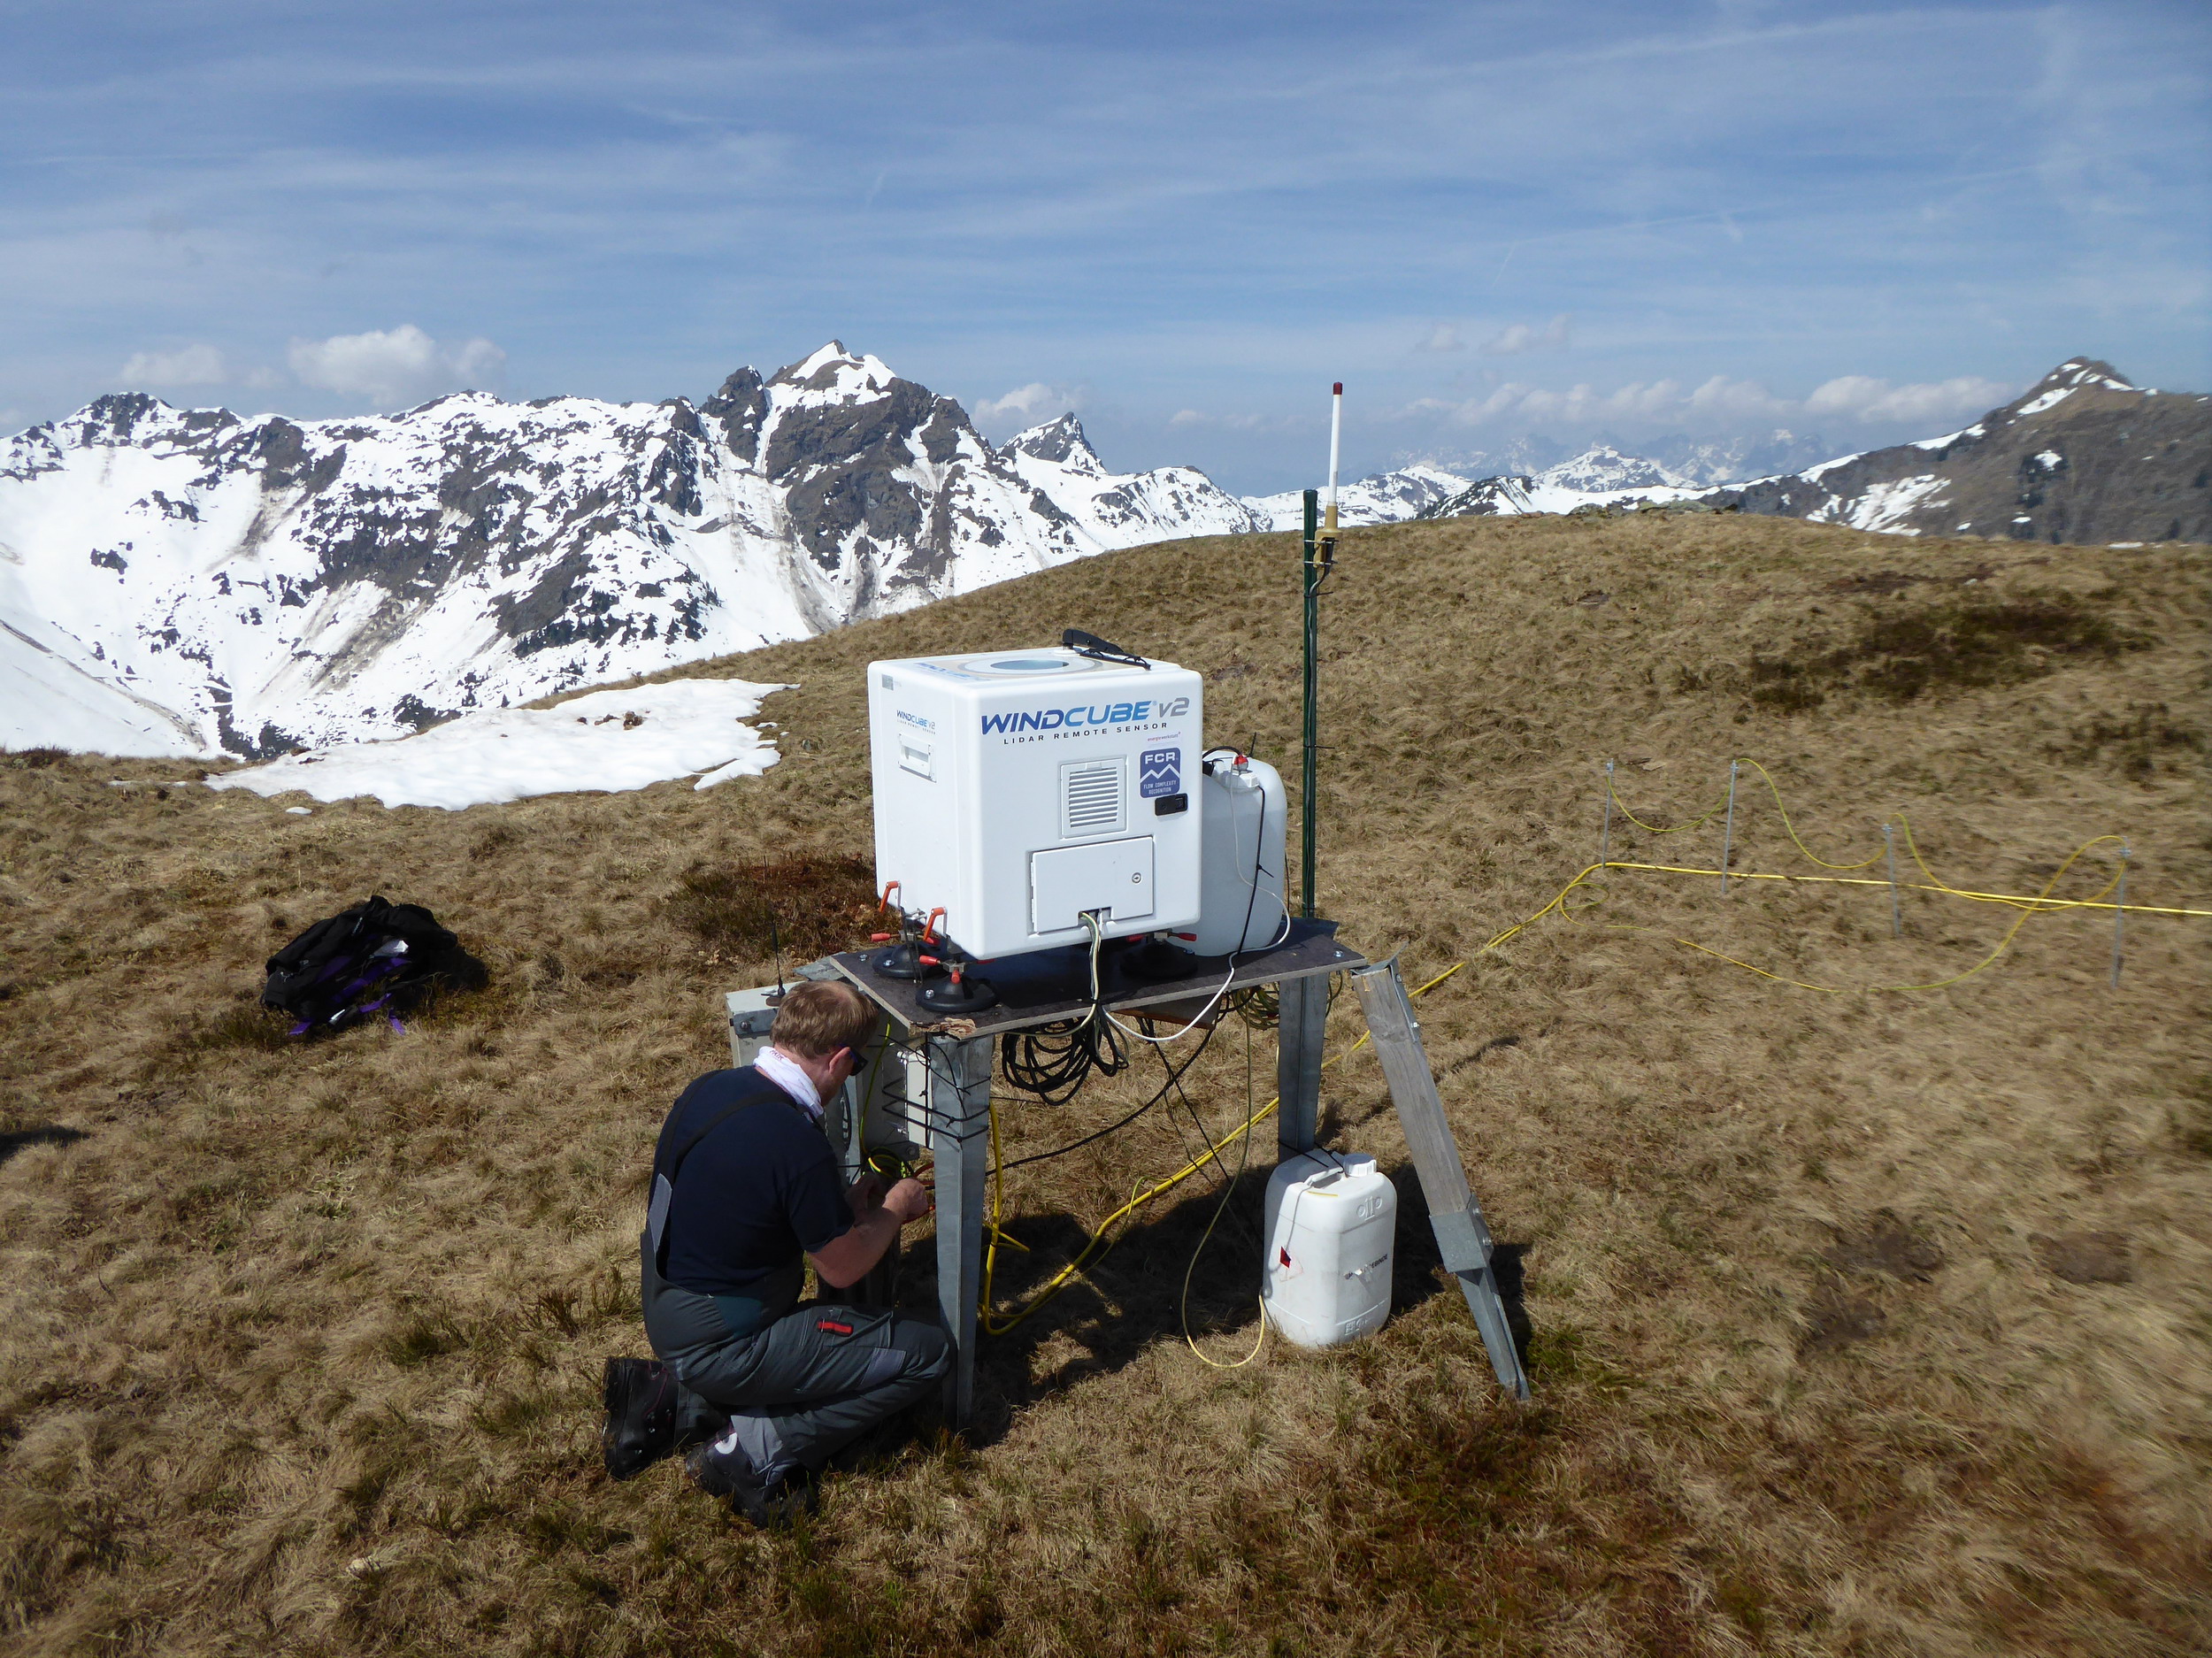
Commissioning of a LIDAR measurement device at a complex, alpine site with an altitude of 1,900m. (IEA Wind Task 32, 2016-2019)
Copyright: Energiewerkstatt Verein

LIDAR with off-grid power supply
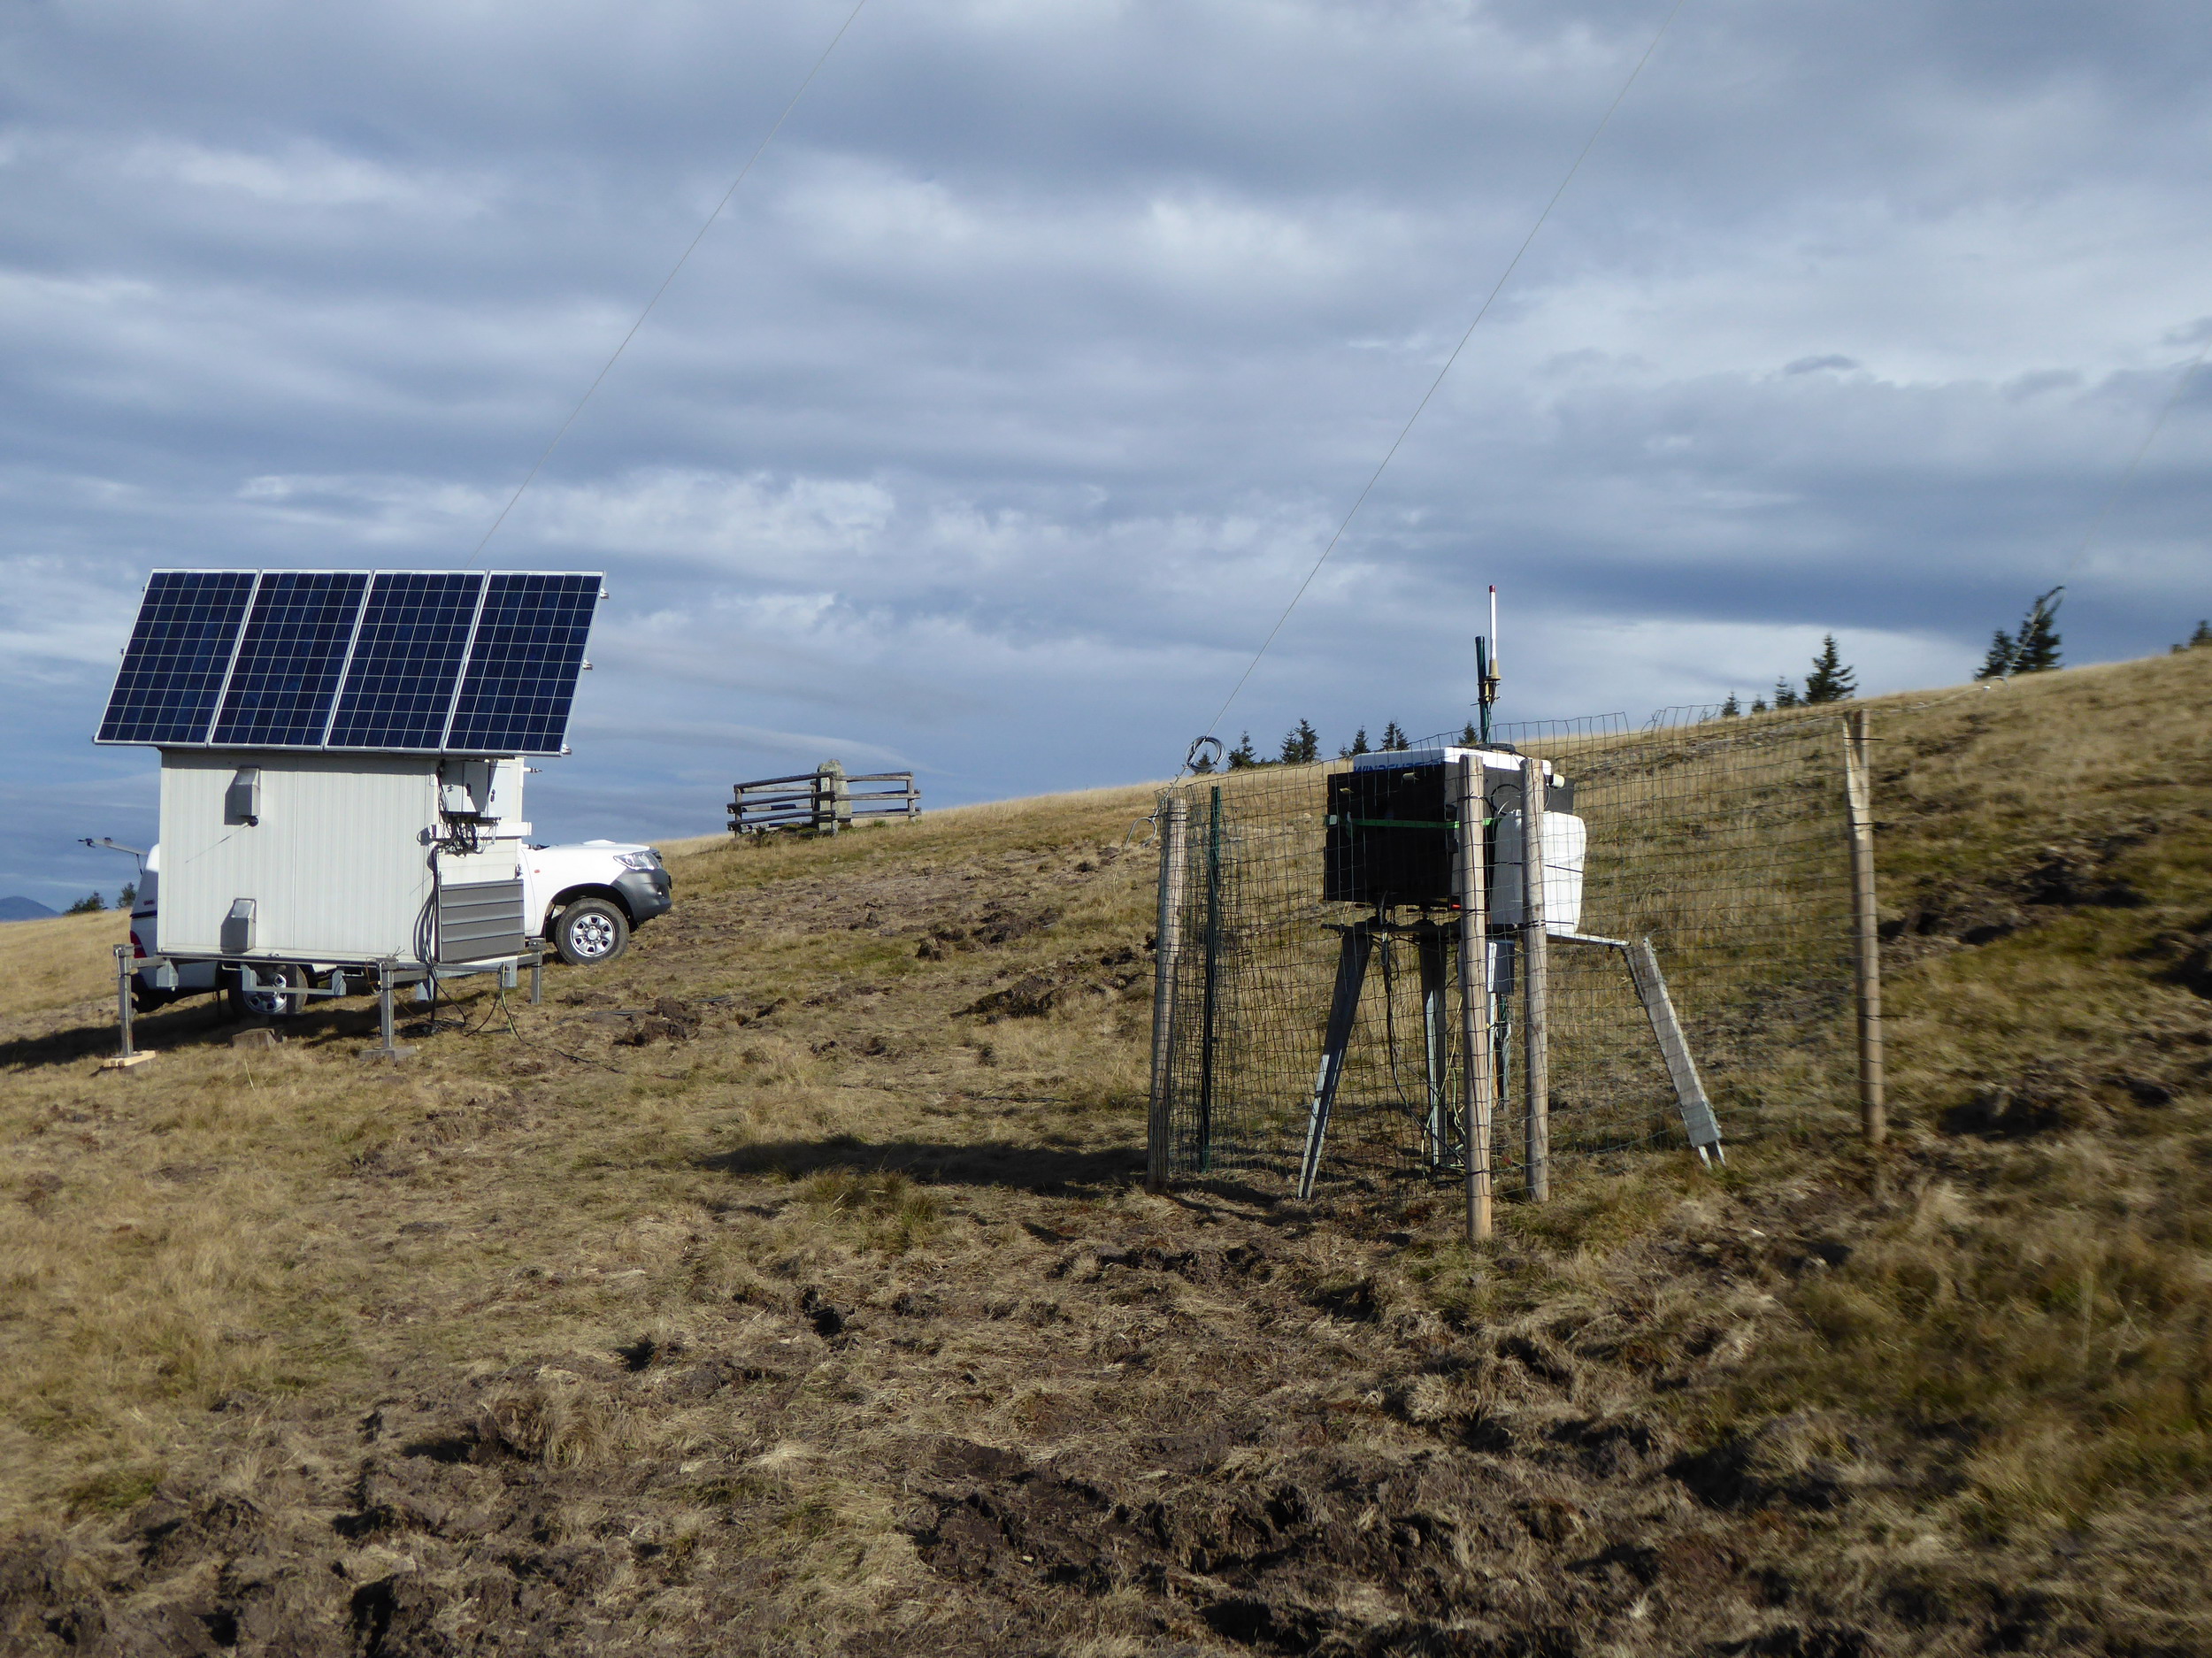
LIDAR in operation with an off-grid power supply consisting of photovoltaic, fuel cell and battery-storage. (IEA Wind Task 32, 2016-2019)
Copyright: Energiewerkstatt Verein
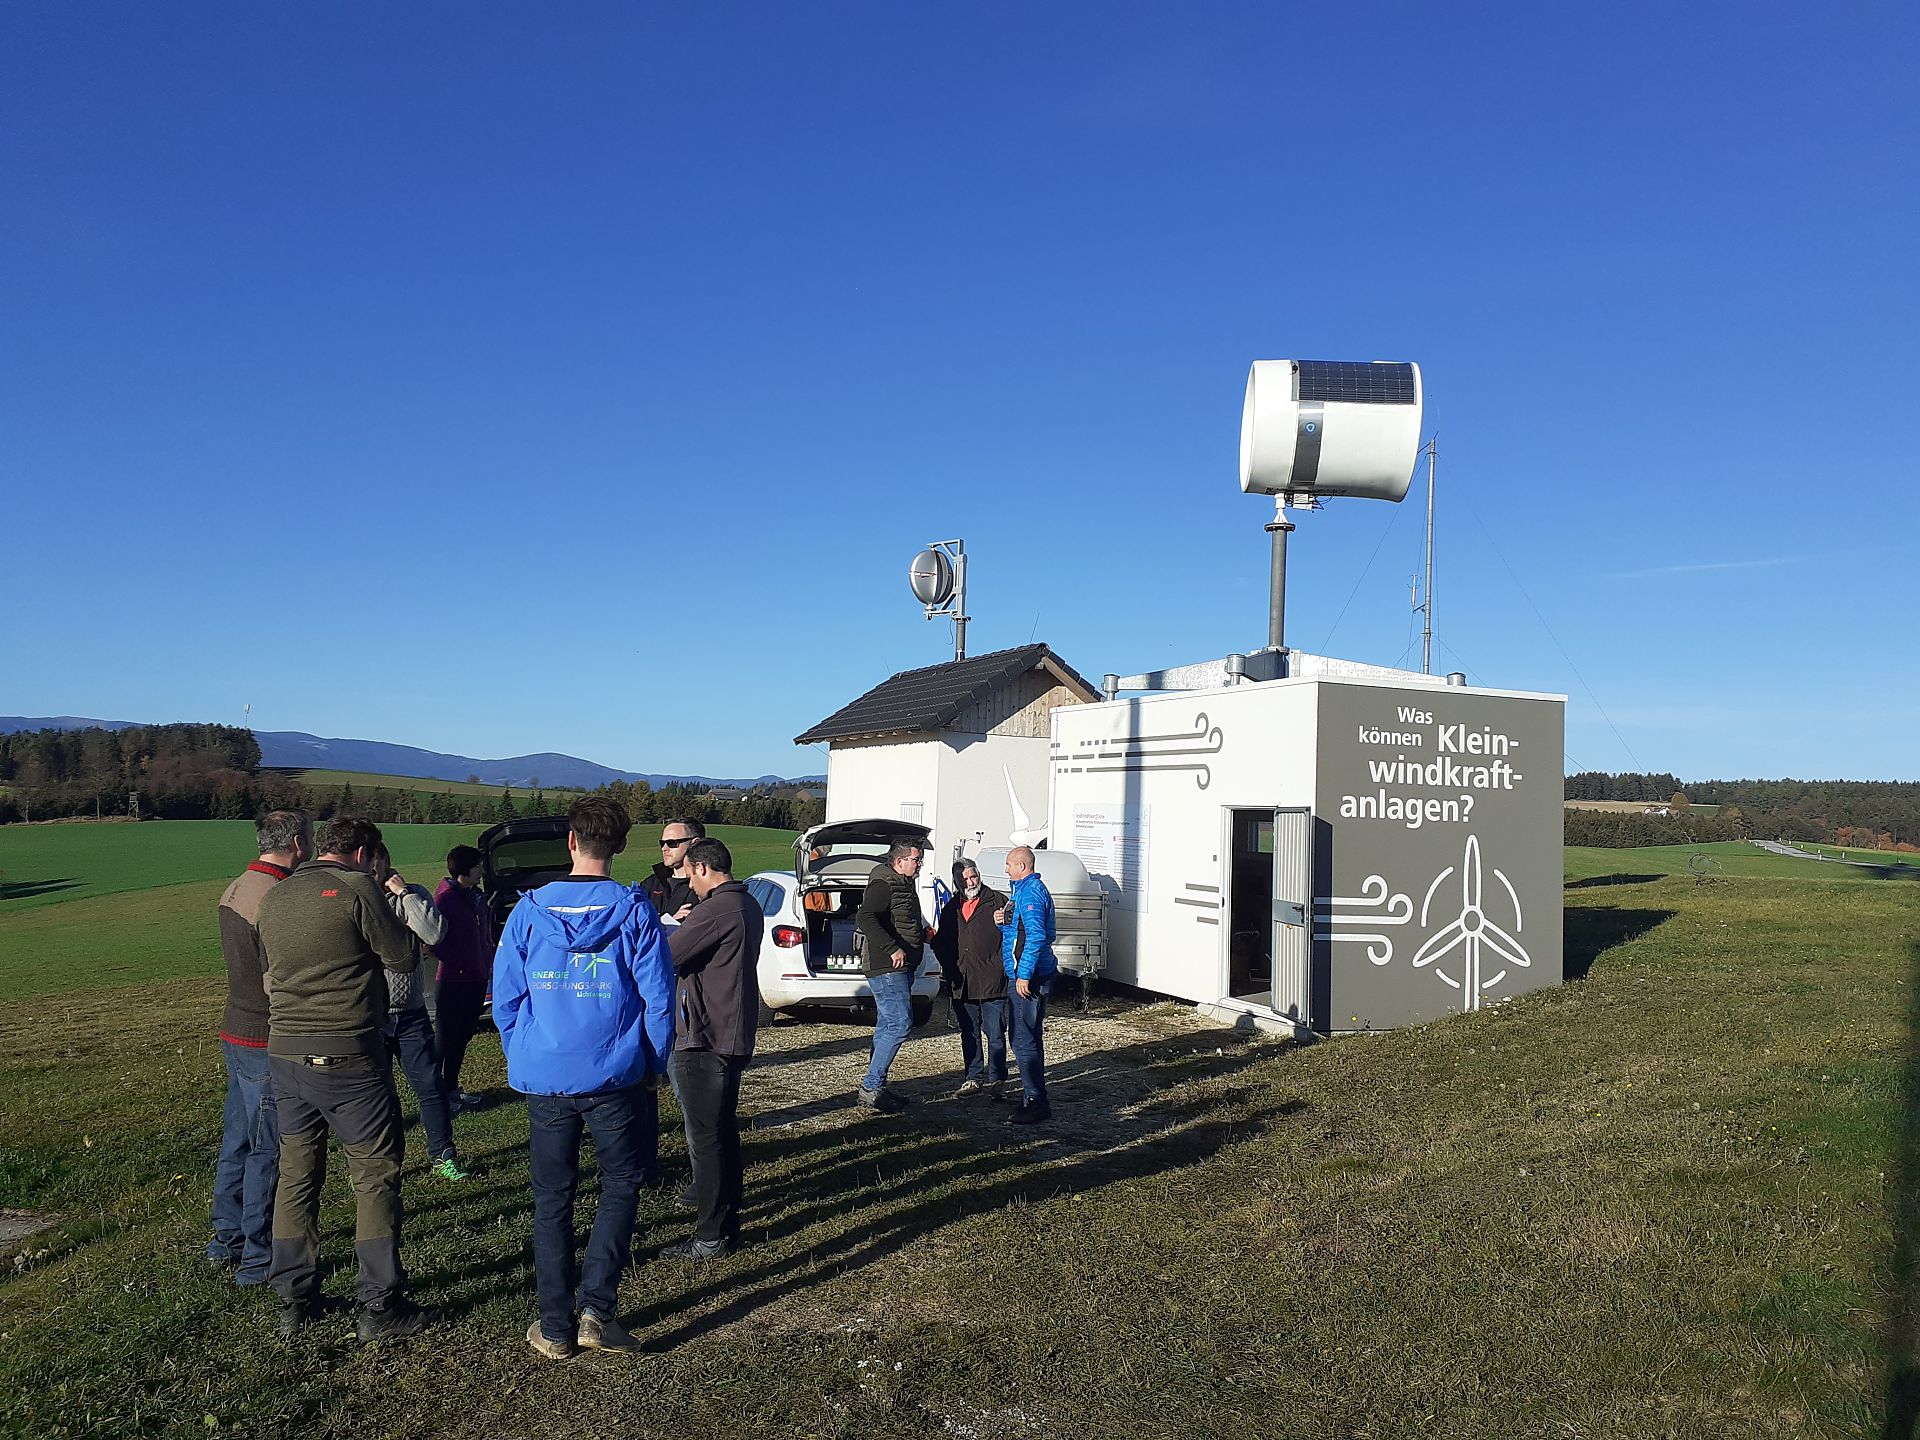
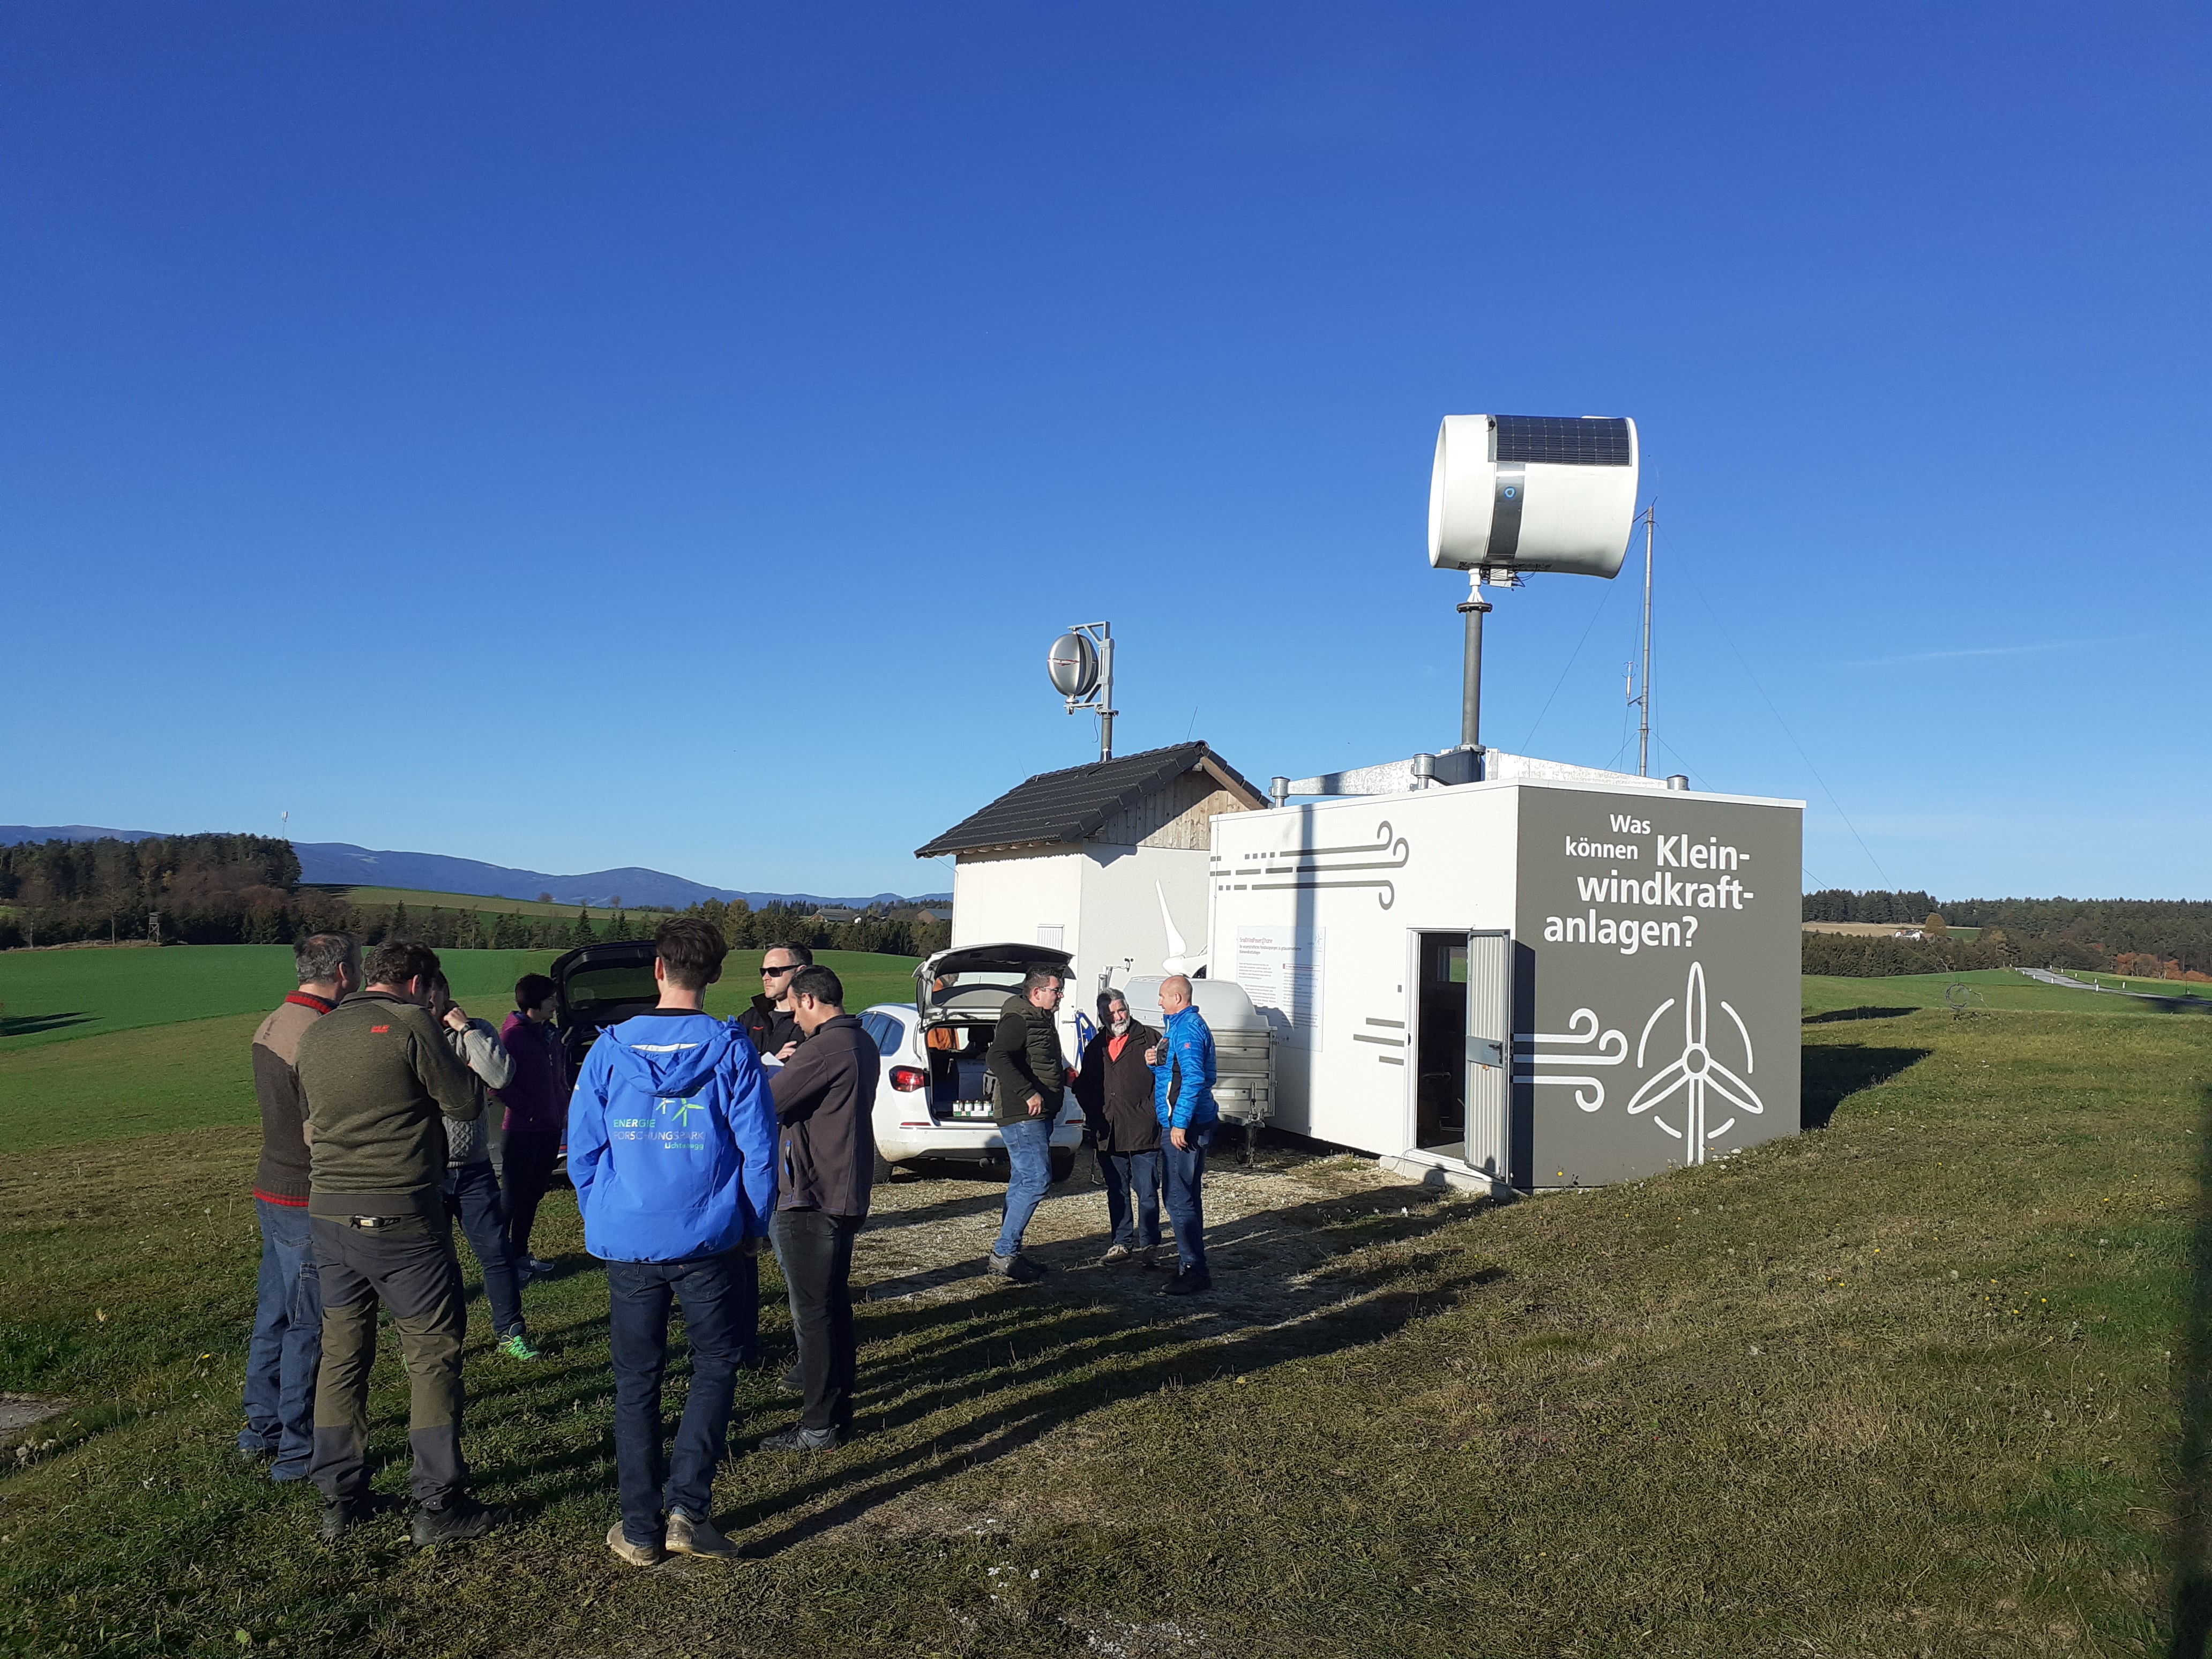
Open Day at the Lichtenegg Energy Research Park 1
On 28 October 2022, an open day was held at the Lichtenegg Energy Research Park. Interested people and manufacturers were given more information on small wind power and experiences from IEA Task 41 were shared.
Copyright: FH Technikum Wien
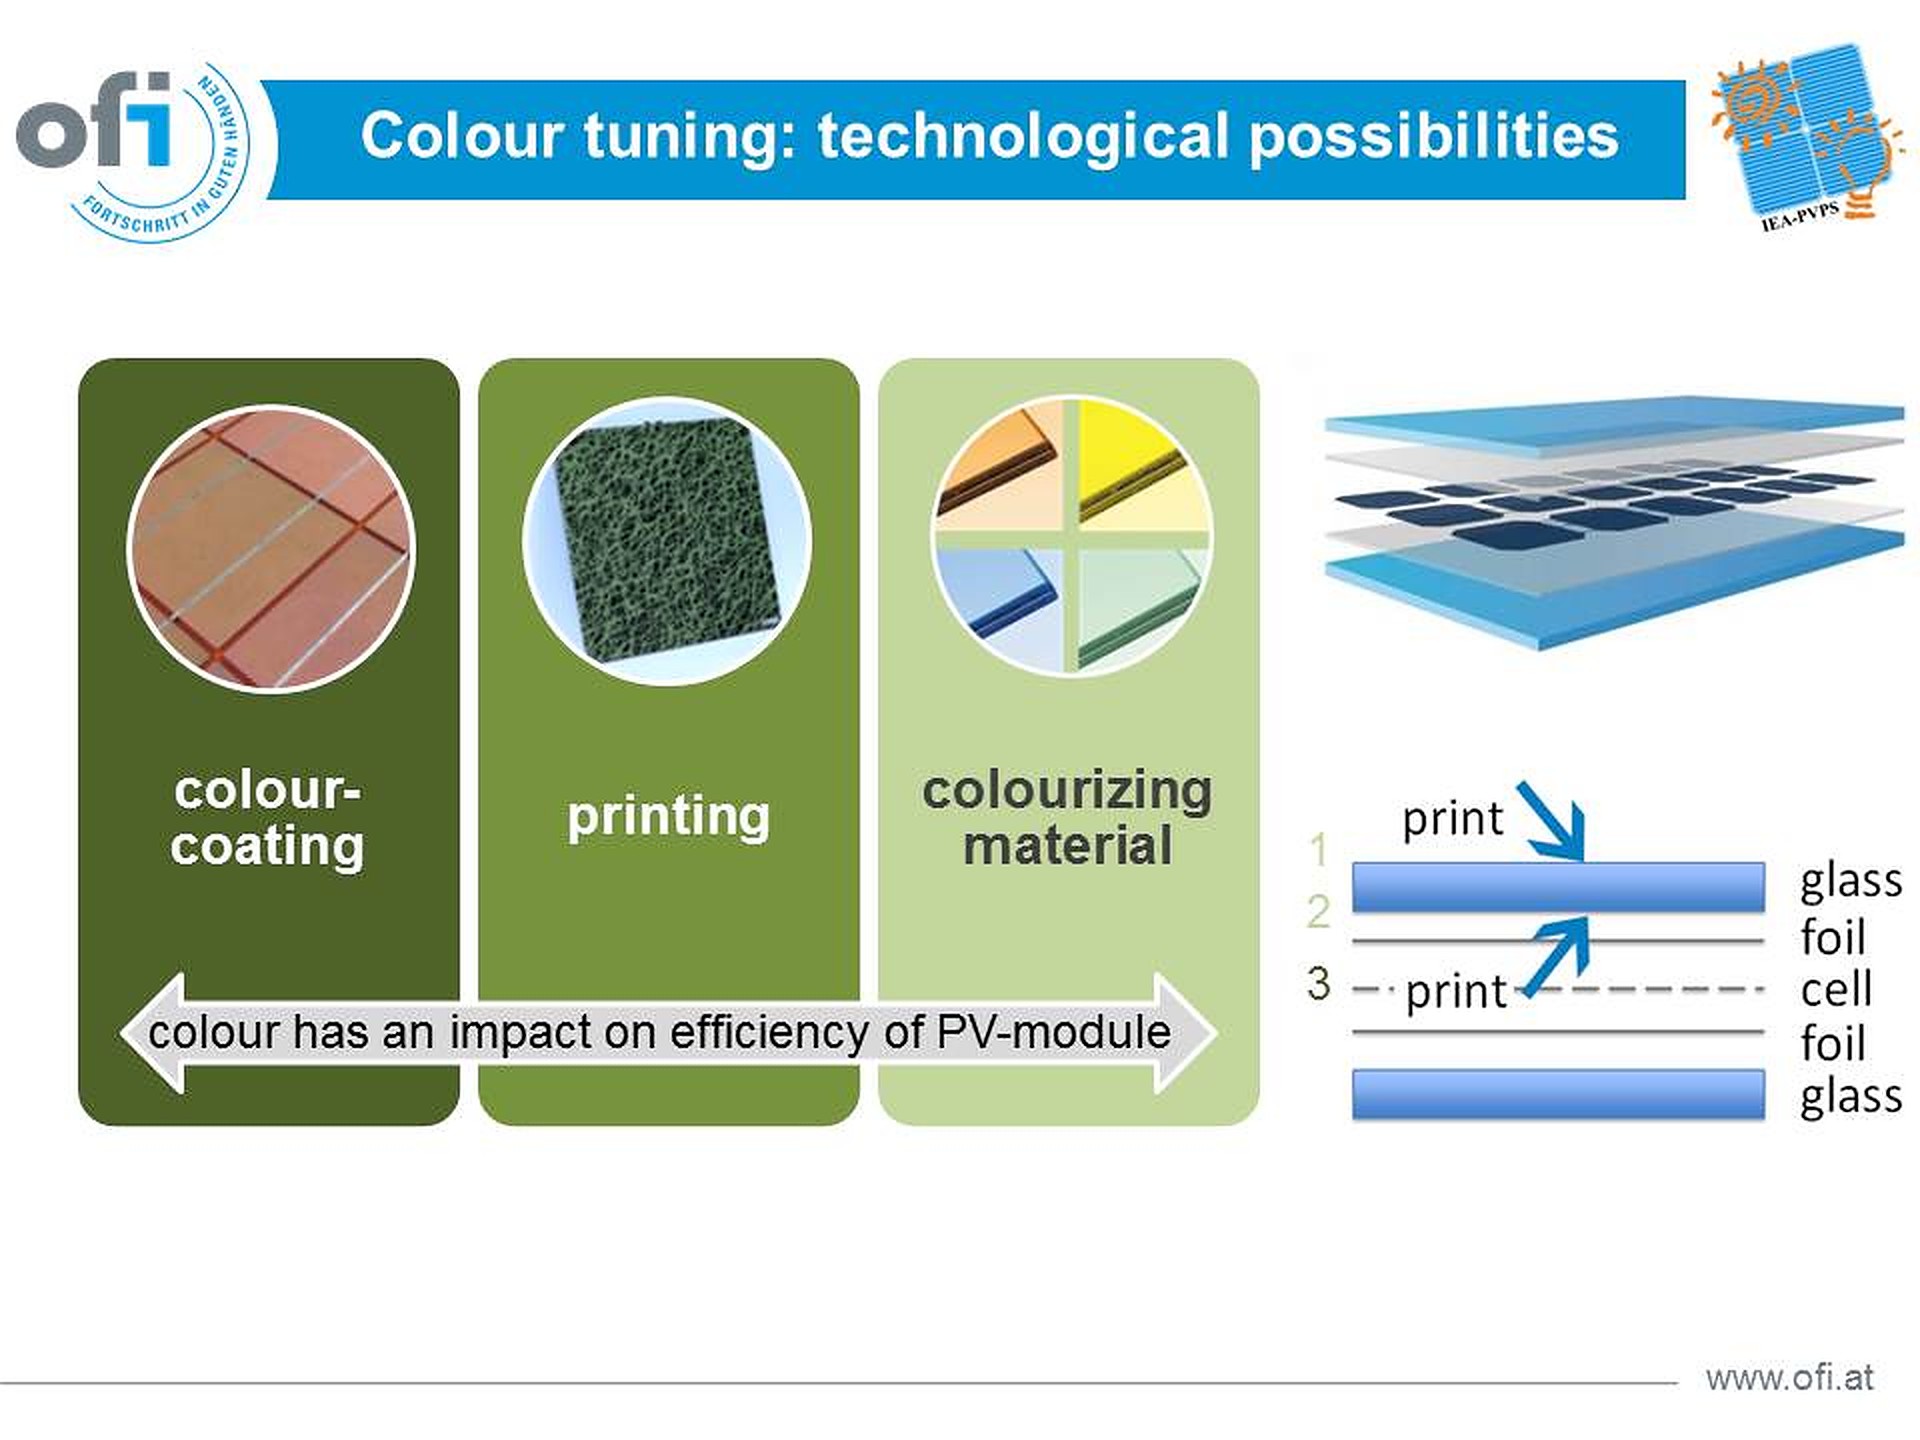
Colour tuning
Technological possibilities to colour BIPV modules
Copyright: Task15 Konsortium
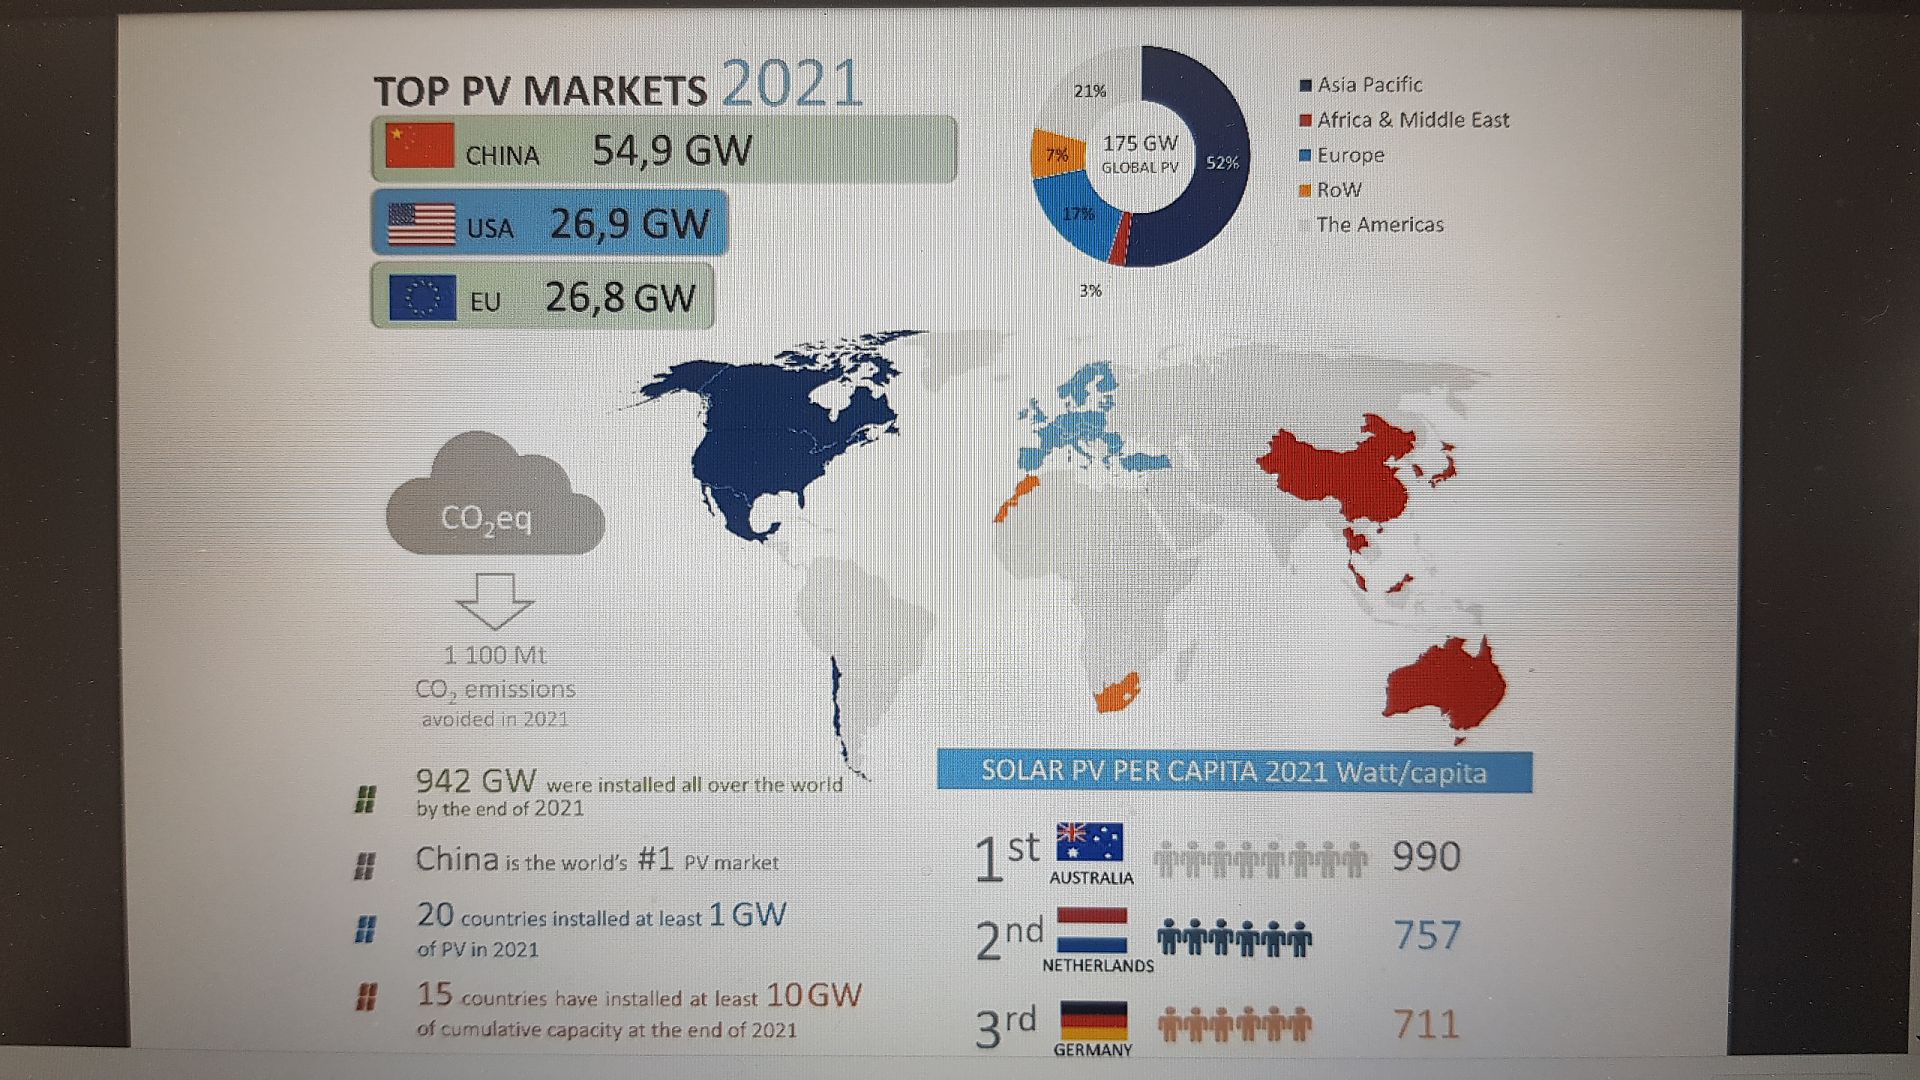
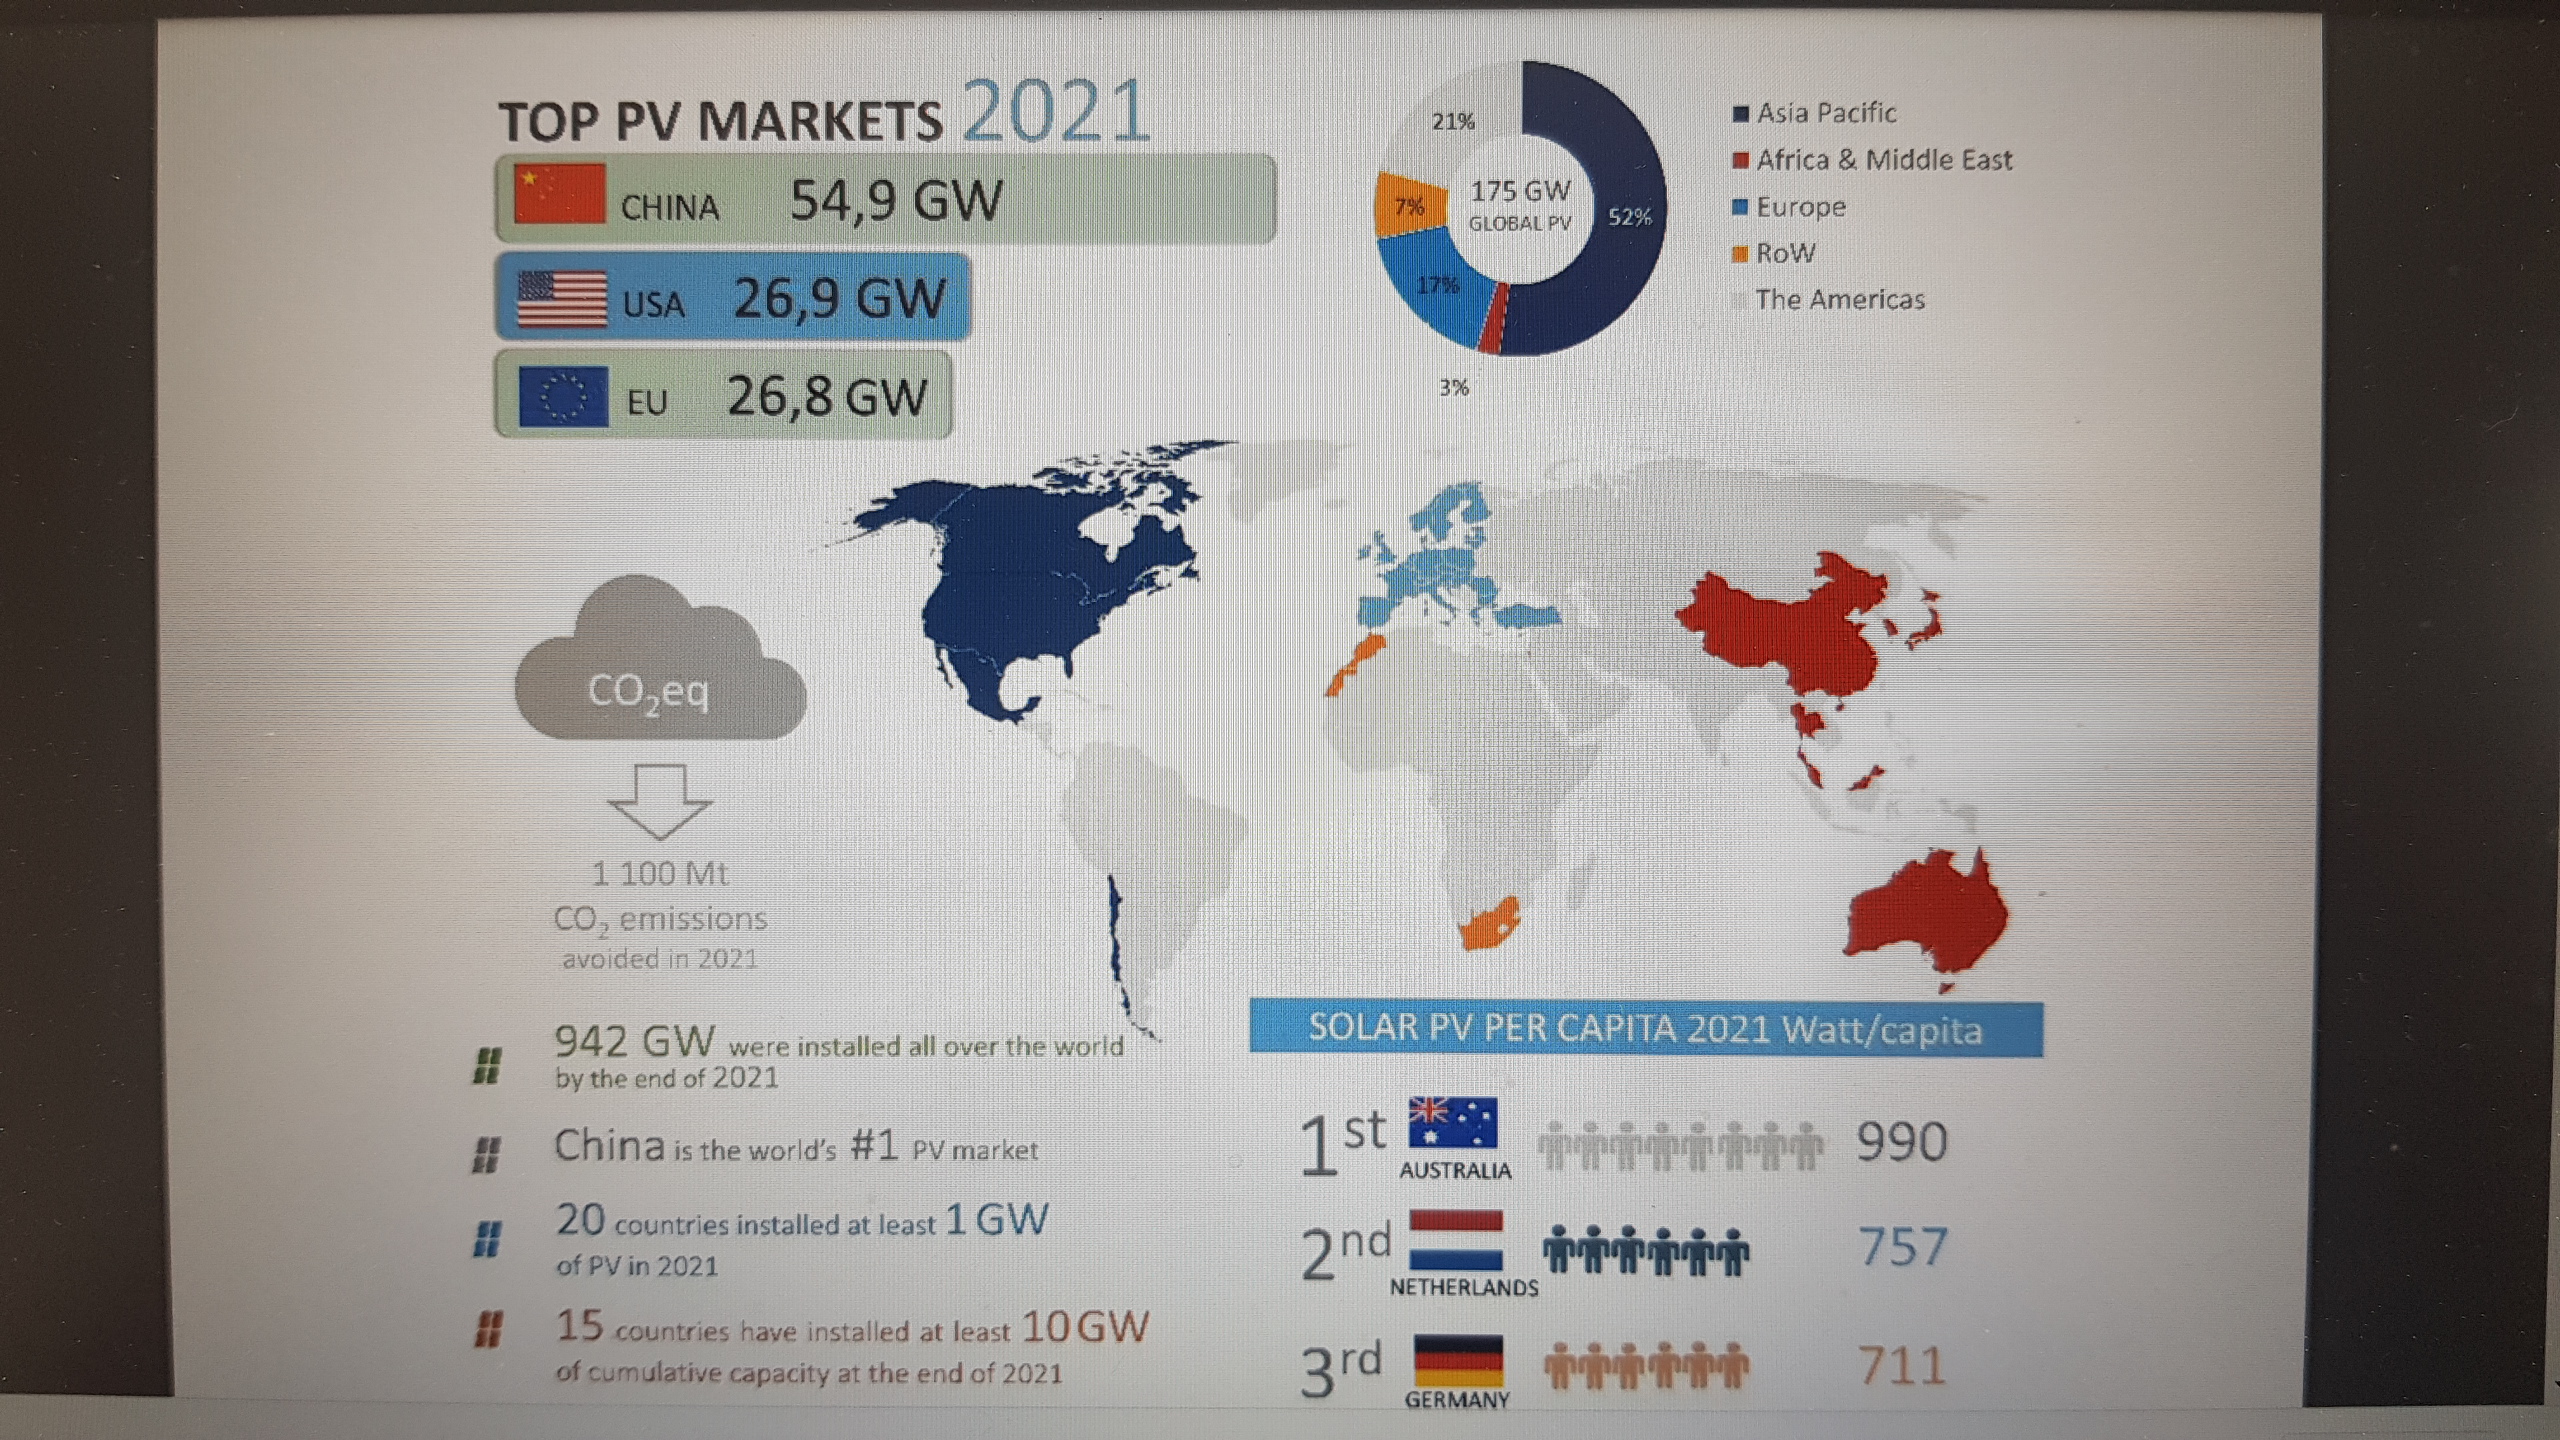
PV Top Photovoltaic Markets - Global
PV Top Photovoltaic Markets - Global
Copyright: IEA PVPS
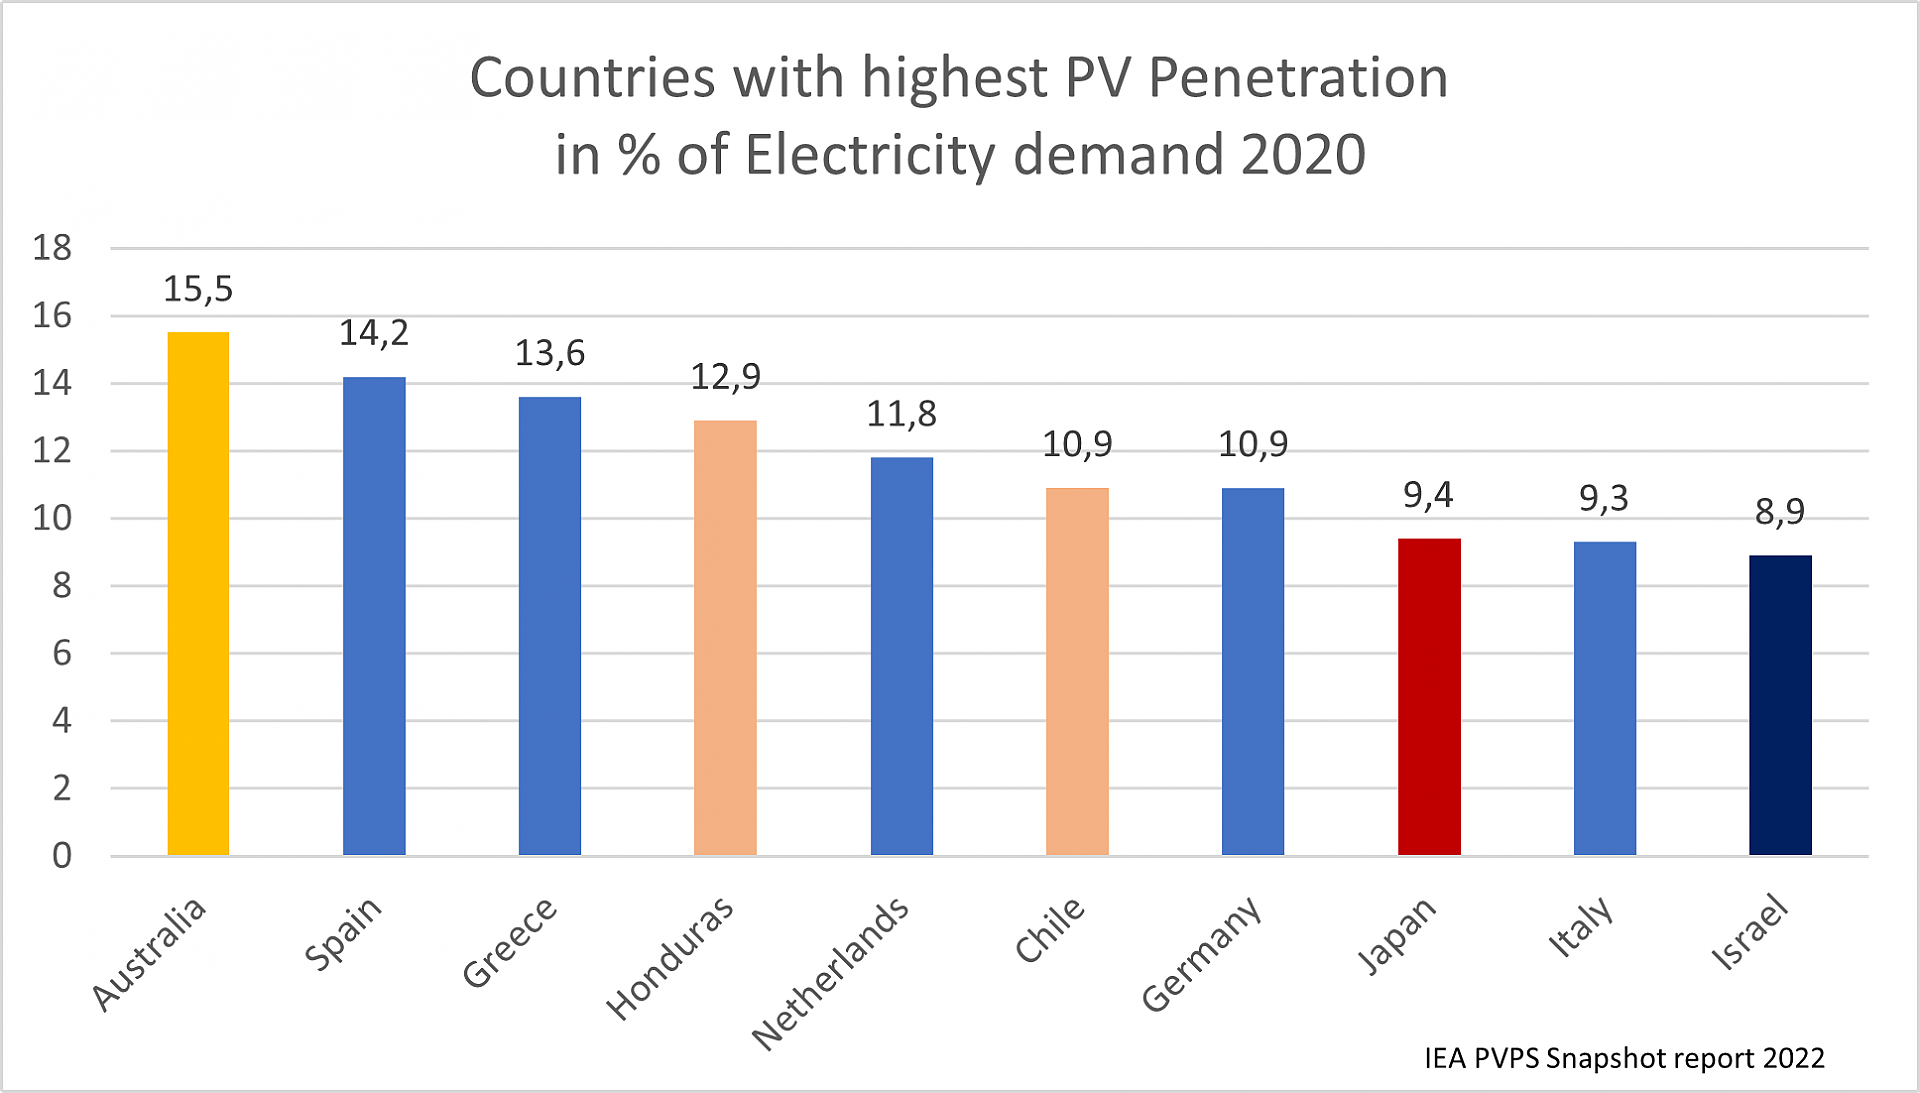
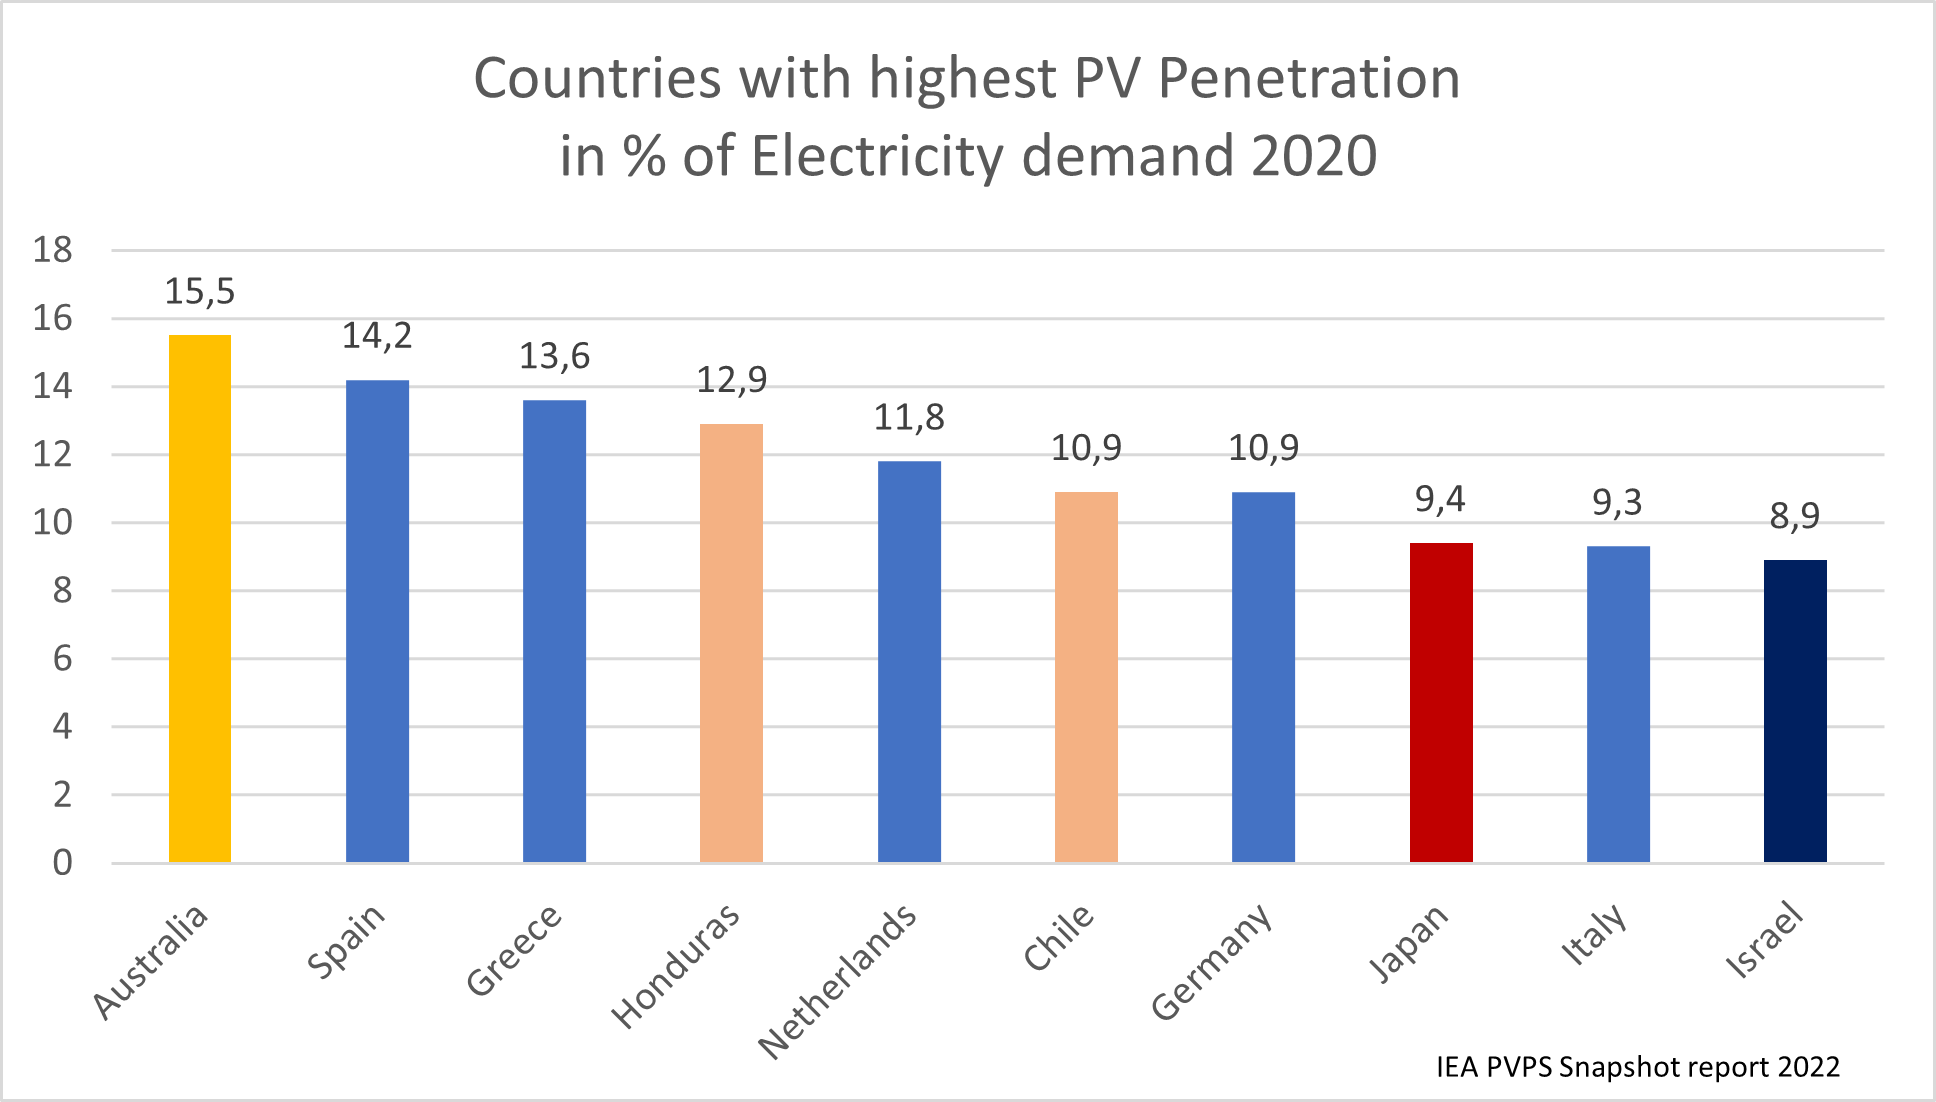
Countries with highest PV penetration 2020 - worldwide
Countries with highest PV penetration 2020 - 5% of the world electricity is 2020 covered by PV