
Project Image Pool
There are 444 results.
Terms of use: The pictures on this site originate from the projects in the frame of the programmes City of Tomorrow, Building of Tomorrow and the IEA Research Cooperation. They may be used credited for non-commercial purposes under the Creative Commons License Attribution-NonCommercial (CC BY-NC).
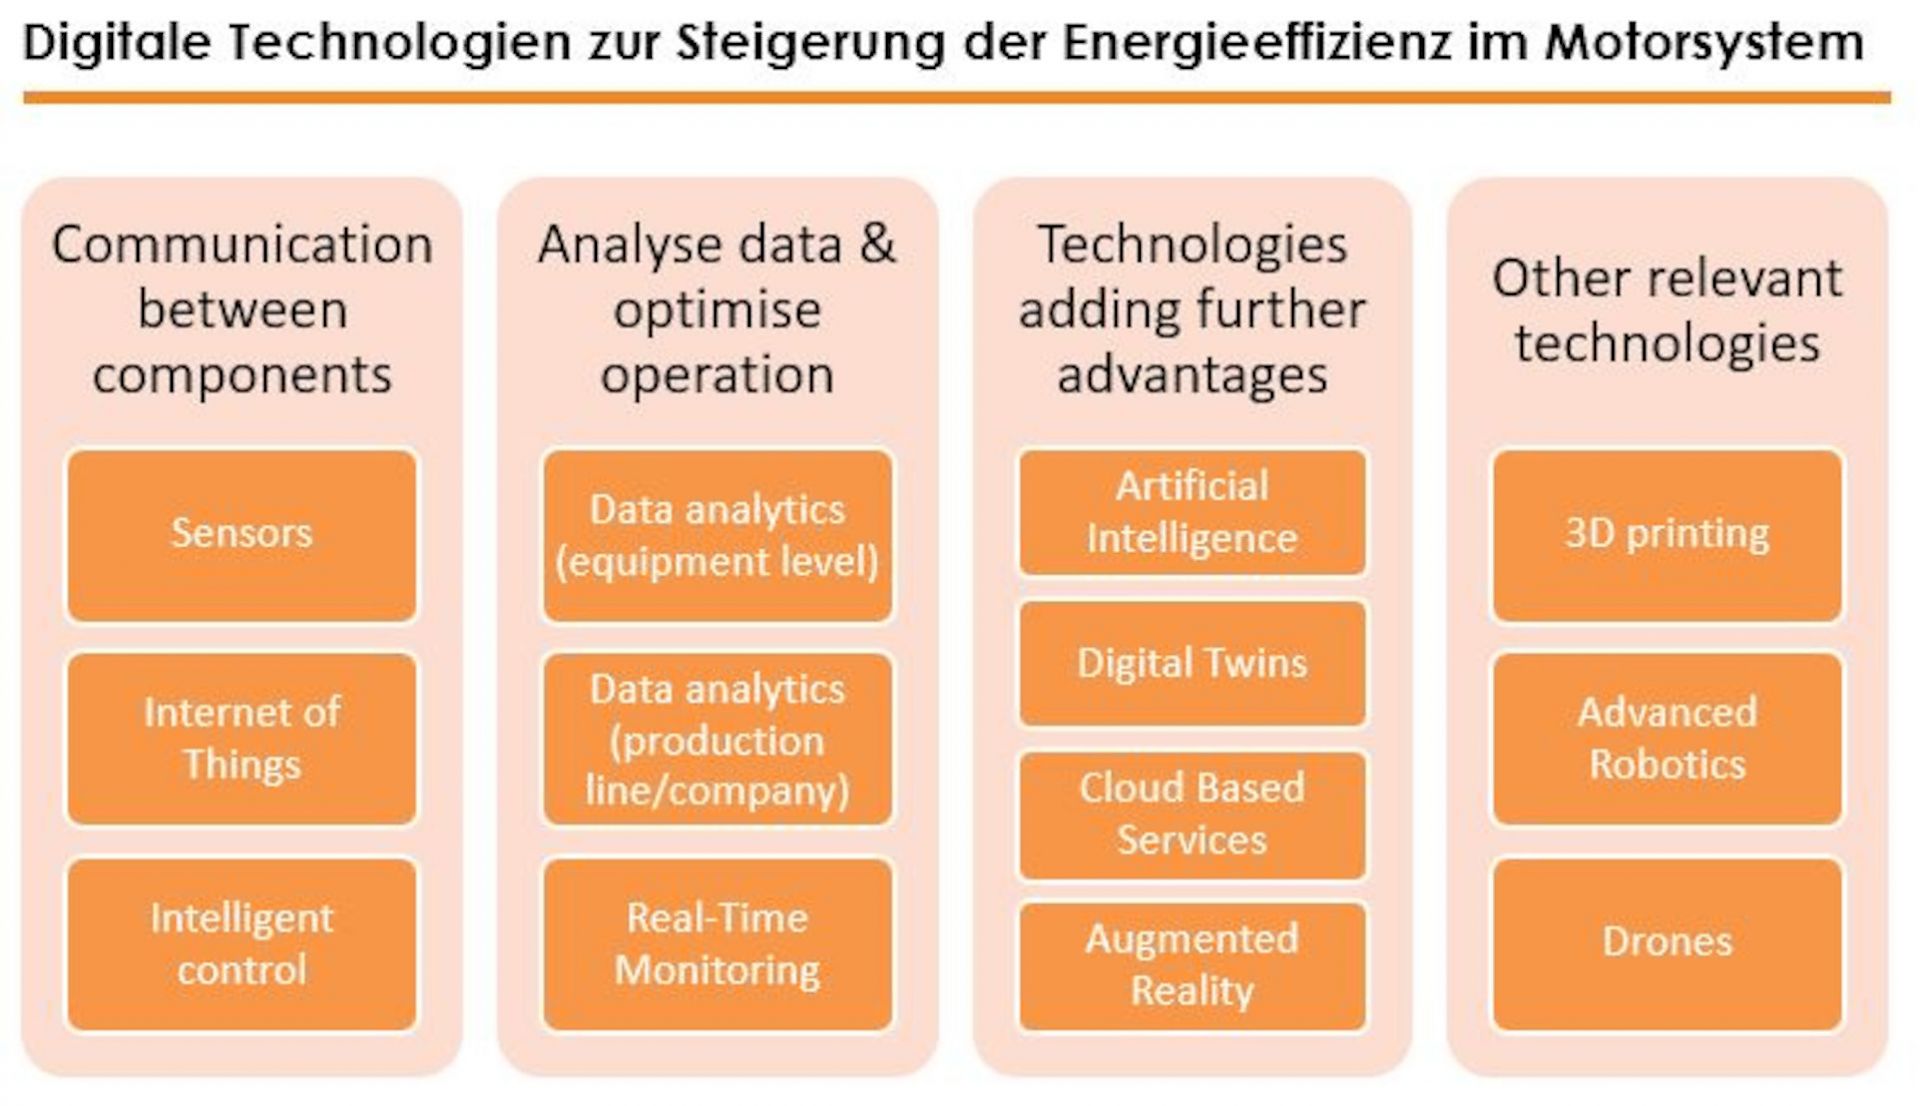
Digital Technologies to Increase the Energyefficiency in Electric Motor Systems
This figure gives an overview of the technologies that were identified as relevant for energy efficiency in electric motor systems in several workshops, in the survey and interviews. Starting on the left-hand side, technologies listed are smart sensors, advanced control on the level of machines and the Internet of things enabling communication between the different levels and components (in dark blue). Furthermore, the next level is the use of possibilities to analyse data and optimize operation (in green): data analytics on both the level of motor systems and on the level of production lines or even the whole company. Continuous monitoring of the different appliances is also significant. Technologies adding advantages to these applications (in grey) are digital twins, cloud-based services and artificial intelligence. Augmented reality can help to implement the suggested measures. Three technologies that are not directly related to the optimization of motor driven systems, but are of further interest include drones, 3D printing and advanced robotics.
Copyright: Österreichische Energieagentur, impact energy
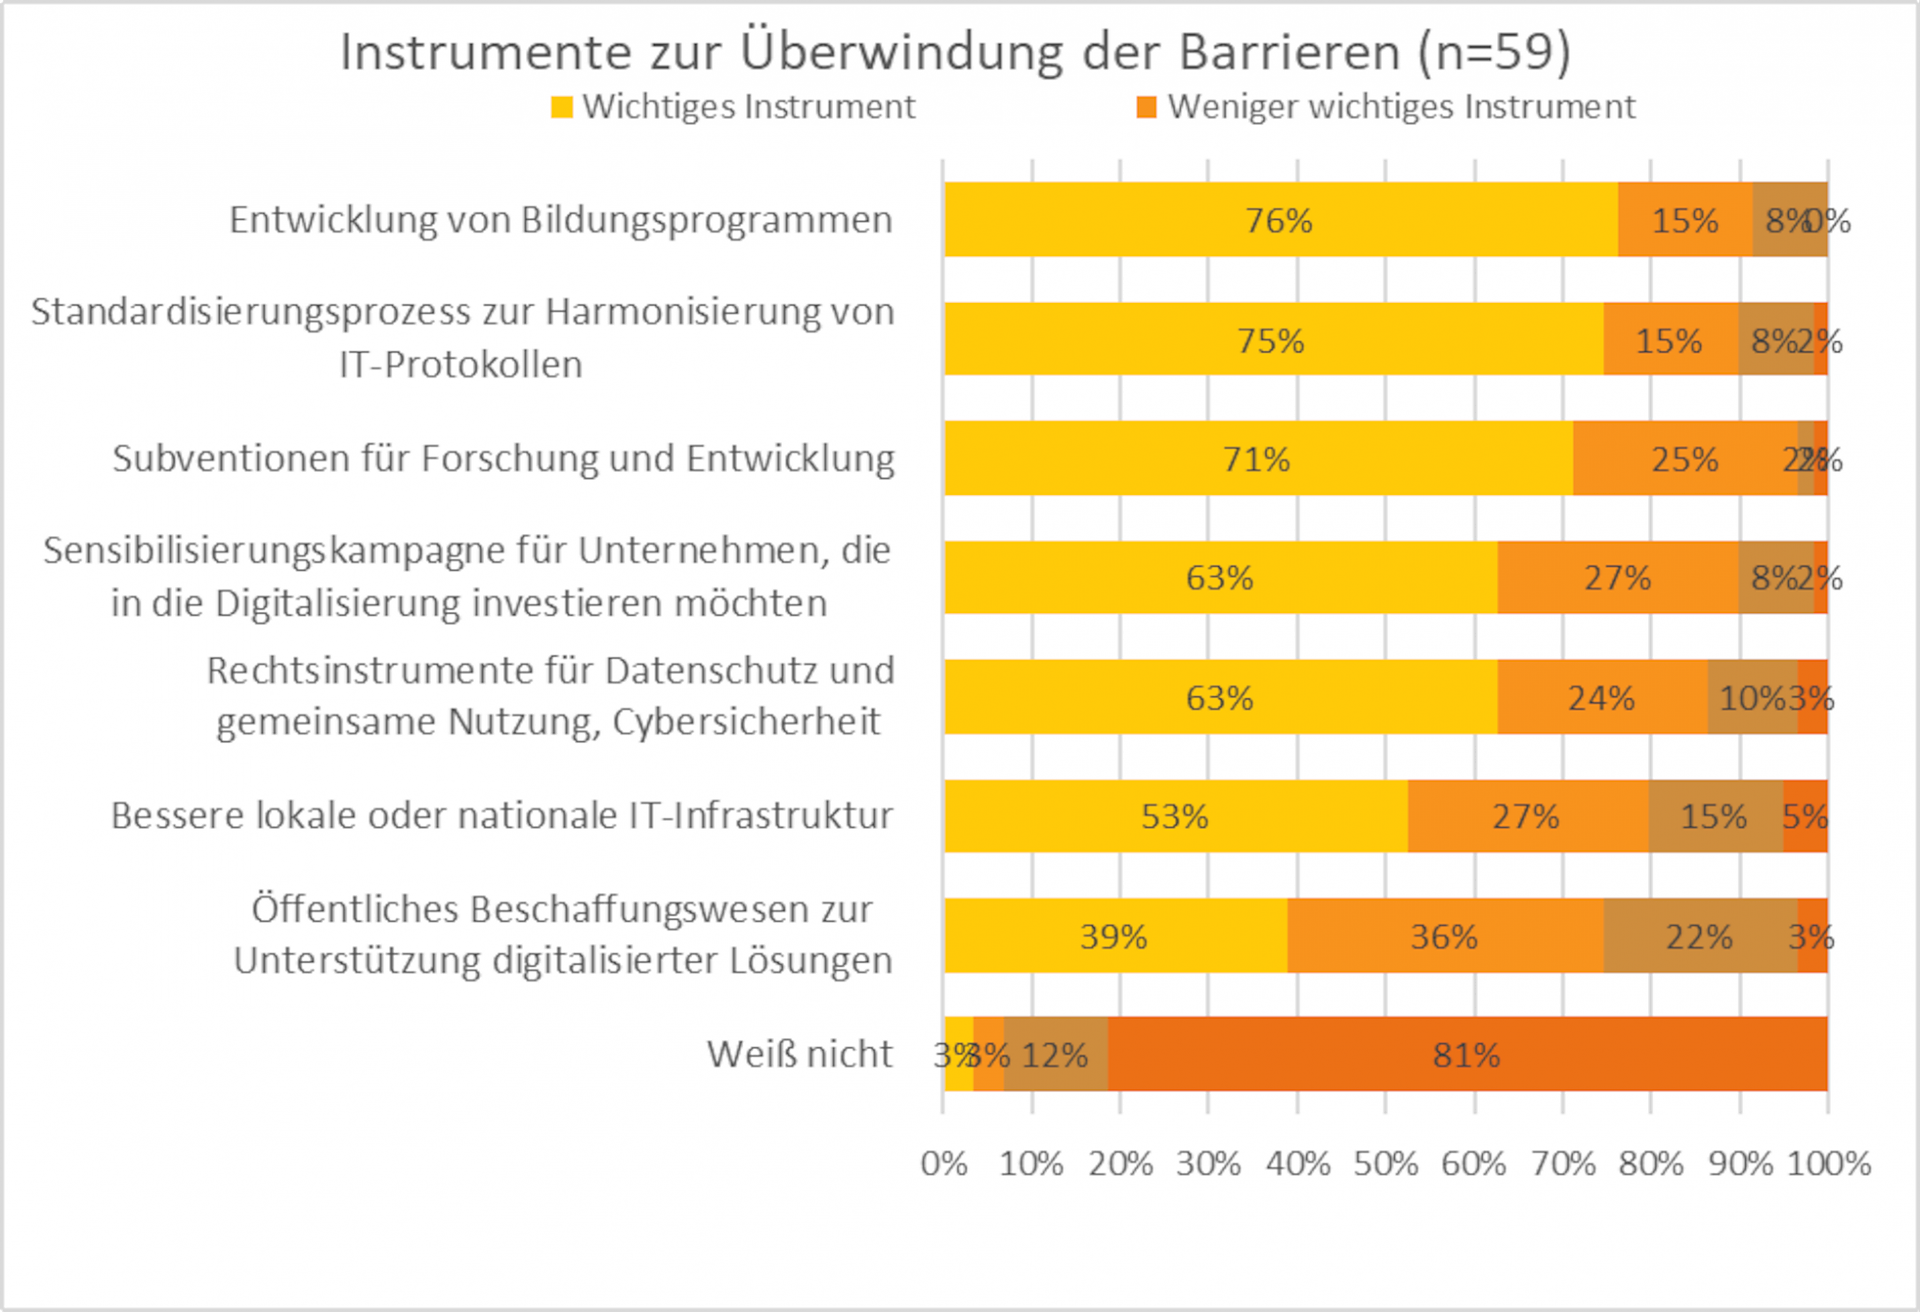
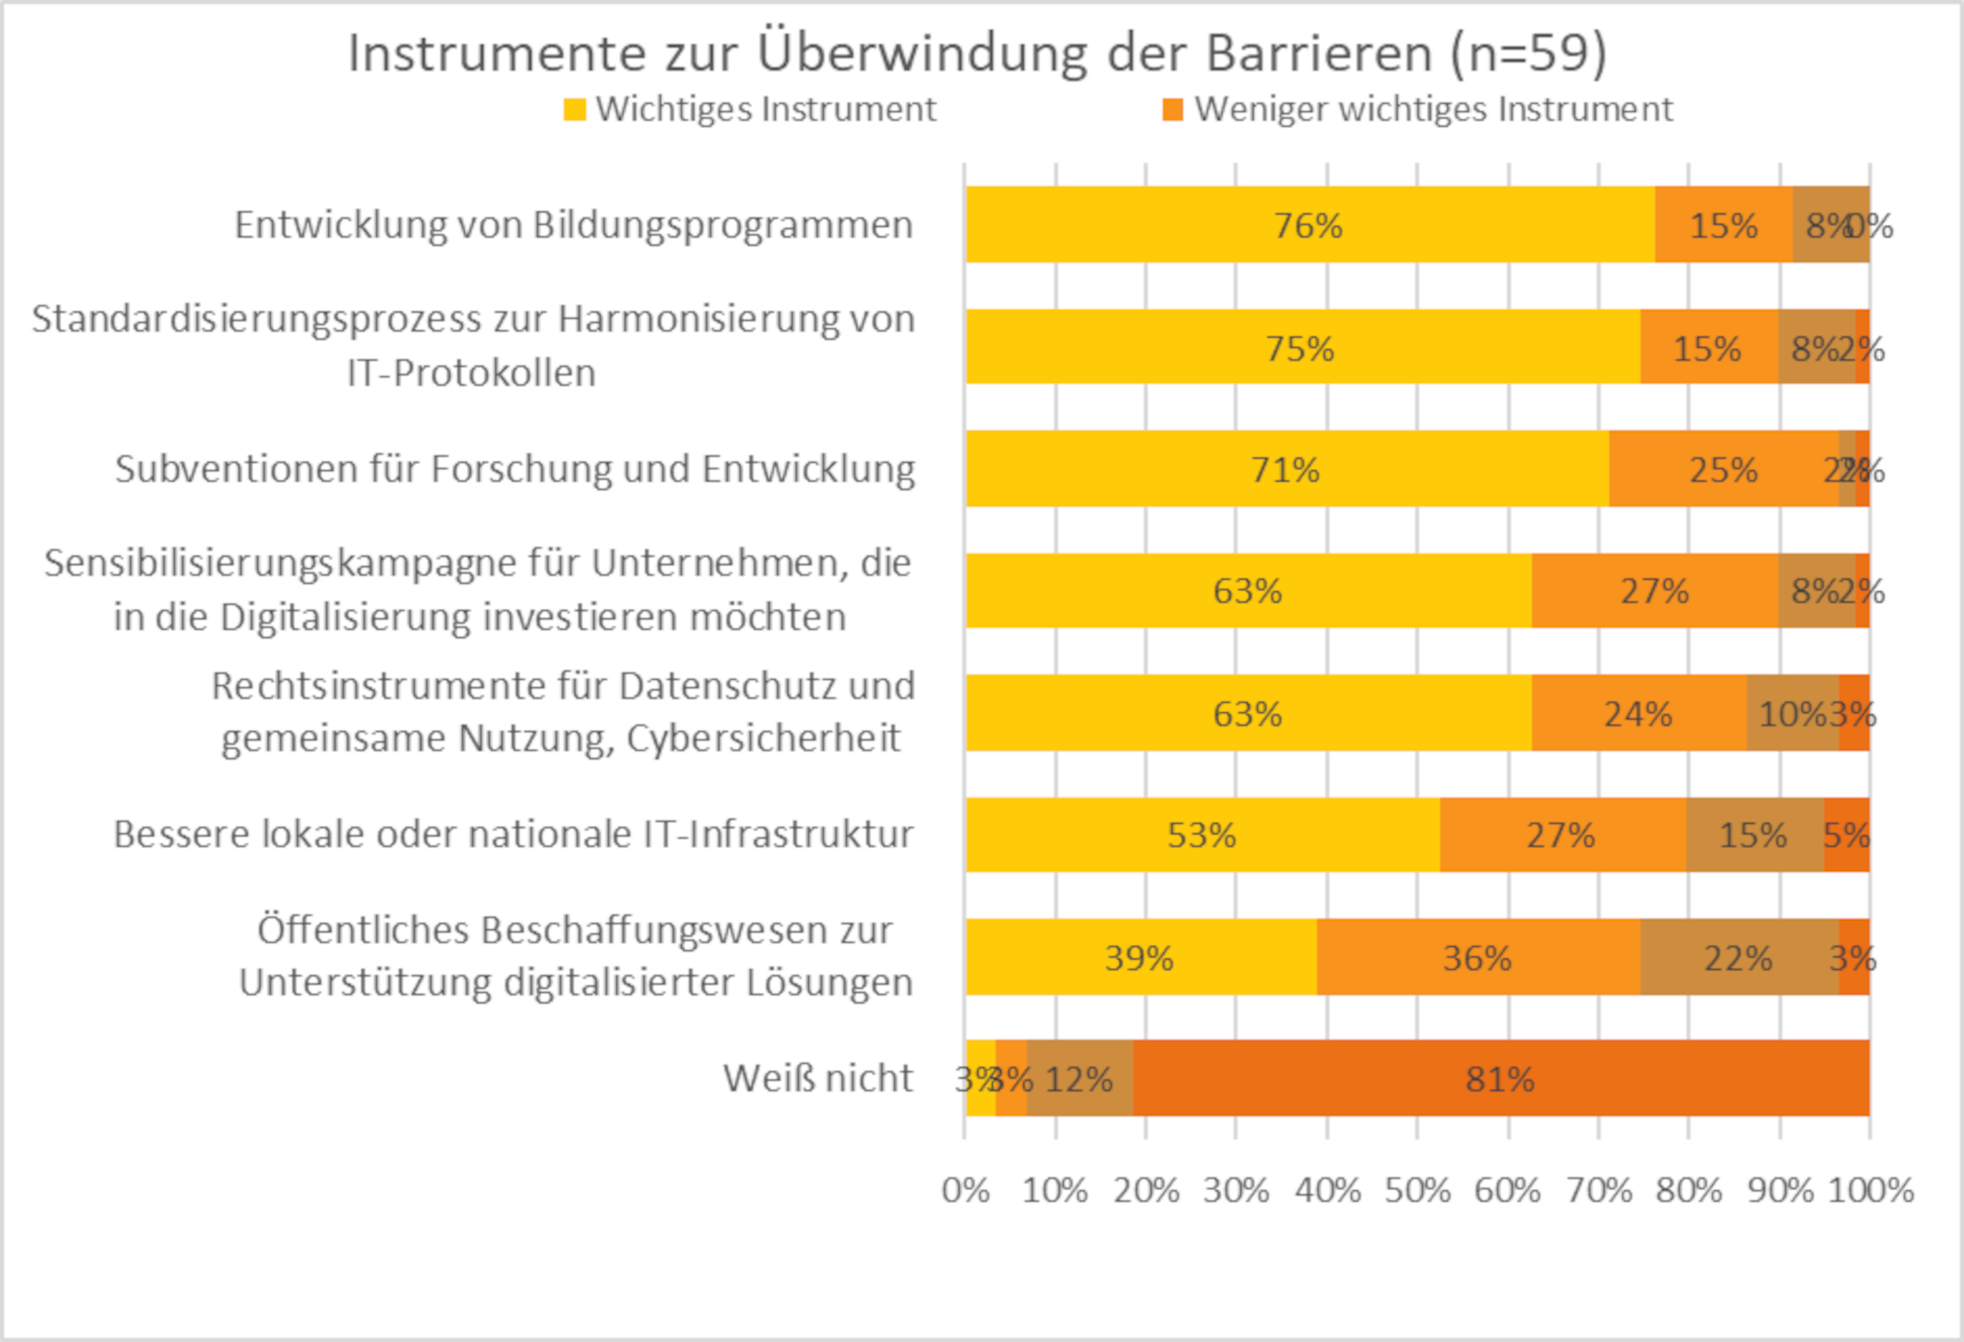
Important instruments to overcome barriers to using digital production technologies
Around three quarters of the respondents consider the development of education programmes and the standardisation process to harmonise protocols, as well as subsidies for research as important policy instruments to overcome these barriers.
Copyright: Österreichische Energieagentur
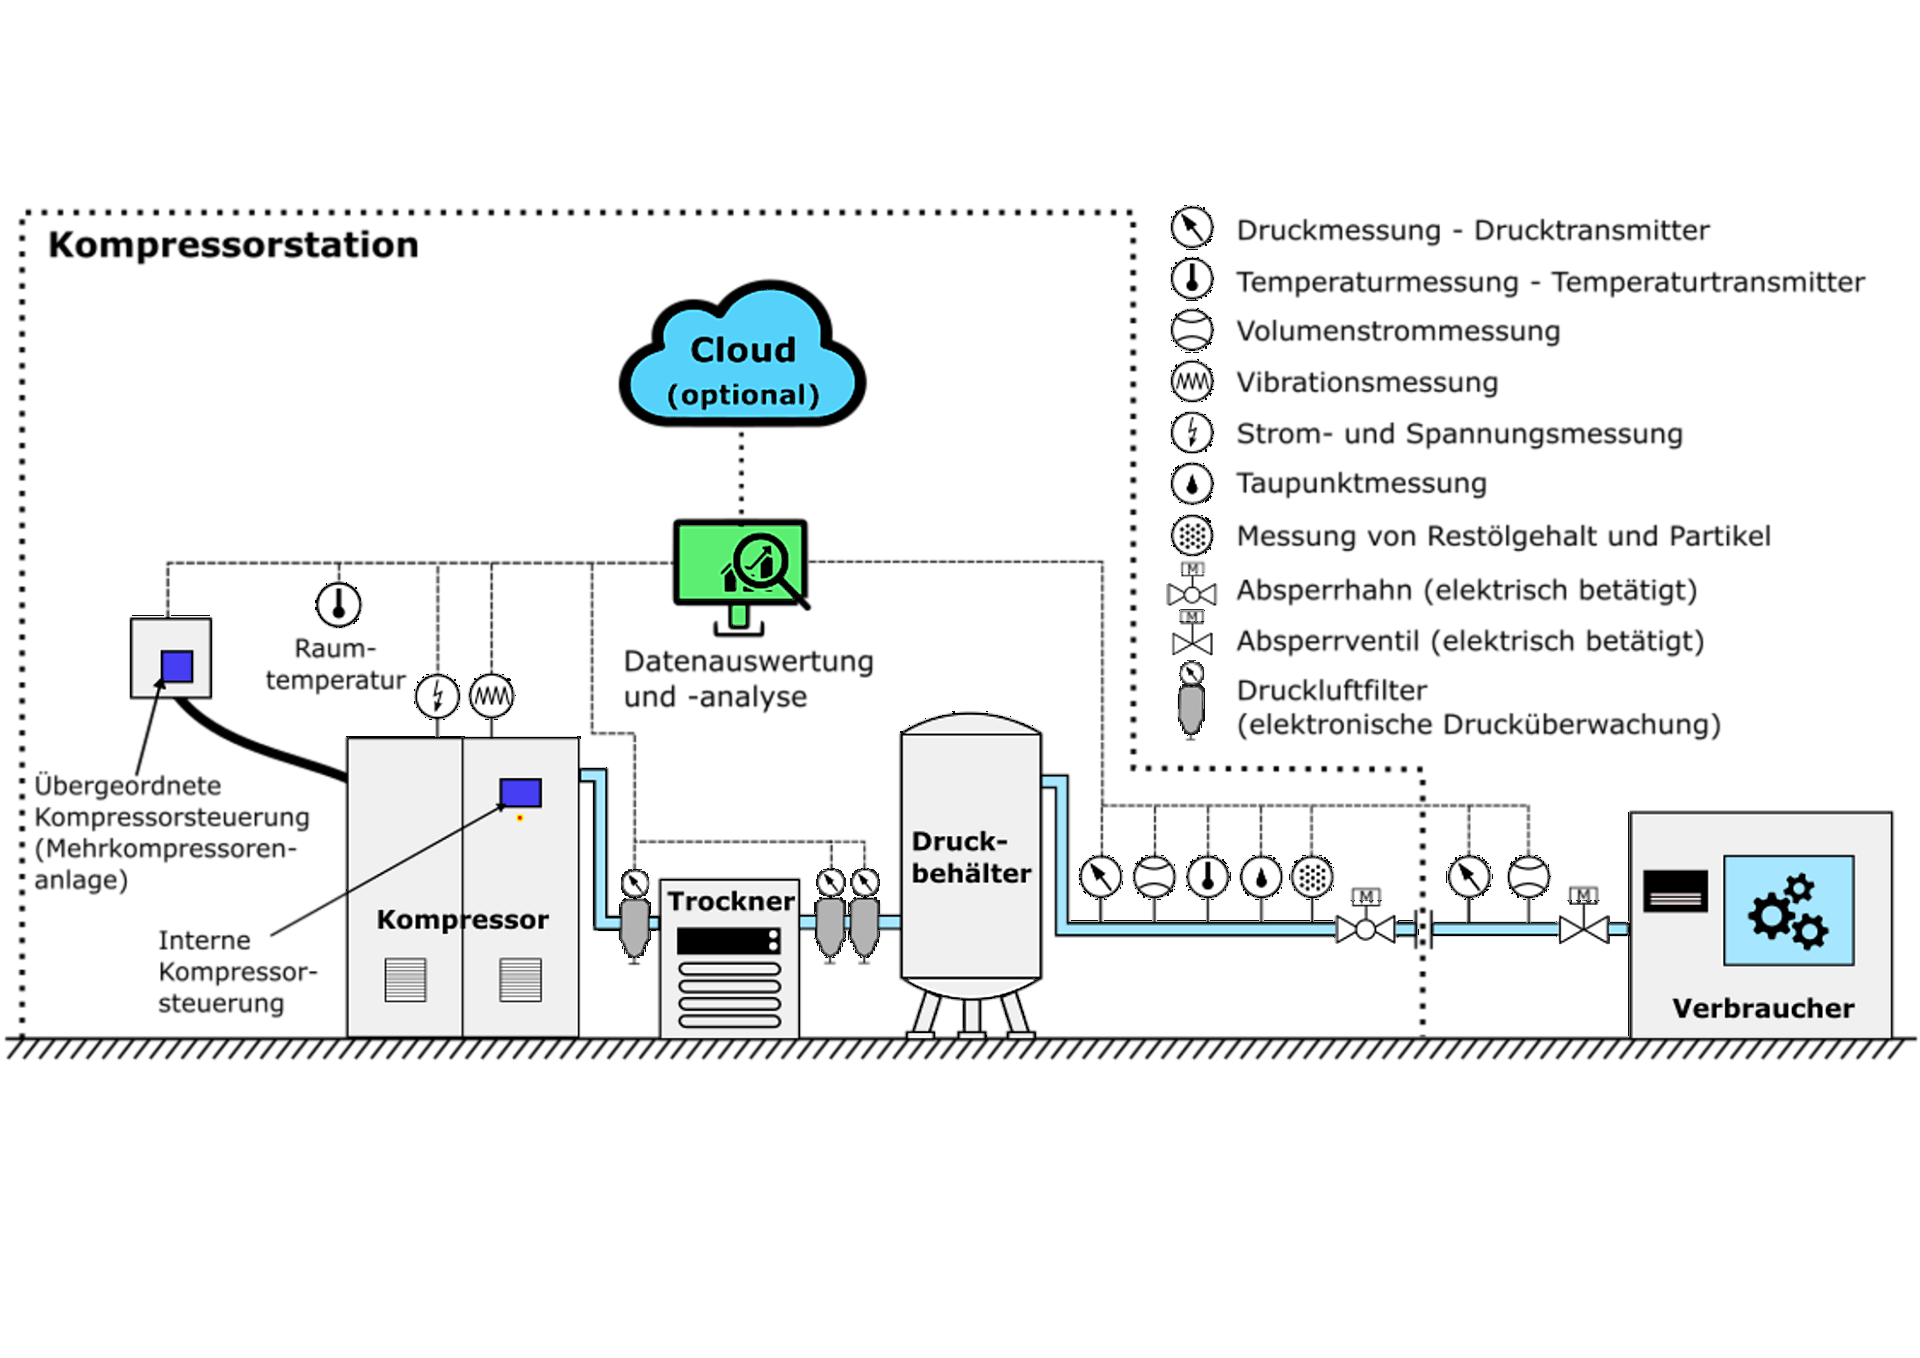
Overview of possible measuring points for the digitalization of compressed air systems
The diagram shows a compressor in the form of a larger square. Virbration measurement and current and voltage measurement are added here as small circles. There is a small rectangle on the square with the note: Internal compressor control. There is also a thick connection to another rectangle for higher-level control. Nearby is a small circle for the room temperature. A line comes out of the compressor to a compressed air filter with electronic pressure monitoring and on to a larger rectangle, the dryer. After two more compressed air filters, the line runs to the pressure tank, a larger oval with three feet. The line continues out of the pressure tank. The small circles with the designations for pressure measurement, volume flow measurement, temperature measurement, wobble point measurement and measurement for residual oil content and particles are then shown here one after the other, and an electrically operated stopcock is also drawn in. A dotted line in the form of a rectangle is drawn around these components for the compressor station. The pipe runs further out of this rectangle. Pressure measurement and volume flow measurement as well as an electrically operated shut-off valve are also drawn. At the end of the line, another rectangle is drawn with the label: Consumer. Within the dotted rectangle above the components mentioned are two symbols, one in the form of a computer screen labeled: Data evaluation and analysis, above it a blue cloud labeled: Cloud (optional). All the measurements mentioned are connected to the data evaluation via a dotted line.
Copyright: Österreichische Energieagentur

Options for detecting pump and motor malfunctions through current and voltage analysis
This diagram shows the cross-section of a radial pump on the left. This is connected via an axle to a coupling with the cross-section of an electric motor. This motor has a connection to a rectangle labeled FU for frequency converter, the thicker connection splits into three lines just before it, representing three phases. Three differently colored lines are drawn on these lines with small circles, which represent the three-phase current and voltage measurement and lead to a small upright rectangle. On the far right of the pump is a field with text that points to the pump cross-section with an arrow. The text states the following: An increase in the noise level around the supply frequency is typical of pump cavitation. Another field points to the coupling between pump and motor, a small rectangle as a connection between pump and motor axis. The text reads: An increase in the rotation frequency of the motor and its harmonics as well as an increase in the noise level are typical of a coupling fault. Another field points to the point where the motor axle comes out of the motor housing, where a bearing is marked. The text in this field reads: An increase in the cage frequency of the rolling bearing is typical of bearing wear. The text fields mentioned so far are highlighted in blue. This color indicates mechanical faults. Another field with a red background indicates the inside of the electric motor. The text reads: Short circuits in the stator winding typically show an increase in odd current harmonics. The red color indicates an electrical fault.
Copyright: Österreichische Energieagentur

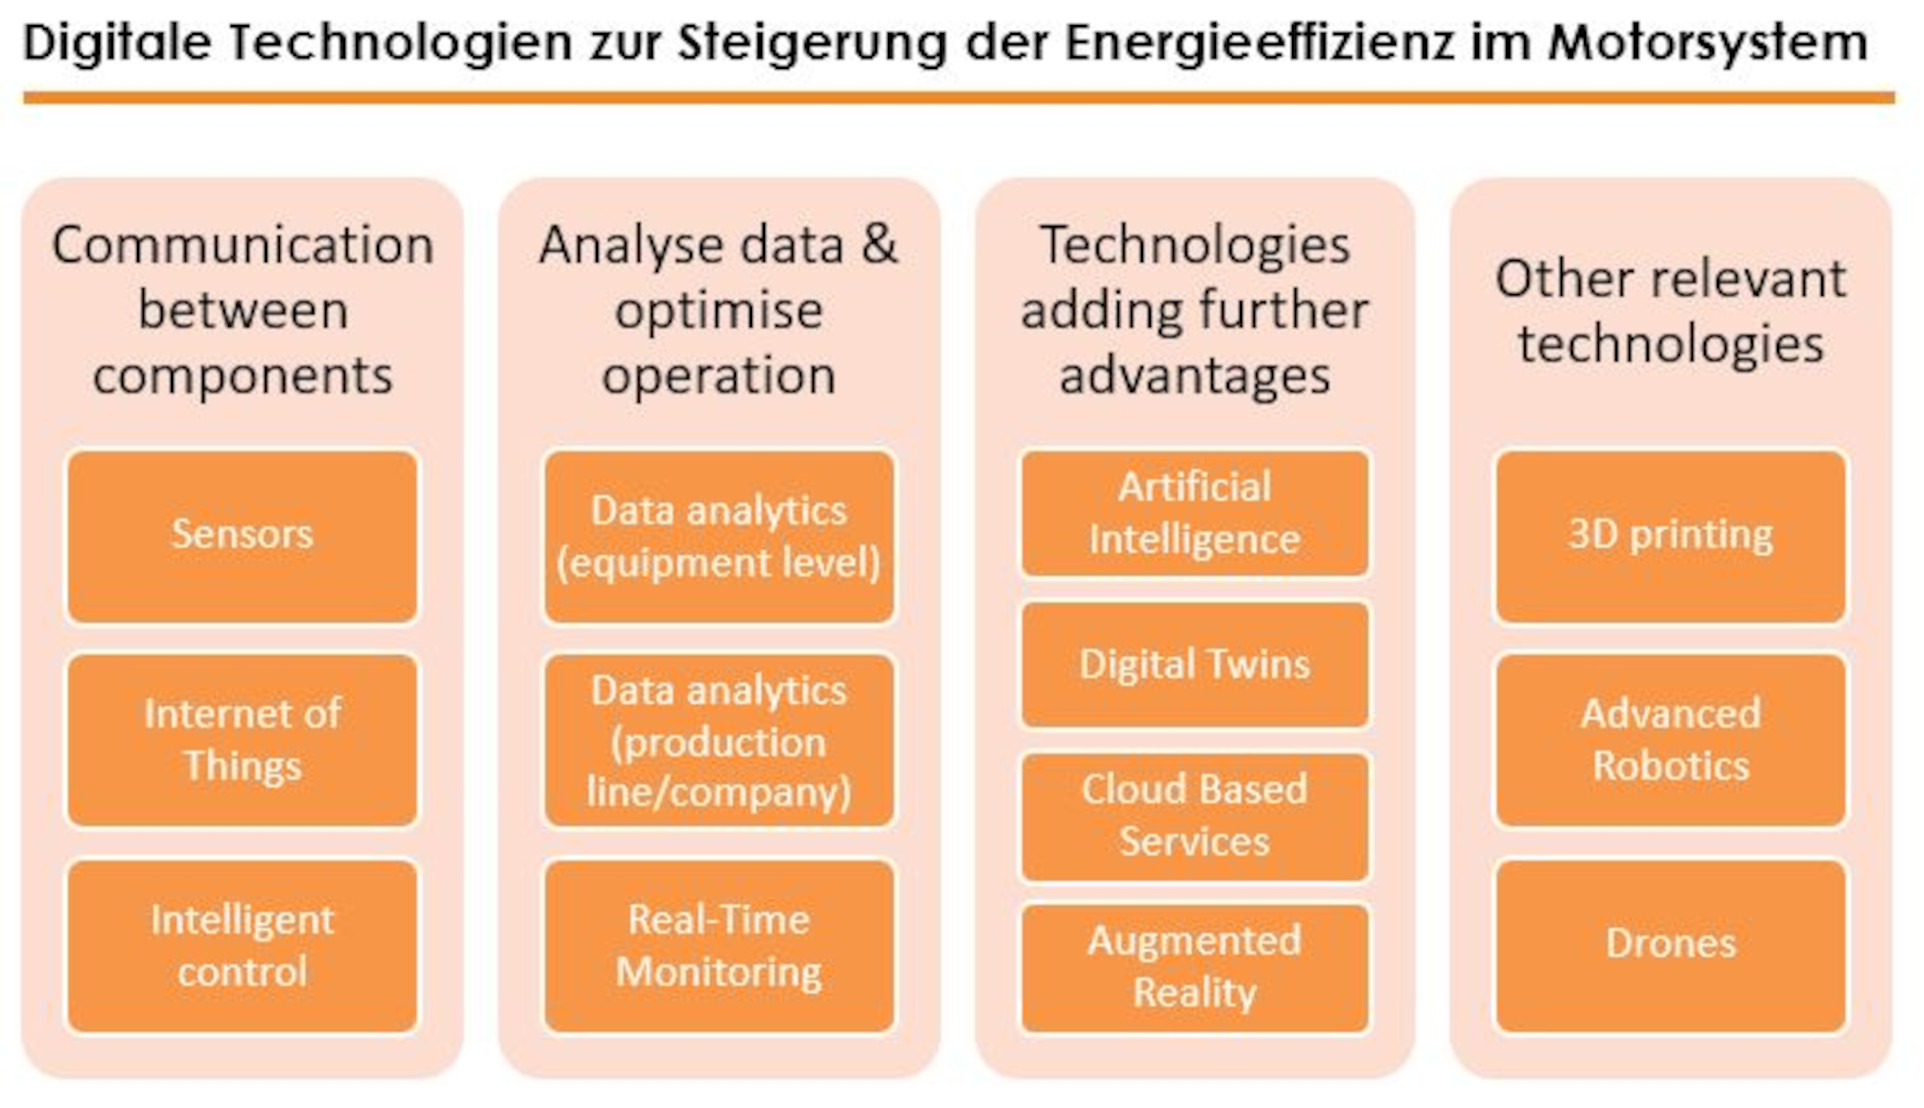
Digital Technologies to Increase the Energyefficiency in Electric Motor Systems
The figure gives an overview of the technologies that were identified as relevant for energy efficiency in electric motor systems in several workshops, in the survey and interviews. Starting on the left-hand side of this picture technologies listed are smart sensors, advanced control on the level of machines and the Internet of things enabling communication between the different levels and components (in dark blue). Furthermore, the next level is the use of possibilities to analyse data and optimize operation (in green): data analytics on both the level of motor systems and on the level of production lines or even the whole company. Continuous monitoring of the different appliances is also significant. Technologies adding advantages to these applications (in grey) are digital twins, cloud-based services and artificial intelligence. Augmented reality can help to implement the suggested measures. Three technologies that are not directly related to the optimization of motor driven systems, but are of further interest include drones, 3D printing and advanced robotics (in dark blue at the right side of Figure 1). Starting on the left-hand side in Figure 1, technologies listed are smart sensors, advanced control on the level of machines and the Internet of things enabling communication between the different levels and components (in dark blue). Furthermore, the next level is the use of possibilities to analyse data and optimize operation (in green): data analytics on both the level of motor systems and on the level of production lines or even the whole company. Continuous monitoring of the different appliances is also significant. Technologies adding advantages to these applications (in grey) are digital twins, cloud-based services and artificial intelligence. Augmented reality can help to implement the suggested measures. Three technologies that are not directly related to the optimization of motor driven systems, but are of further interest include drones, 3D printing and advanced robotics (in dark blue at the right side of Figure 1).
Copyright: Österreichische Energieagentur, impact energy
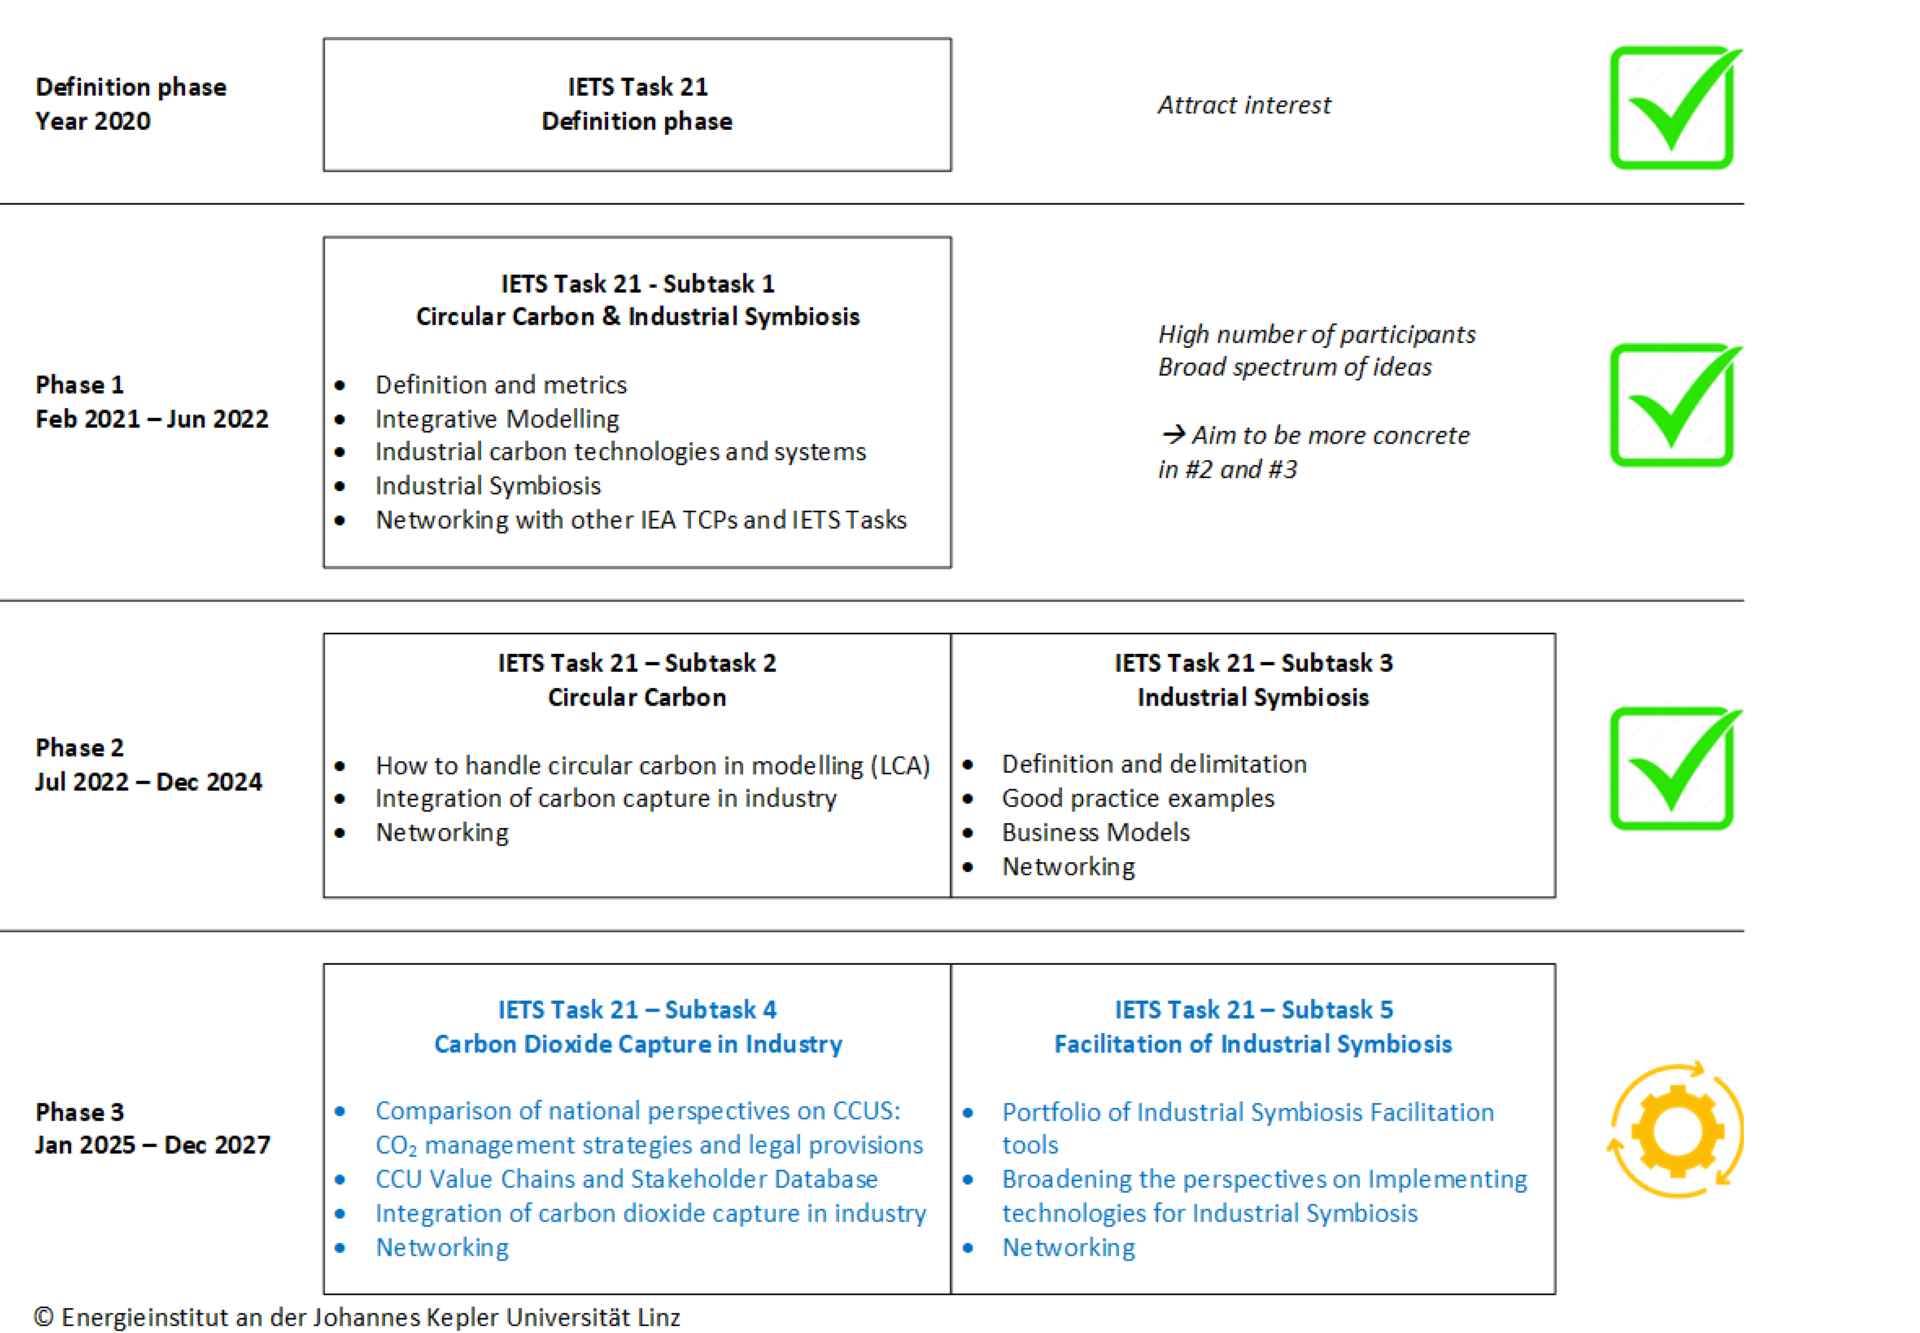
Overview IETS Task 21 Phase 3
The IETS Task 21 at a glance: A clear presentation of its development from its initiation in 2020 to Phase 3, including the activities of Subtasks 1 to 5.
Copyright: Eigene Darstellung: Moser, Energieinstitut an der JKU

New CCU/CCS value chains
Project-based analysis of new CCU and CCS value chains using a canvas.
Copyright: Gahleitner/Böhm/Moser, Energieinstitut an der JKU
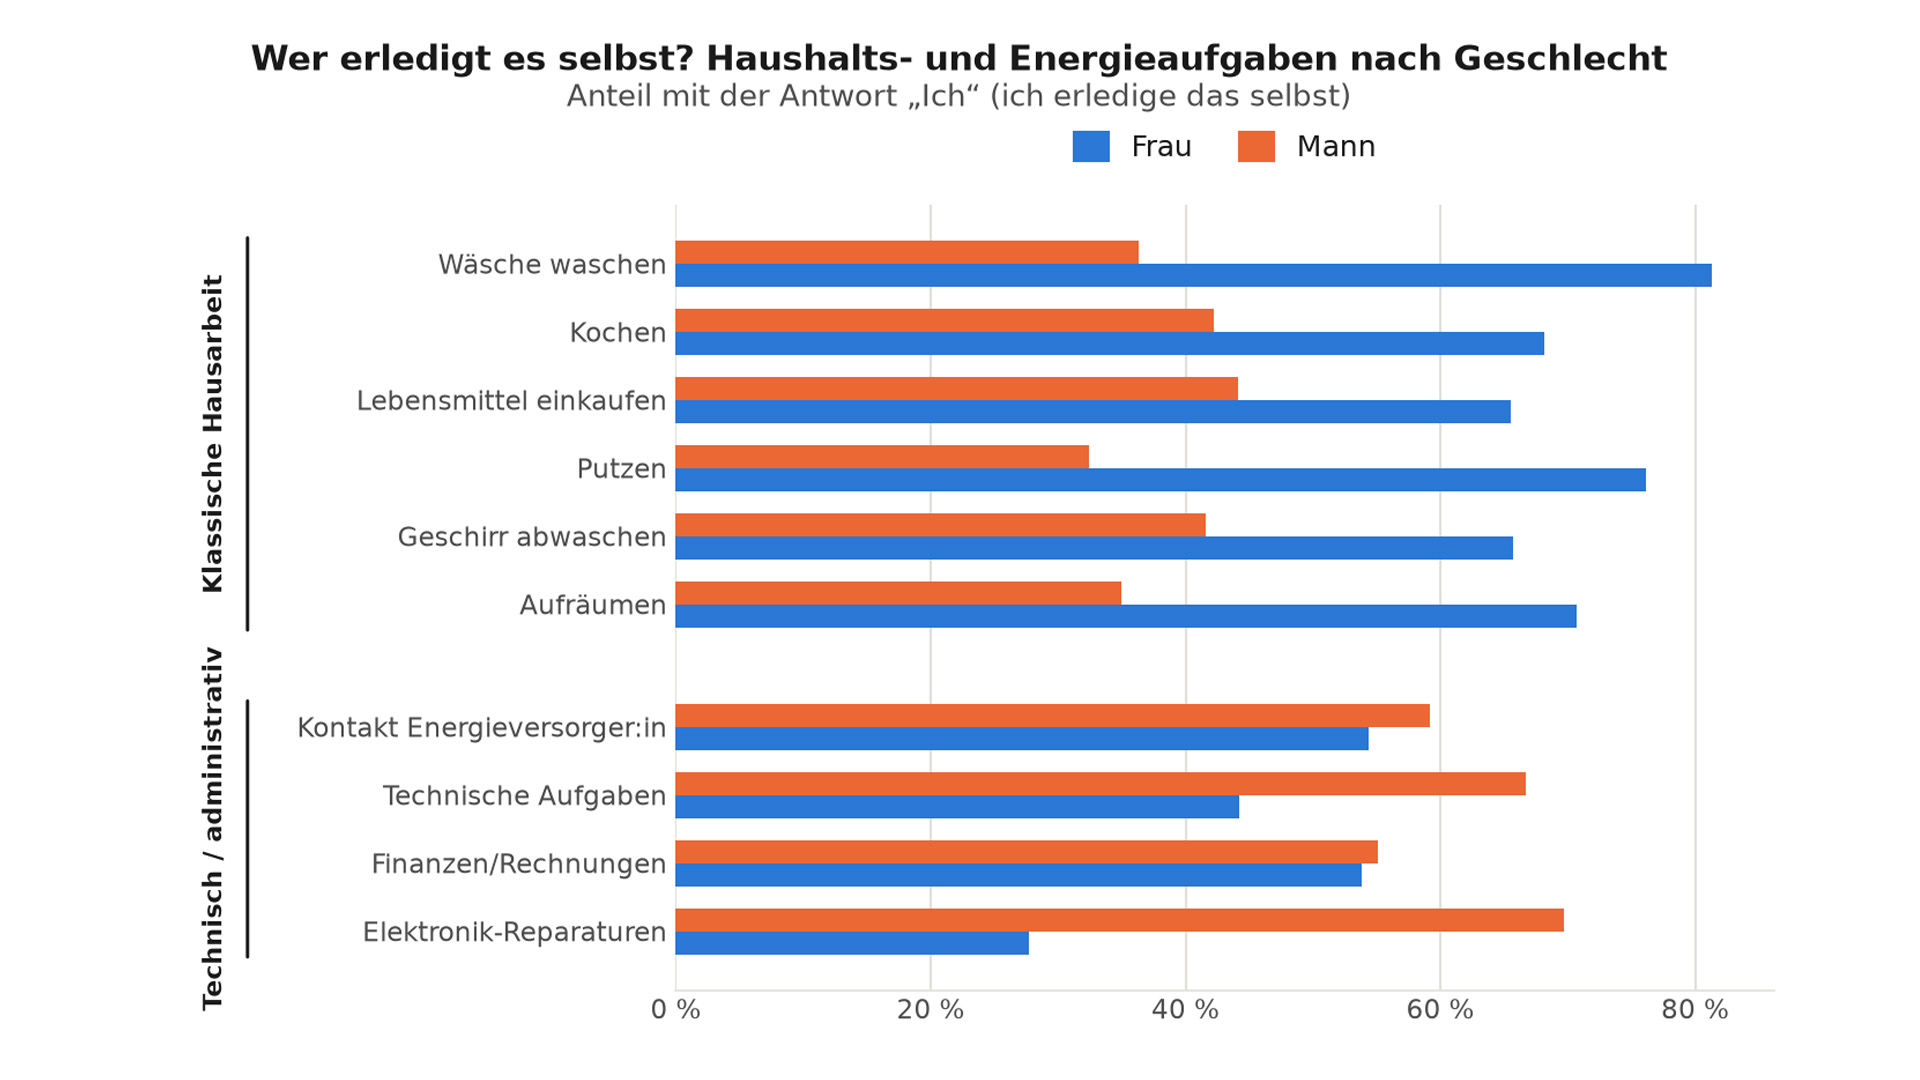
Who does it themselves? Household and energy-related tasks by gender
The chart shows the proportion of women and men who stated that they carry out the following tasks themselves: Traditional household chores such as doing the laundry, cooking, shopping for food, cleaning, washing up and tidying up are predominantly carried out by women. Technical and administrative tasks such as liaising with the energy supplier, technical tasks, managing finances and carrying out repairs are predominantly carried out by men.
Copyright: ÖGUT
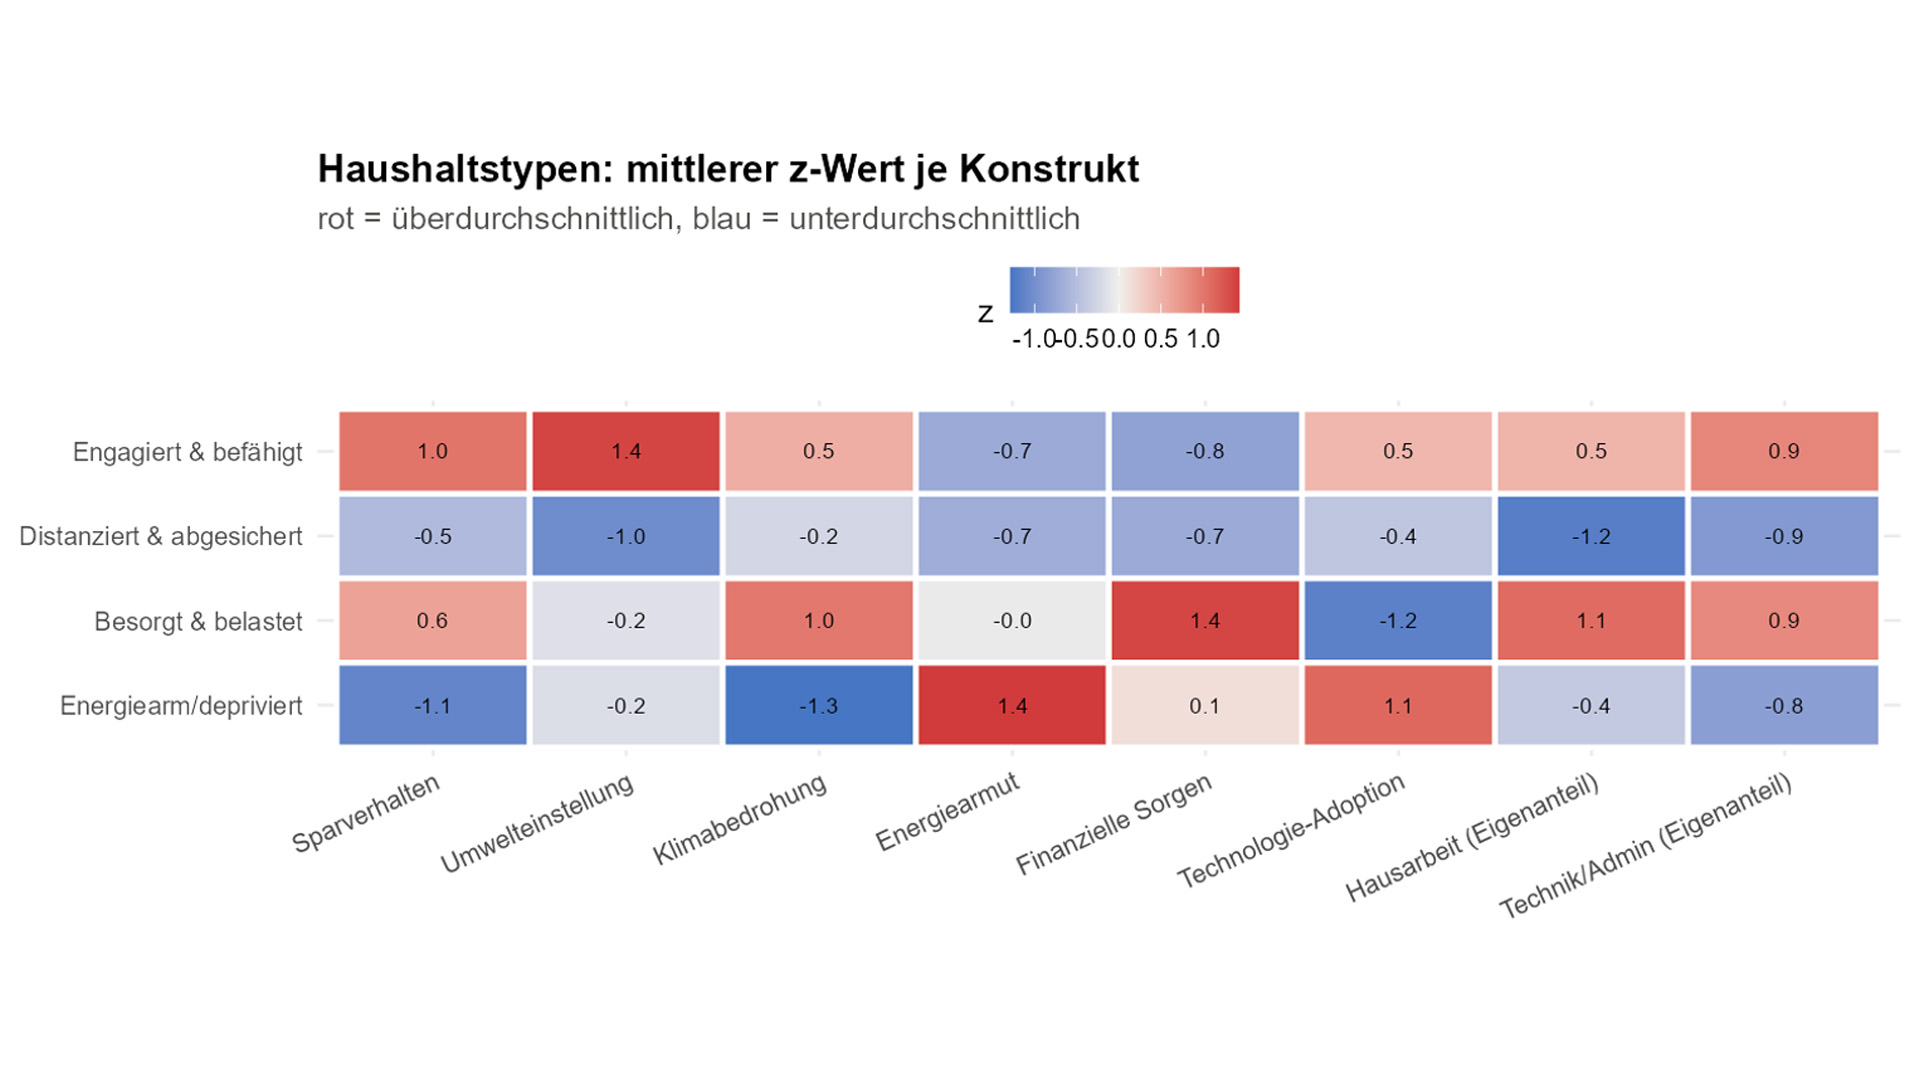
Cluster analysis of types of households
The cluster analysis identified four descriptive household types based on patterns of energy use, environmental attitudes, financial concerns and household characteristics. Typ A – „Engagiert & befähigt“ (34%) and Typ B – „Distanziert & abgesichert“ (35%) represent relatively less vulnerable households, while Typ C – „Besorgt & belastet“ (25%) captures households facing intersecting financial, housing and care-related pressures, and Typ D – „Energiearm & depriviert“ (7%) represents the most severely affected group. Given the moderate distinction between clusters, these types should be understood as indicative patterns rather than fixed or sharply defined categories.
Copyright: ÖGUT
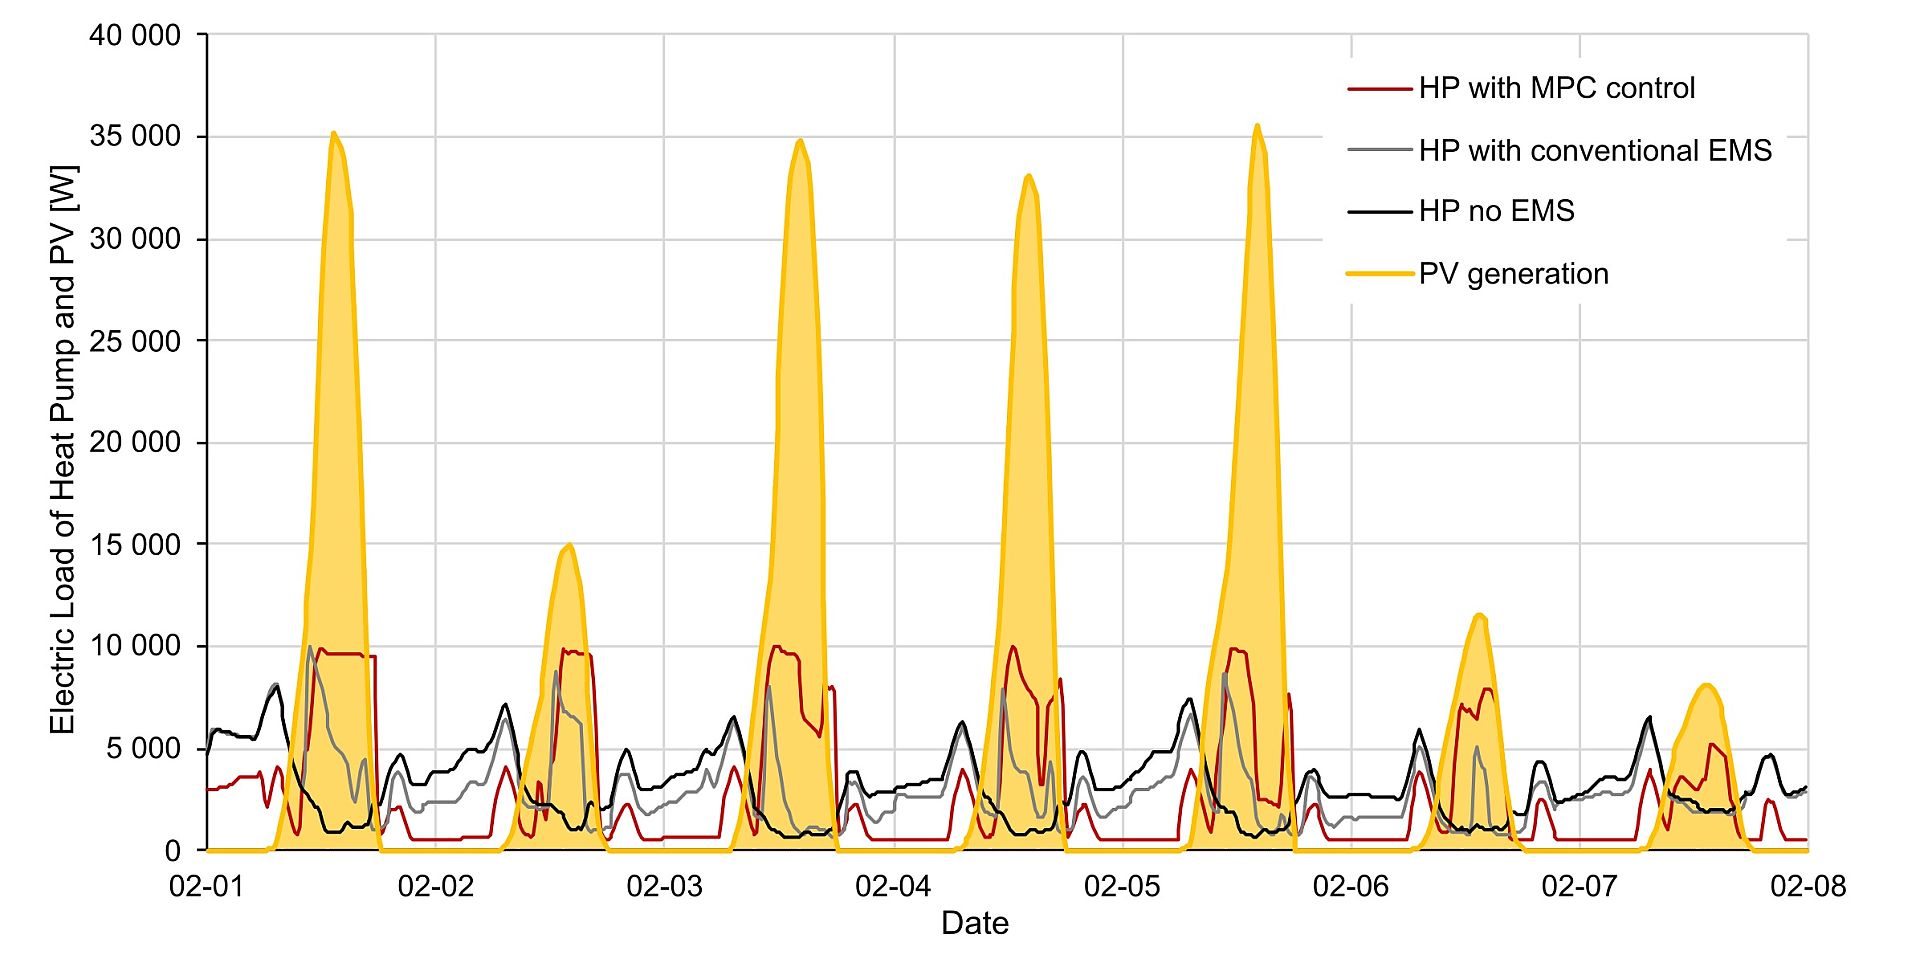
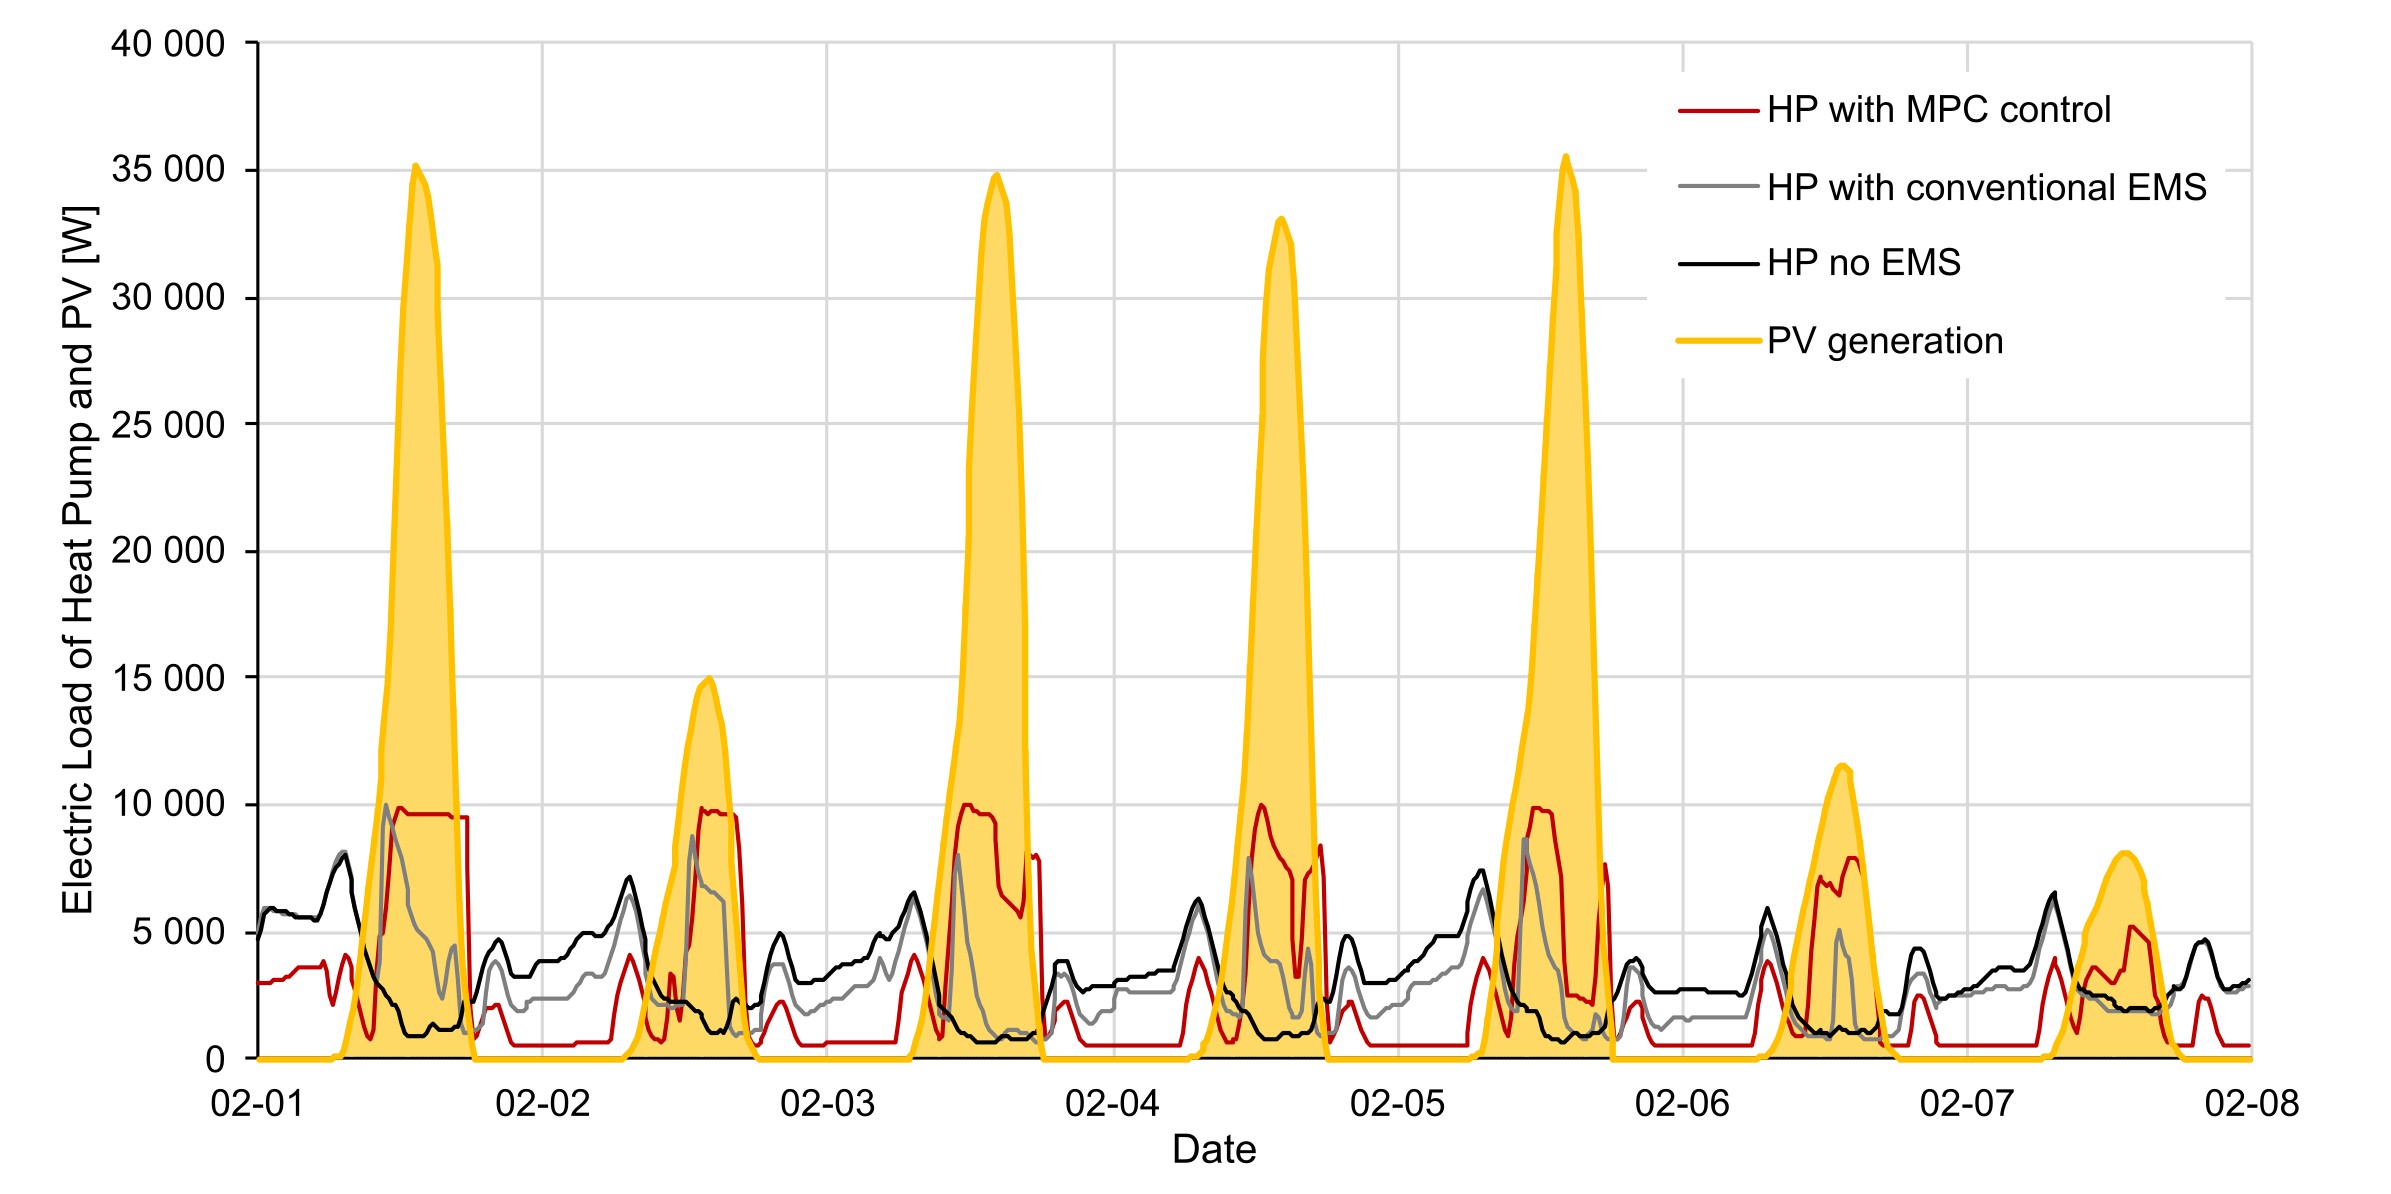
Simultaneity of PV electricity generation and heat pump electricity demand for different control strategies in the PEB use case EXCESS
Comparison of the electricity demand of heat pumps under different control strategies, simulated for the Austrian EXCESS demonstration building, in relation to the available PV generation on the façade for an average winter week in February. The building under investigation represents a use case in the IEA EBC Annex 83 project.
Copyright: AEE INTEC

Duration curves of heating power for the coldest week of the year – comparison of standard control vs. MPC
One use case considered in the IEA EBC Annex 83 is a thermally activated building that was designed within the national research project HybridLSC. The thermally activated building mass allows for temporal load shifting by means of model predictive control (MPC) of the building. A comparison of the duration curves of heating power for the coldest week of the year between a standard control strategy and an MPC-based control strategy shows a significant reduction in peak loads, which is achieved without any loss of comfort for the occupants. This is essential for the optimal sizing of heat sources and forms the basis for reducing peak loads in energy networks.
Copyright: AEE INTEC

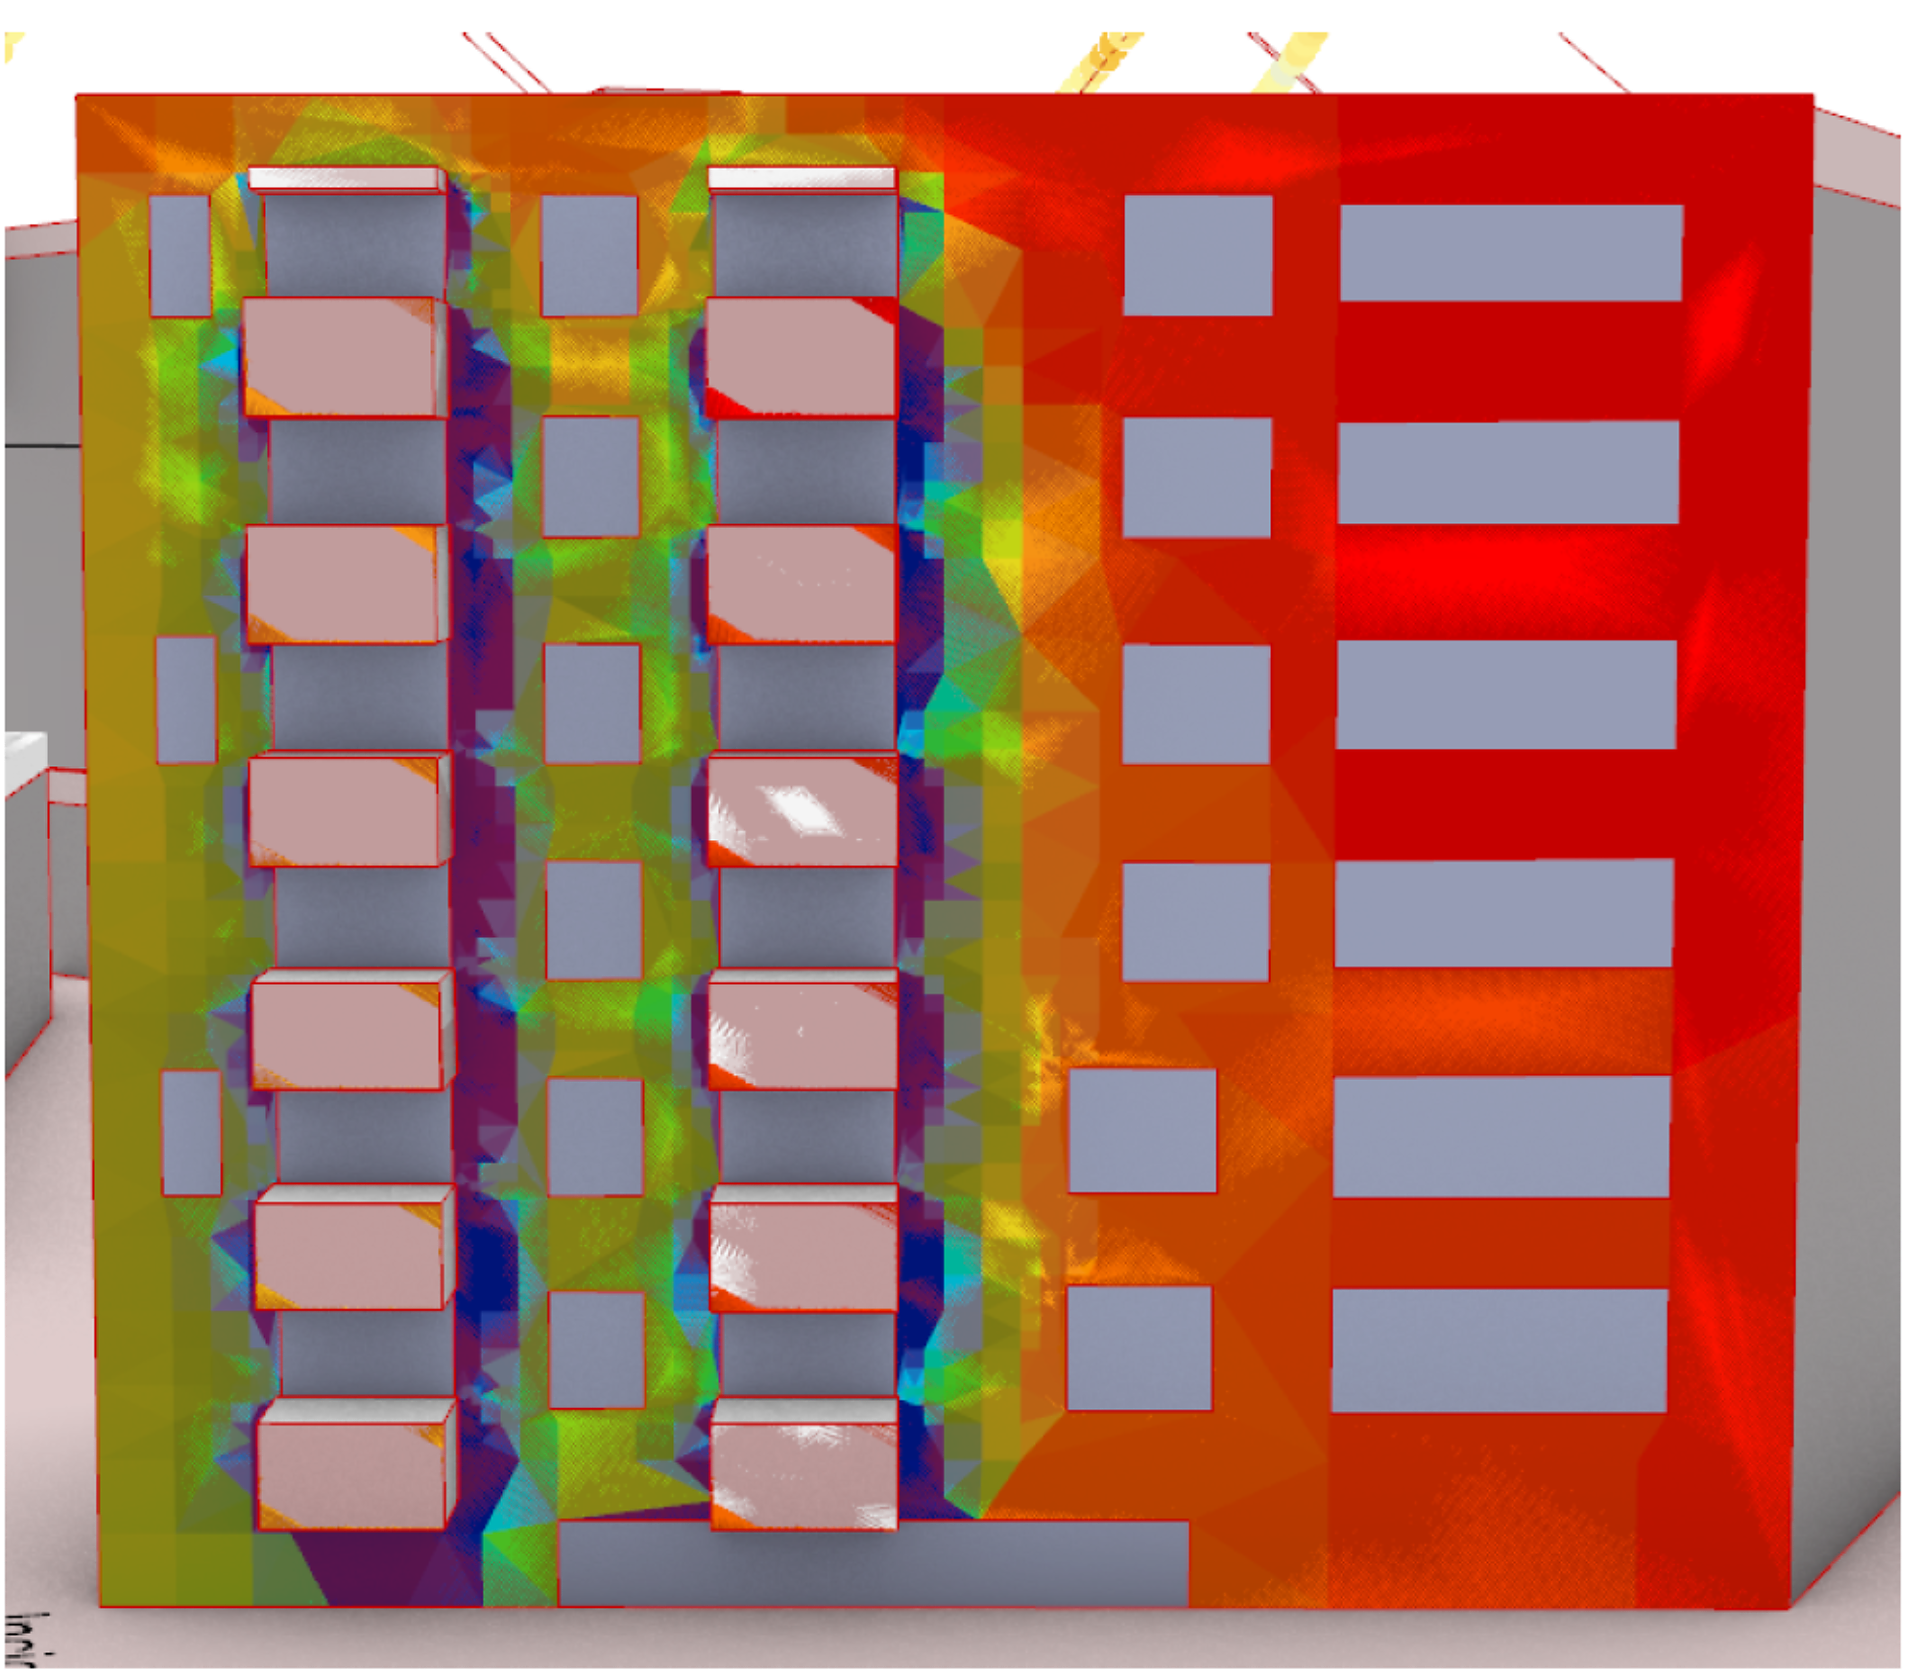
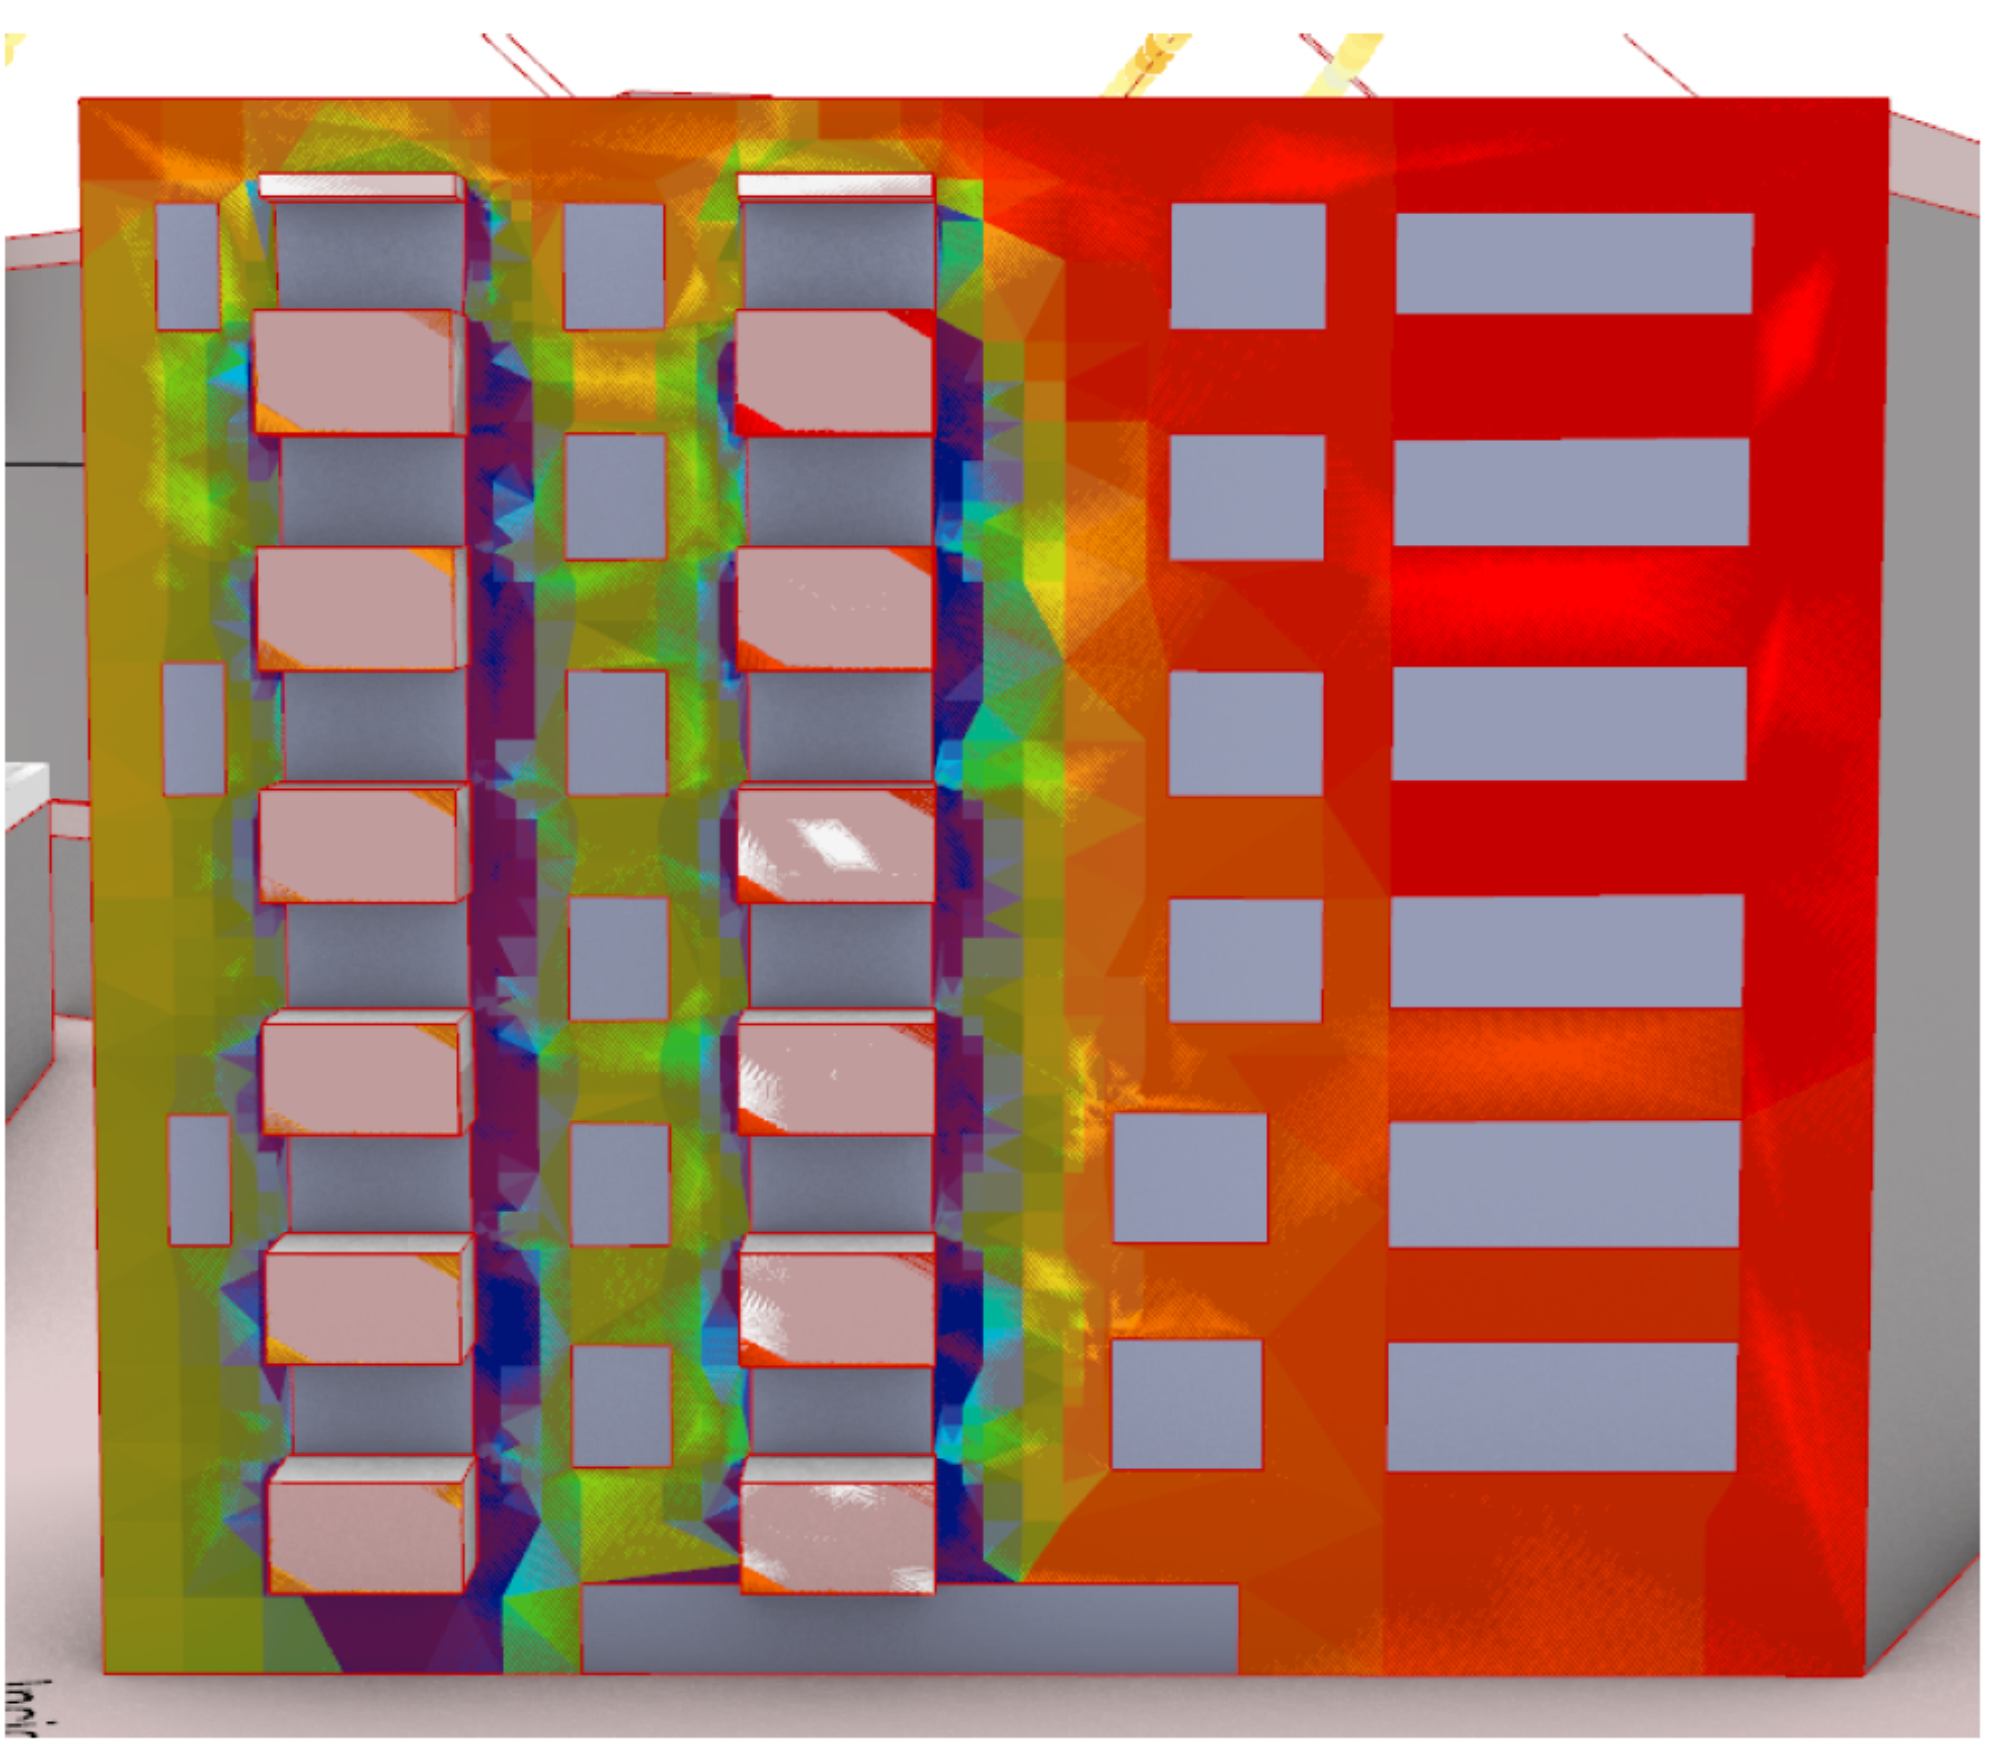
Innsbruck Campagne
PV Potential of the Facade - Project Innsbruck Campagne
Copyright: UIBK Heiß/Ochs
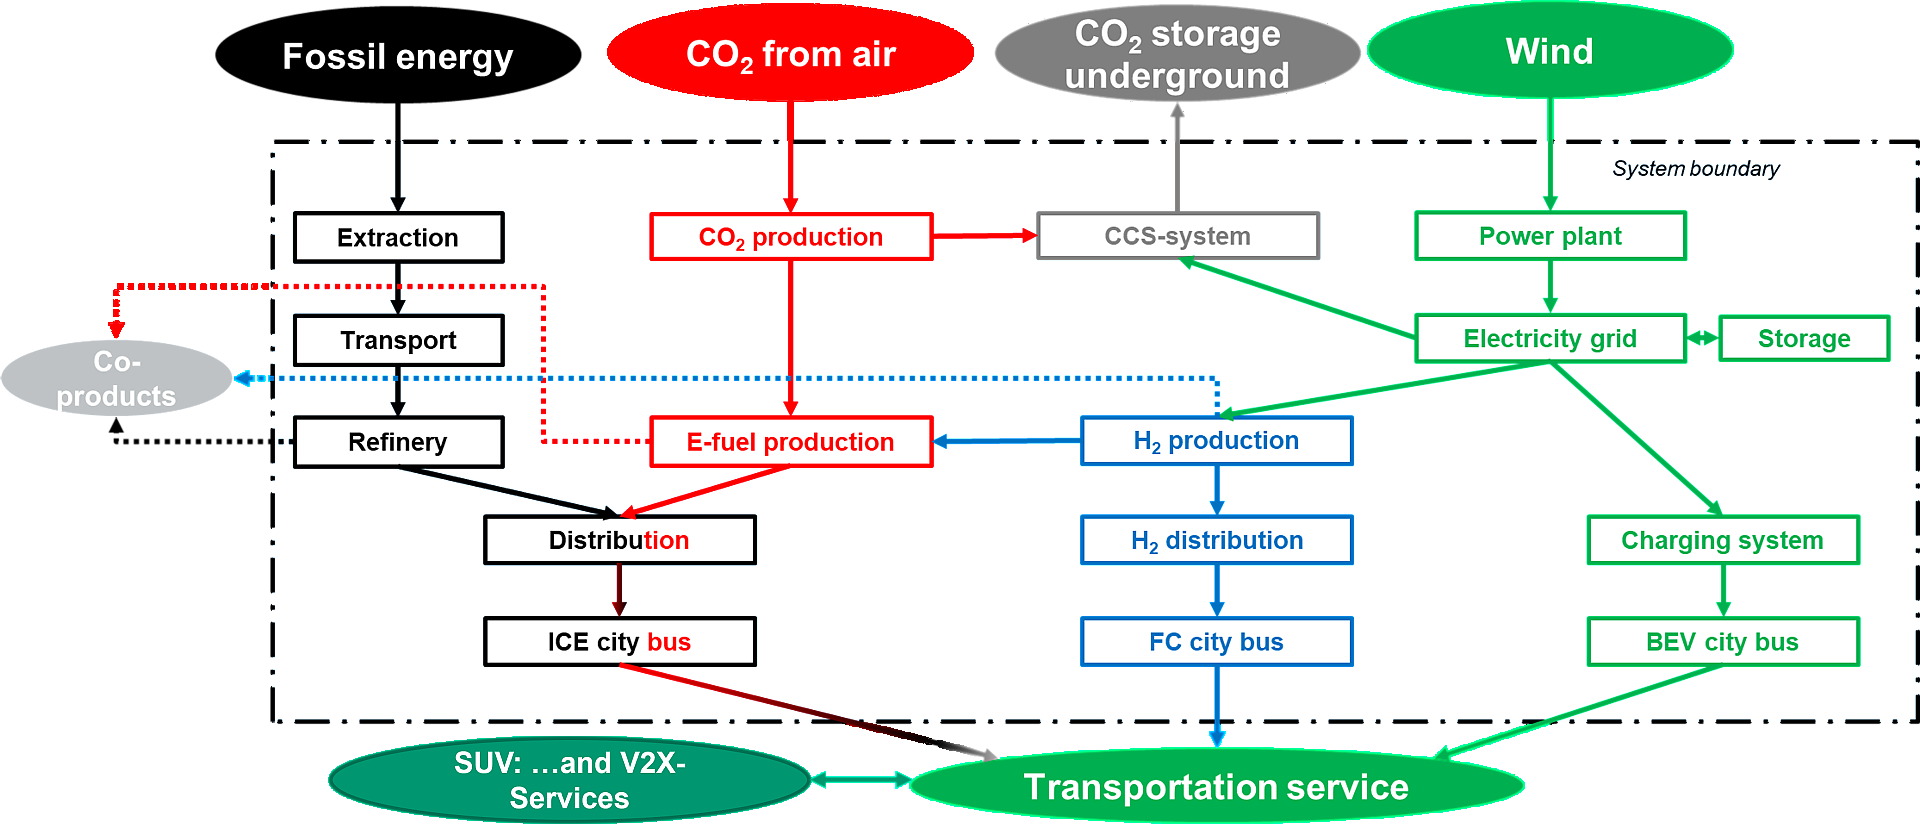
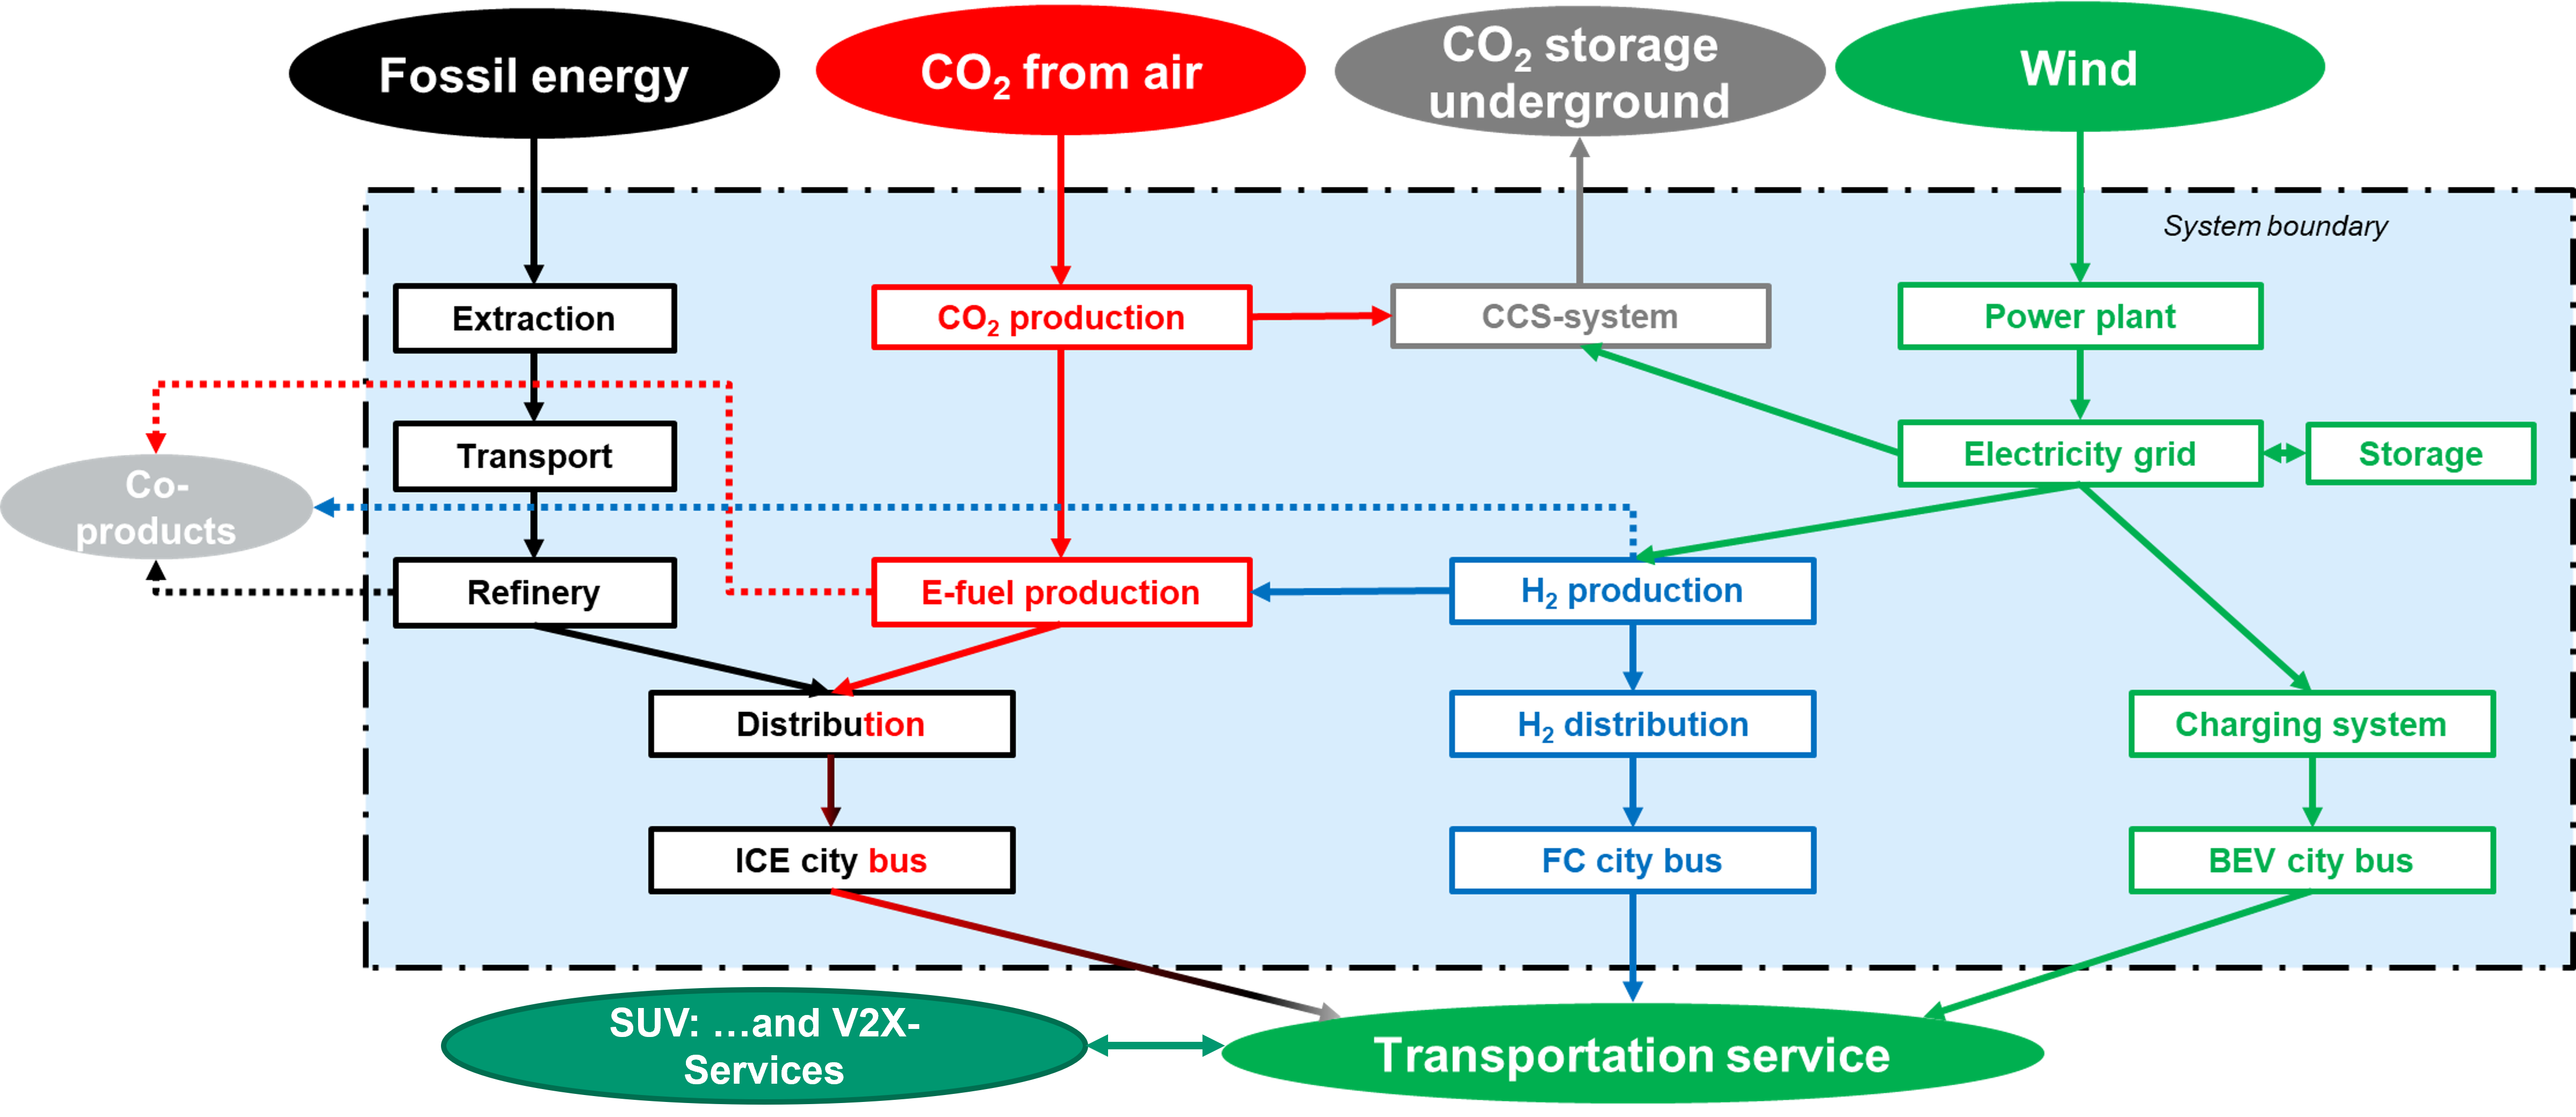
LCA comparison of renewable hydrogen, e-fuel systems and conventional fuels (Comment: distribution and ICE vehicle can be used for fossil fuel and e-fuel)
LCA comparison of renewable hydrogen, e-fuel systems and conventional fuels (Comment: distribution and ICE vehicle can be used for fossil fuel and e-fuel)
Copyright: JOANNEUM RESEARCH
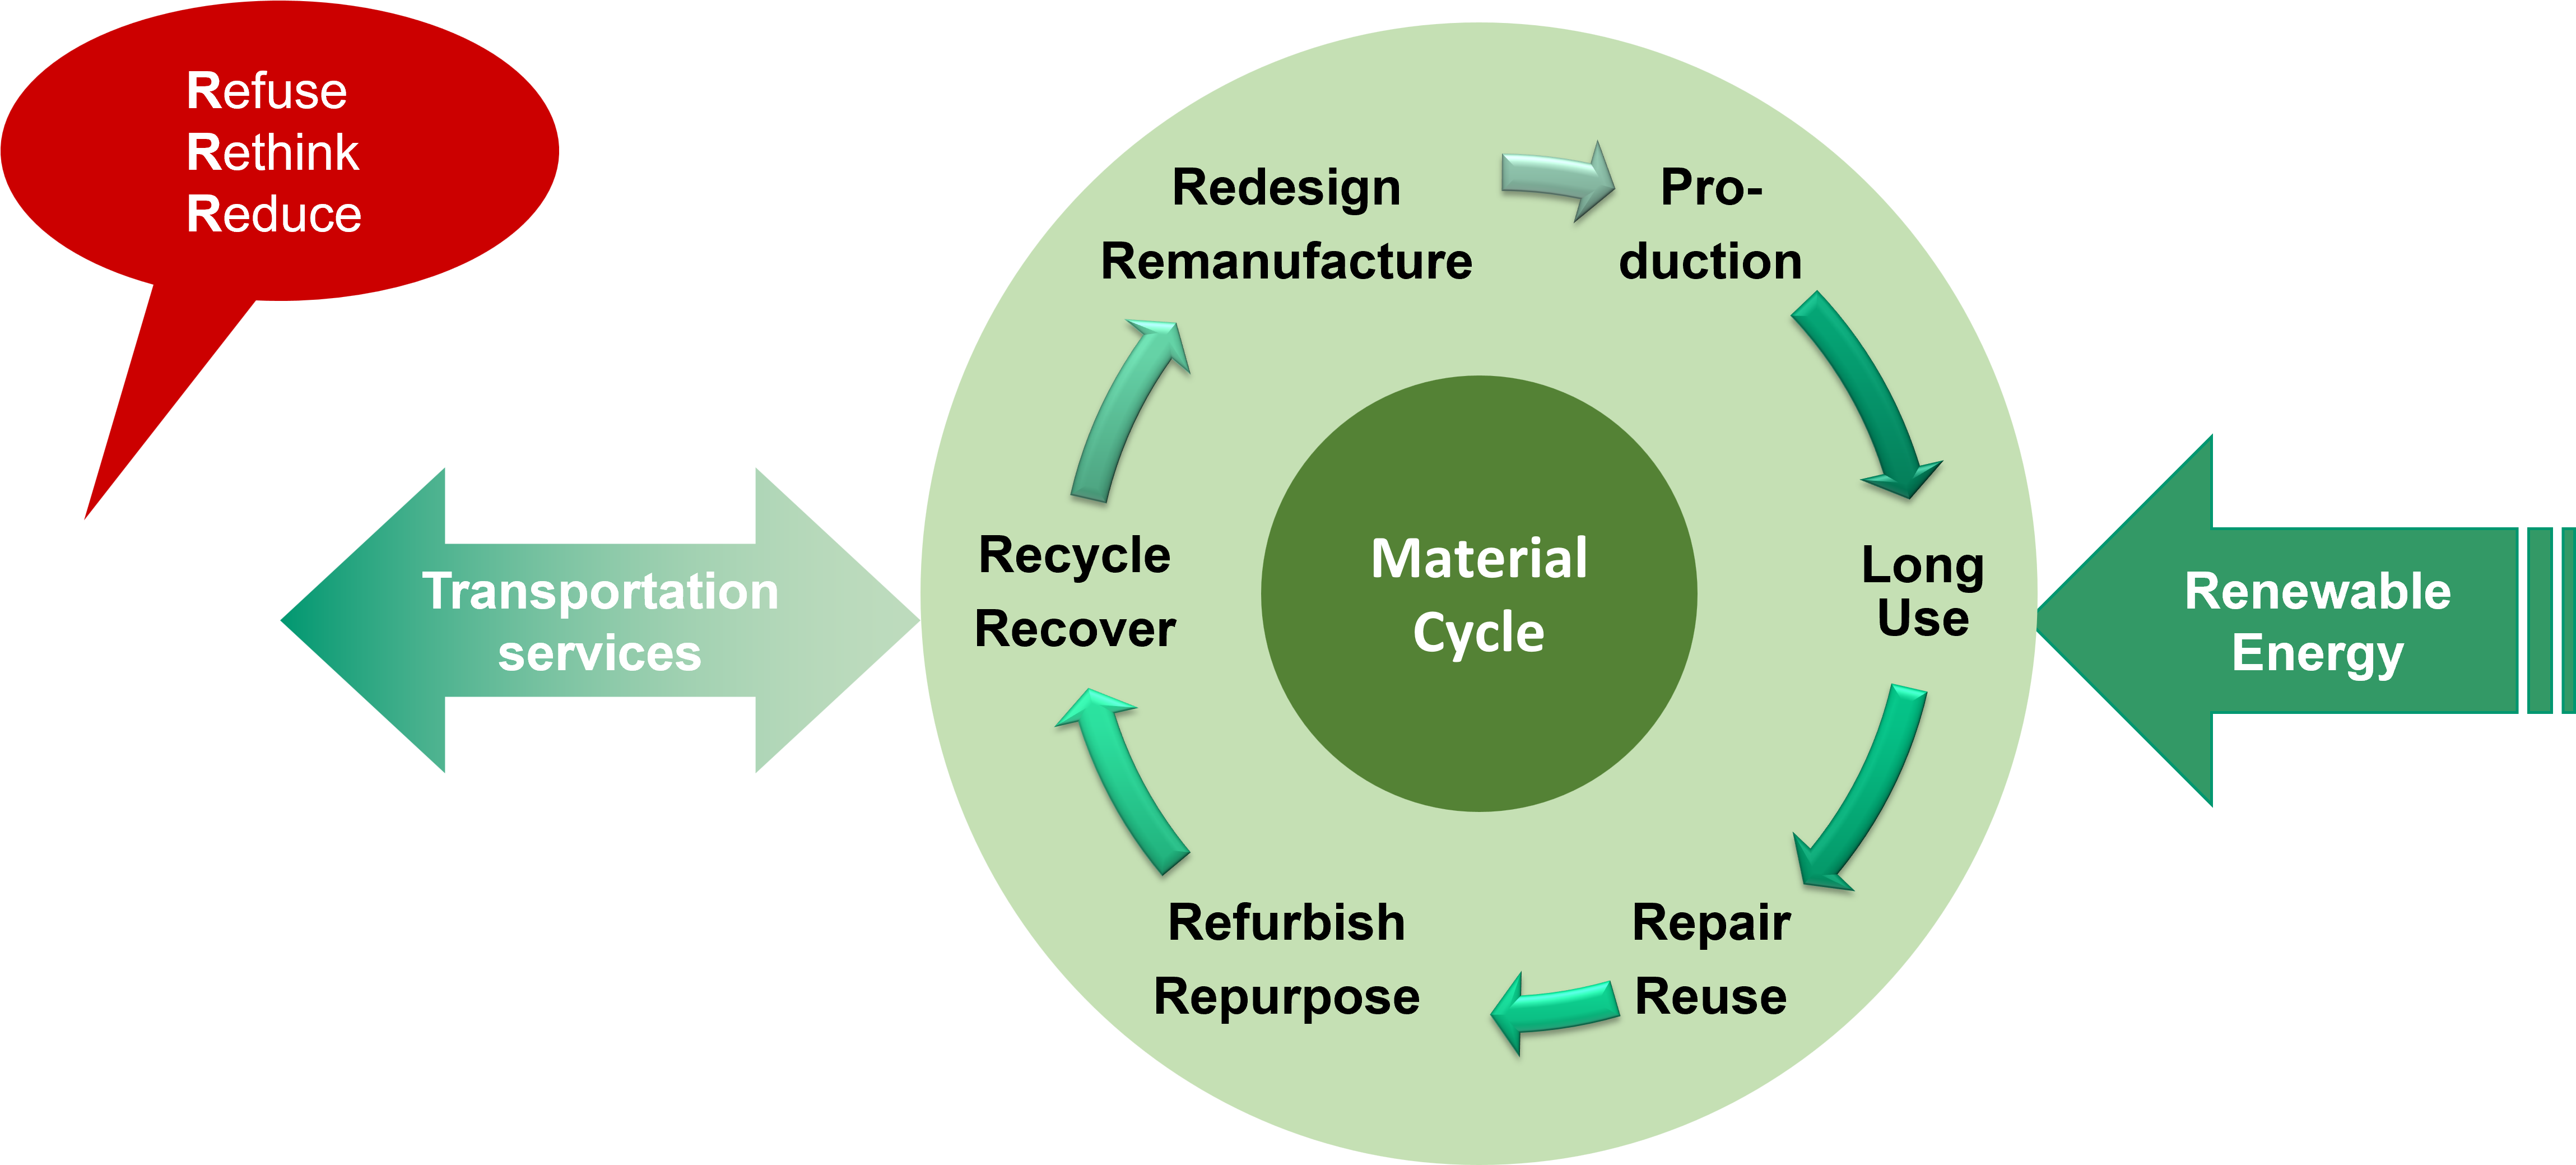
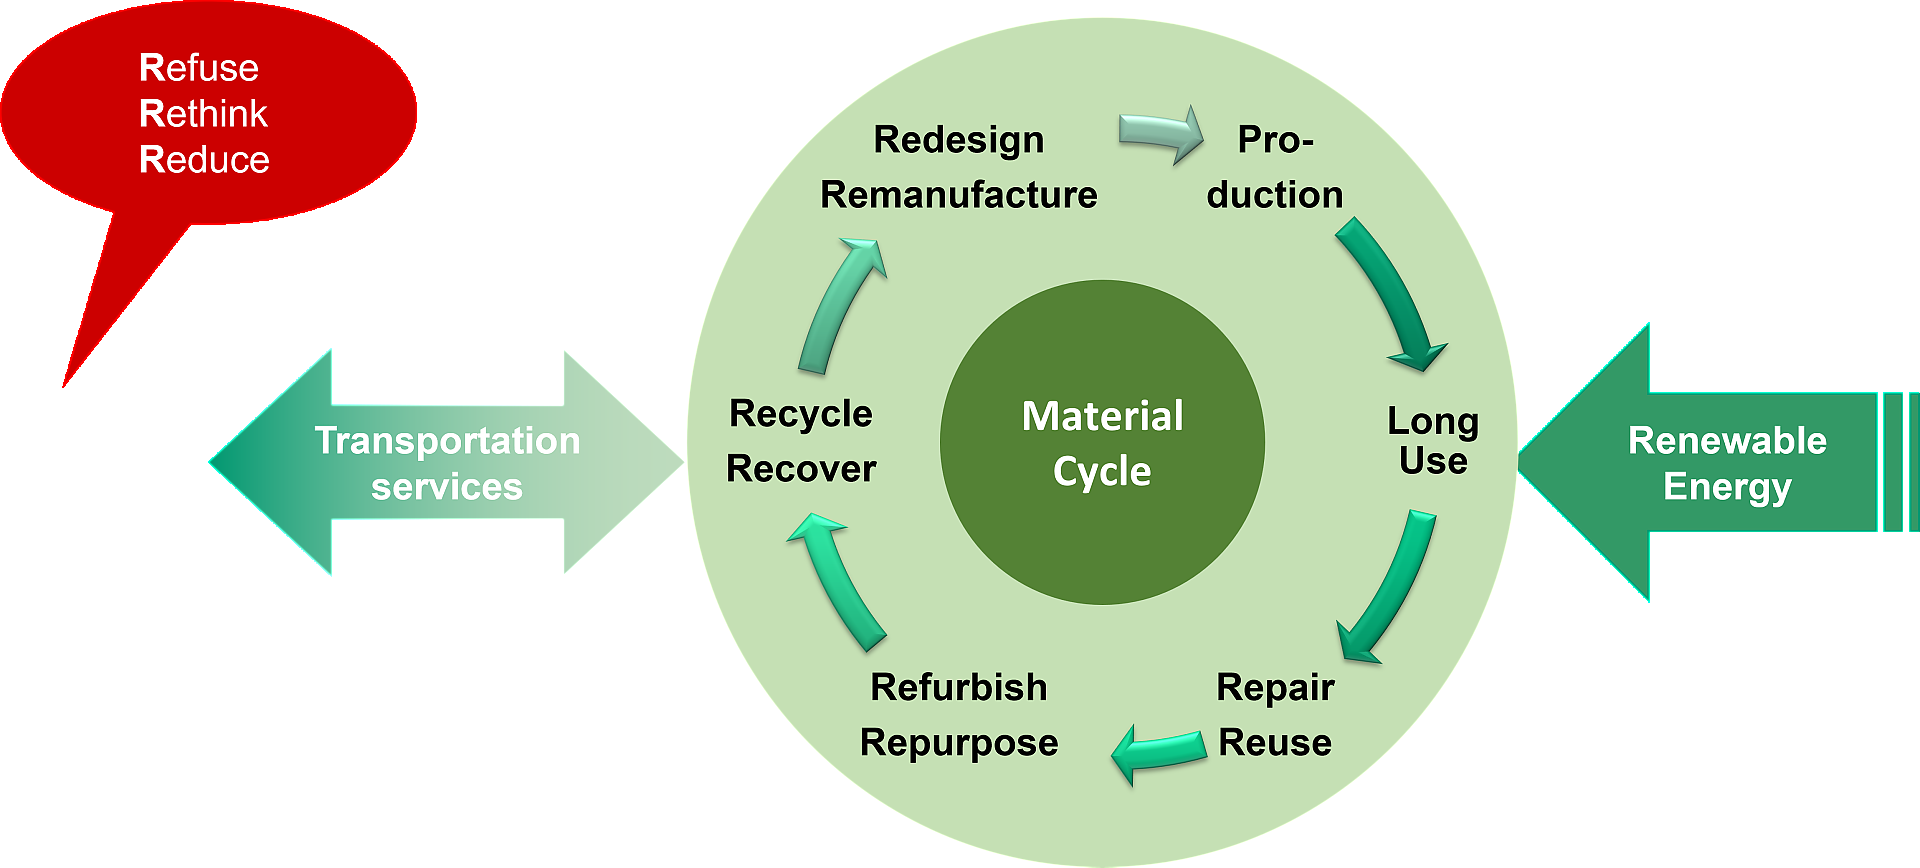
Circularity and Climate Neutrality for transportation services
A product or service is “climate neutral“ and “circular“, if its whole life cycle - production, operation and end-of-life - uses only • reused components (reuse index), • secondary/recycled material (recycled content), • renewable energy, and makes • zero waste and • zero GHG emissions. In Figure 2, this definition is shown for supplying a 100% circular transportation service with its closed material cycle, which is driven by renewable energy. A mobility demand is satisfied by transportation services that are provided by a closed material cycle using renewable energy.
Copyright: JOANNEUM RESEARCH
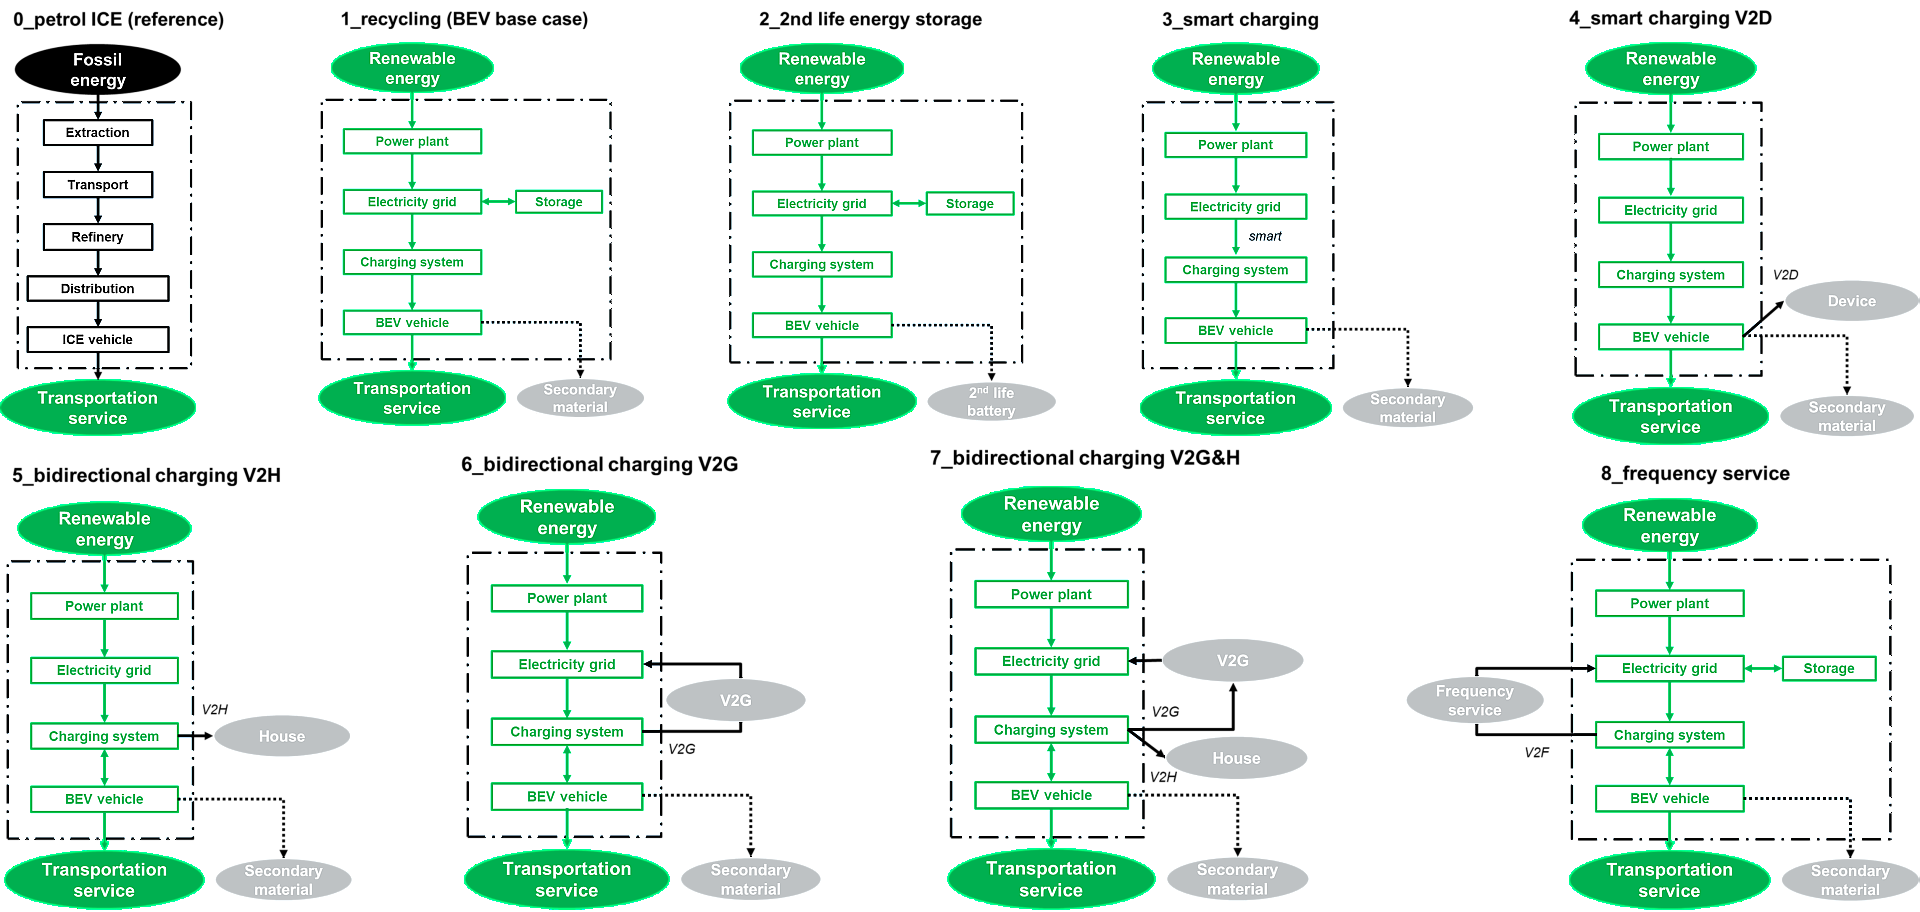
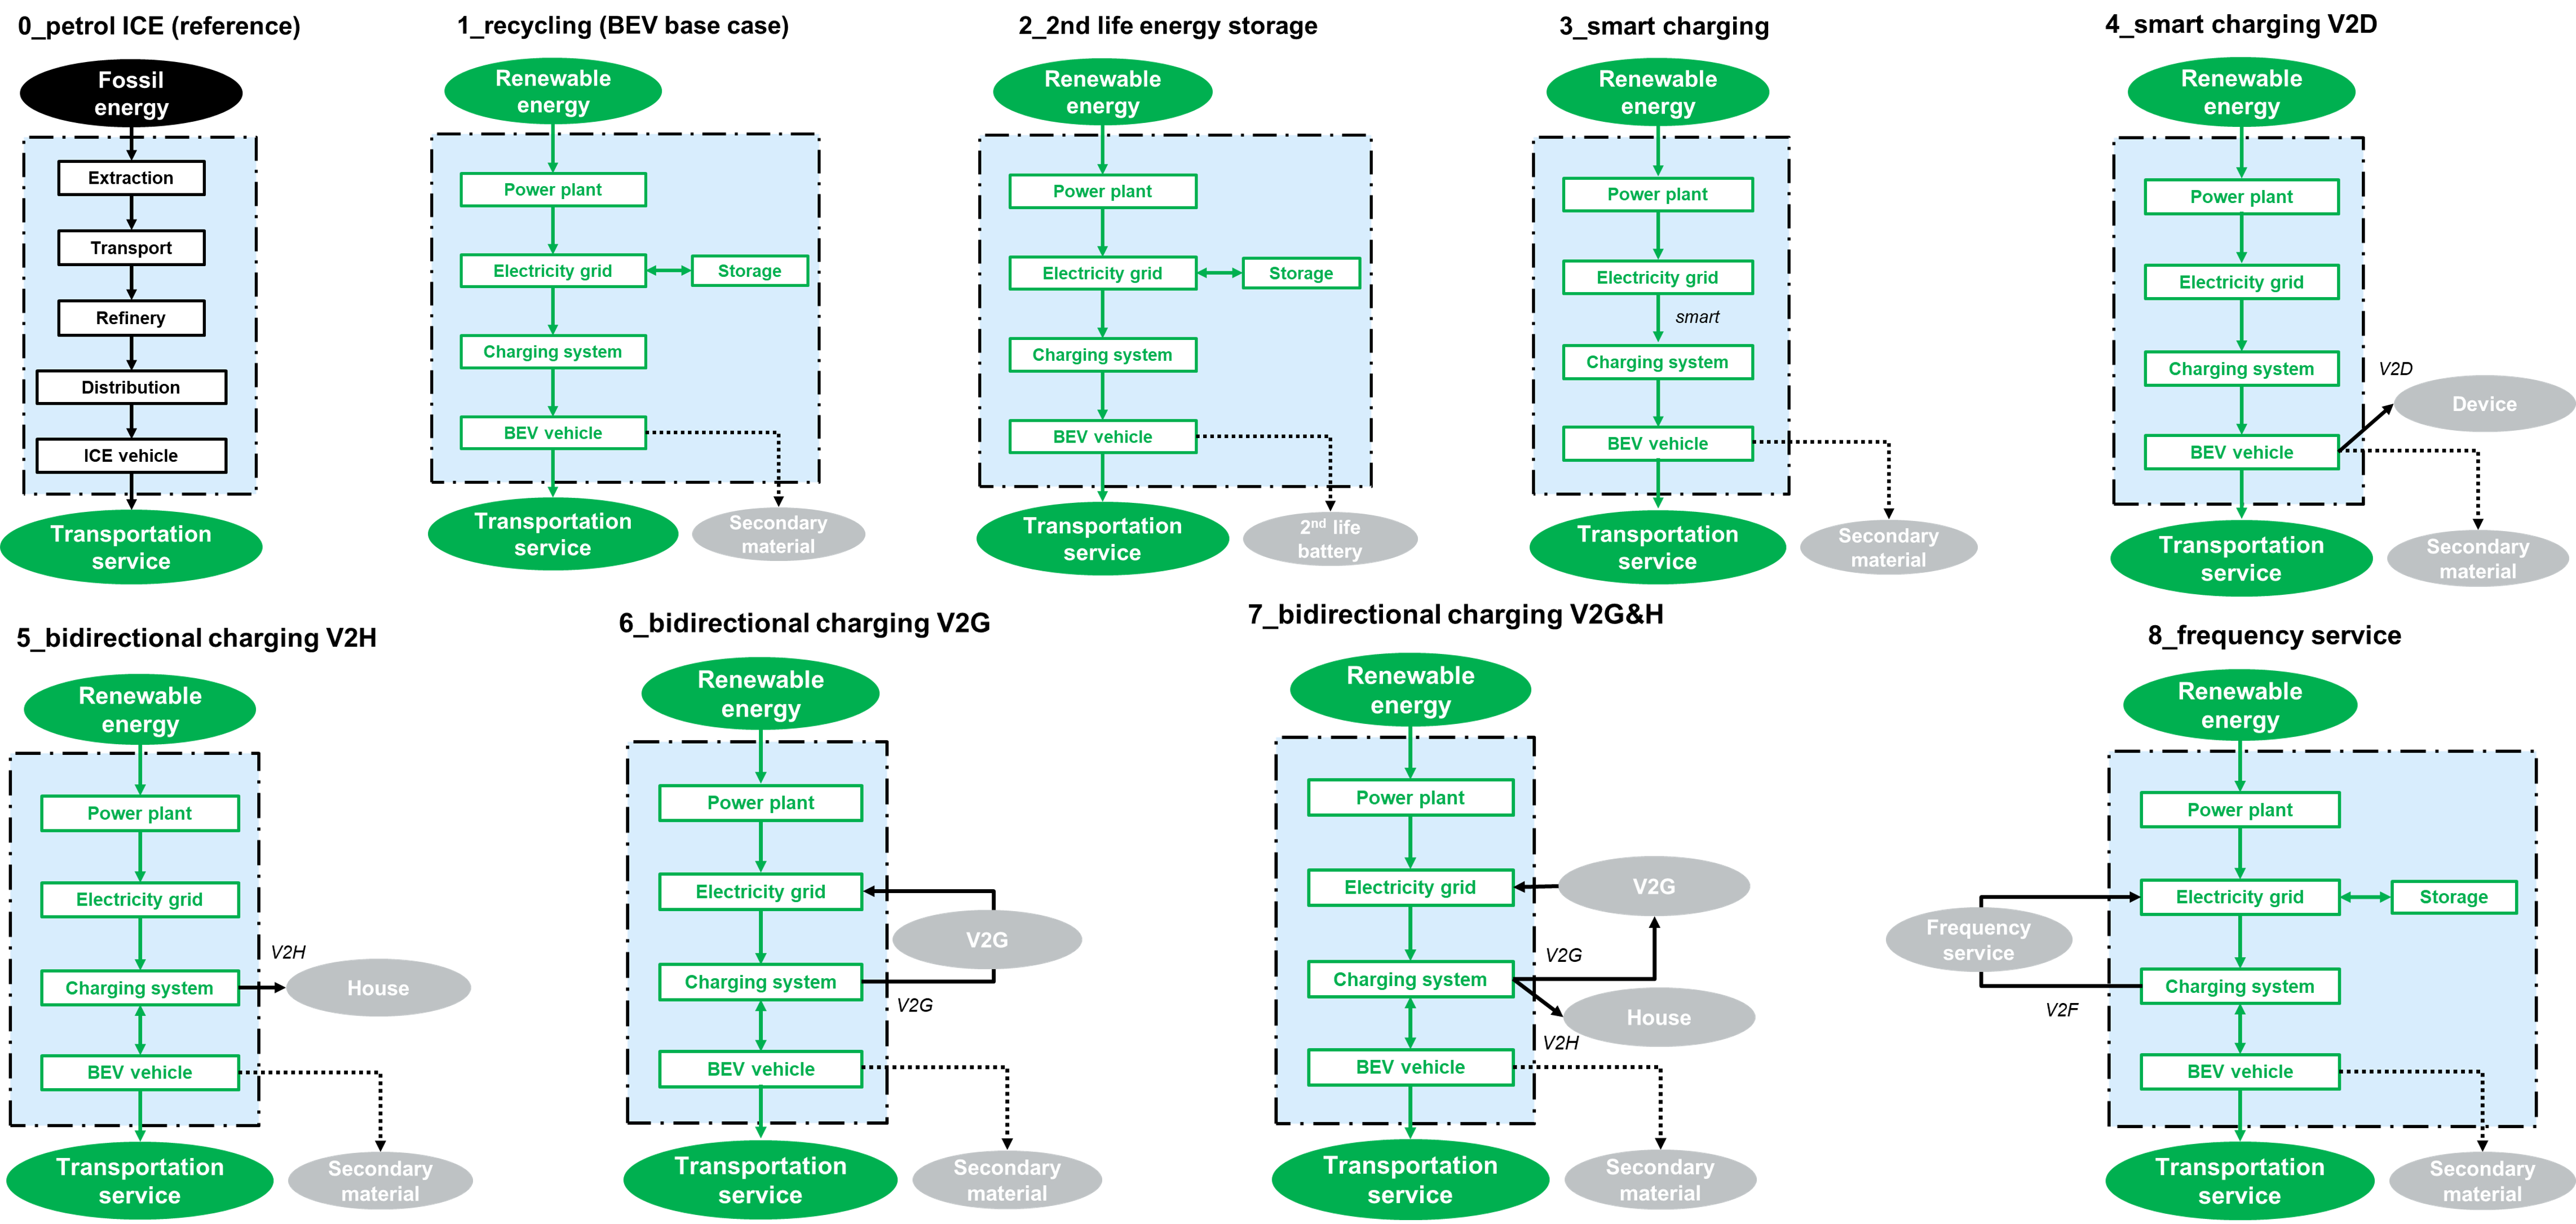
System boundaries for the eight analysed cases and the petrol ICE as reference
In Figure 3 the system boundaries for the V2X use cases are shown. For the cases without smart or bidirectional charging an additional electricity storage in the grid is considered.
Copyright: JOANNEUM RESEARCH
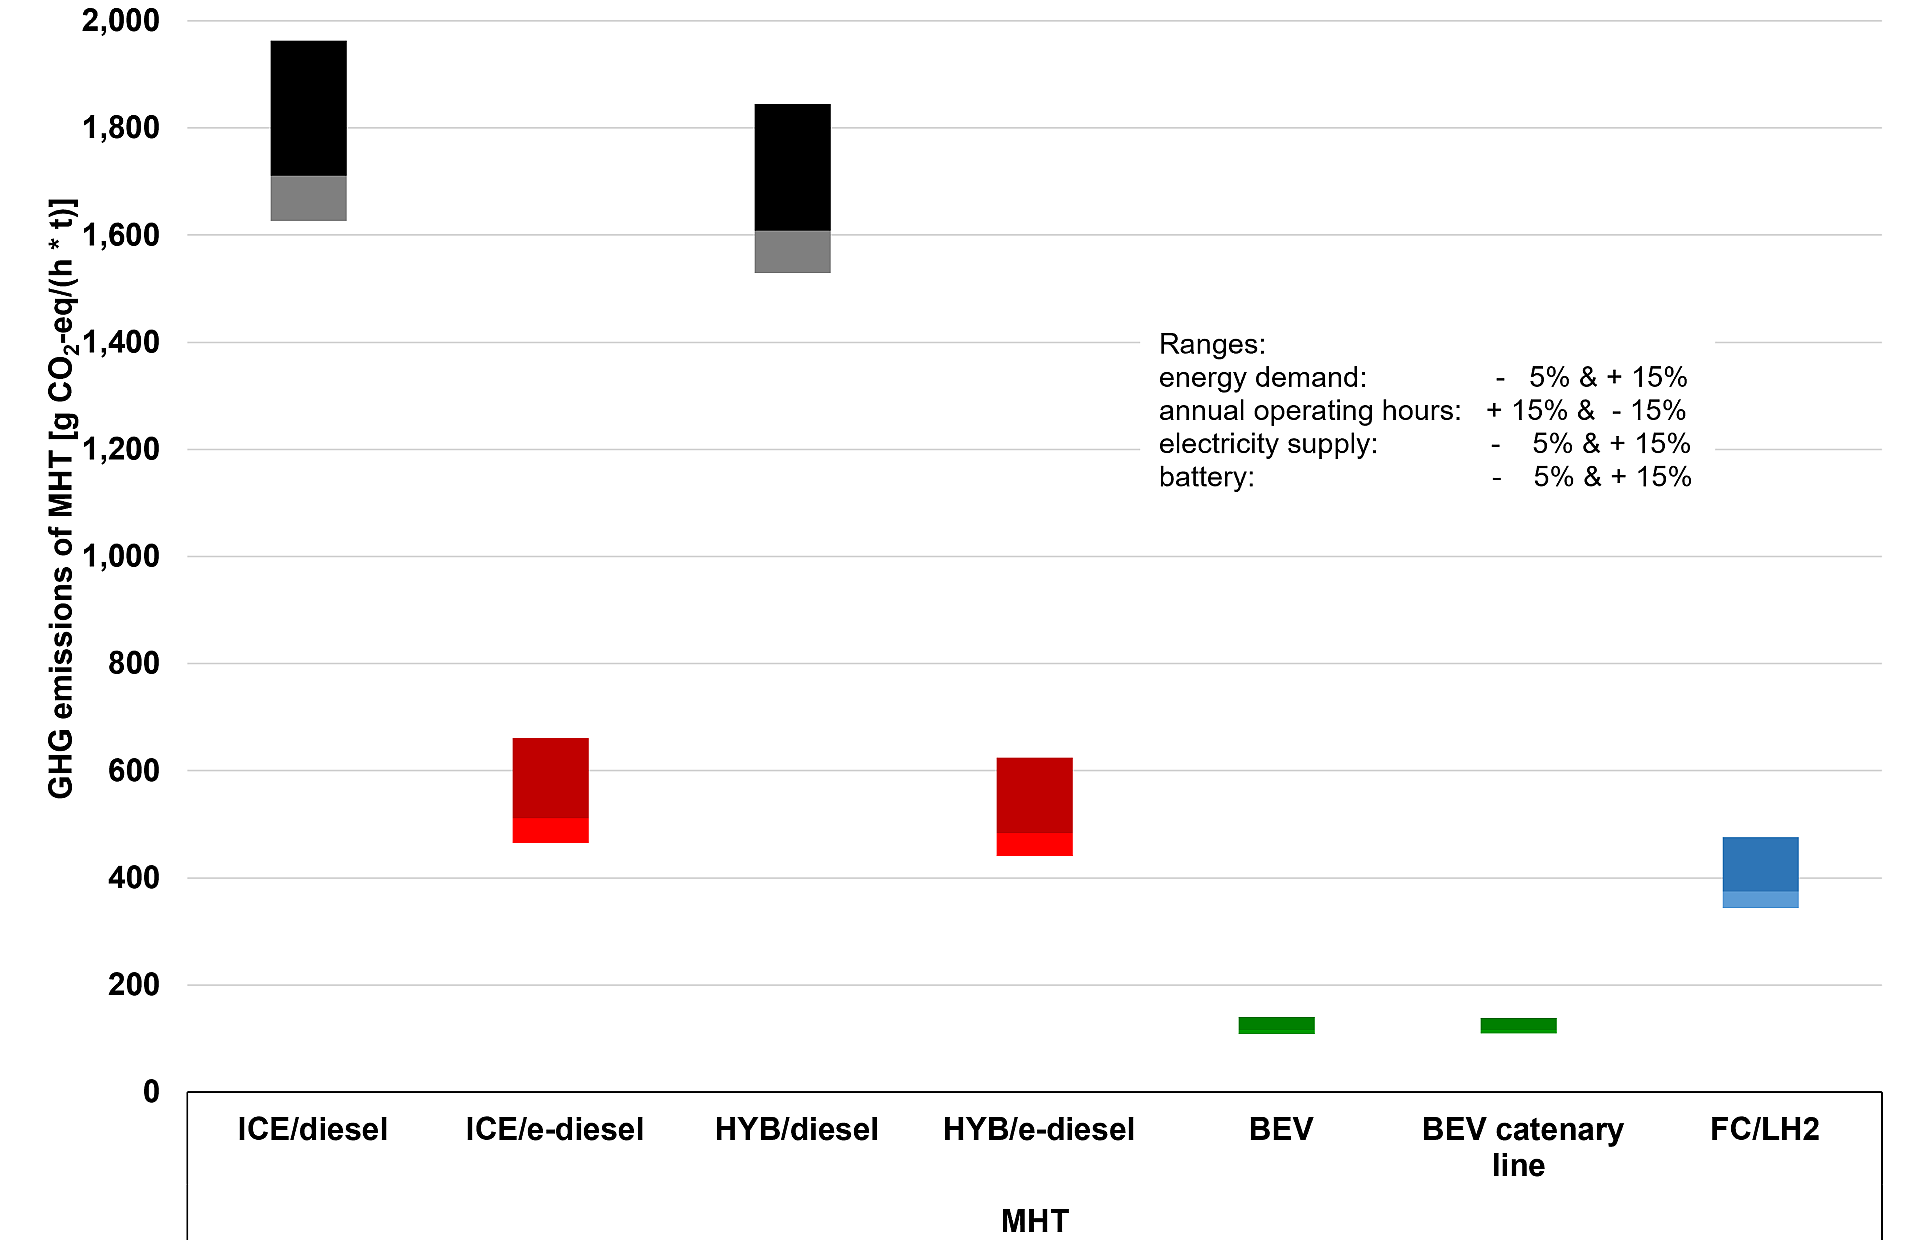
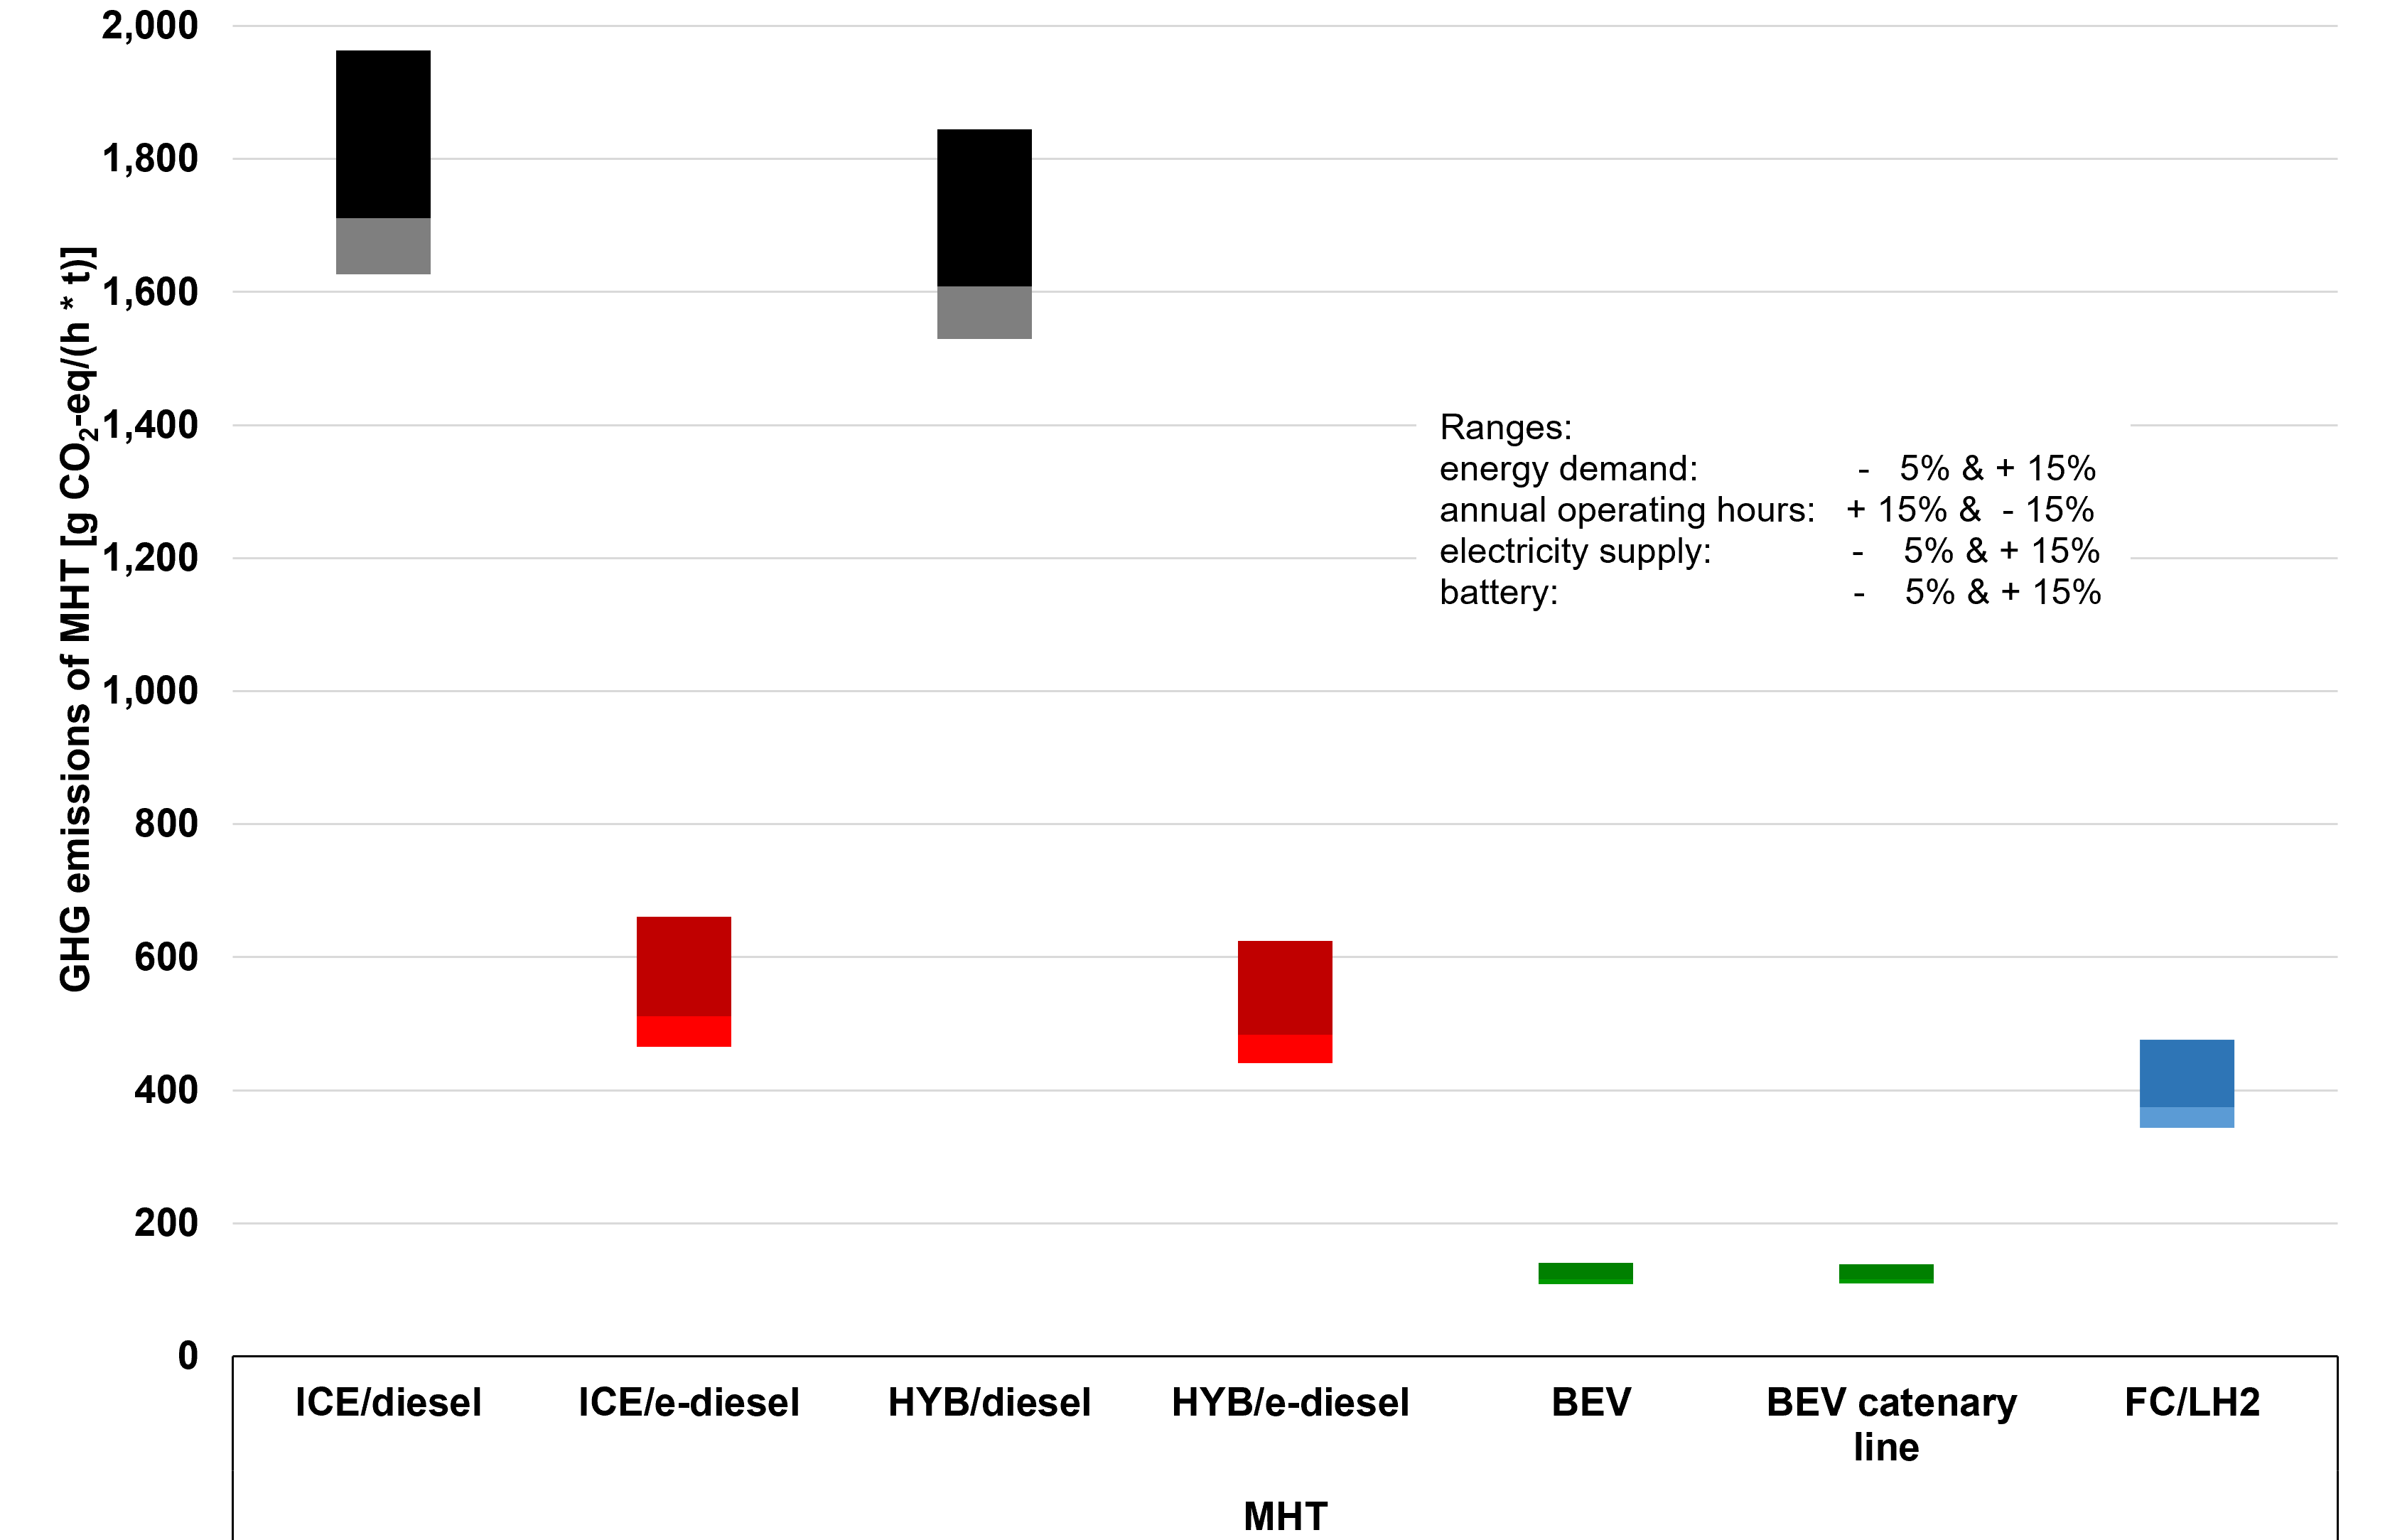
GHG emissions of MHT per hour of missions in total life cycle
ICE: Internal Combustion Engine, HYB: Hybrid Combustion Engine, MHT: Mining Haul Truck, BEV: Battery Electric Vehicle, FC: Fuel Cell, LH2: Liquid Hydrogen
Copyright: JOANNEUM RESEARCH
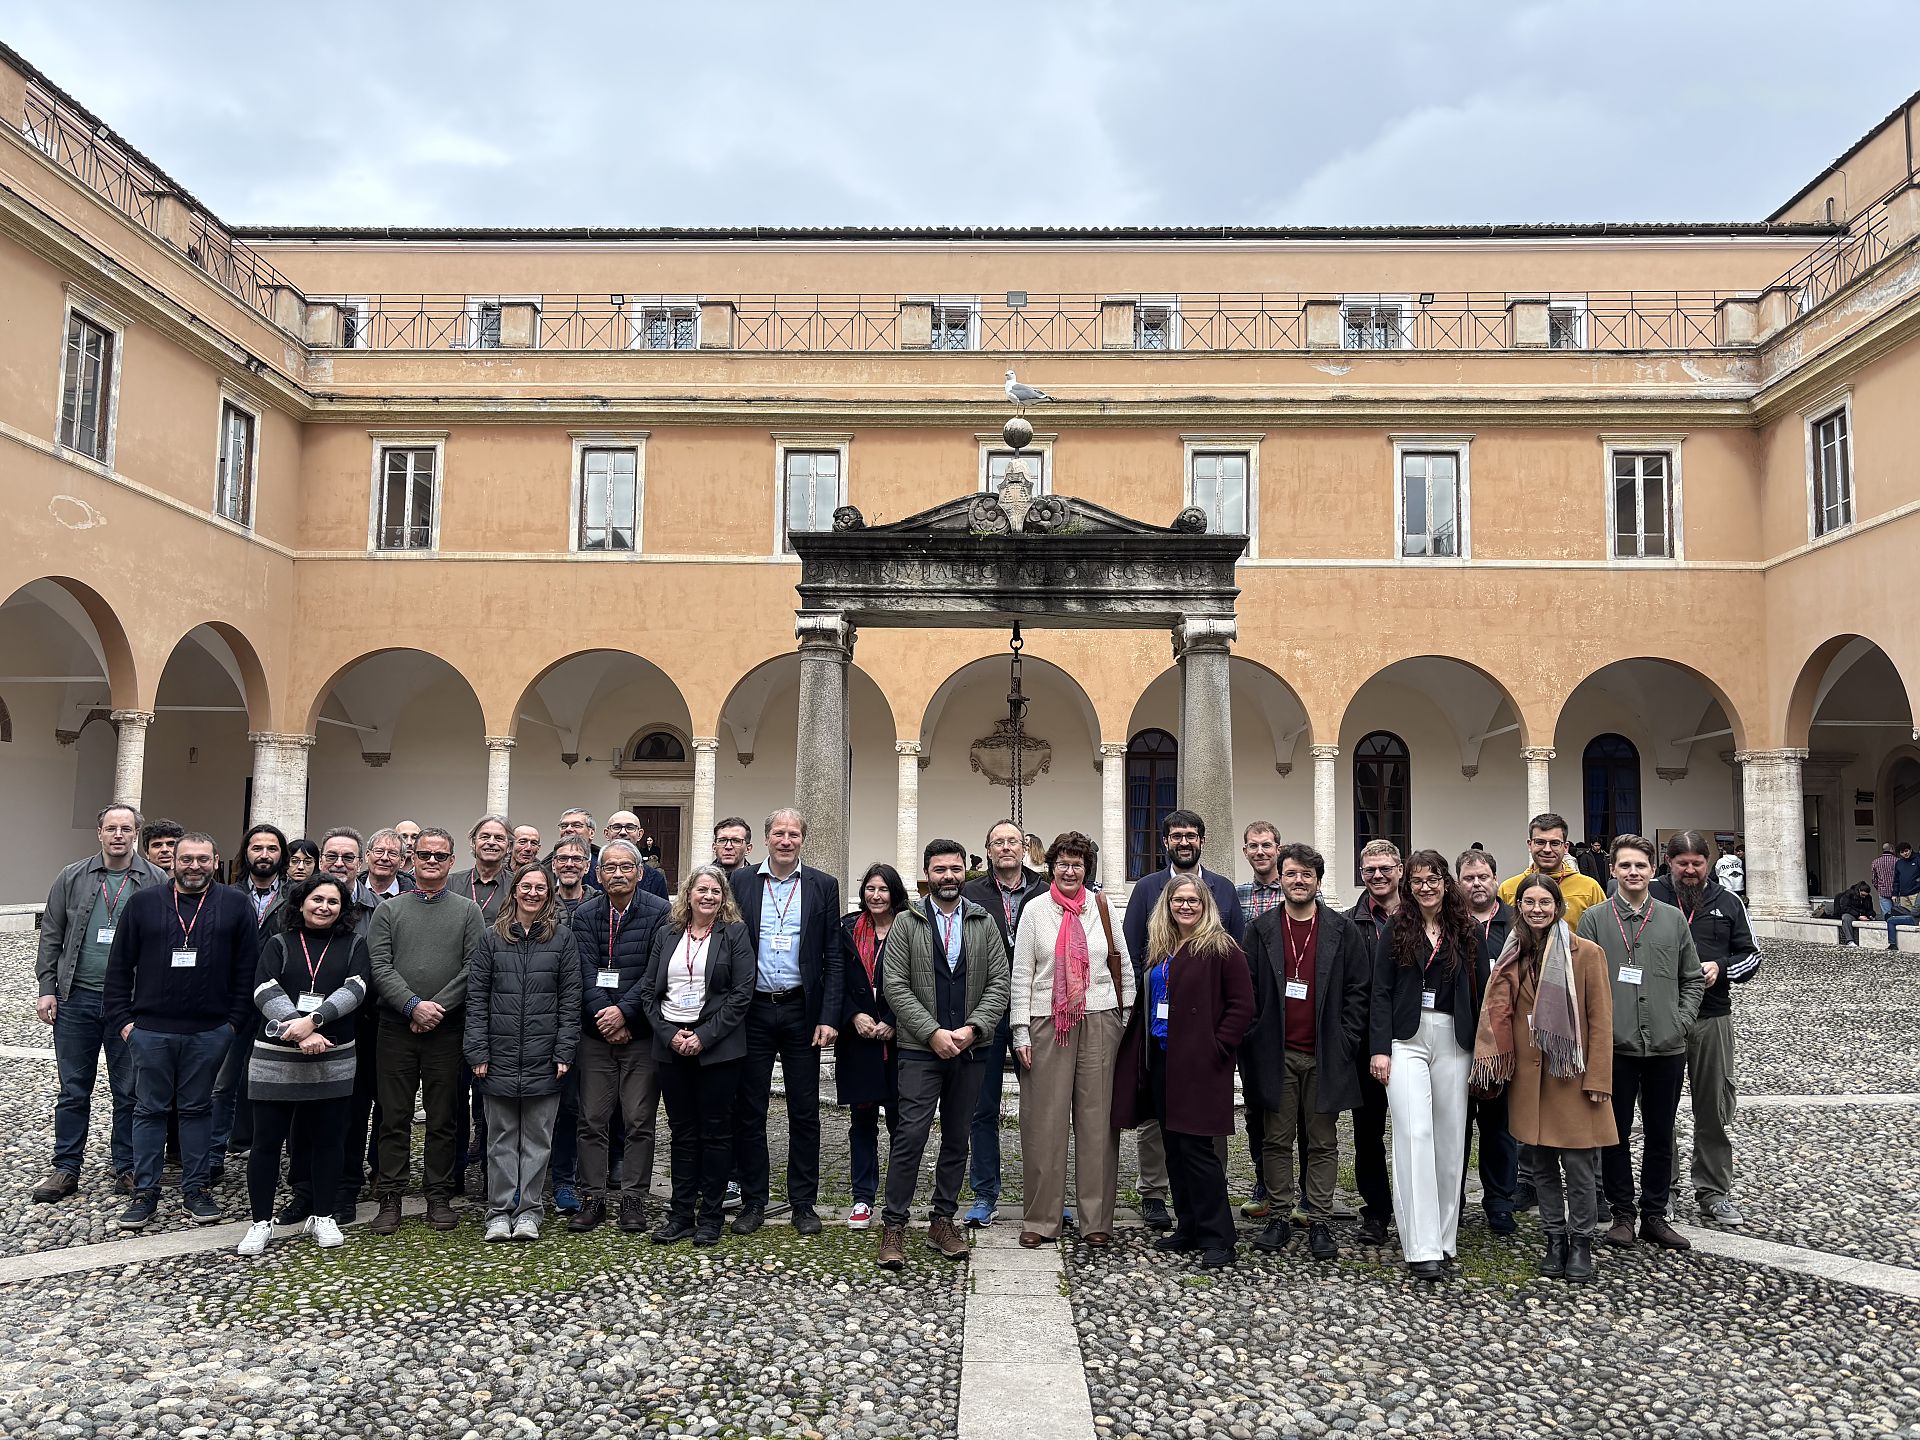
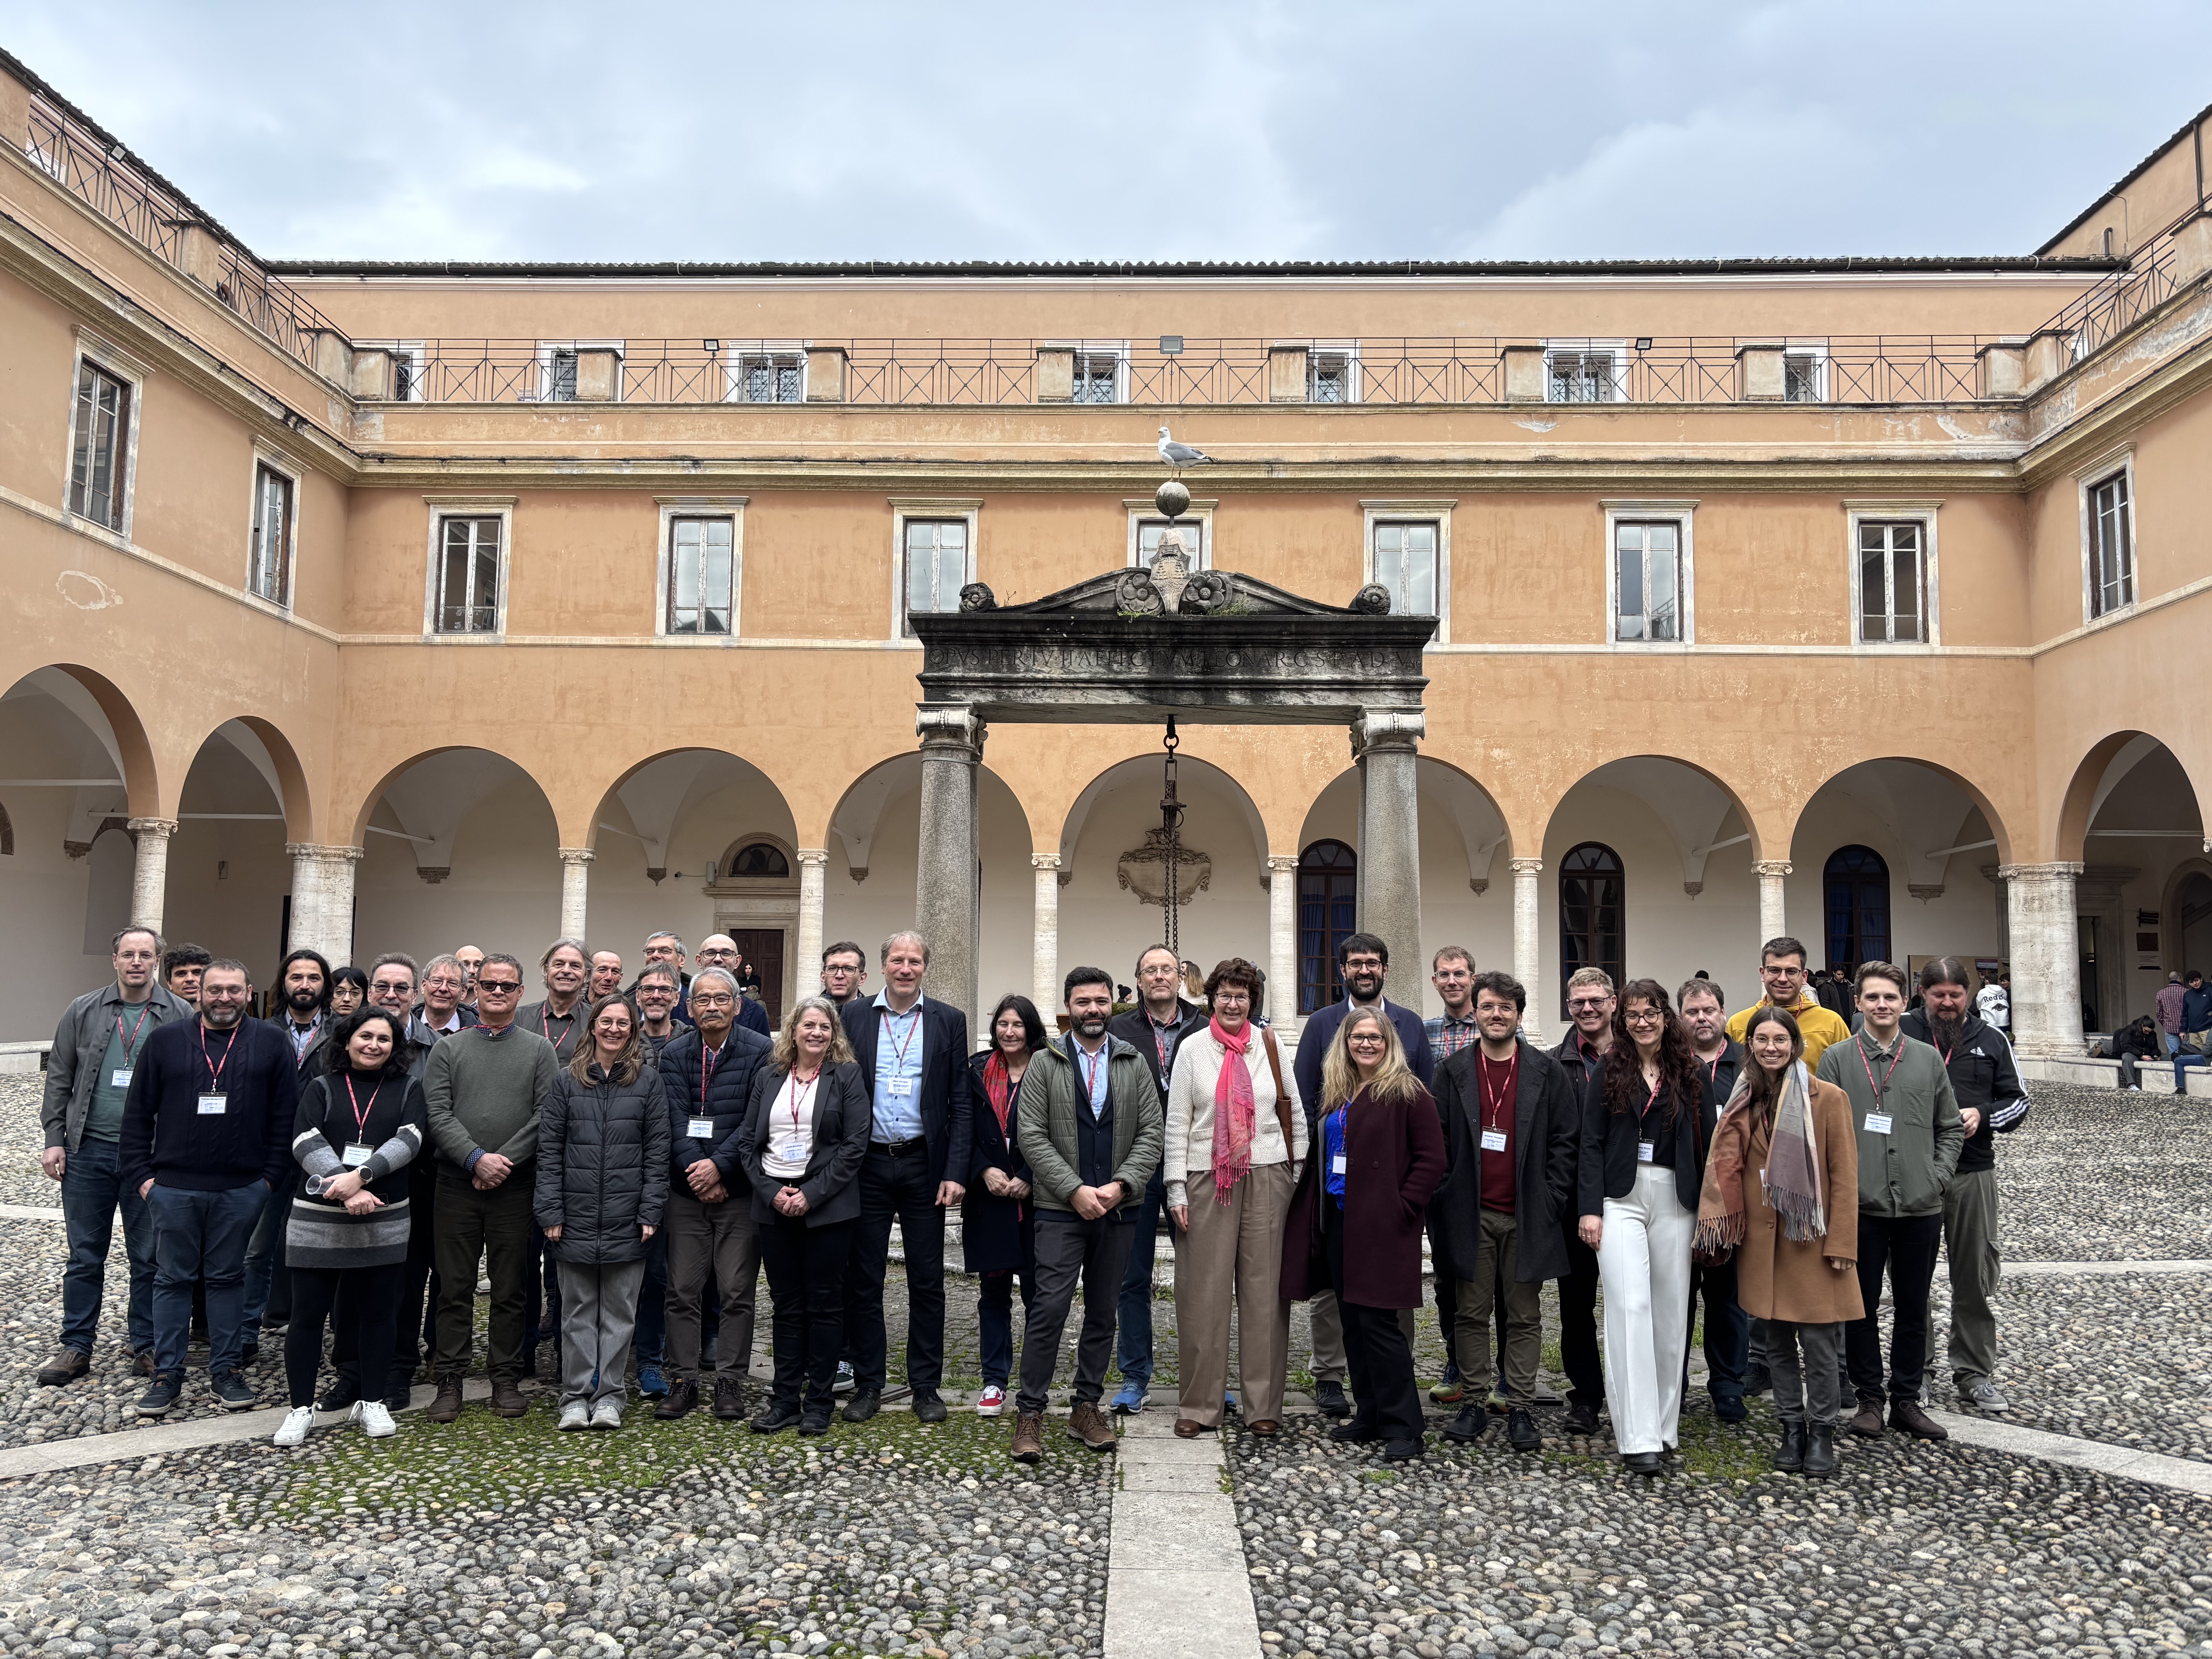
Group photo from the Roma 2025 meeting
Task 13 meeting at Sapienza Roma, February 2025
Copyright: Ulrike Jahn - IEA-PVPS T13 OA
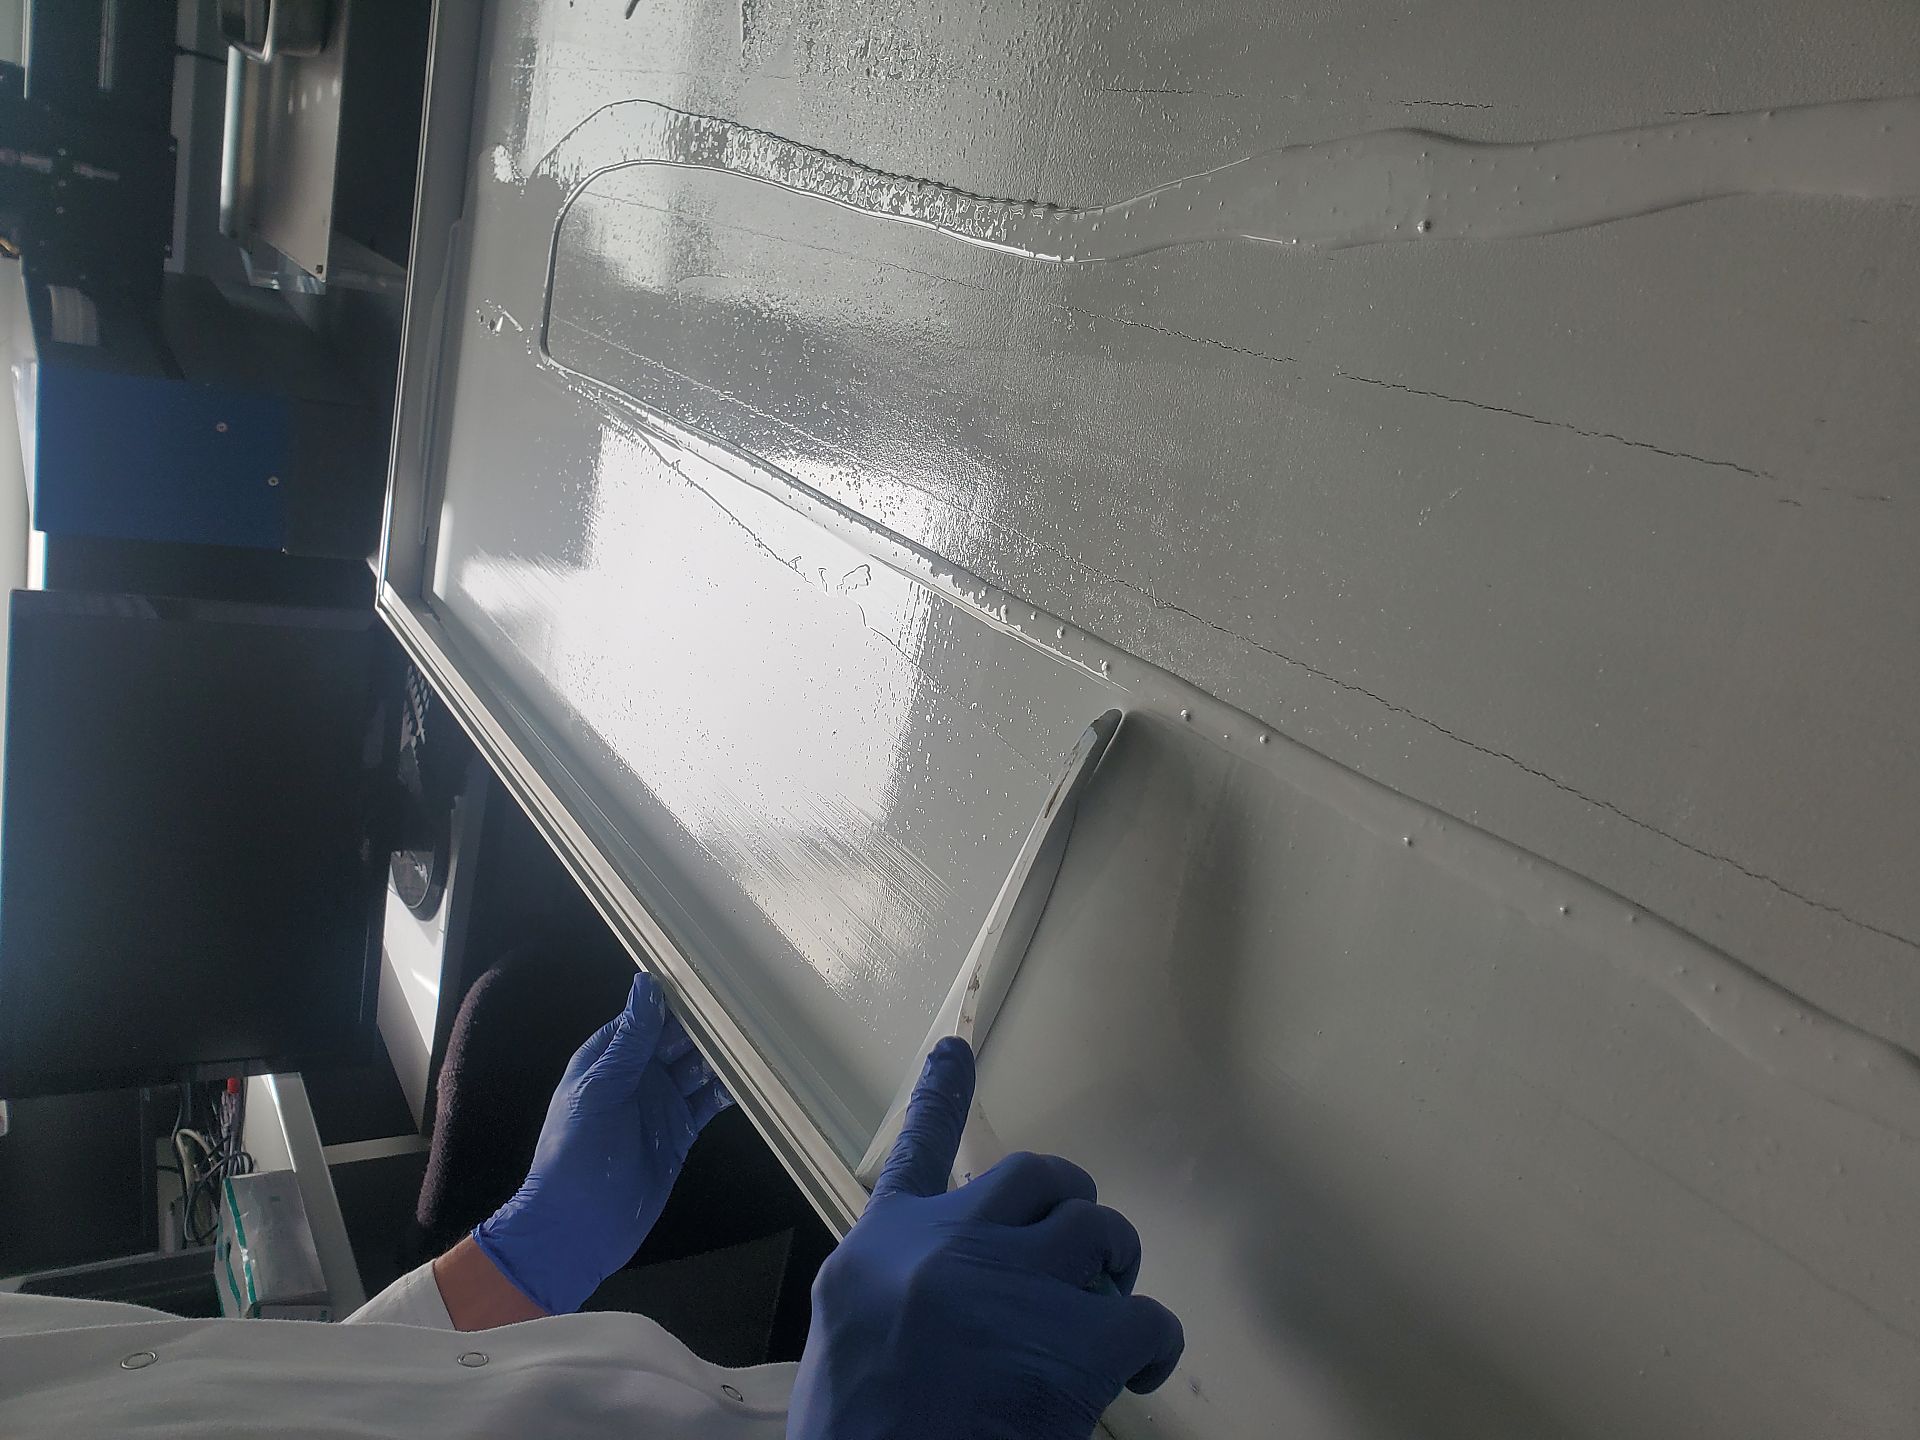
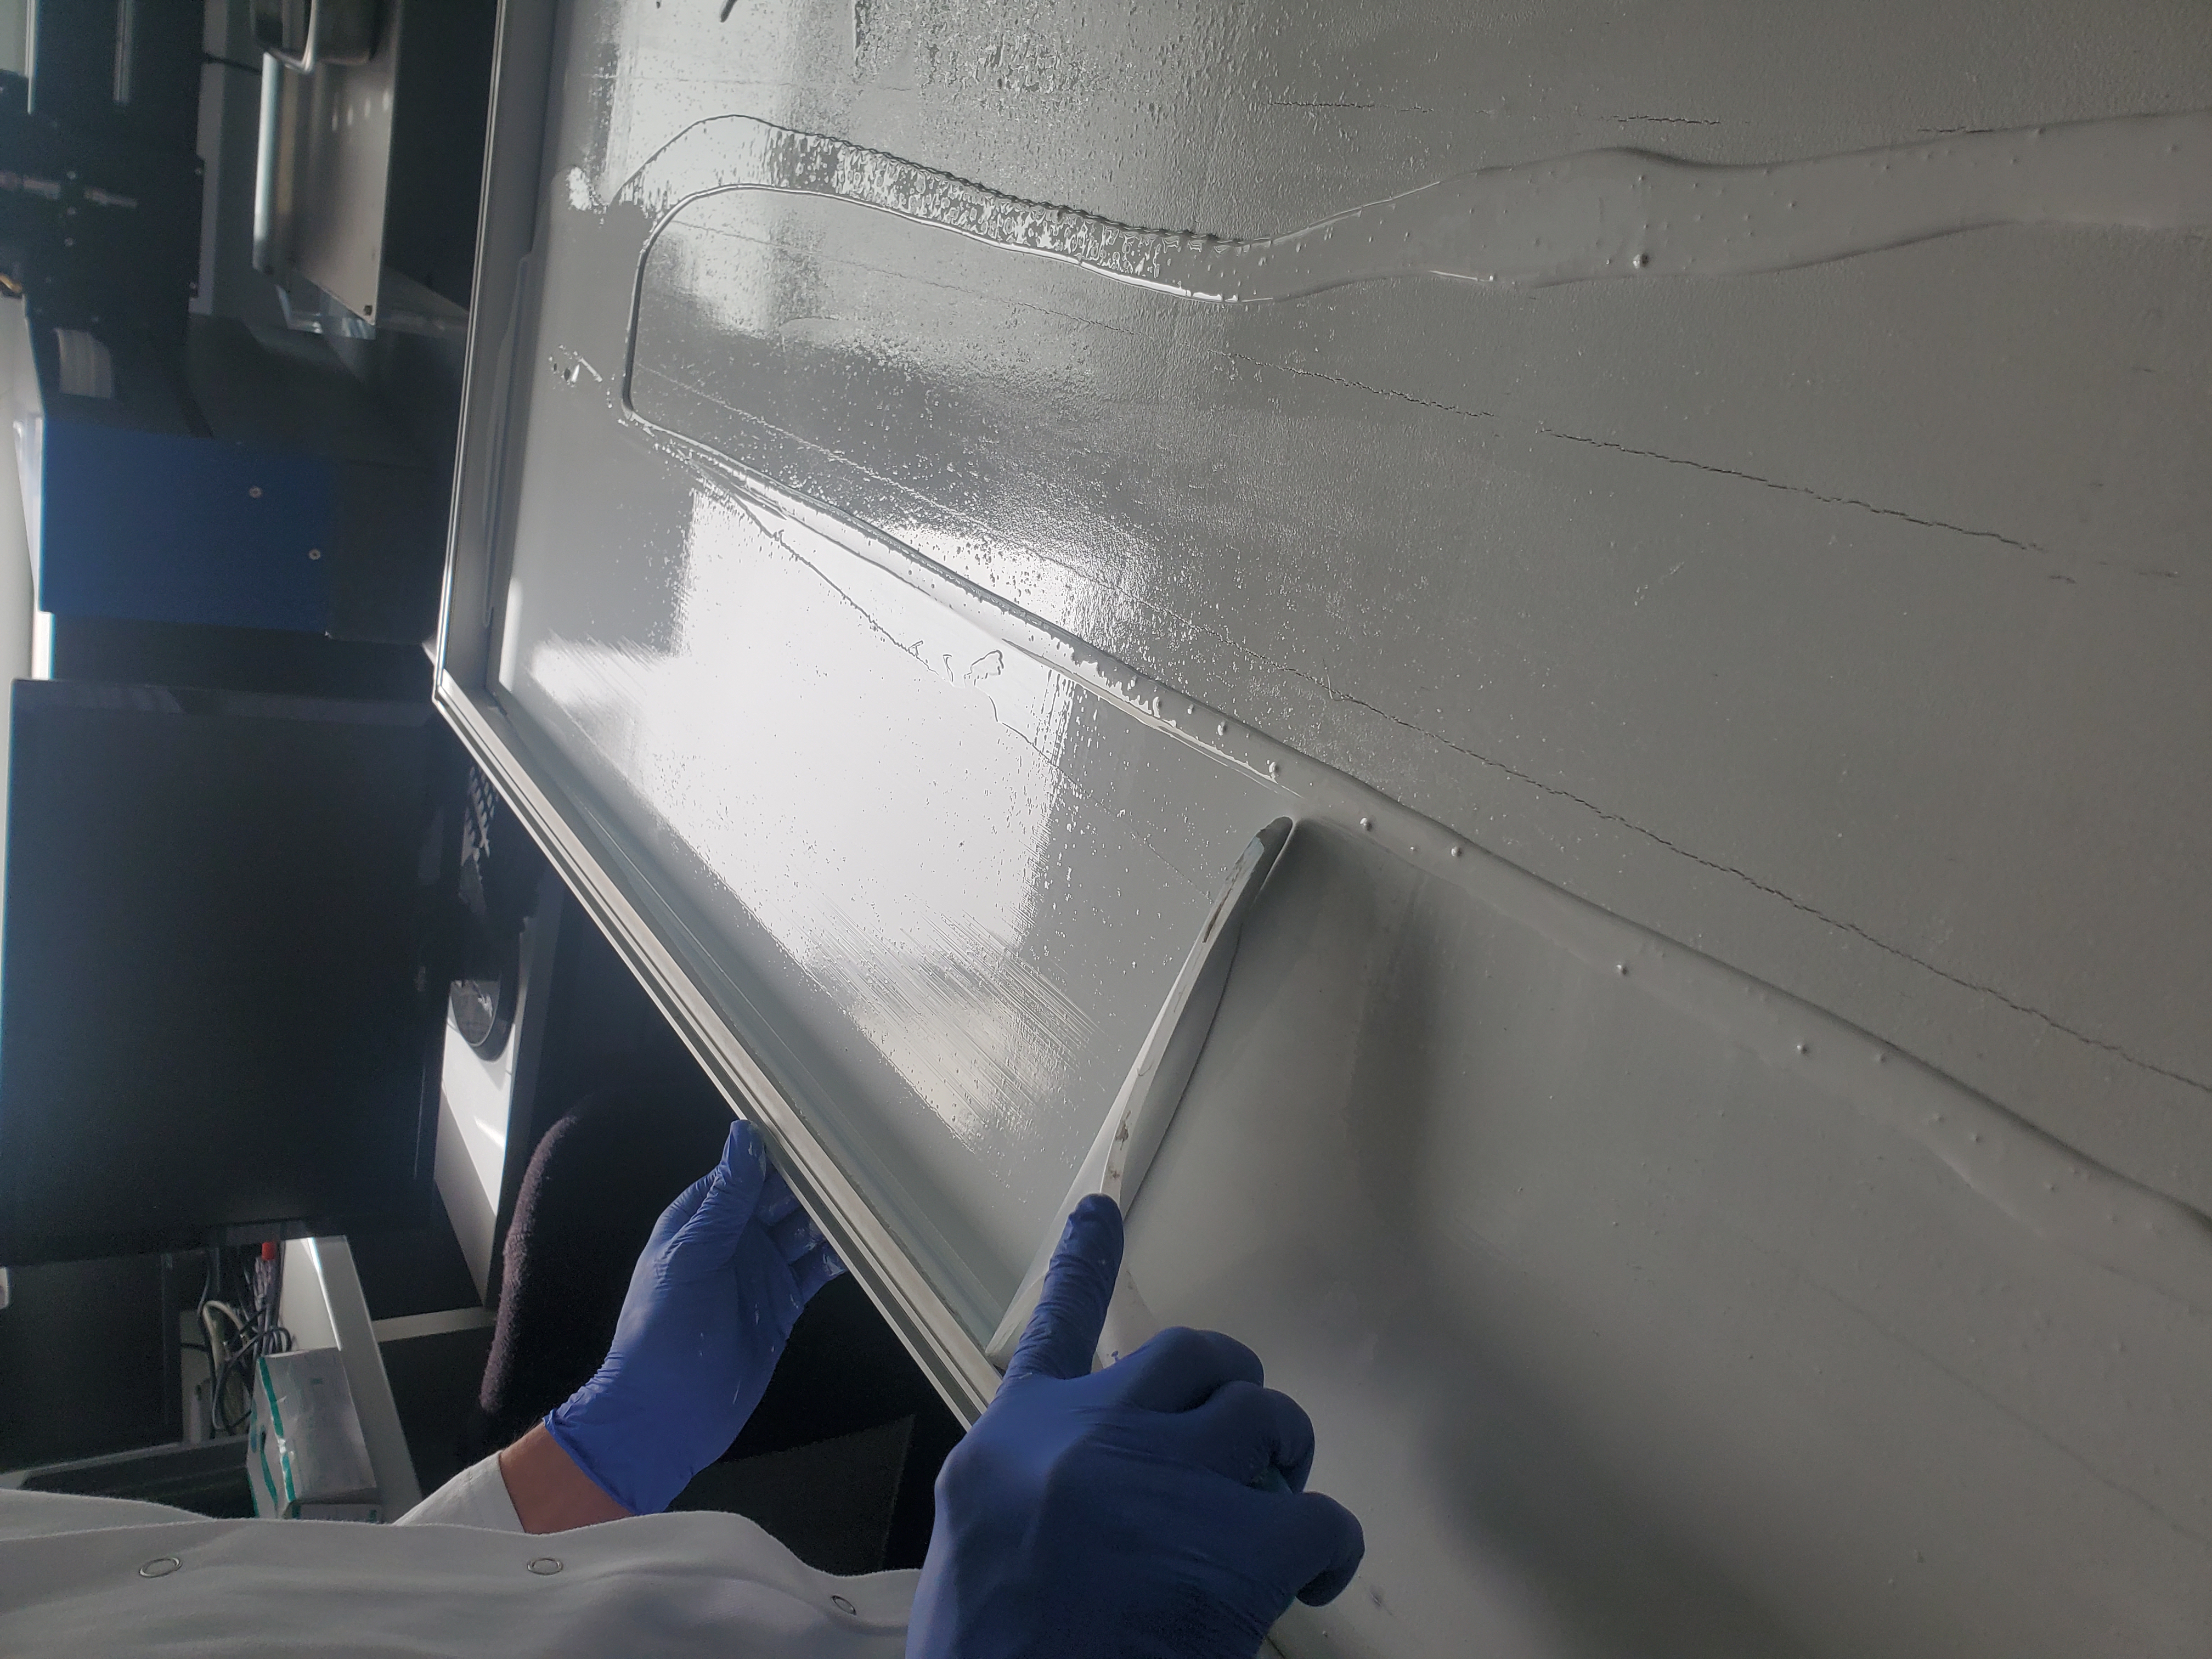
PV Backsheet Repair
Application of repair coating for backsheets with cracks
Copyright: Dr. Gabriele Eder / OFI
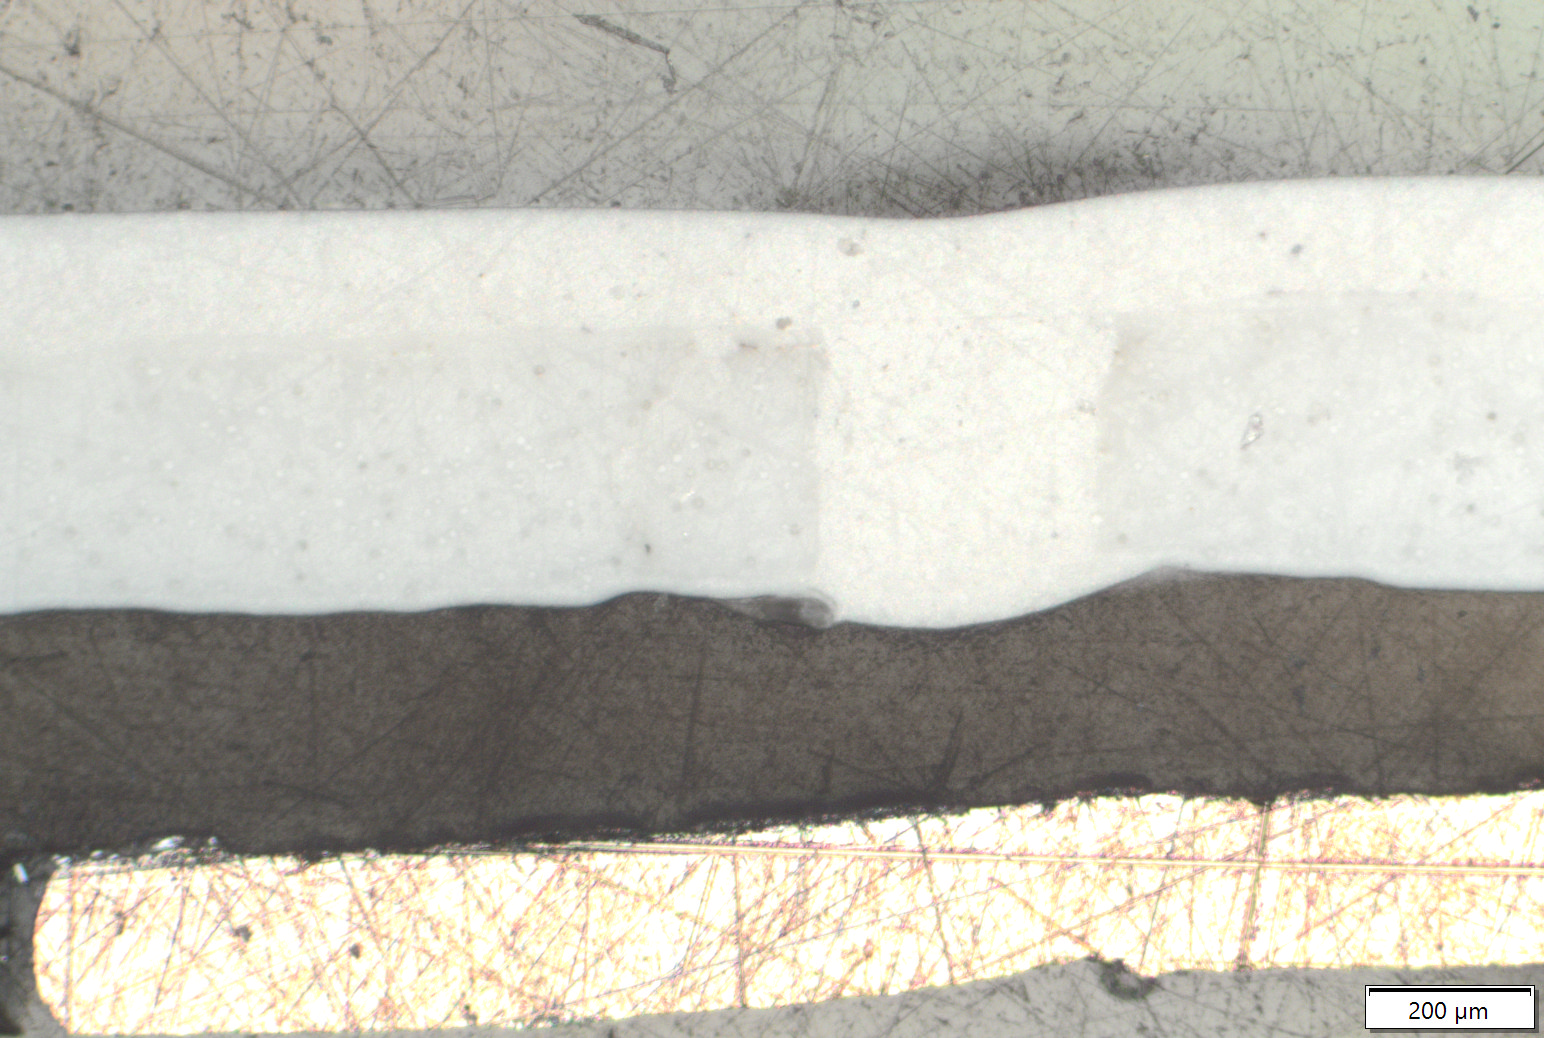
Cross-section repair coating
Cross-section repair coating
Copyright: Dr. Gabriele Eder / OFI
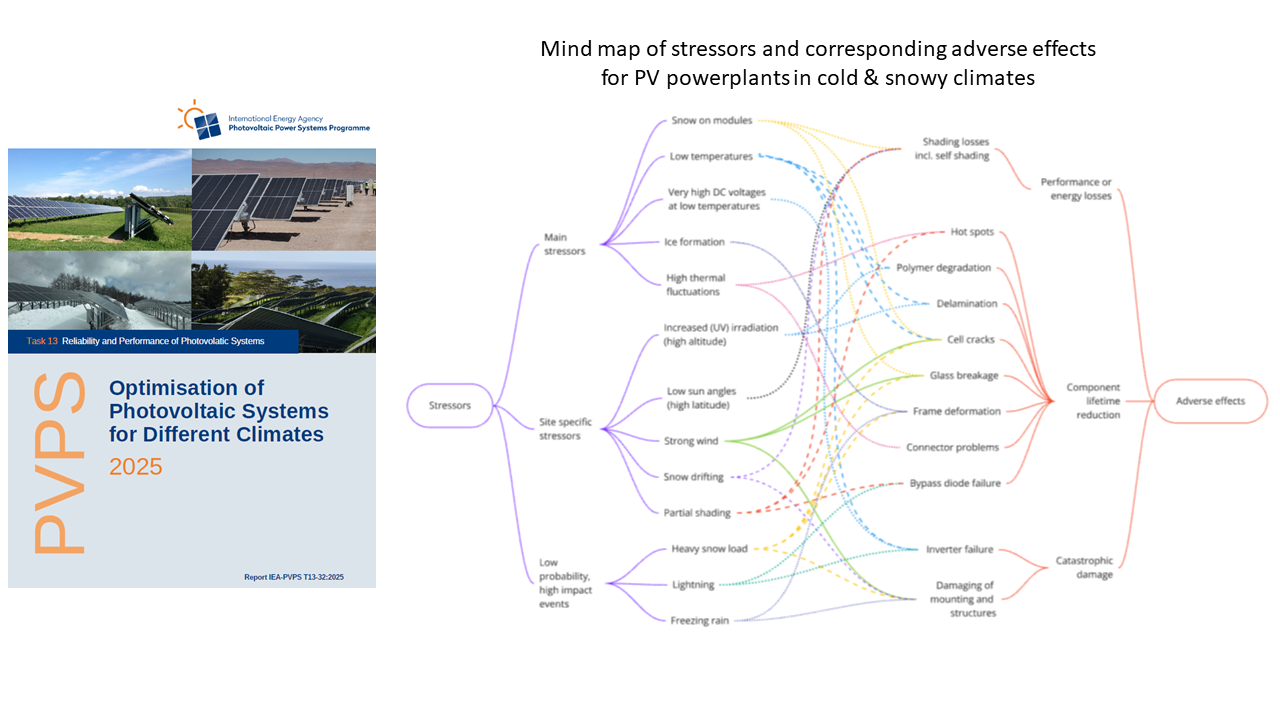
Mindmap of stressors
Mindmap of stressors and adverse effects of PV power plants in cold and snowy climates