Project Image Pool
There are 186 results.
Terms of use: The pictures on this site originate from the projects in the frame of the programmes City of Tomorrow, Building of Tomorrow and the IEA Research Cooperation. They may be used credited for non-commercial purposes under the Creative Commons License Attribution-NonCommercial (CC BY-NC).

Overview demand response types
Combining the two action and control types there can be four different demand response types: 1) Direct Automated (e.g. action and control types are characterised by high reliability; 2) Indirect Automated (e.g. model predictive control in the building reacting to the DHC broadcasted signal), action and control types are characterised by low & high reliability, respectively; 3) Direct Manual (e.g. DHC operator vising the house or sitting in the control room and pressing the button), action and control types are characterised by high & low reliability, respectively; 4) Indirect Manual (e.g. end users changing the settings physically of via using the remote technology (walking in the house, sitting on the sofa and using app) as the reaction to the broadcasted signal), action and control types are characterised by low reliability.
Copyright: Authors of final report IEA EBC Annex 84
Joint workshop IEA EBC Annex 84 & IEA ES Task 43 („Standardized Use of Building Mass as Storage for Renewables and Grid Flexibility“)
Joint workshop IEA EBC Annex 84 & IEA ES Task 43 („Standardized Use of Building Mass as Storage for Renewables and Grid Flexibility“)
Copyright: Ingo Leusbrock
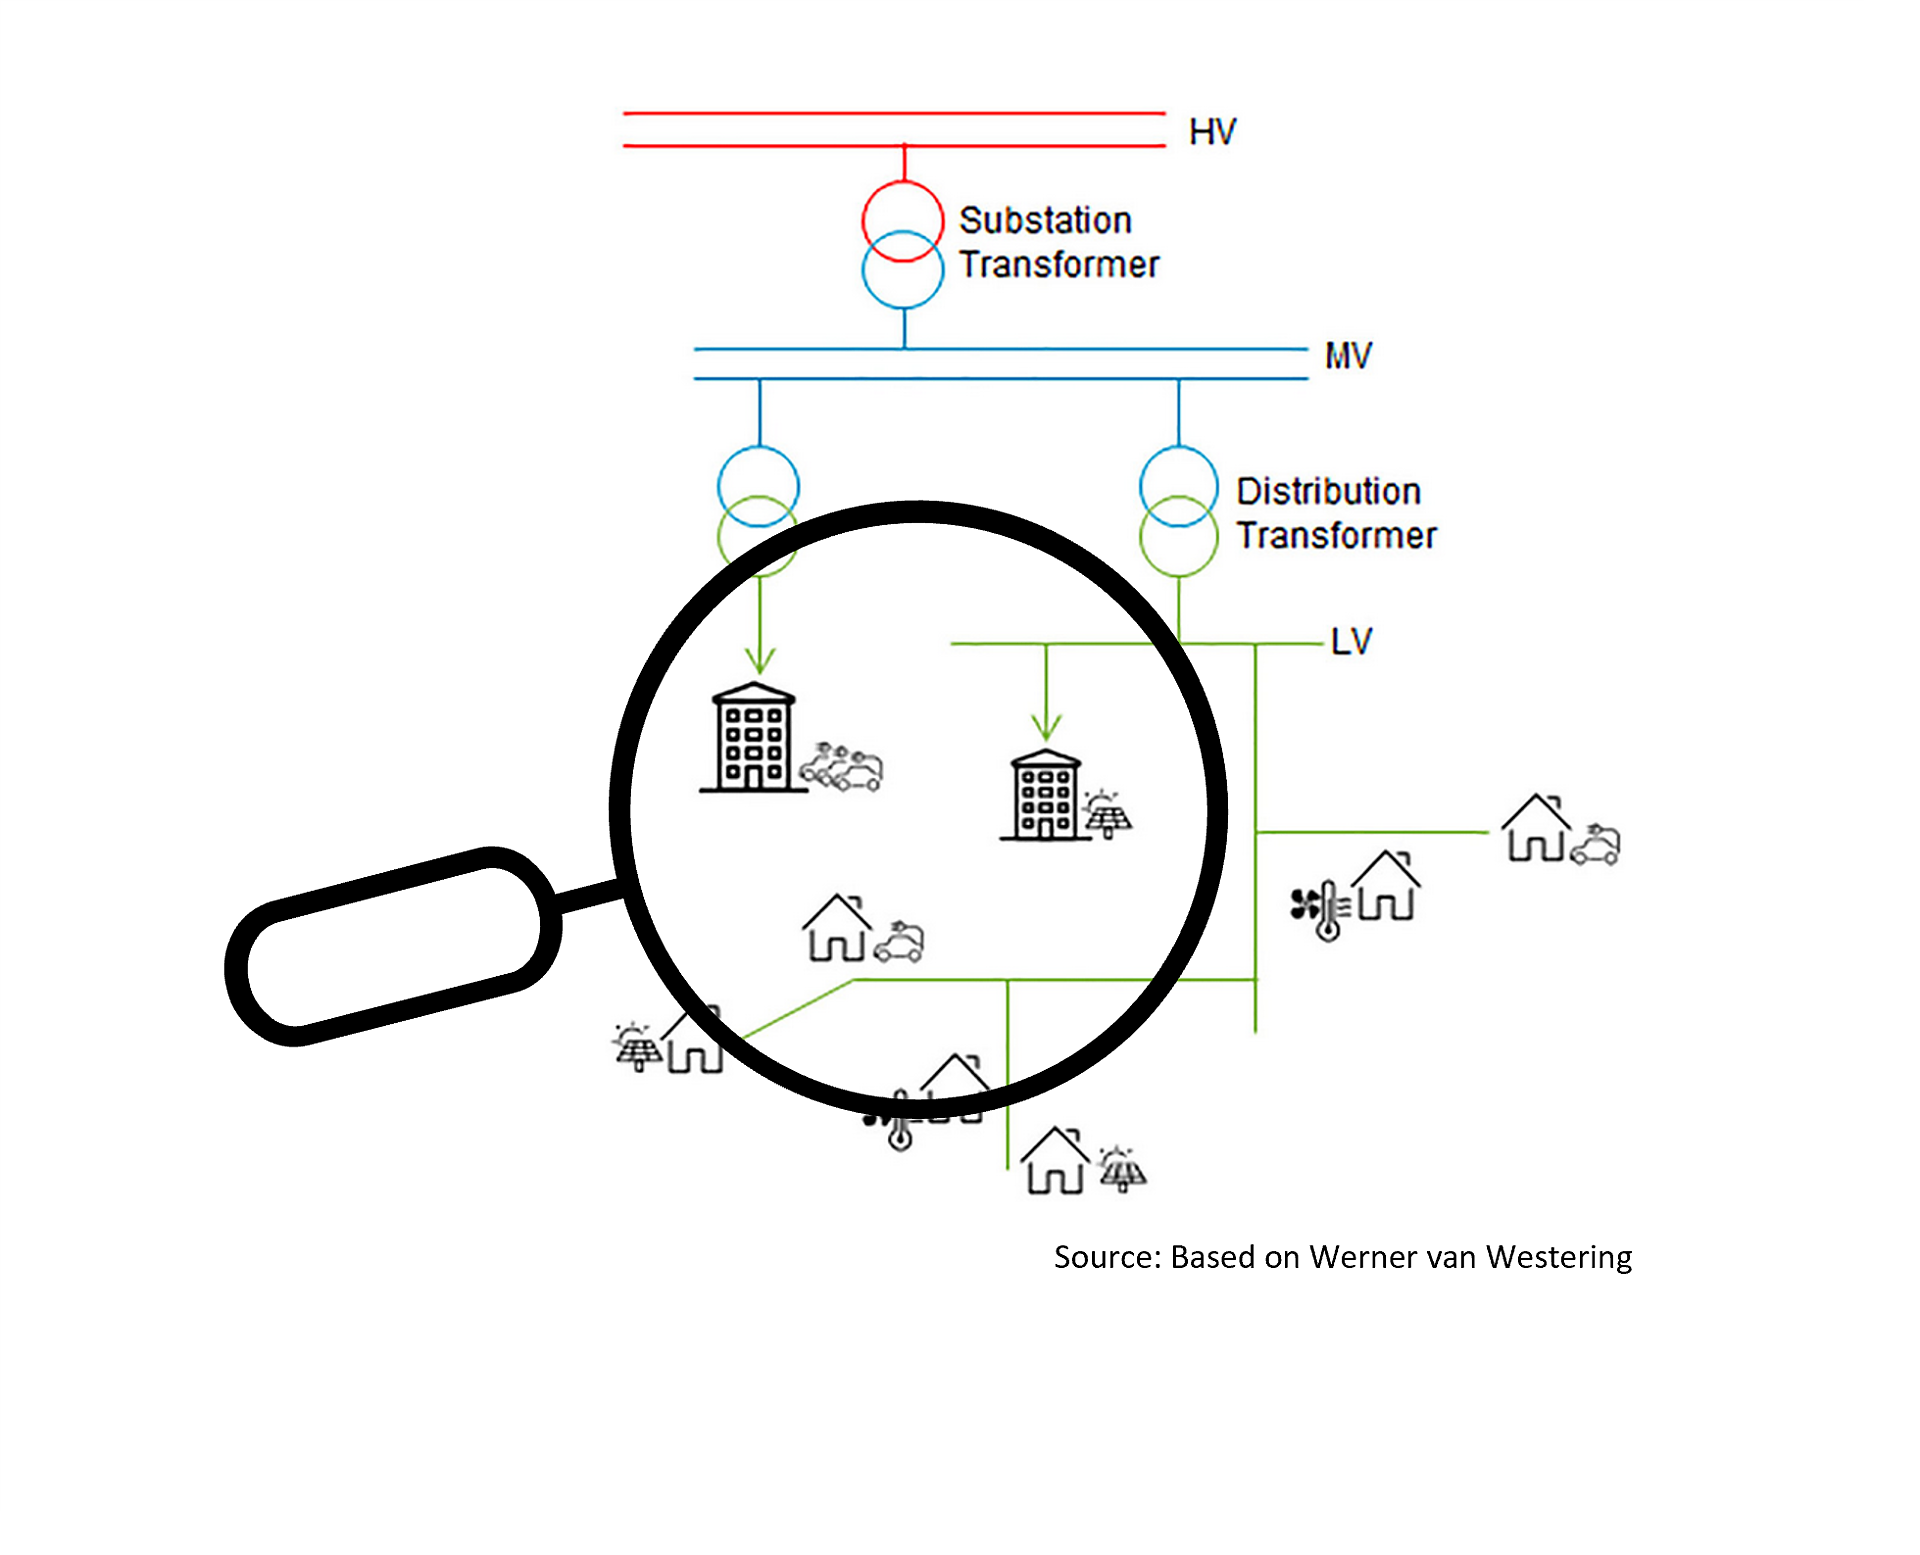
Visibility and Obervability of distribution grid assets and grid status
One challenge for the use of decentralized flexibility is the current lack of visibility of the systems and the lack of observability in the distribution grid, as well as the lack of real-time information on the topology of the distribution grid itself. These problems make it difficult to verify the actual need for flexibility as well as to validate or measure the flexibility provided.
Copyright: AIT Austrian Institute of Technology based on Werner van Westering
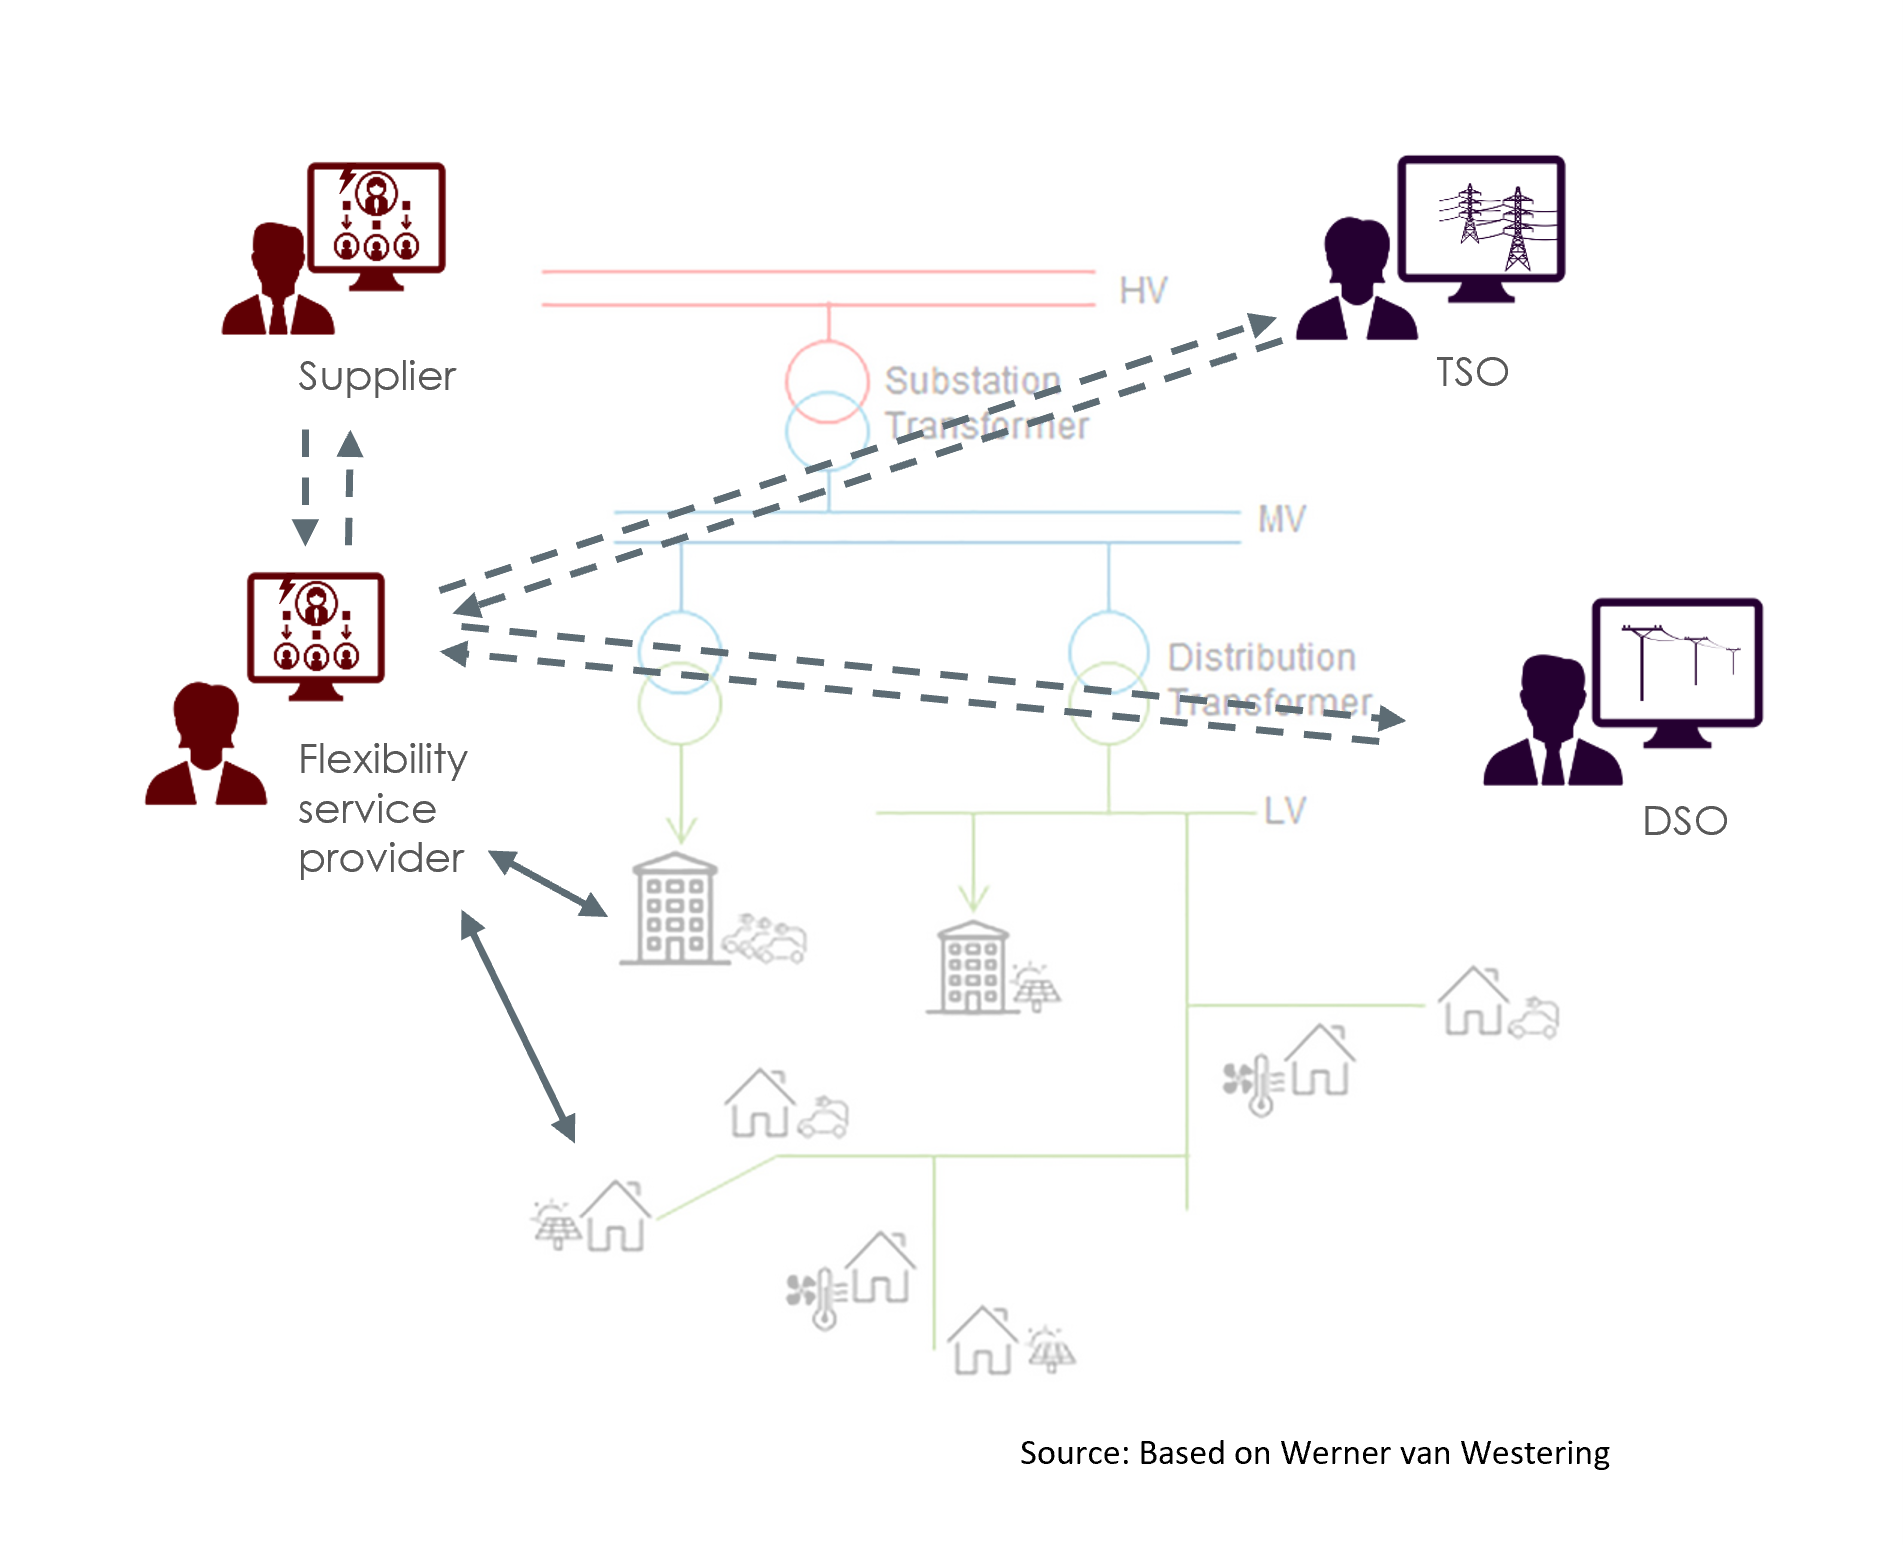
Data exchange between different stakeholders as a challenge
The energy system data and the data exchange between transmission and distribution system operators, as well as suppliers and aggregators, are currently only sufficient to a limited extent to enable an appropriate provision of flexibility services.
Copyright: AIT Austrian Institute of Technology based on Werner van Westering

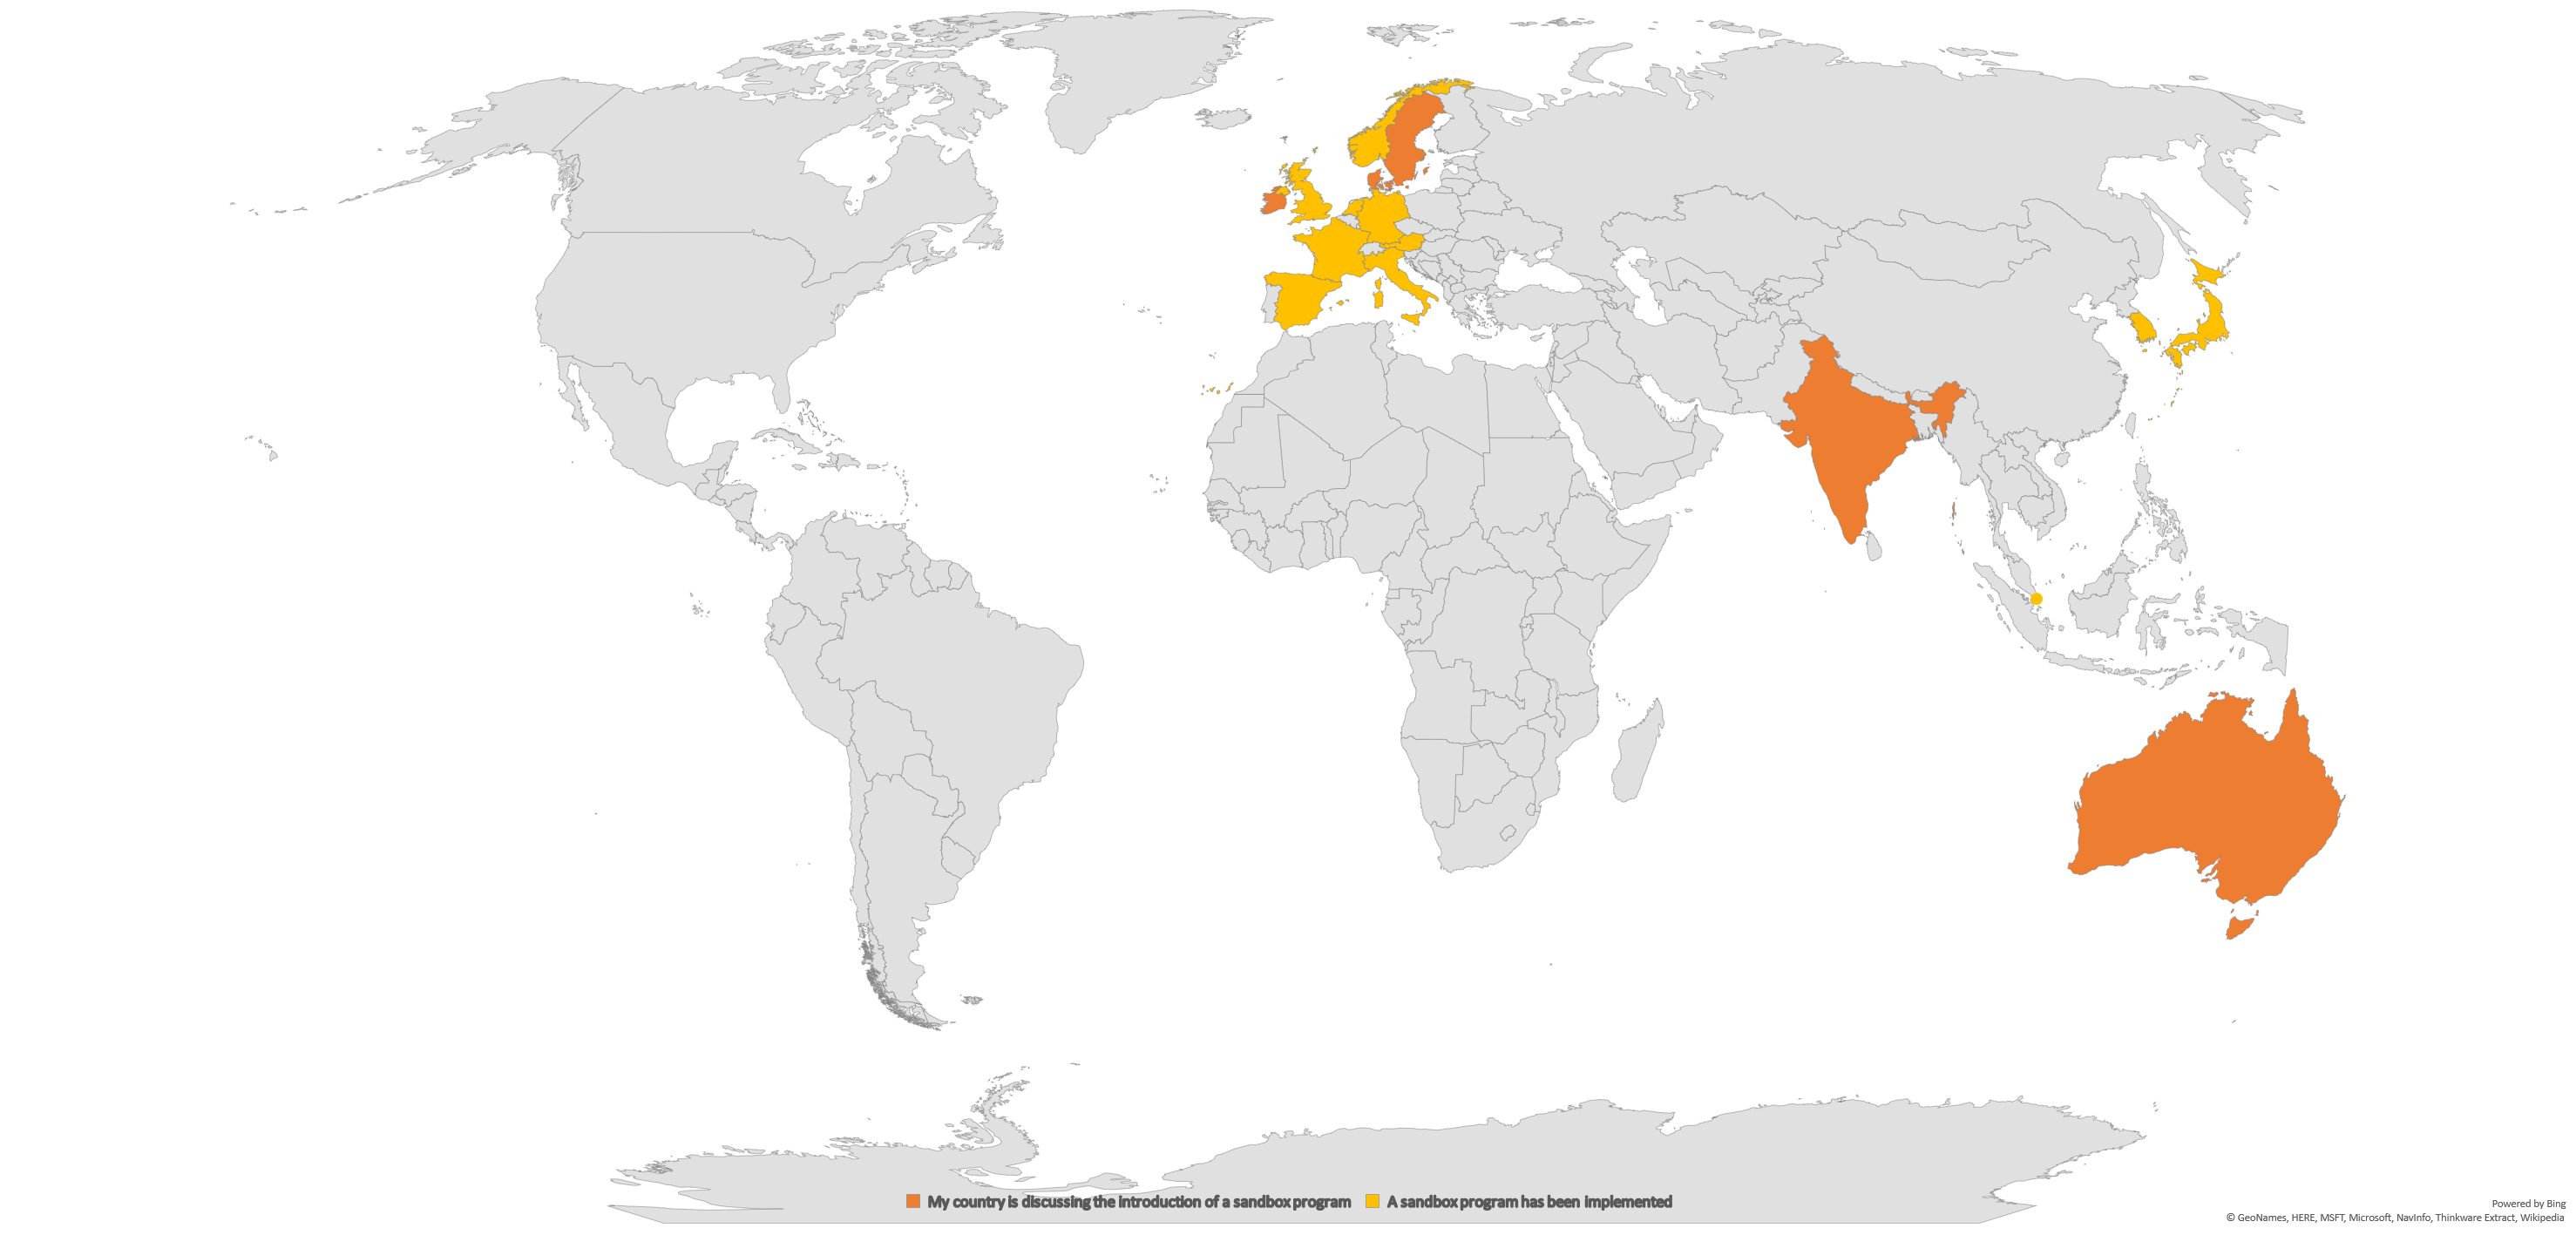
Overview of regulatory sandboxes worldwide
Regulatory sandboxes are policy instruments that create the appropriate legal framework so that innovators can test new products, services and processes under real conditions that would otherwise not have been possible under the current regulation. Such a regulatory experiment should take place in a temporally and / or physically delimited space and pursue the goal of developing technical and / or service solutions to accelerate the energy transition. The figure shows the status of the implementation of regulatory experimenting in countries worldwide.
Copyright: AIT - Austrian Institute of Technology
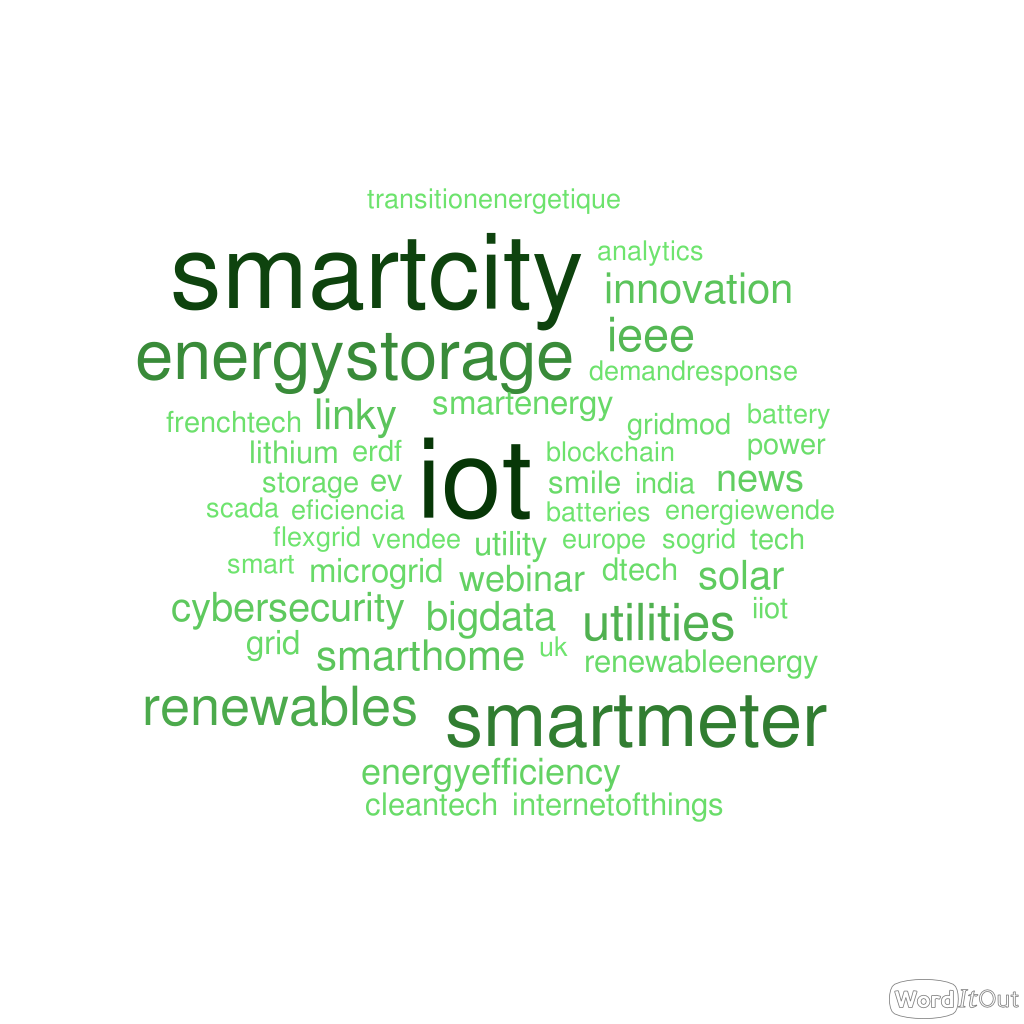
Wordcloud
The analysis is based on a systematically observed global communication on Twitter with a data set of more than 70,000 messages between December 2015 and April 2018, all of which contained the hashtag #smartgrid and / or #smartgrids. The main topics related to smart grids throughout the period, i.e. most observed keywords among the top rated were: Internet of Things, Smart Cities, Smart Meters, Storage, Renewable Energy, Cybersecurity and Big Data. The figure shows an example of a word cloud with the 50 most frequent hashtag terms between December 2015 and July 2016.
Copyright: AIT - Austrian Institute of Technology

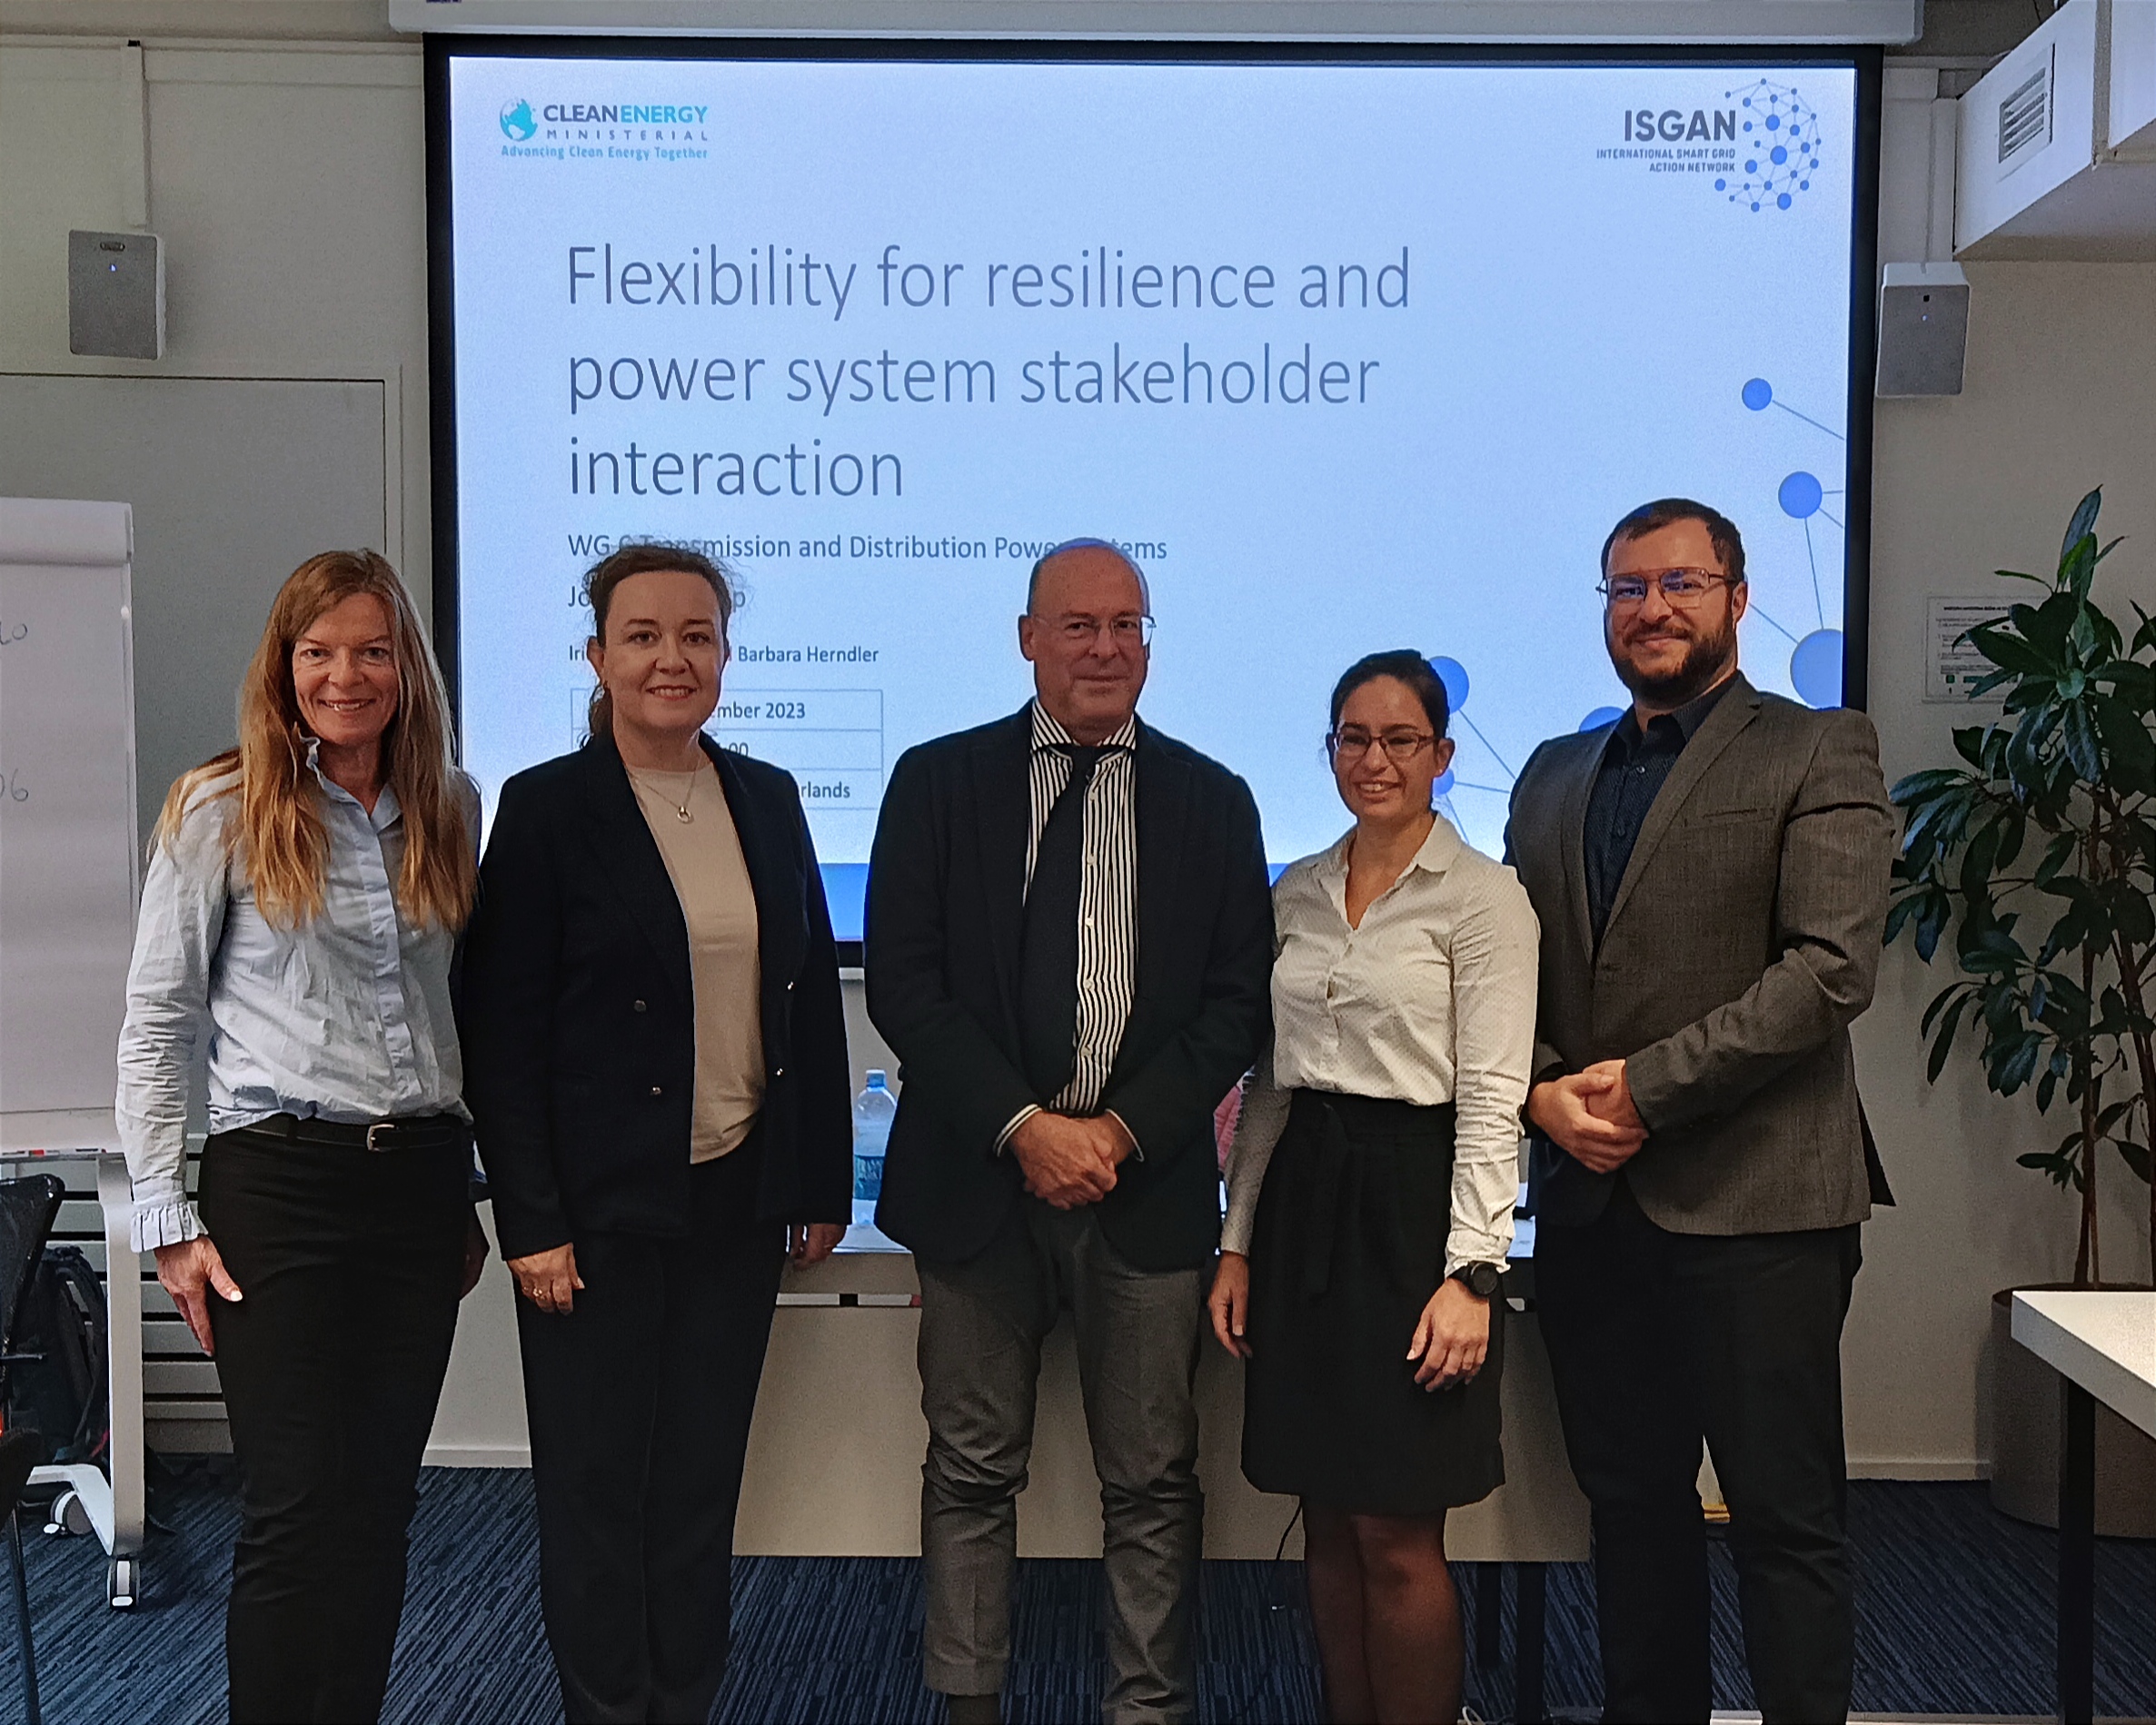
Speakers at the ISGAN WG6 workshop on flexibility for resilience and stakeholder interaction
Speakers at the ISGAN WG6 workshop on flexibility for resilience and stakeholder interaction, Irina Oleinikova , Martha Symko-Davies, Antonio IIliceto, Barbara Herndler, Mihai Calin
Copyright: Susanne Windischberger
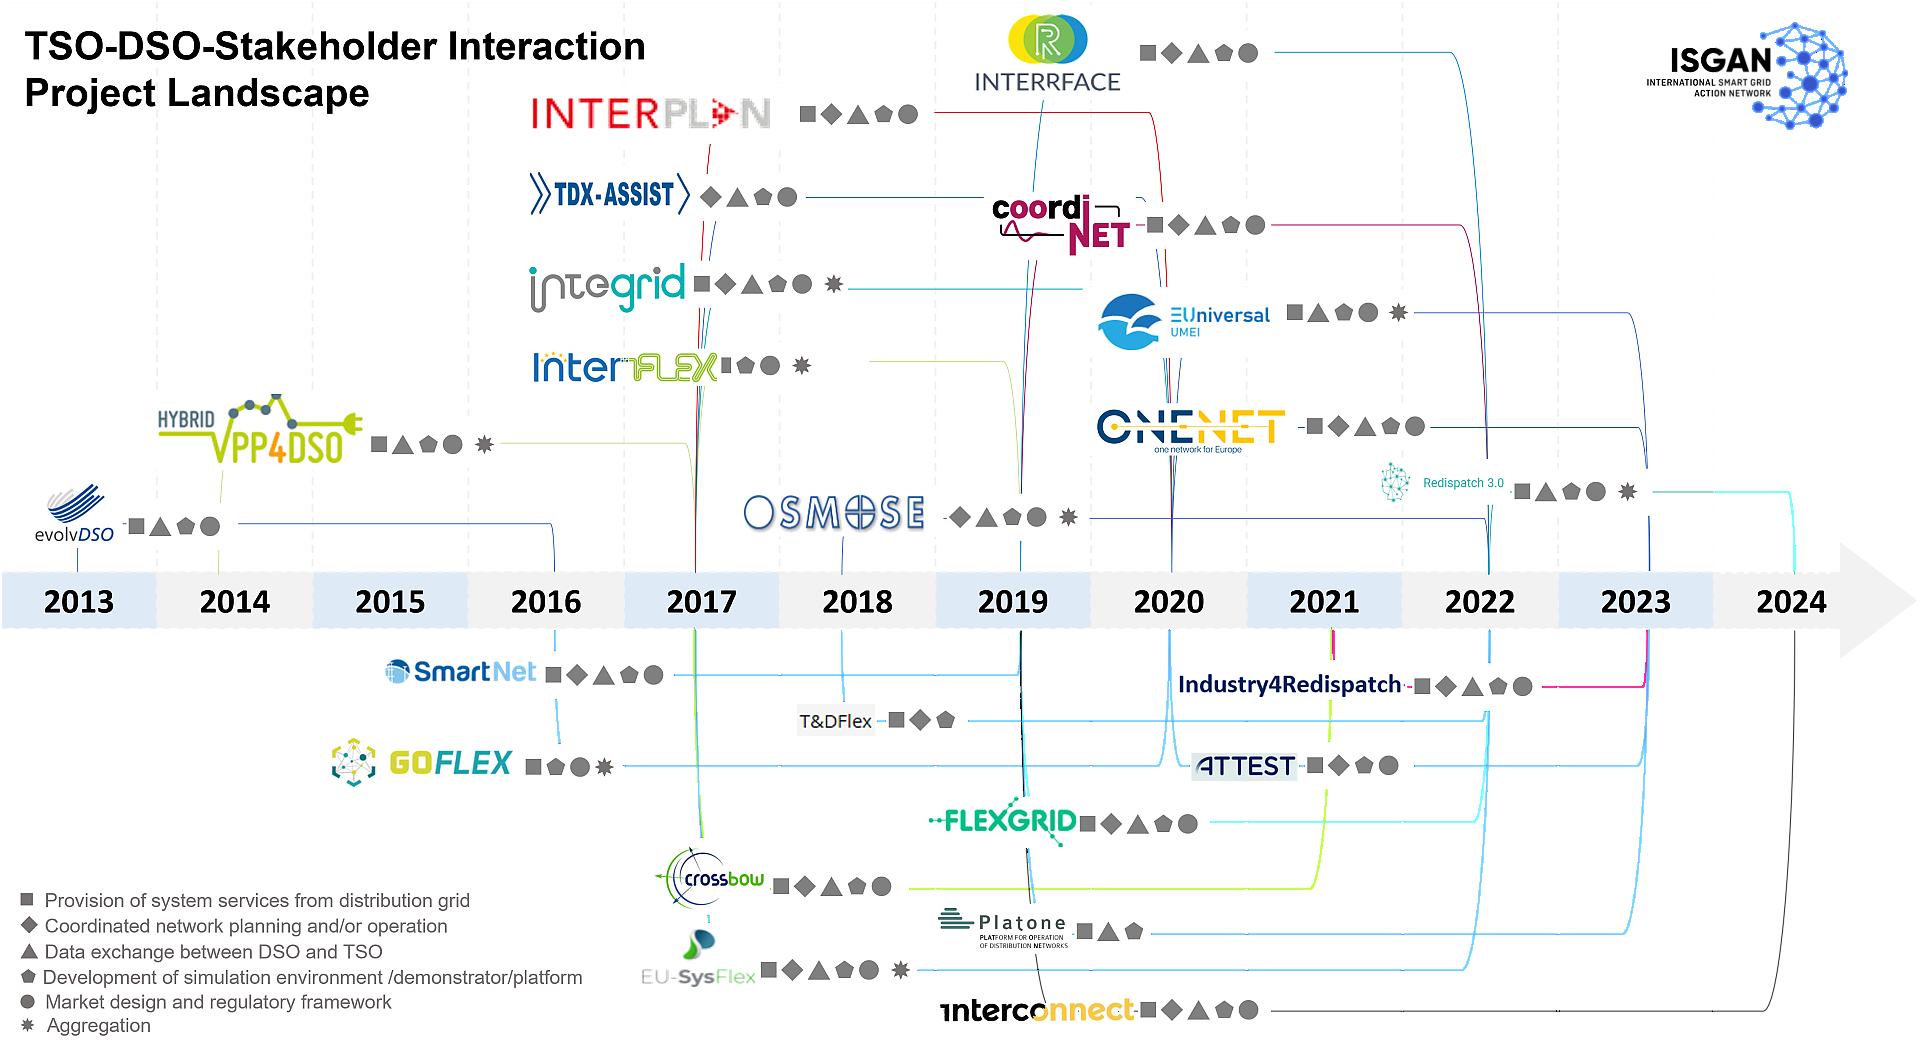
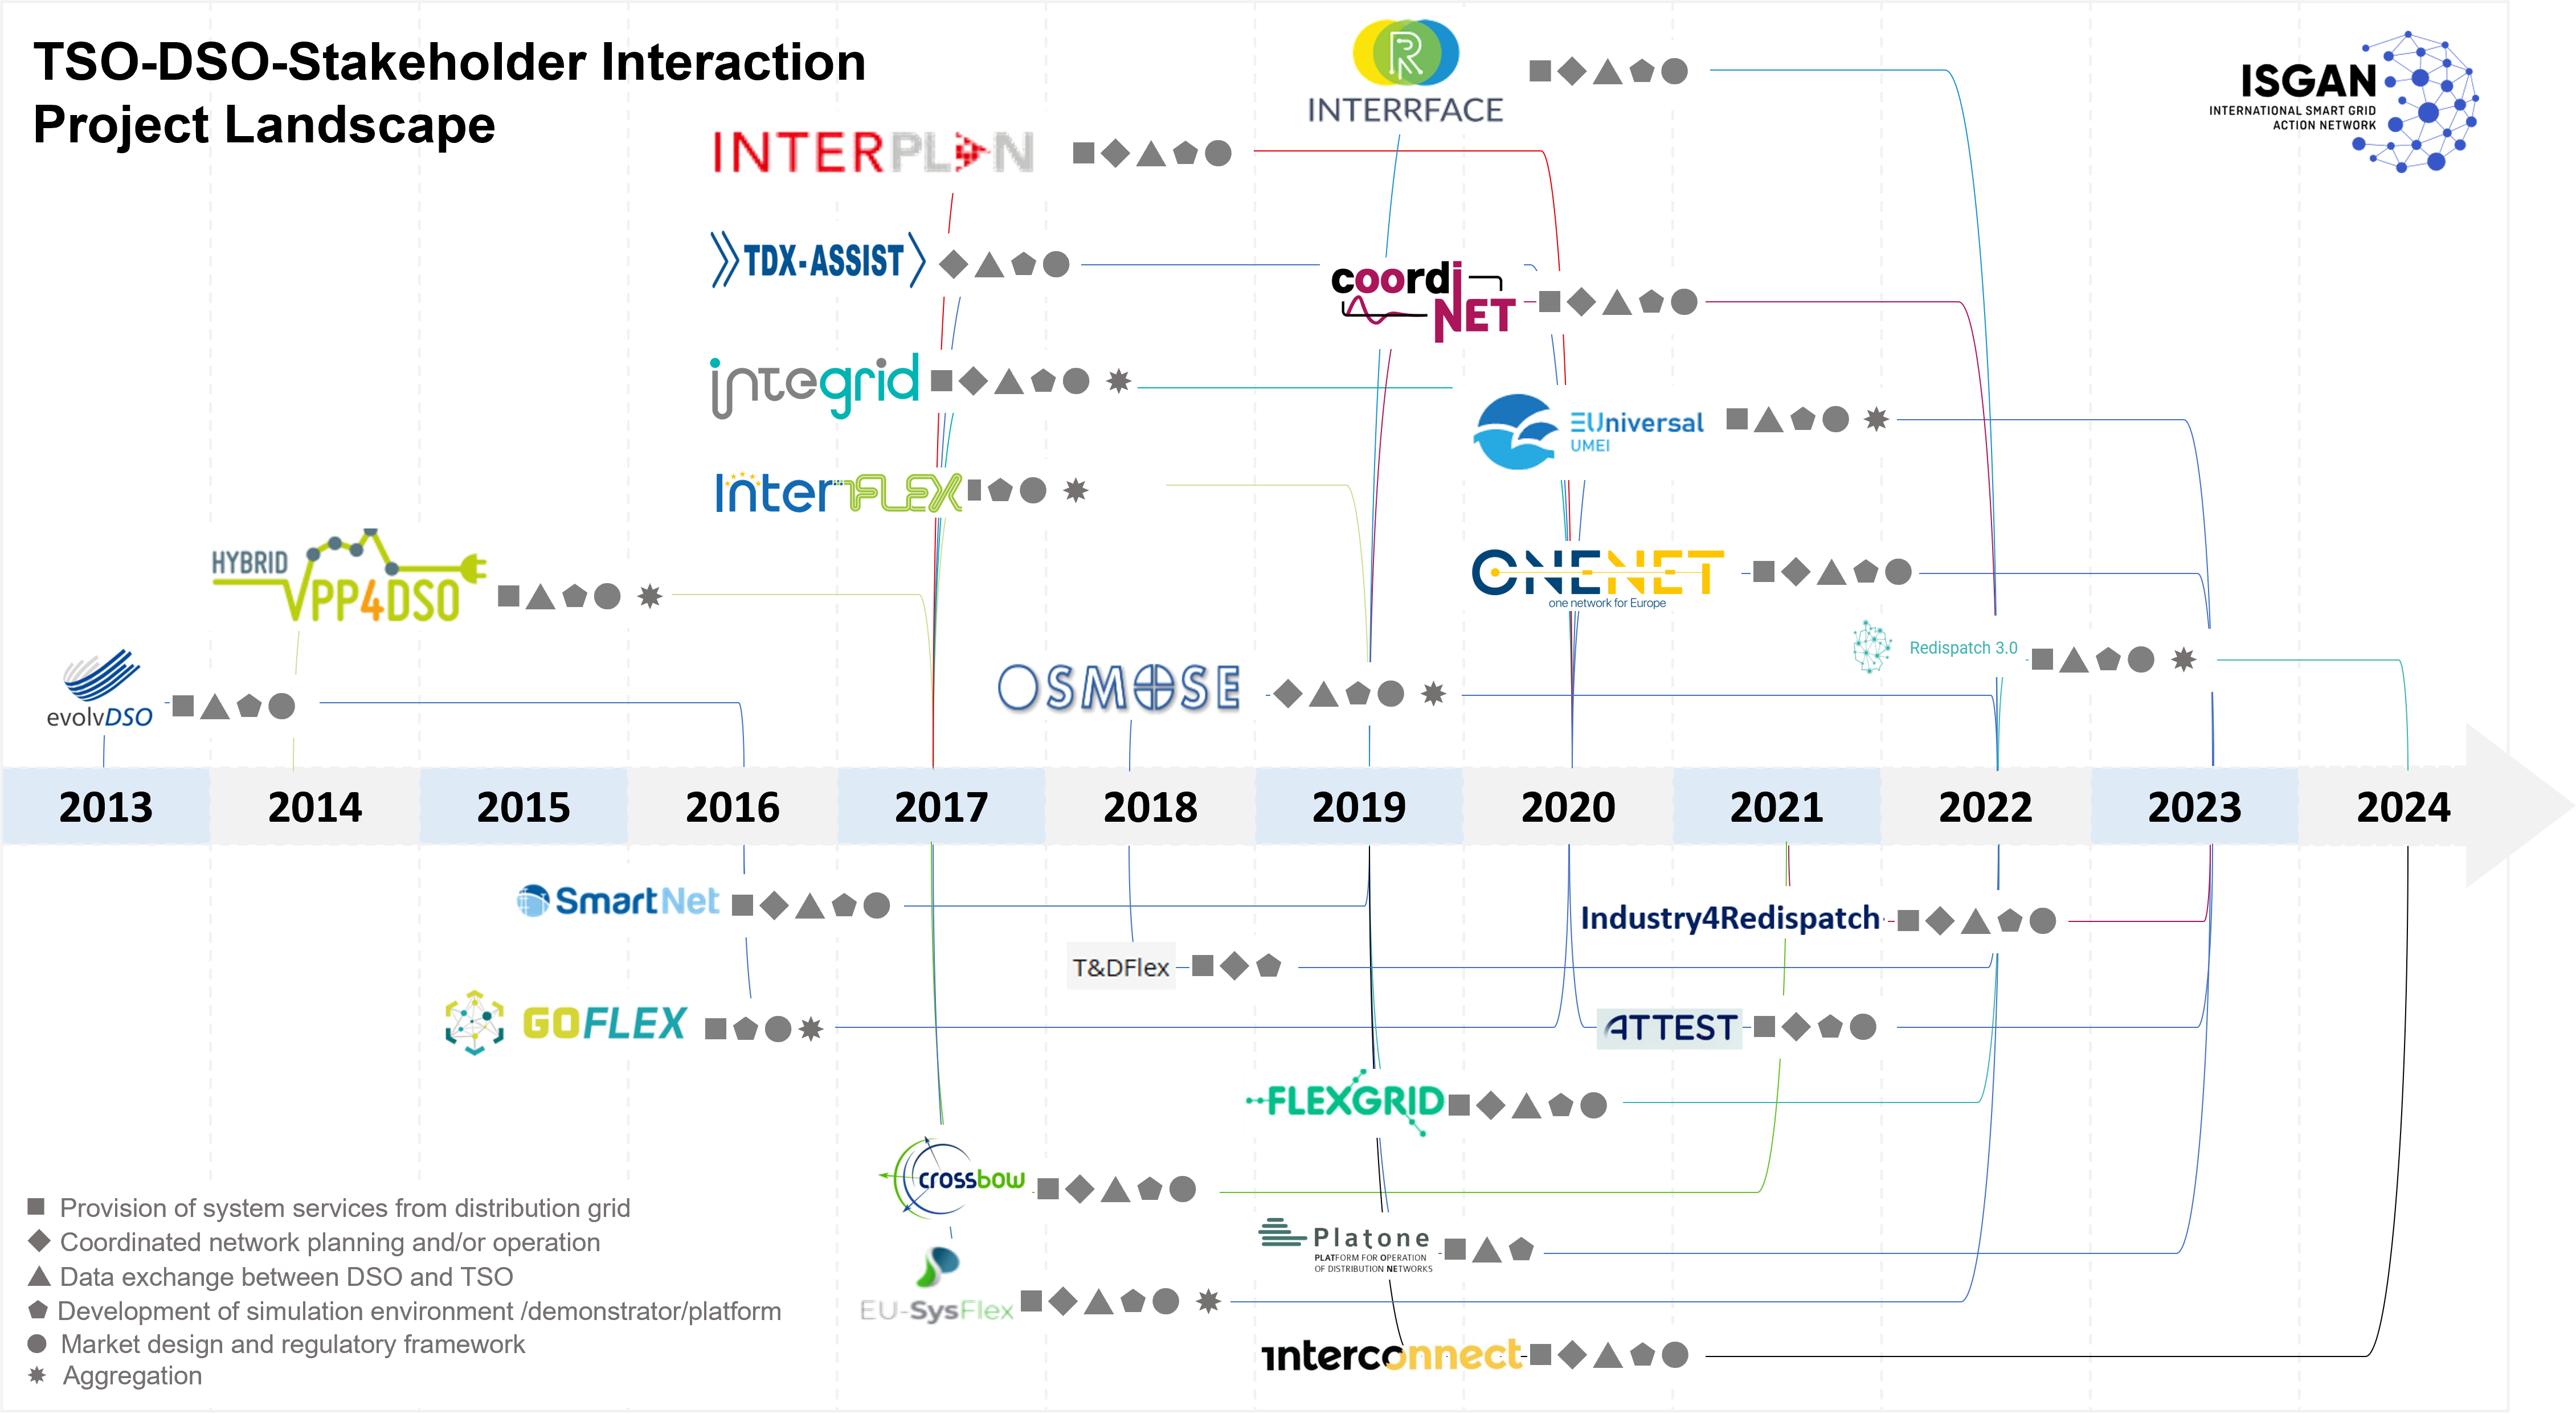
Overview of the ÜVB-VNB project landscape
Overview of the ÜVB-VNB project landscape which provides an overview of the international projects (2014-2024) which were evaluated and used for the report. Also indicated are the projects' respective focus areas
Copyright: Barbara Hernlder
Example of a LinkedIn post for a survey
Example of a LinkedIn post for a survey which was conducted during the initial phase of the project
Copyright: Barbara Herndler
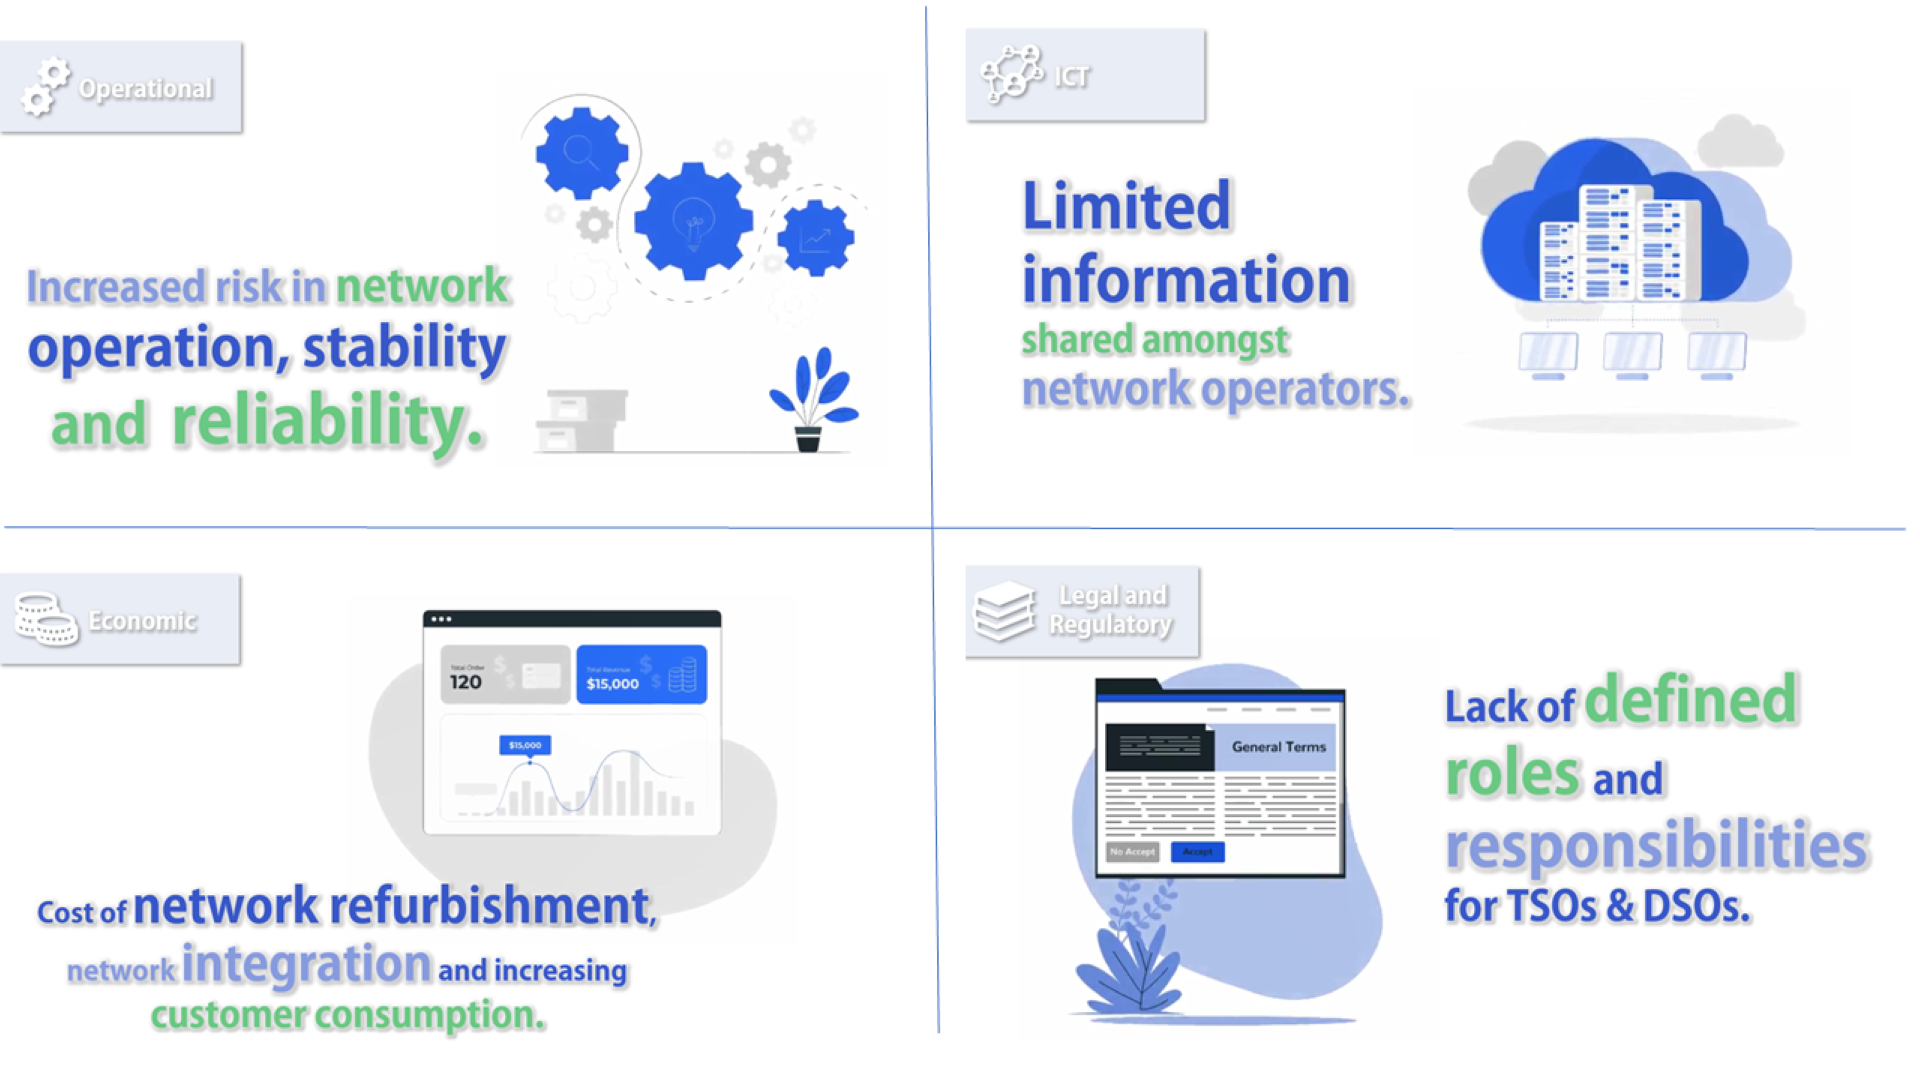
Key Challenges for Felxiblity usage
The figure shows challenges that arise in the use of flexibility. These relate to 4 dimensions: Operational, ICT technical, economic and regulatory challenges.
Copyright: AIT
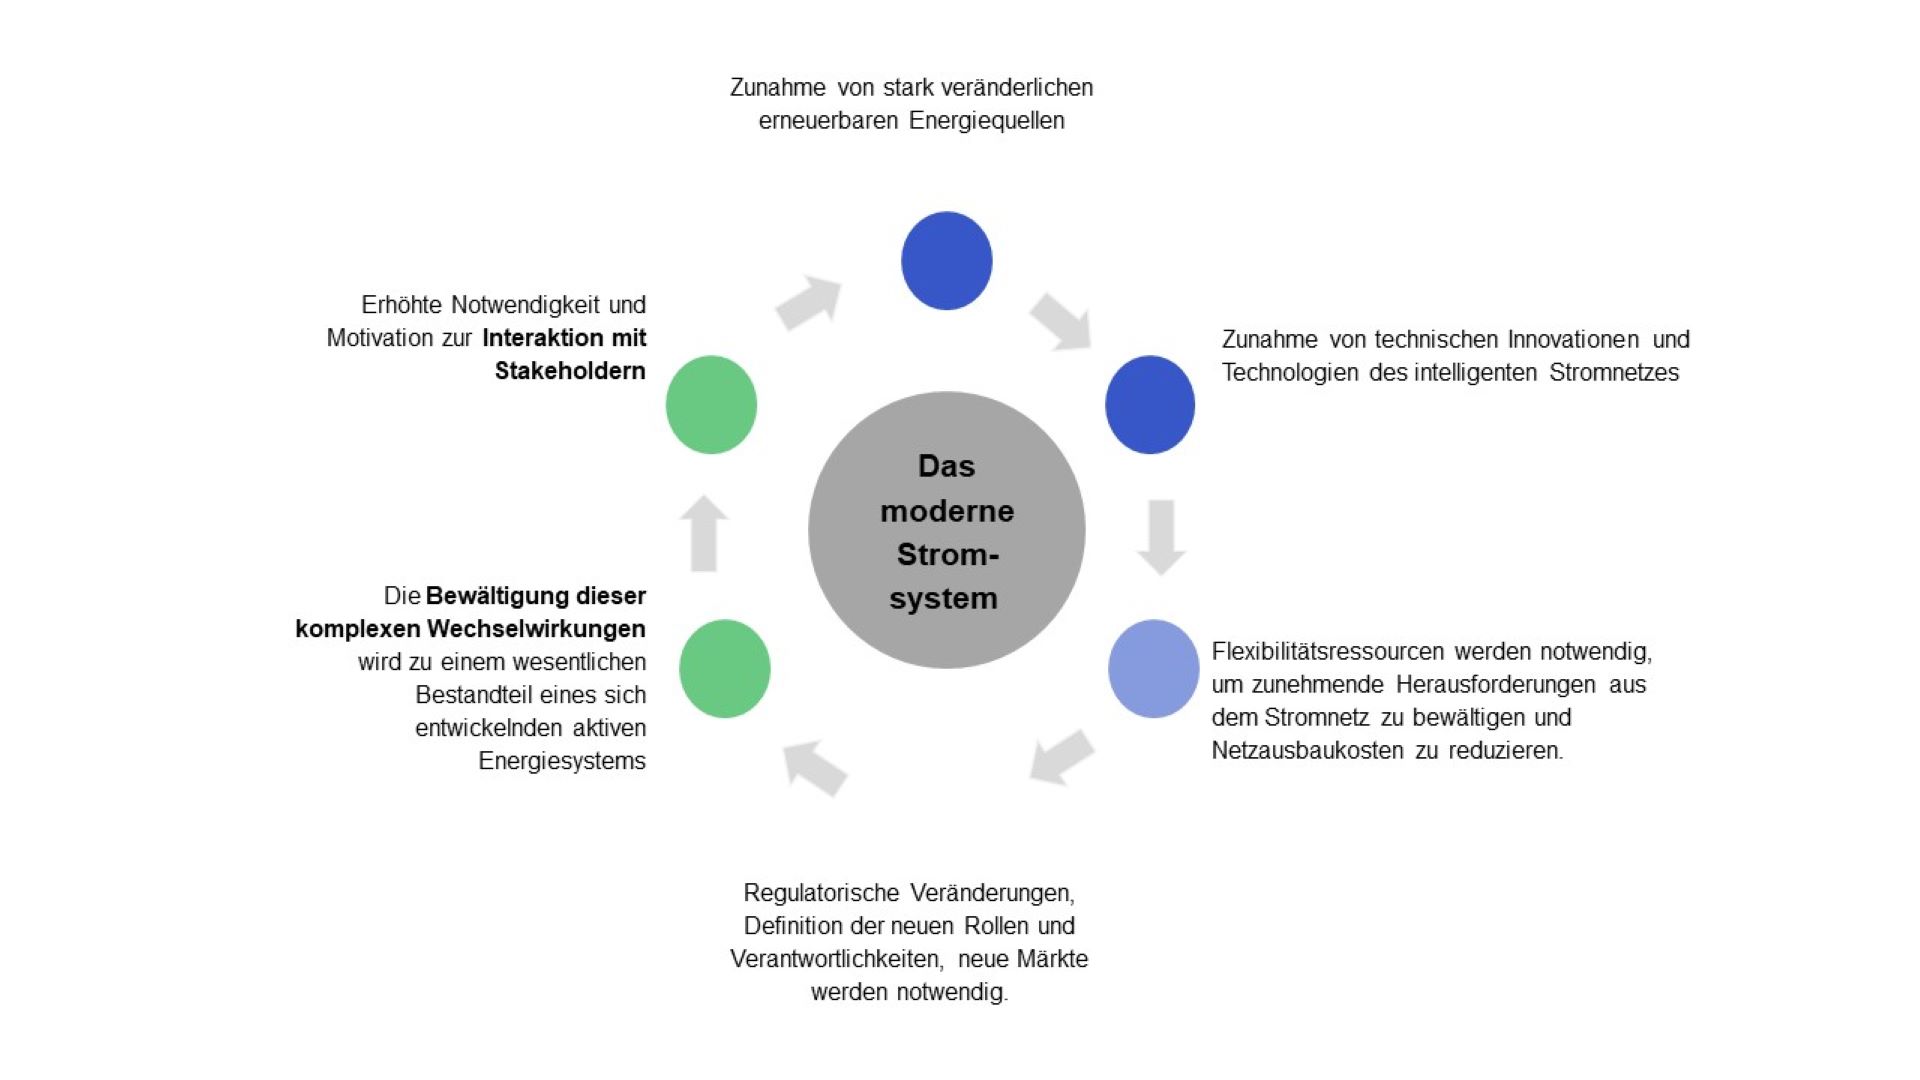
Paradigm shift in the power system
The paradigm shift in the power system and the new challenges for transmission and distribution system operators are presented.
Copyright: AIT
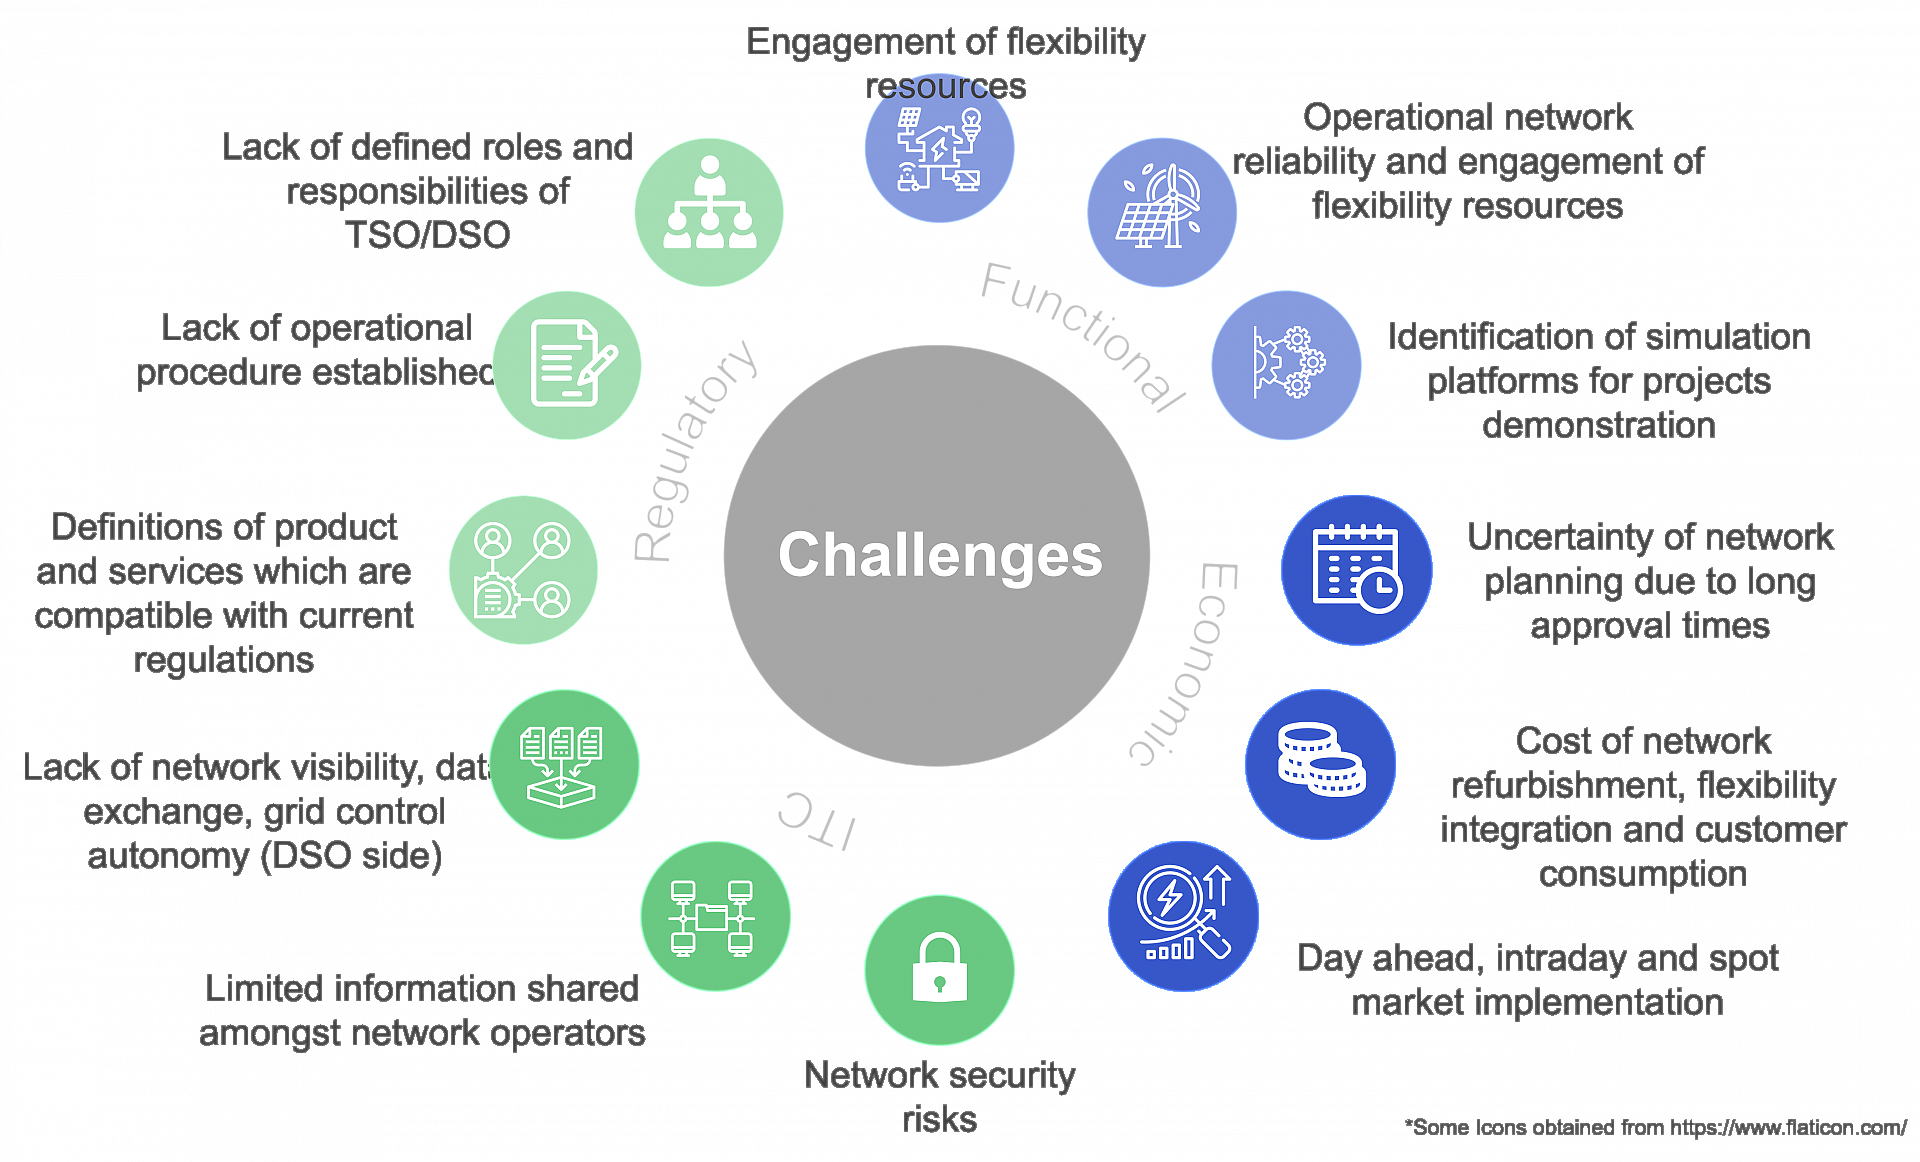
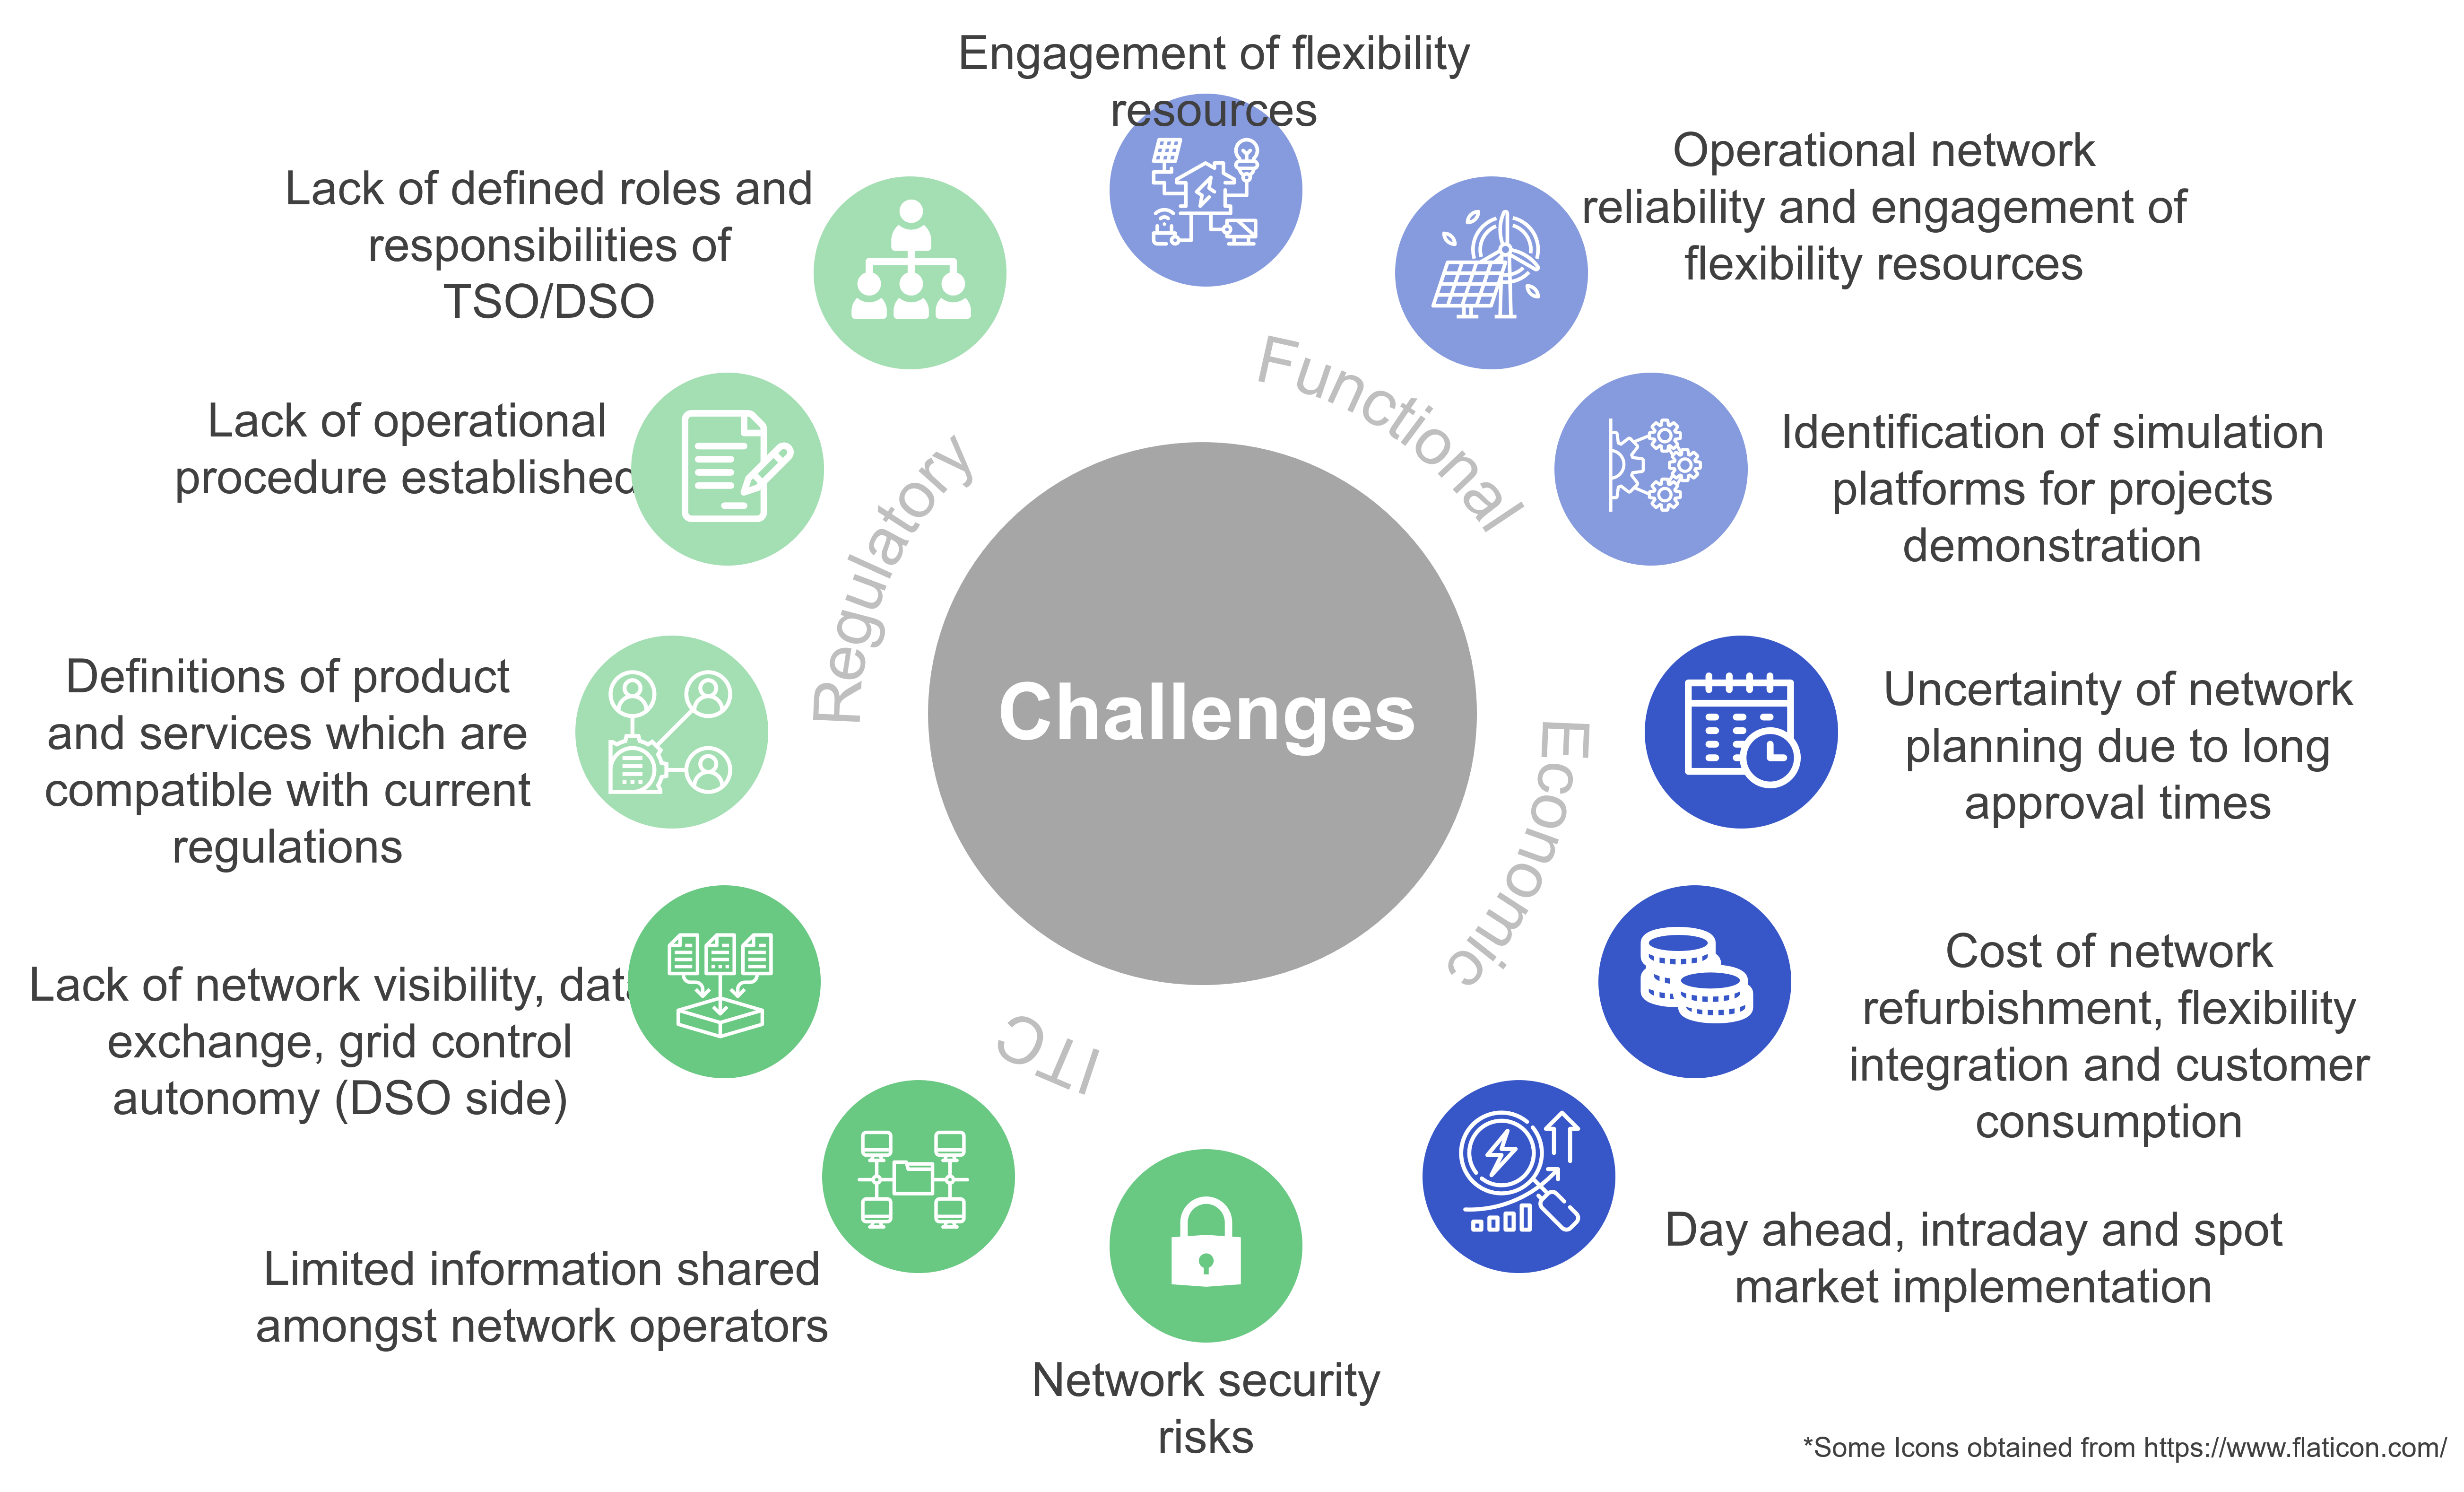
Challenges for the Interaction between TSOs and DSOs
Functional, economic, ITC and Regulatory challenges for the interaction between TSOs and DSOs.
Copyright: Berbara Herndler

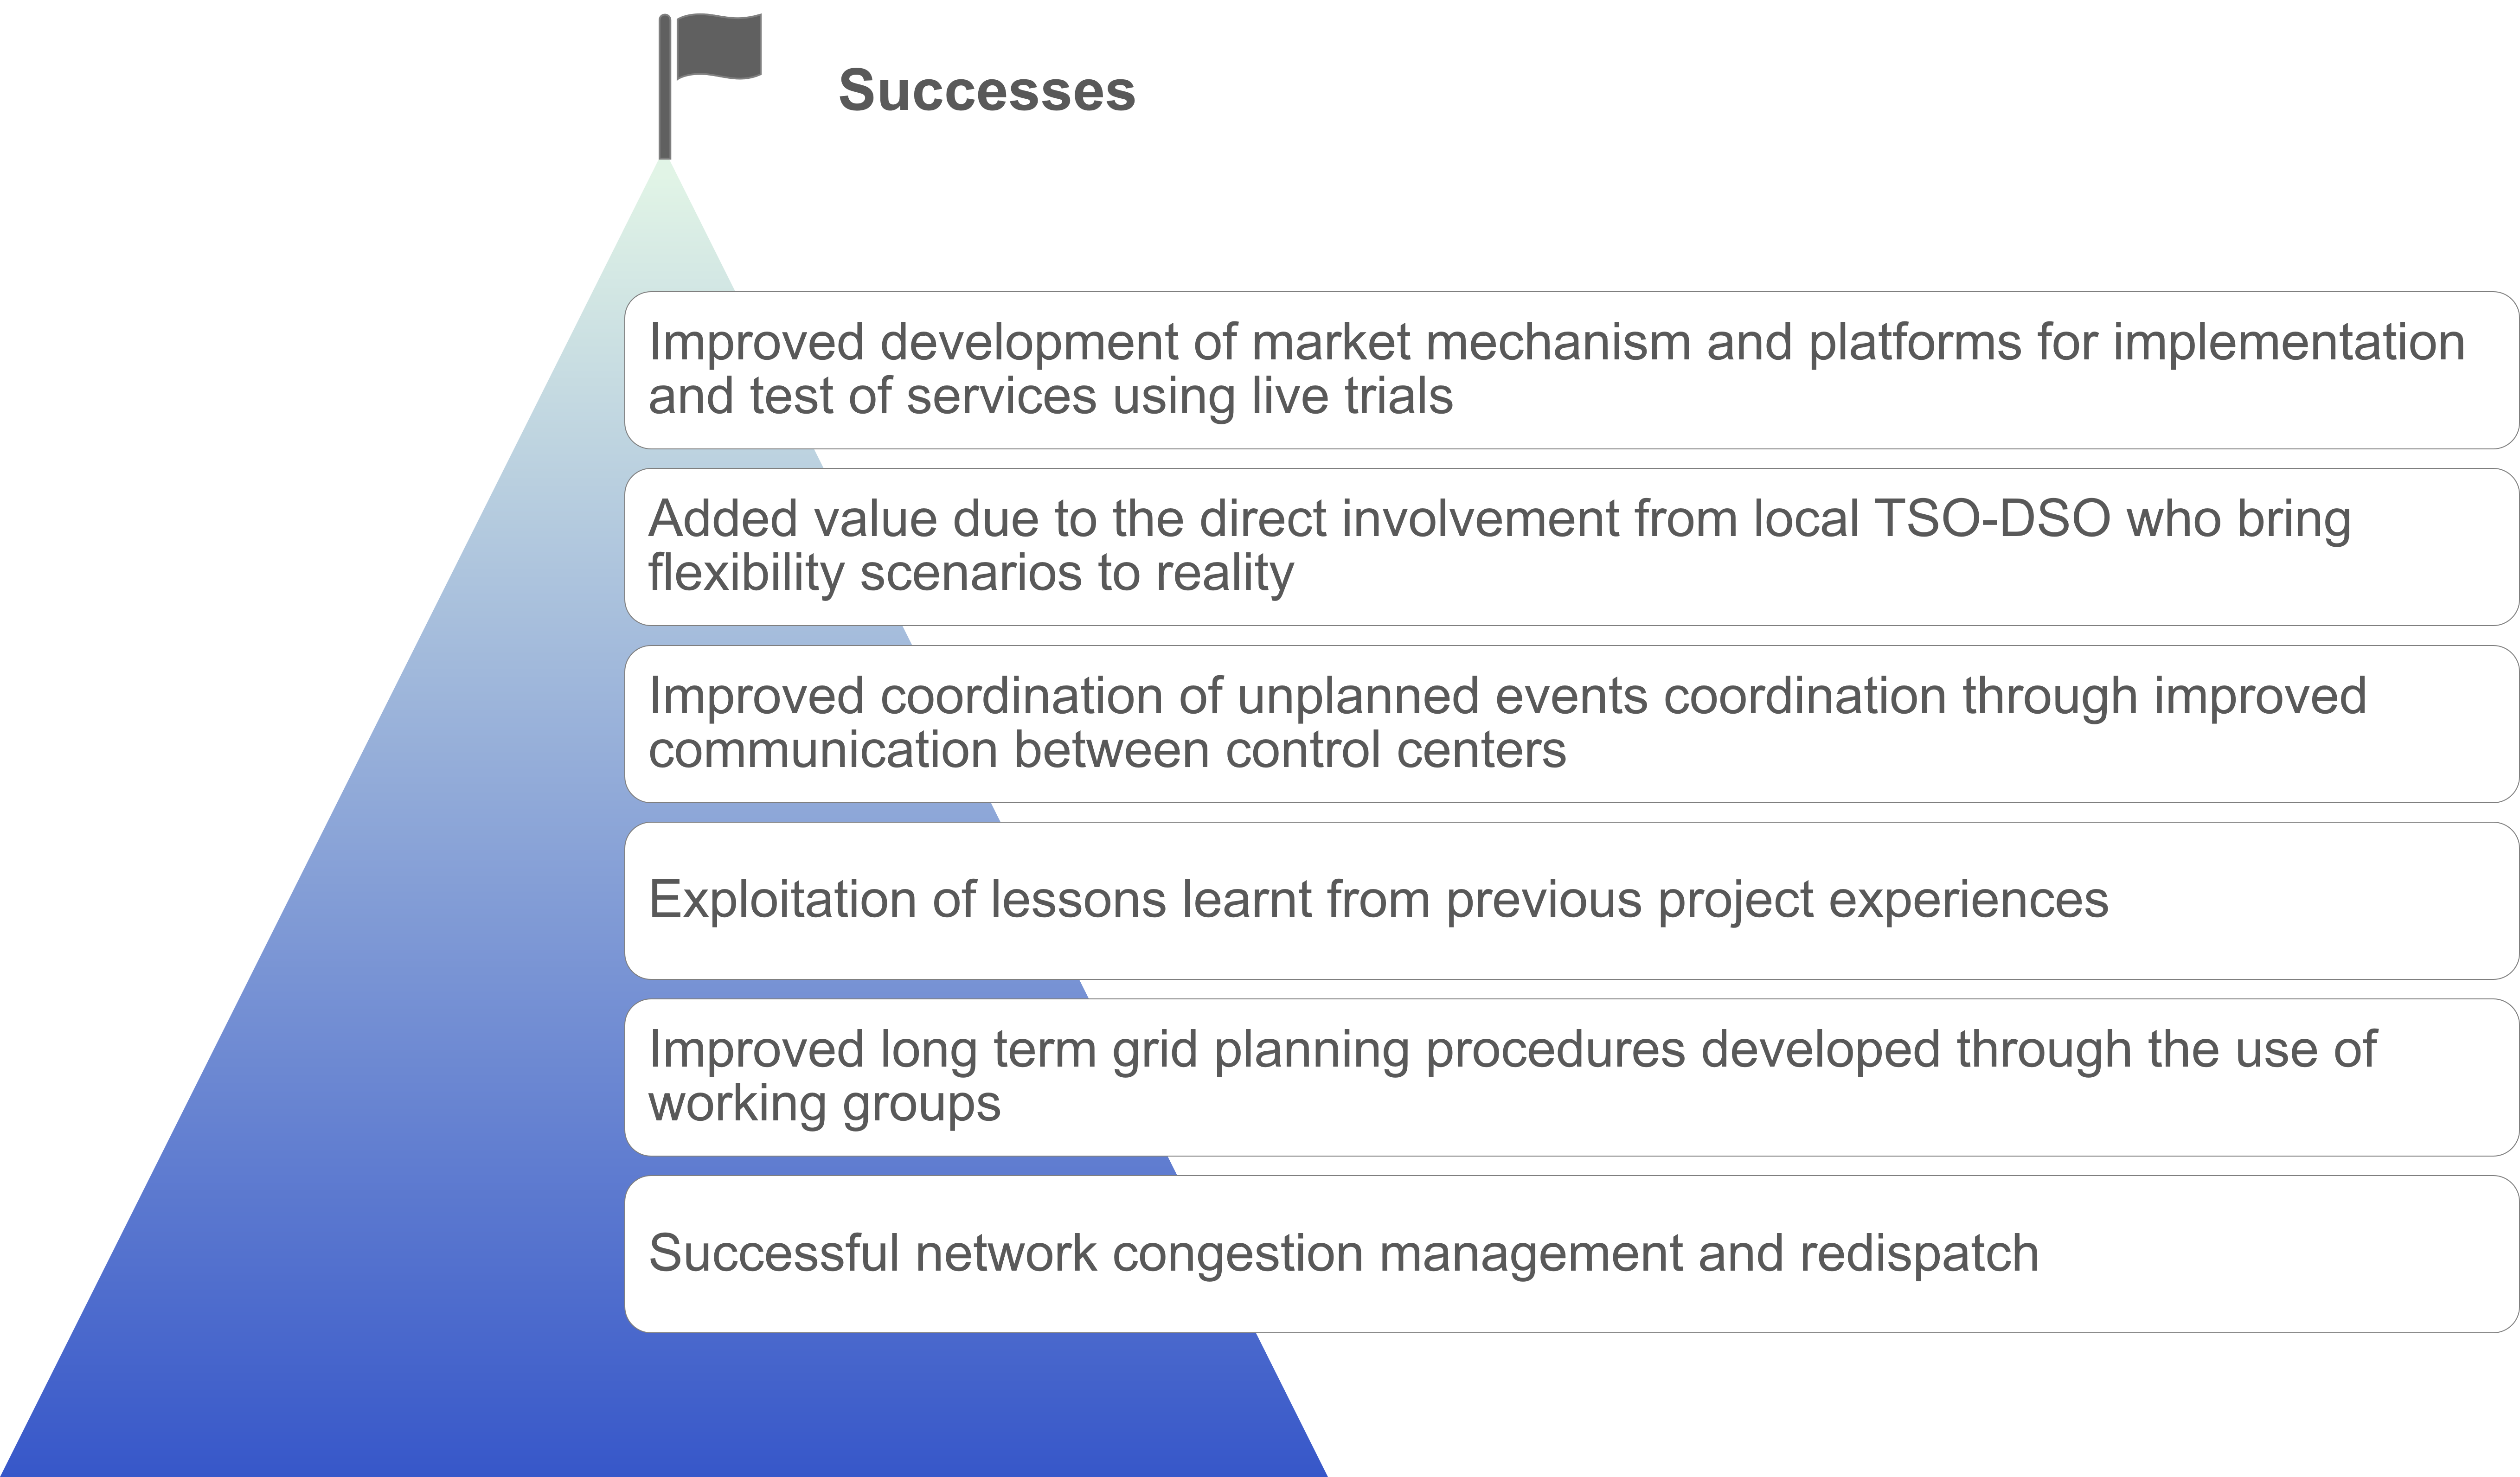
Success Factors for the Interaction between TSOs and DSOs
Success Factors for the Interaction between TSOs and DSOs.
Copyright: Barbara Herndler
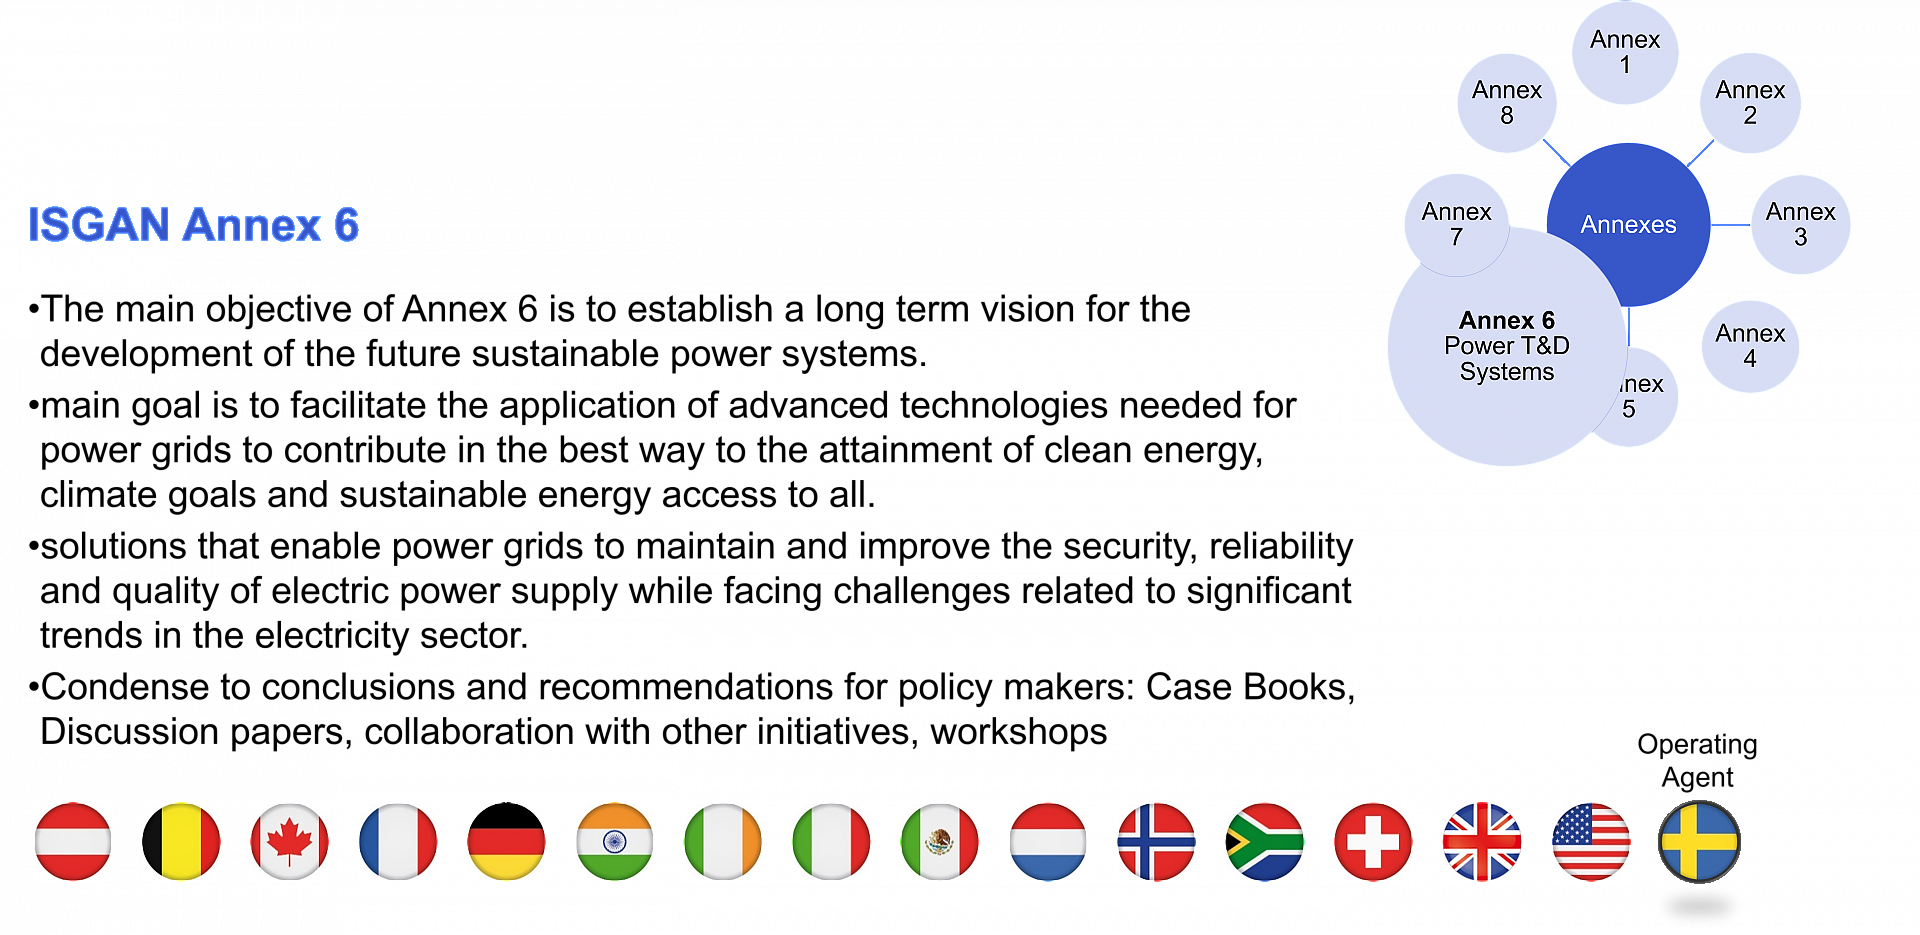
Description of ISGAN Annex 6
The main tasks and objectives of ISGAN Annex 6 are described and the participating countries (as of June 2020) are listed.
Copyright: Susanne Windischberger
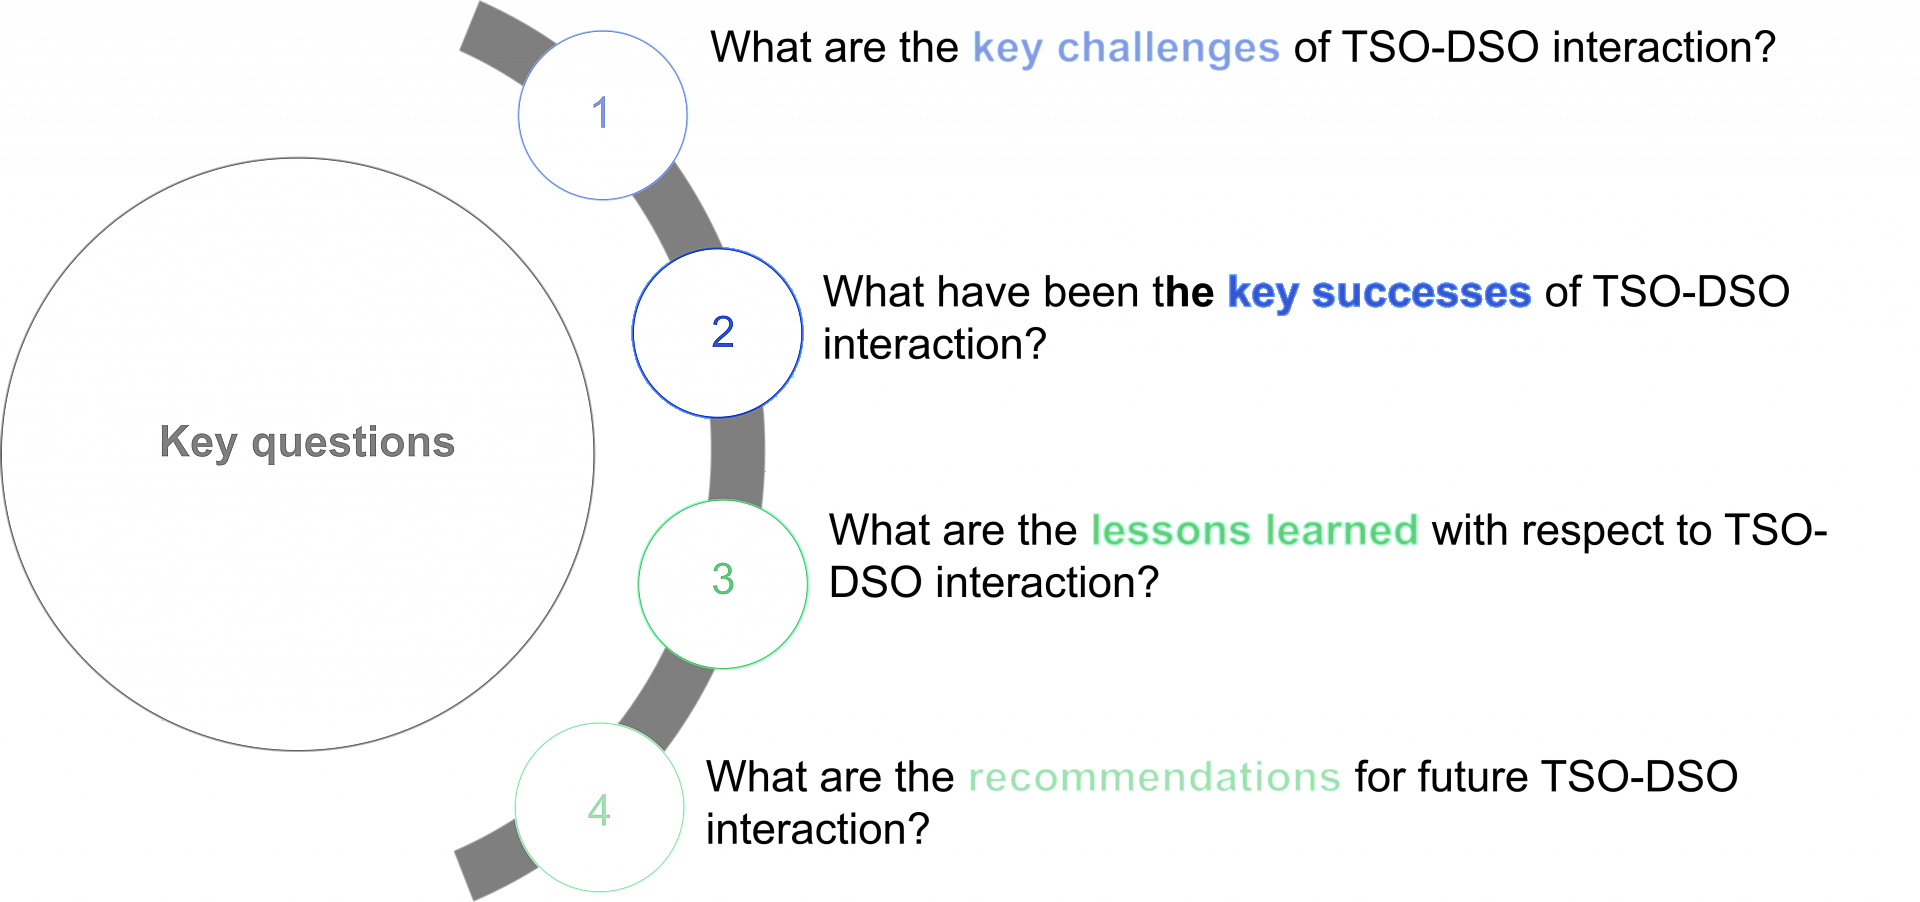
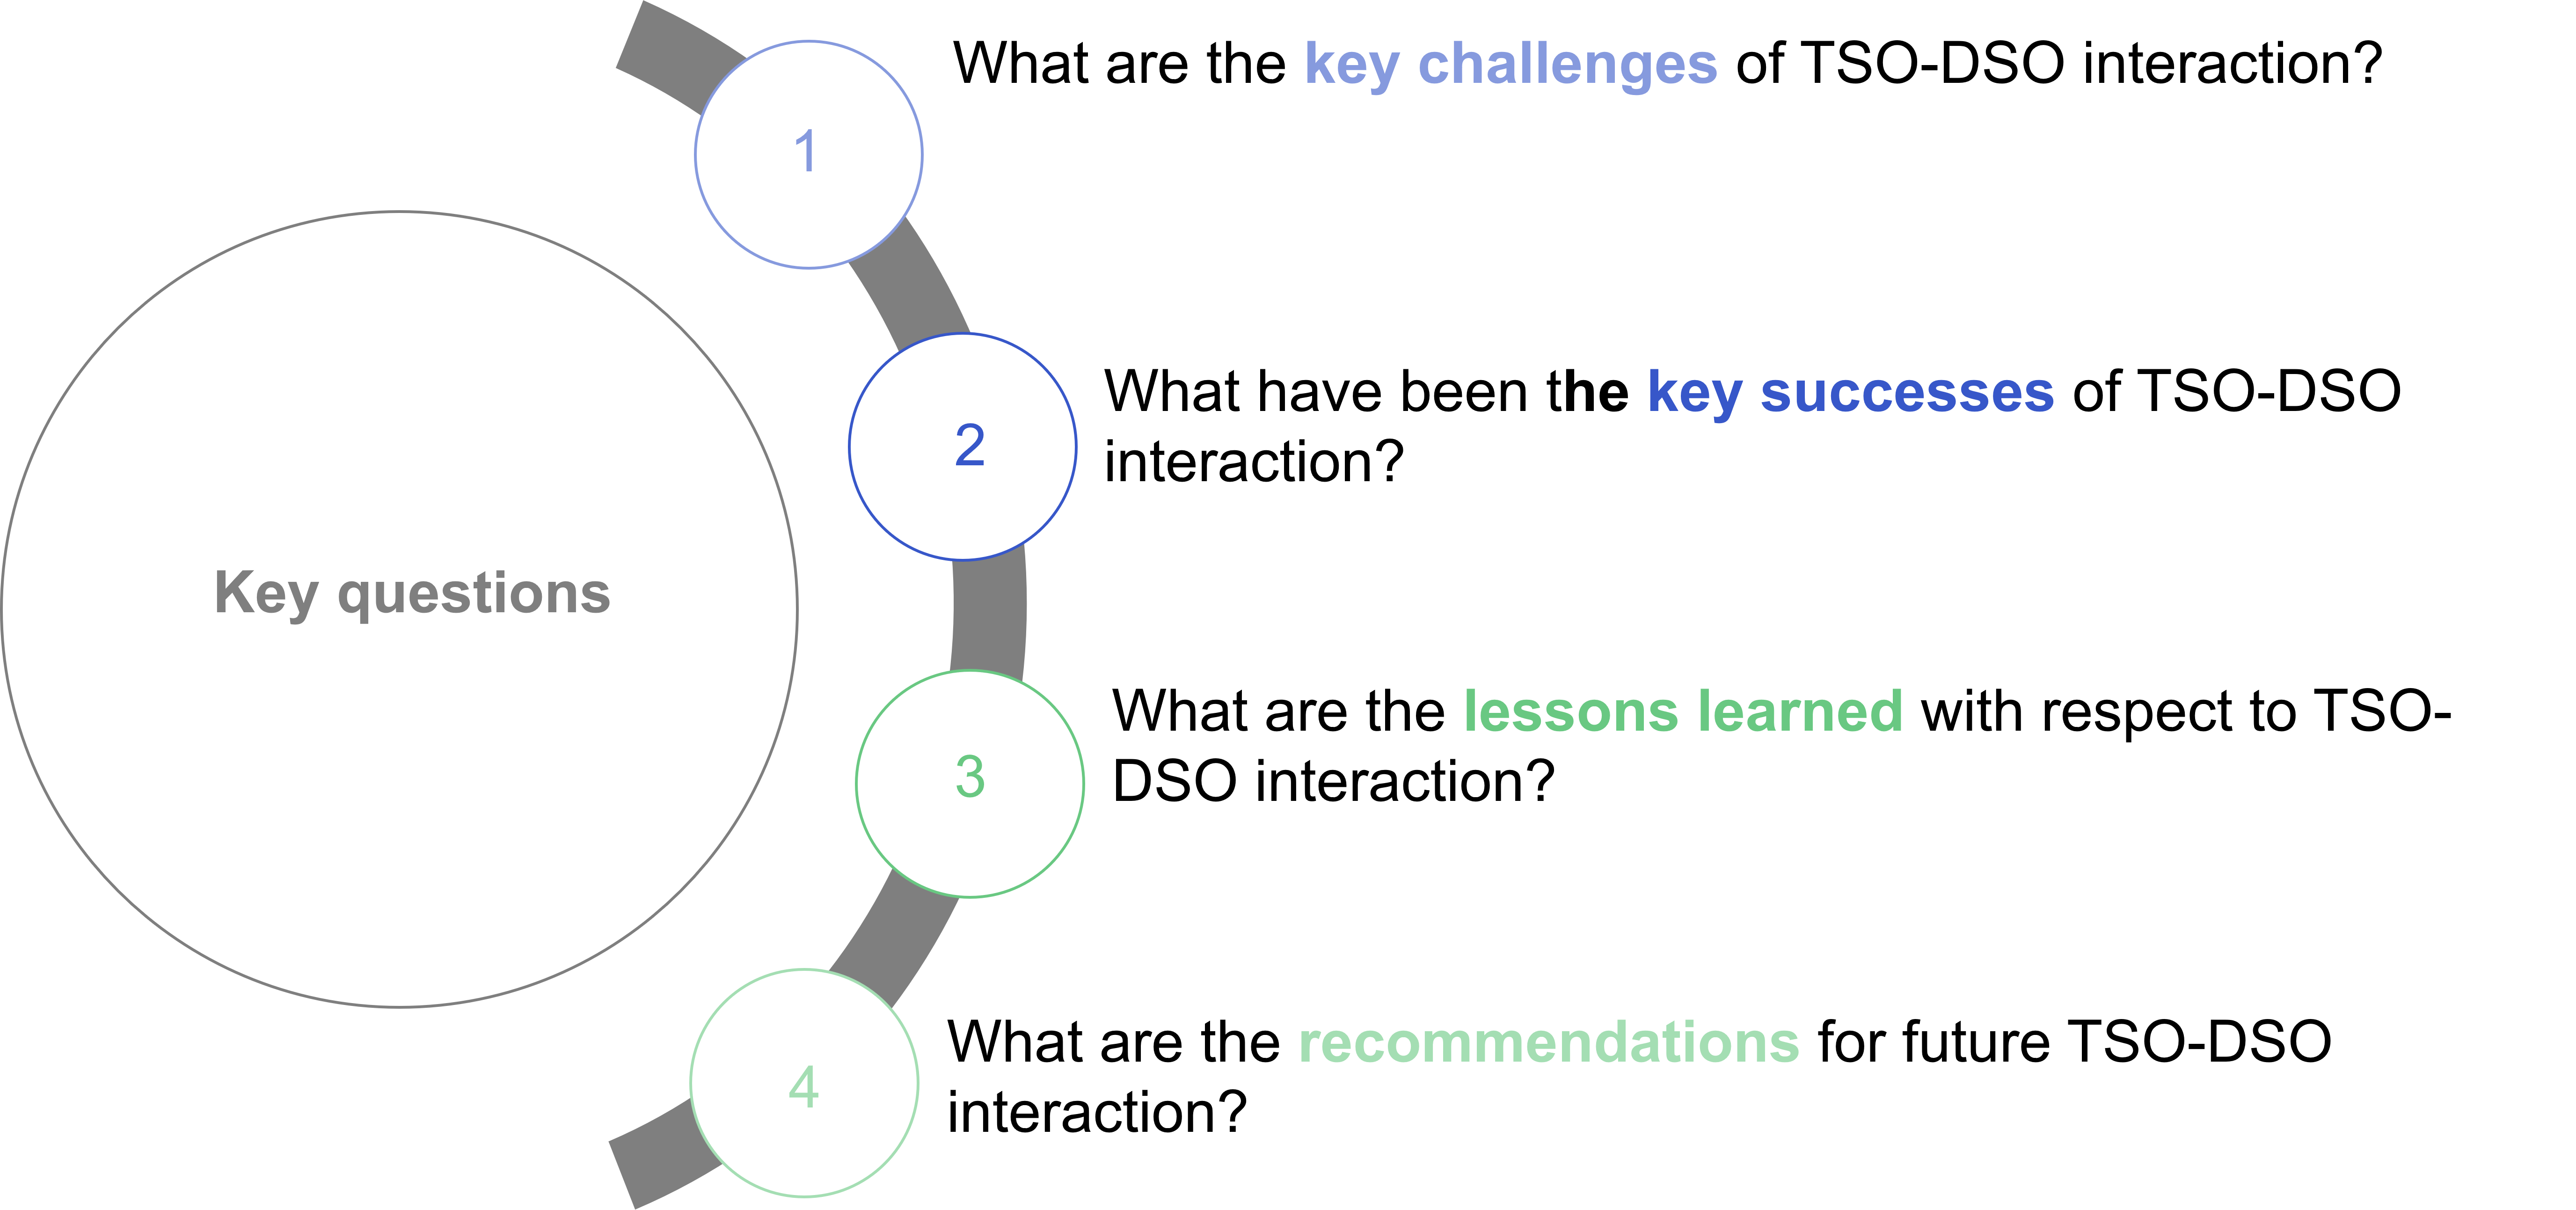
Key Questions for TSO-DSO Interaction
The most important issues for communication between transmission and distribution system operators are listed.
Copyright: Barbara Herndler

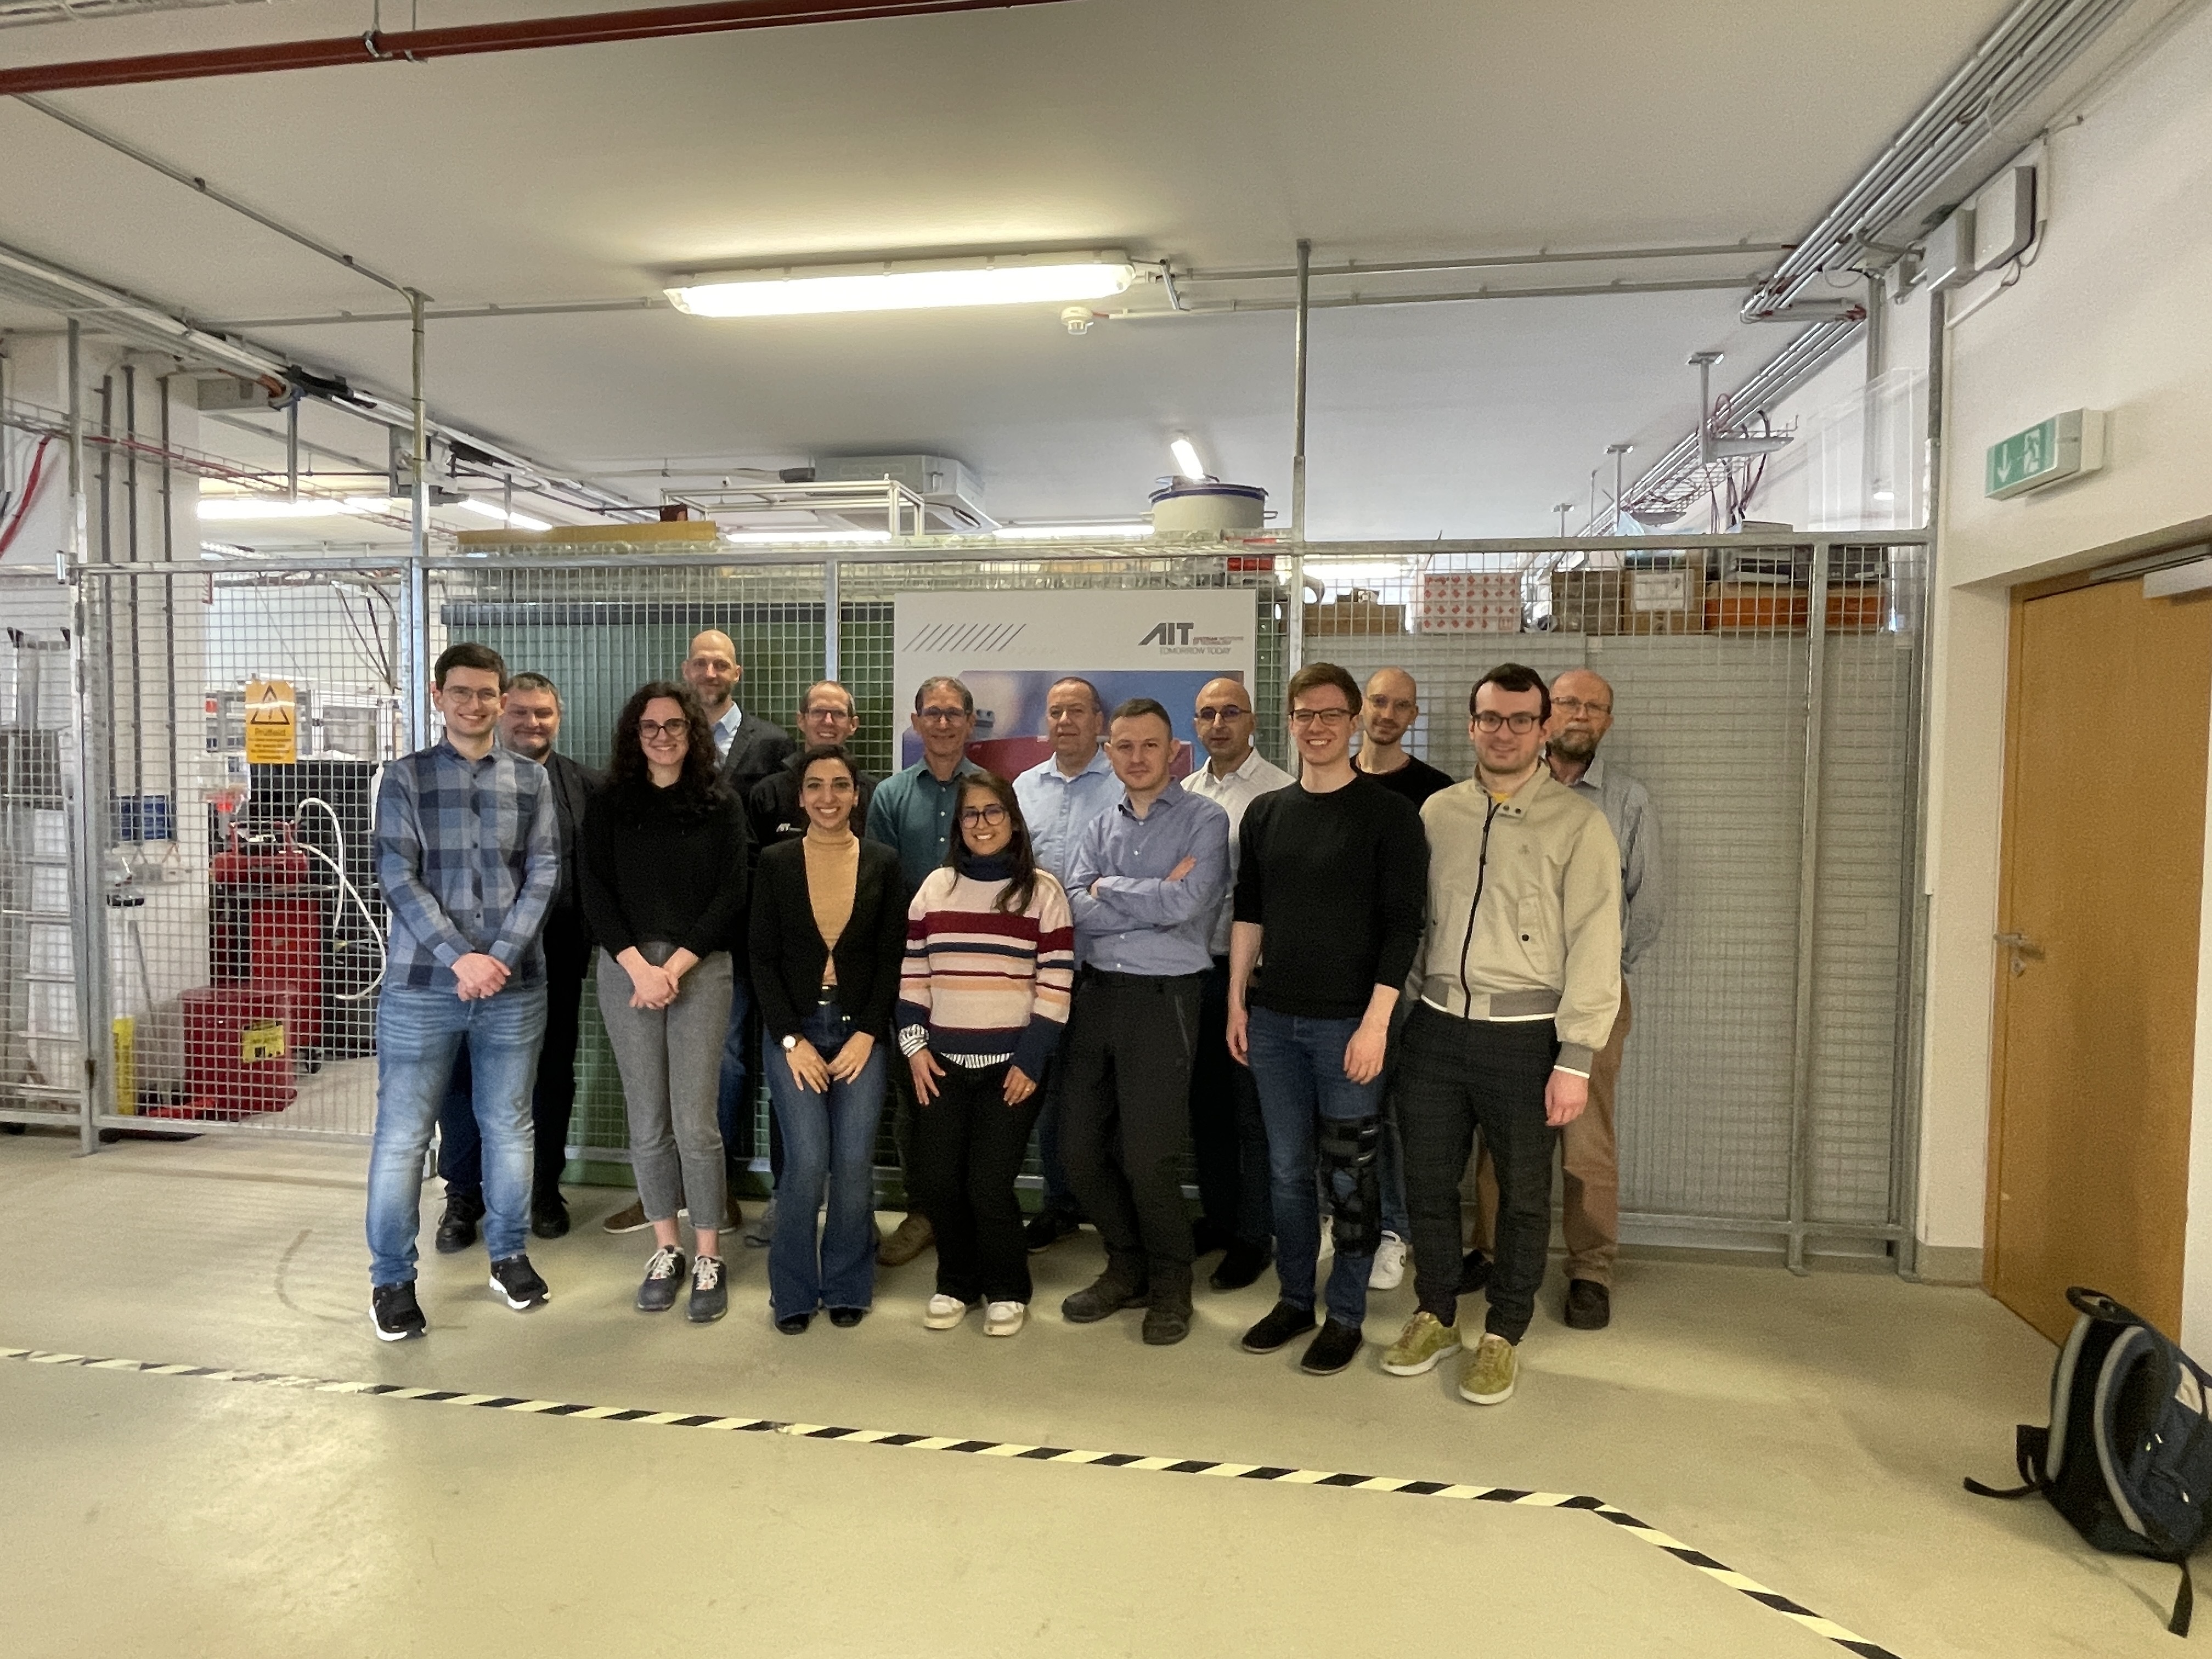
SIRFN-AIT Workshops "Grid-forming converters - testing and validation challenges" - March 2024
International SIRFN experts and participants of the SIRFN-AIT Workshops "Grid-forming converters - testing and validation challenges" visiting the laboratory showcase at the AIT MicroGrid Labor in March 2024.
Copyright: AIT Austrian Institute of Technology
Organisation of the SIRFN network and technical topics in the project period 2021-2023
Overview of the organisation of the SIRFN network: The work programme for Annex 5 approved by the ISGAN Executive Committee (ExCo), the decision-making body within ISGAN, is divided into two sections, one dealing with the dissemination and exchange of knowledge and the other with the implementation of concrete projects for the further development of the research infrastructure.
Copyright: ISGAN-SIRFN
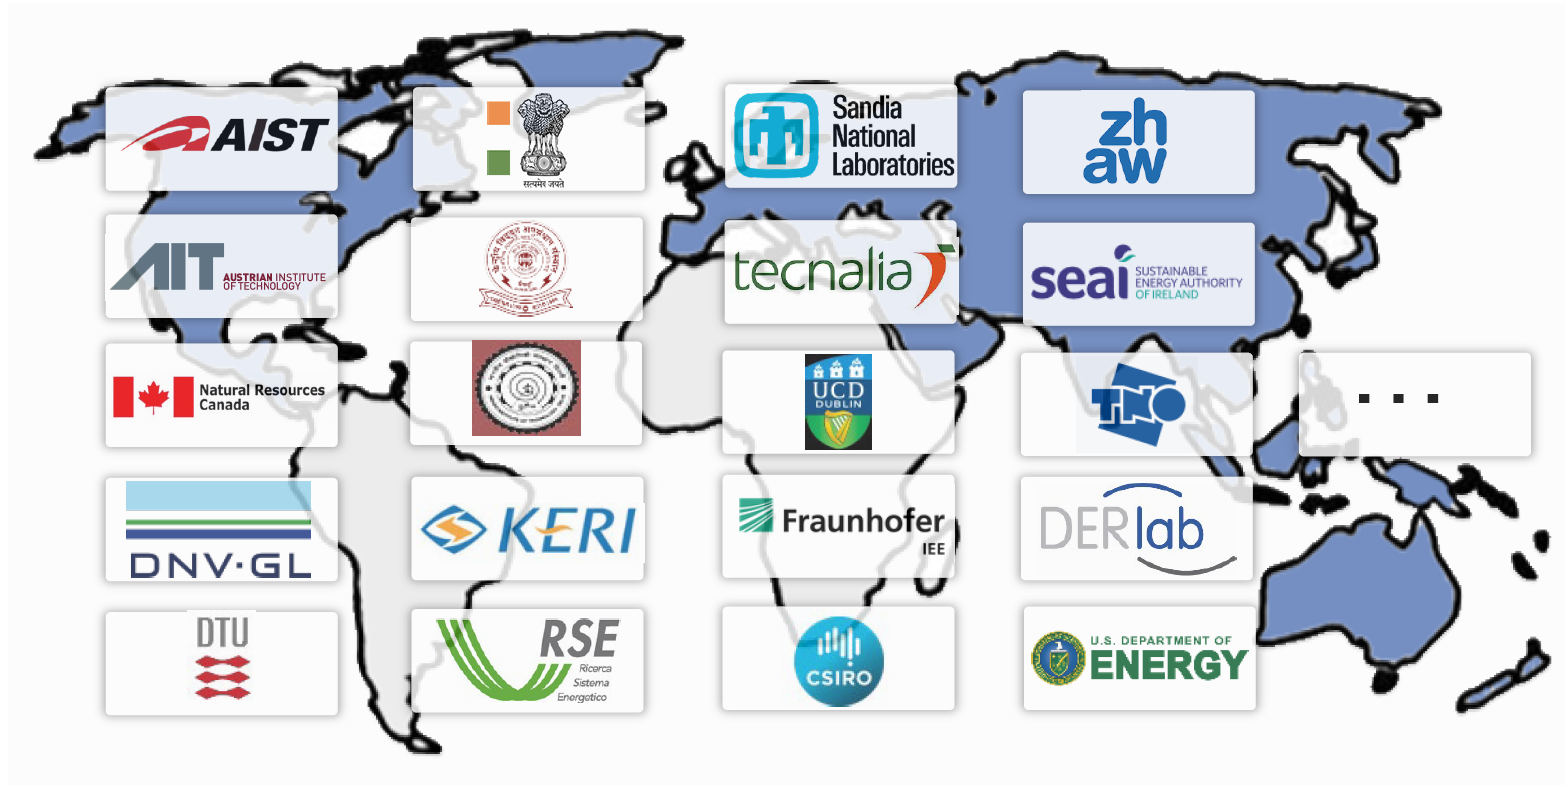
SIRFN member institutions 2024
Overview of the countries and research institutions participating in SIRFN 2024. SIRFN brings together leading research laboratories, academic institutions, industry partners and government organisations from around the world with the aim of promoting collaboration, knowledge exchange and the implementation of joint research projects.
Copyright: ISGAN-SIRFN
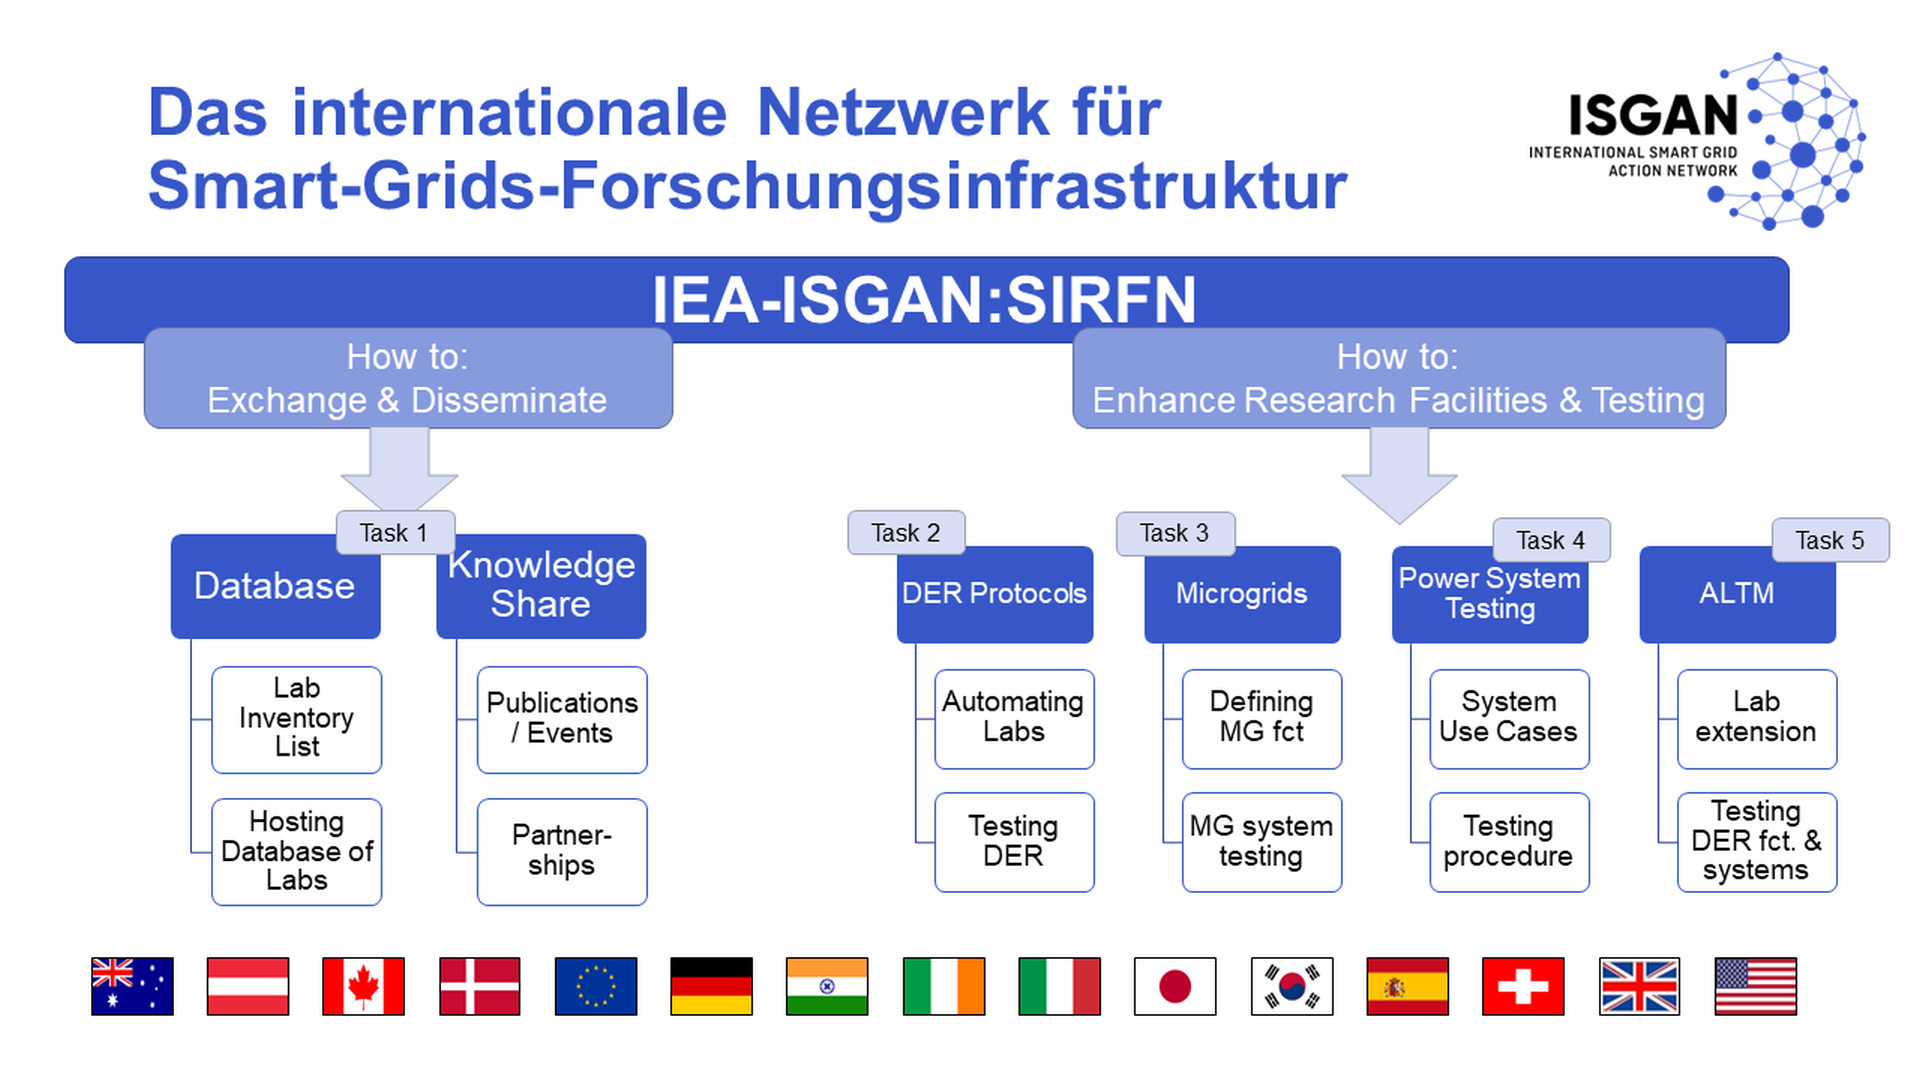
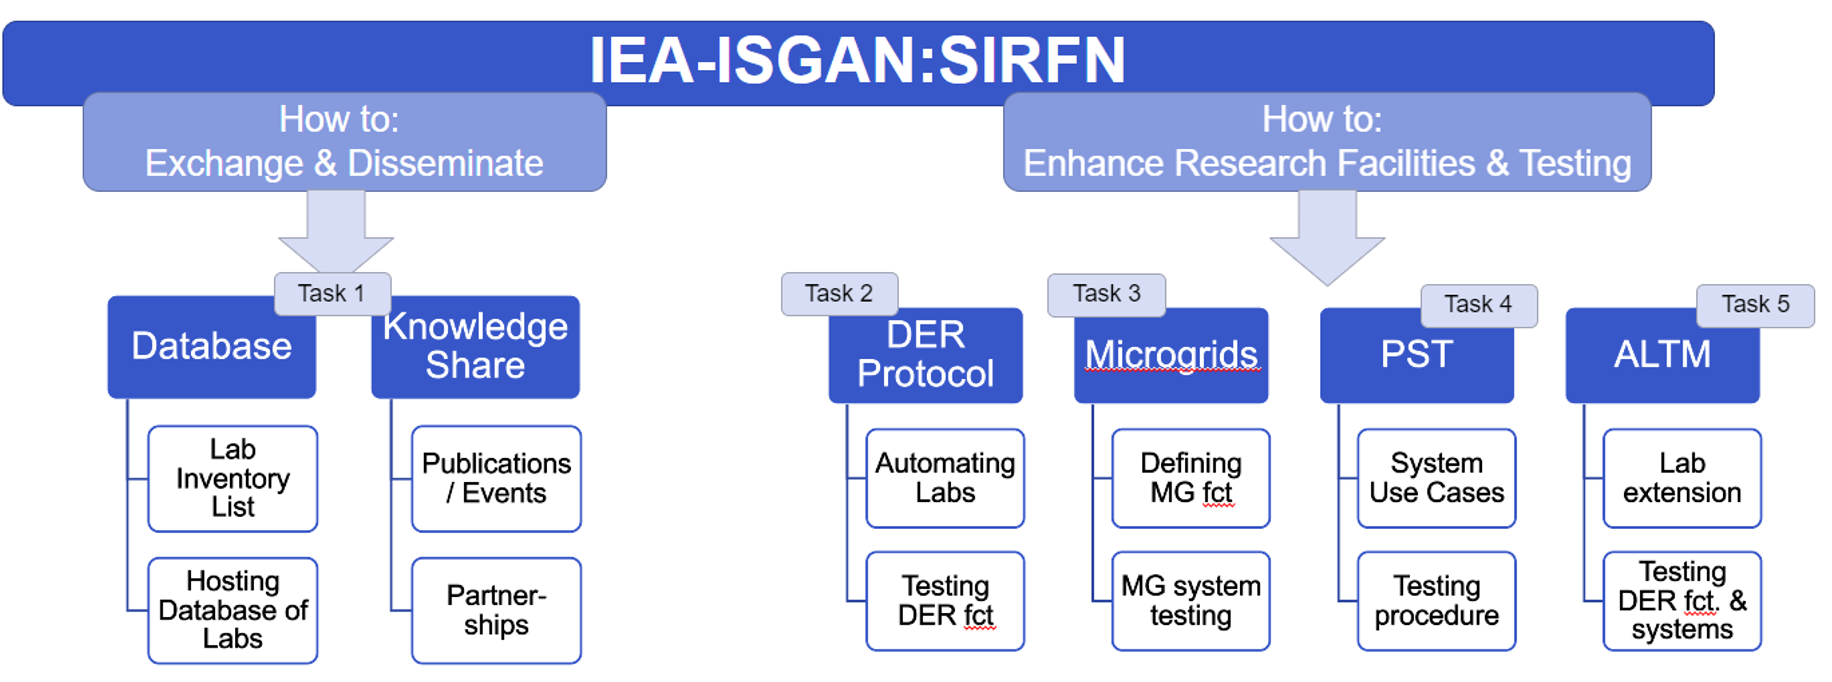
Organisation of the Smart Grids International Research Facility Network (SIRFN)
ISGAN Annex 5 is divided into two sub-areas dealing with the dissemination and exchange of knowledge on the one hand and the implementation of concrete projects for the further development of the research infrastructure on the other. The work is organised in the following main focus areas : - DER test protocols - Microgrids - Power System Testing - Advanced laboratory testing methods
Copyright: ISGAN Annex 5 SIRFN
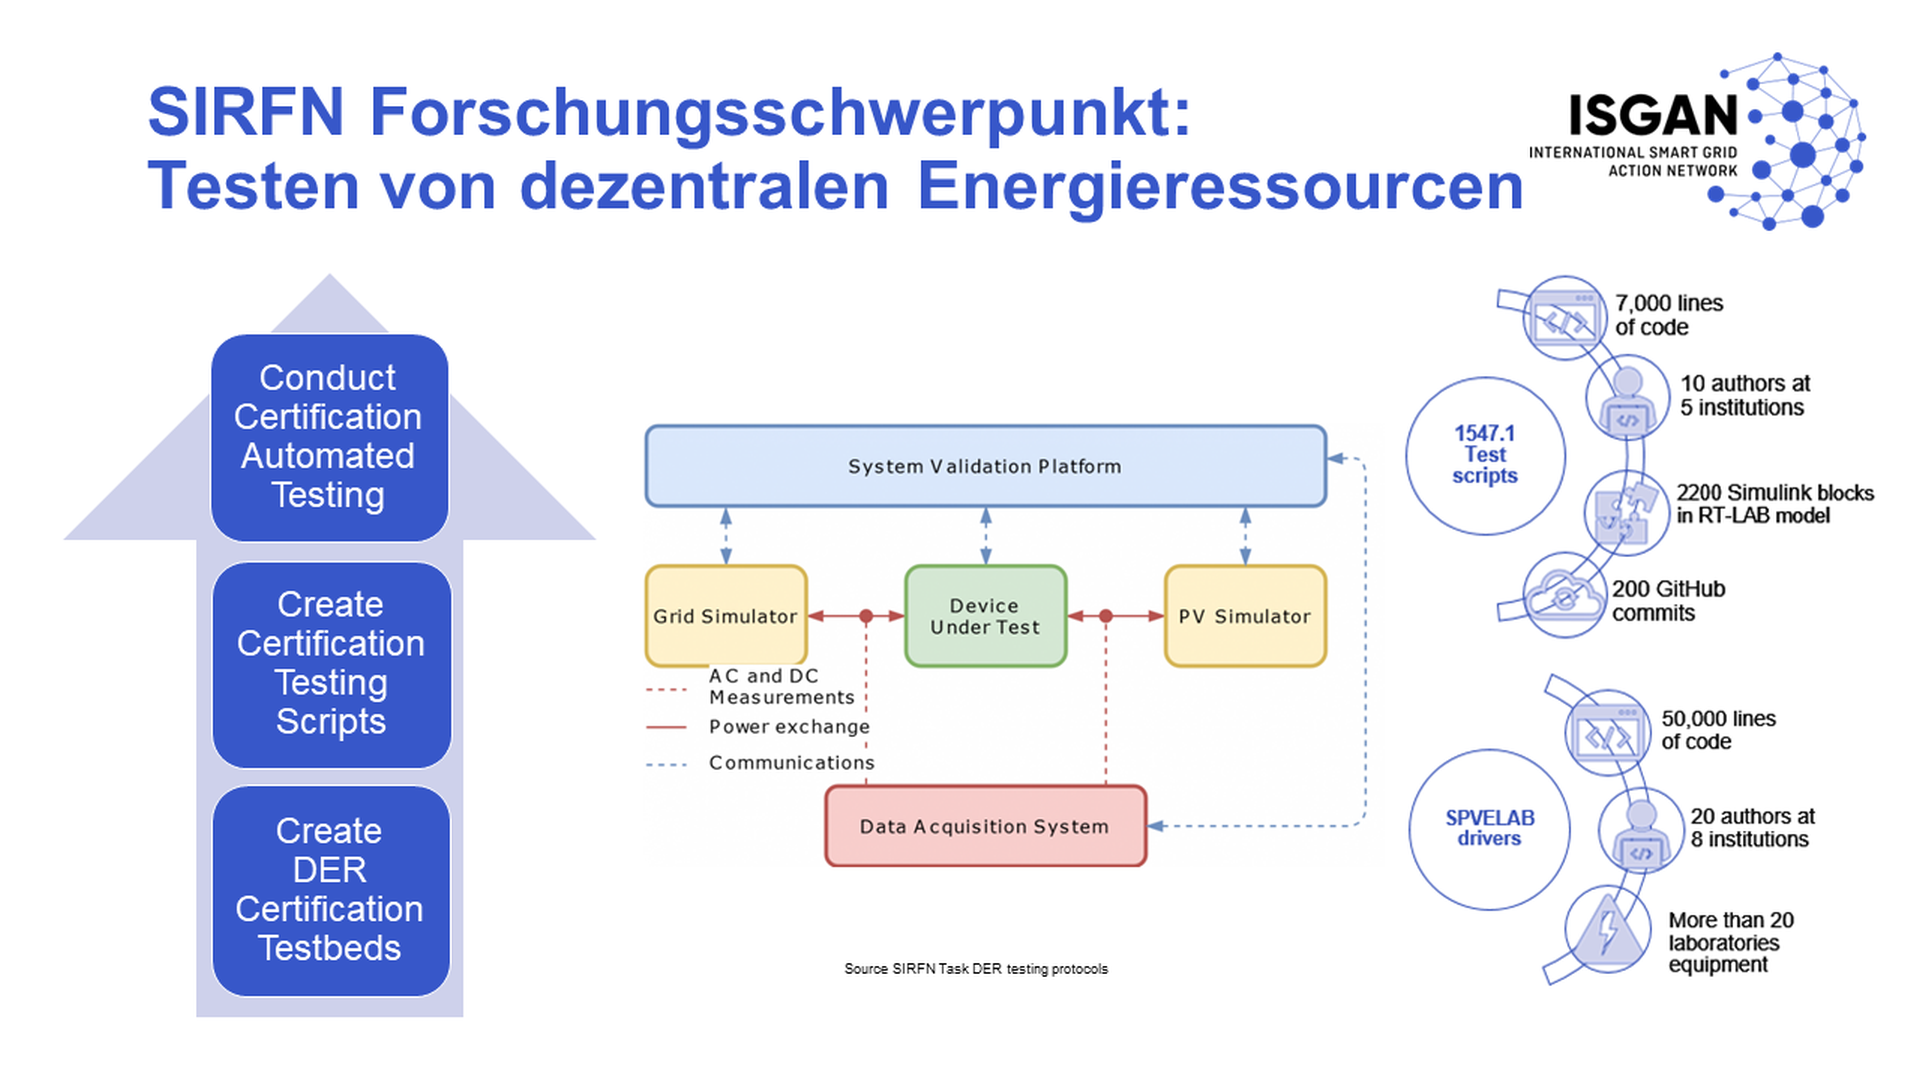
SIRFN Focus Area: DER testing protocols
As part of the SIRFN focus are, SIRFN laboratories are developing test protocols for validating the interoperability of distributed energy resources, which can be used in an integrated test platform (System Validation Platform), for implementing a harmonised, international certification standard for all distributed energy resources in the power grids.