Project Image Pool
There are 199 results.
Terms of use: The pictures on this site originate from the projects in the frame of the programmes City of Tomorrow, Building of Tomorrow and the IEA Research Cooperation. They may be used credited for non-commercial purposes under the Creative Commons License Attribution-NonCommercial (CC BY-NC).
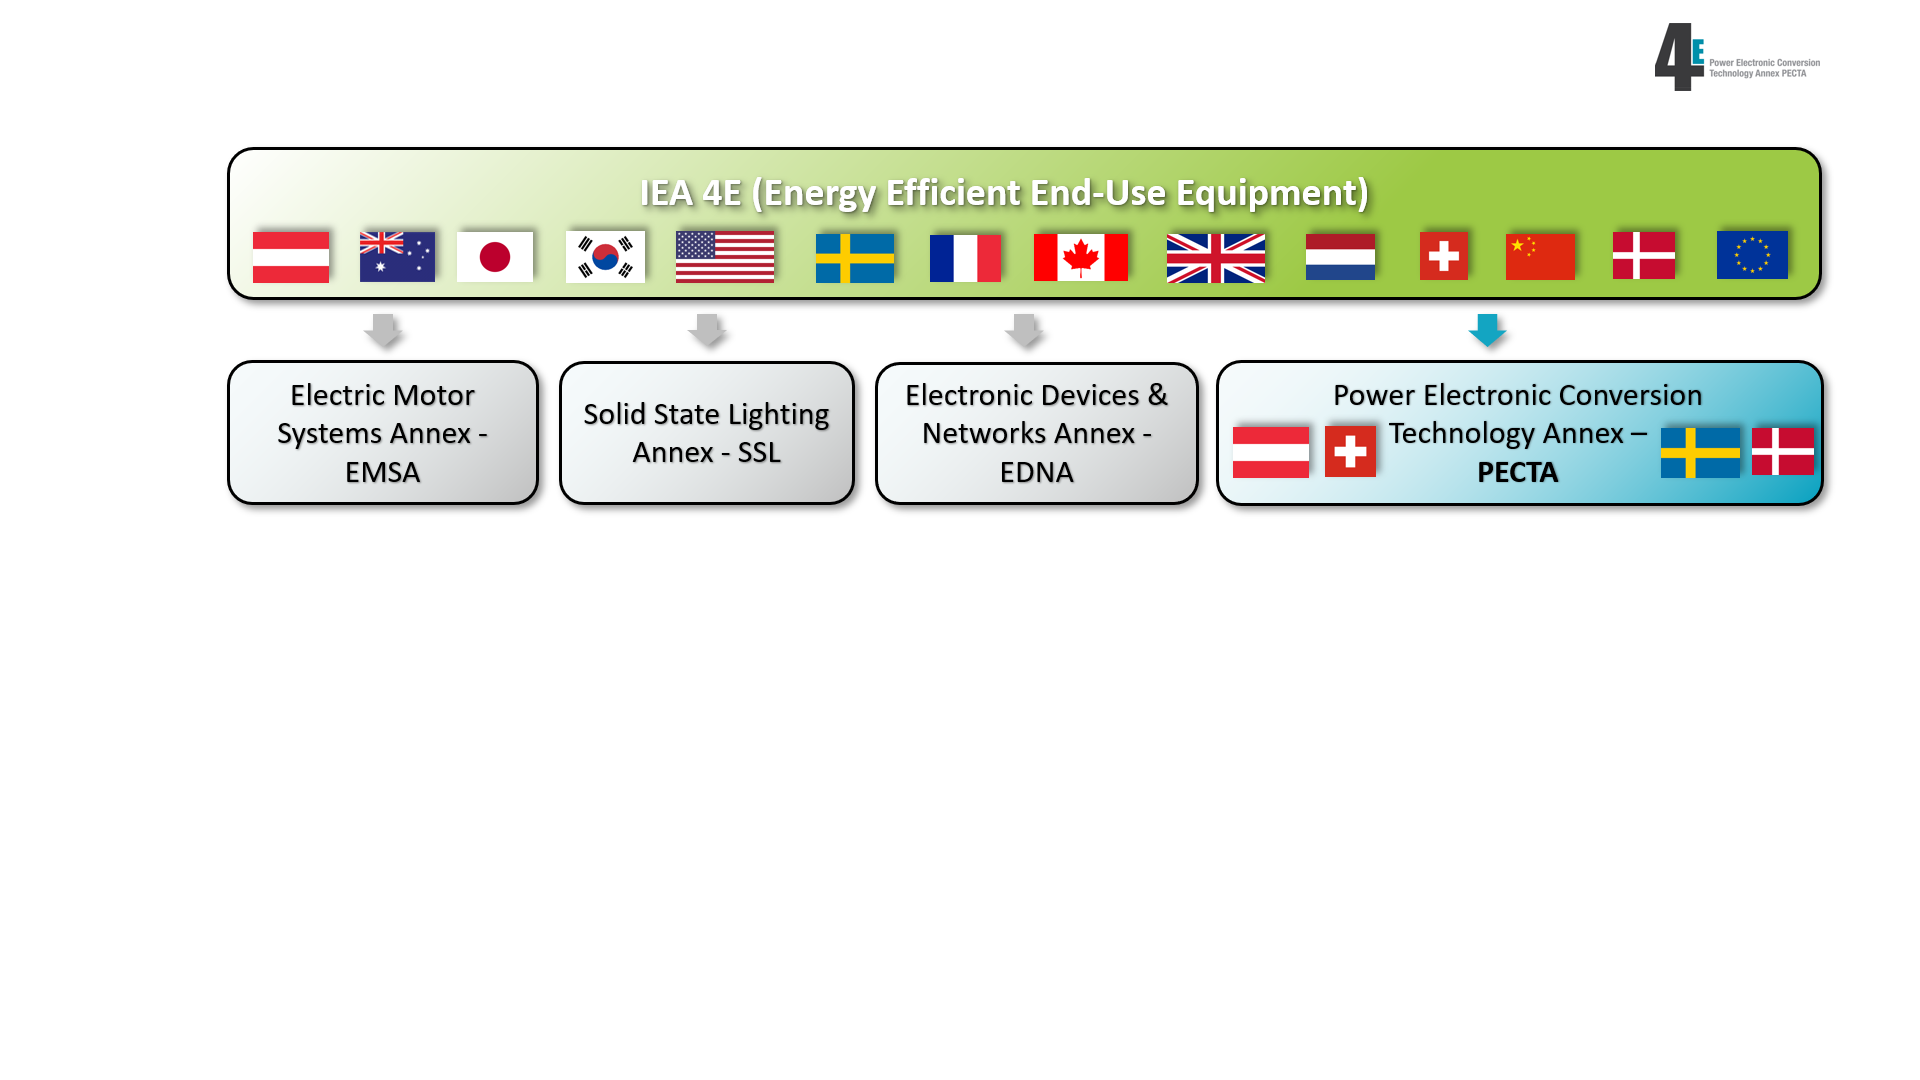
Integration of PECTA within the 4E technology program
Since March 2019, the 4E Technology Program consists of 4 different Annexes: EMSA (Electric Motor Systems Annex), SSL (Solid State Lighting Annex), EDNA (Electronic Devices & Networks Annex) and PECTA (Power Electronic Conversion Technology Annex).
Copyright: 4E PECTA
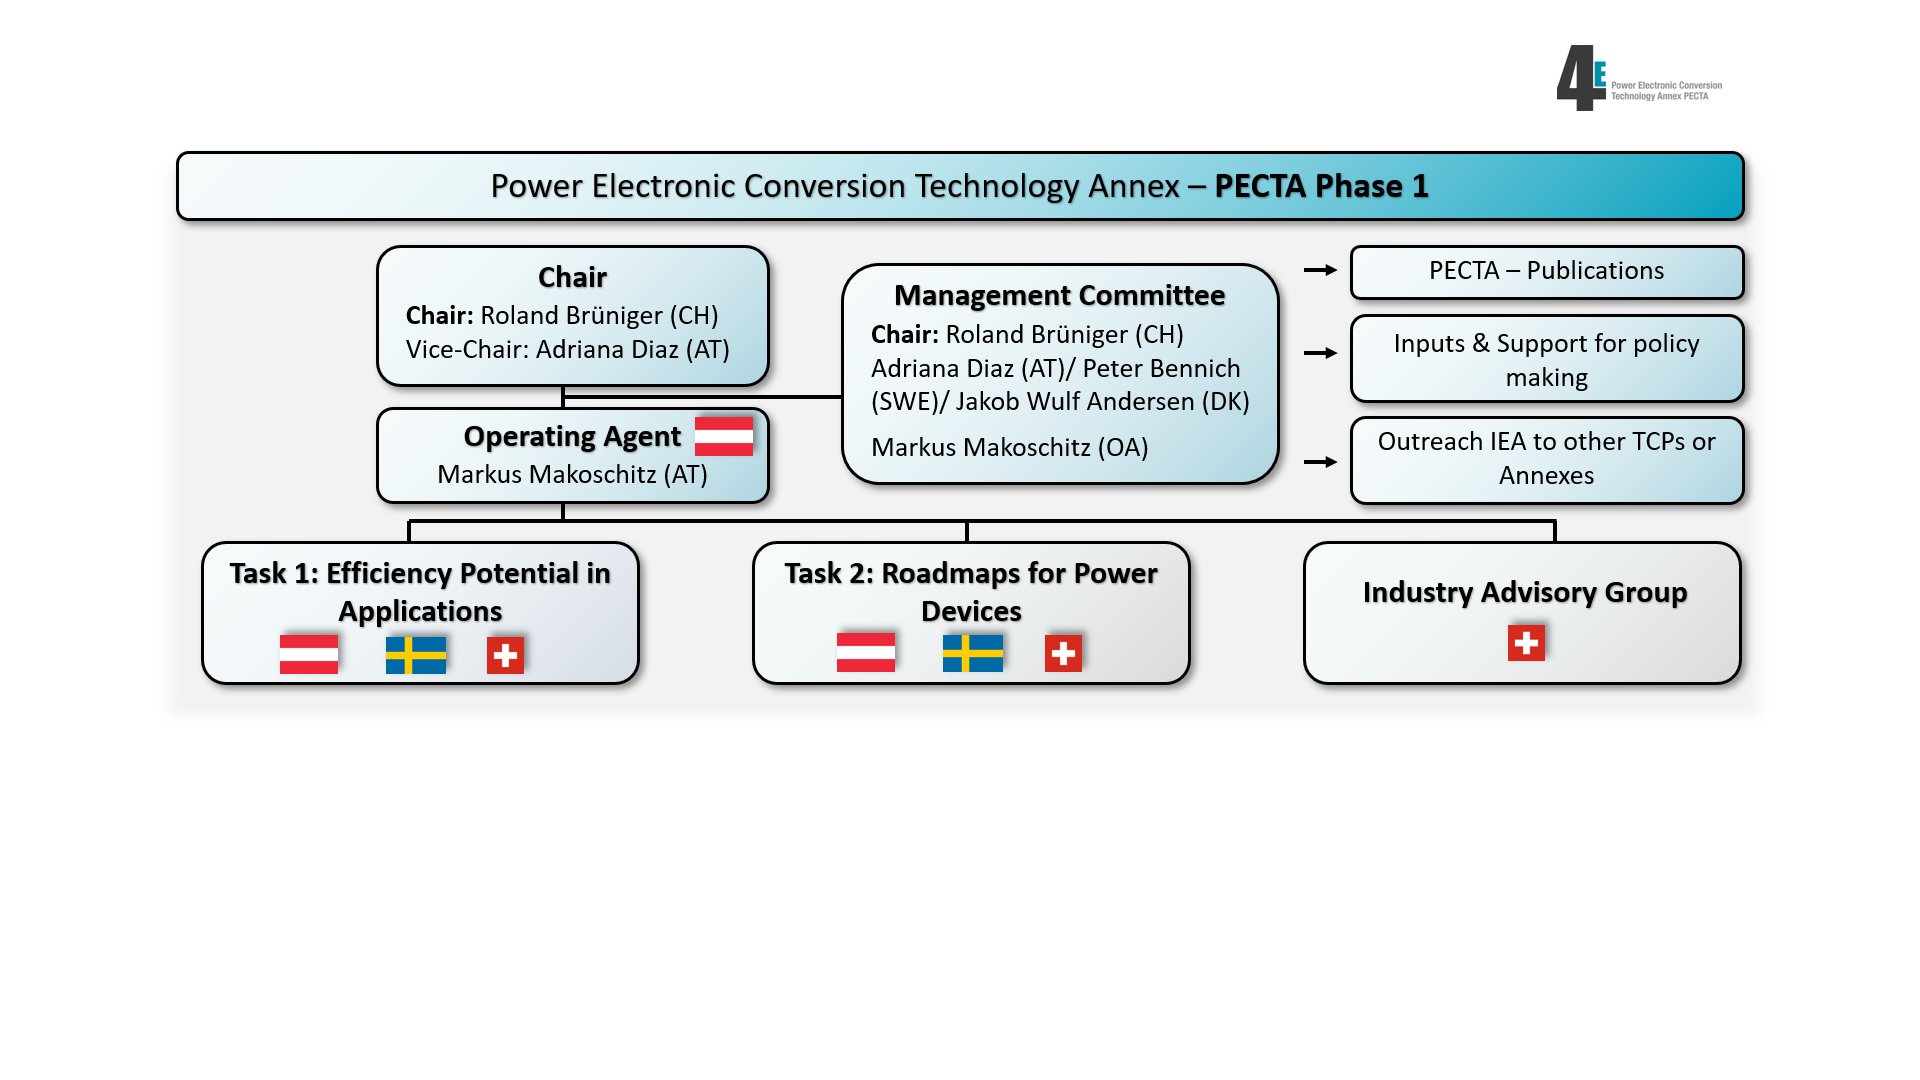
Structure of PECTA during Phase 1
In the course of PECTA's Phase 1, two tasks were processed. Task 1: Efficiency Potential in Applications. Task 2: Roadmaps for Power Devices. The position of the Operating Agent was filled by Austria. Task 1 and Task 2 were carried out with participation from Austria, Sweden and Switzerland. The Industry Advisory Group is coordinated by Switzerland.
Copyright: 4E PECTA
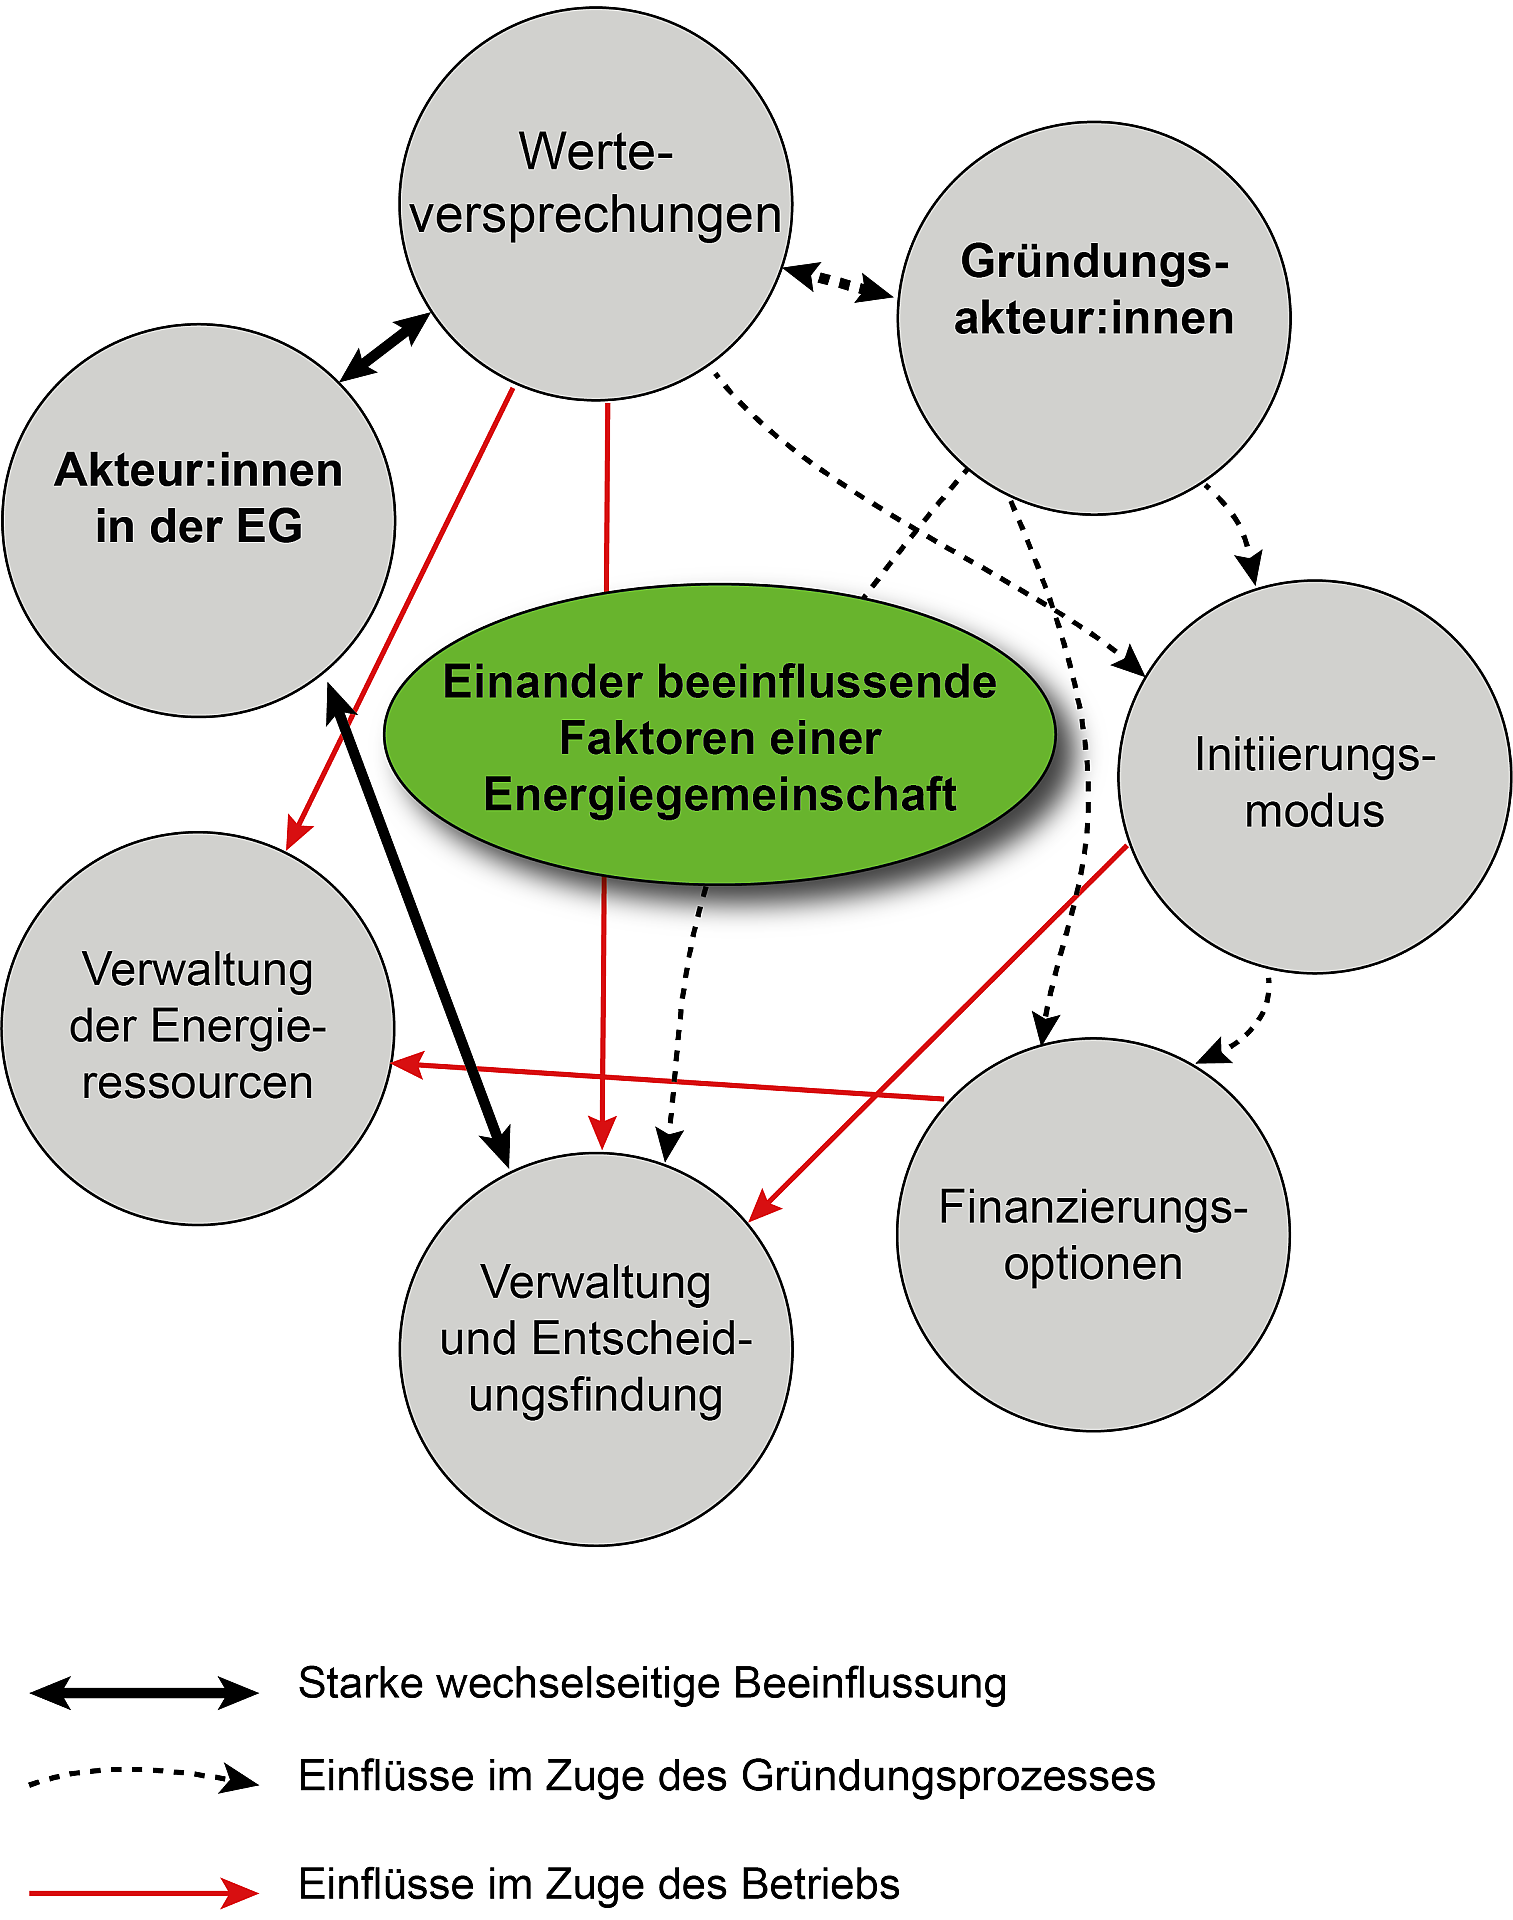
Central Characteristics of Energy Communities and Their Interactions
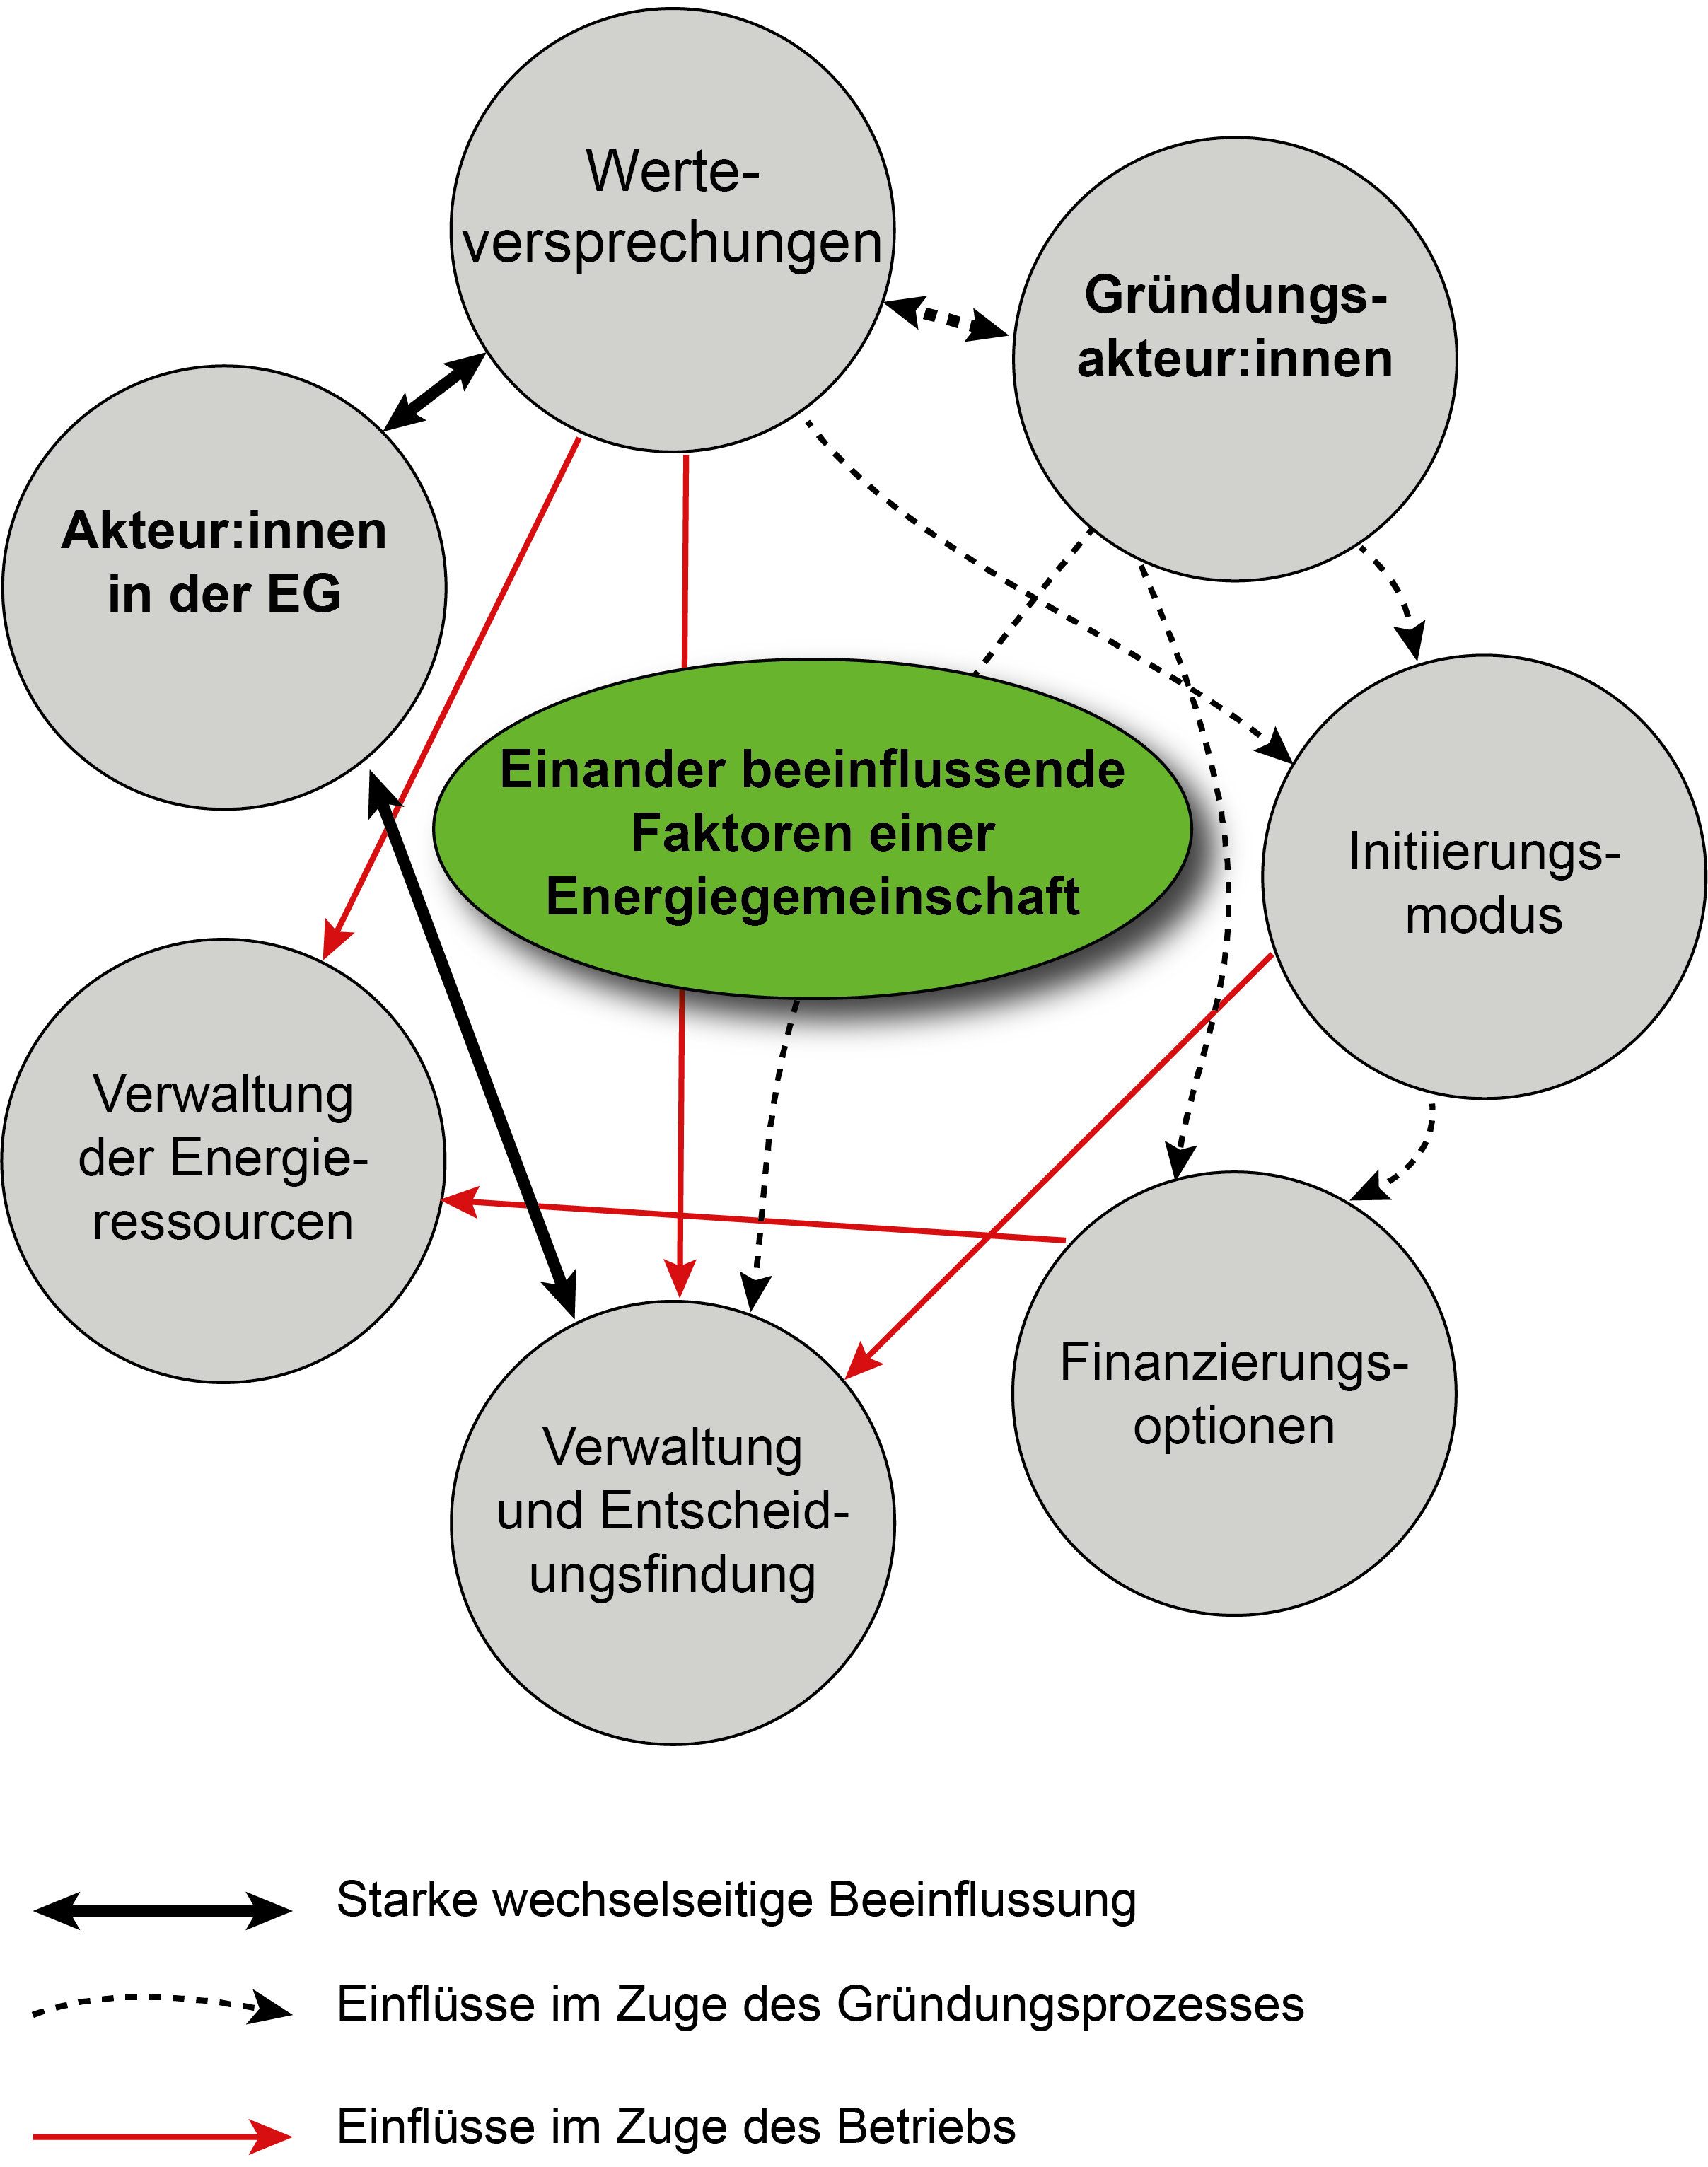
Representation of the central characteristics of energy communities (ECs) and their interrelationships. A strong mutual influence is found between the actors of the EC and the management and decision-making processes, as well as between the actors and value propositions. Influences during the founding process occur between value propositions and founding actors, value propositions and the initiation mode, and founding actors on the initiation mode, funding options, and management and decision-making. Operational influences include the impact of value propositions on the management of energy resources and general management and decision-making, as well as the influence of the initiation mode on management and decision-making, and of funding options on the management of energy resources.
Copyright: SLA2.0
Analysis of Gender and Diversity Factors in Relation to Energy Consumption Flexibility
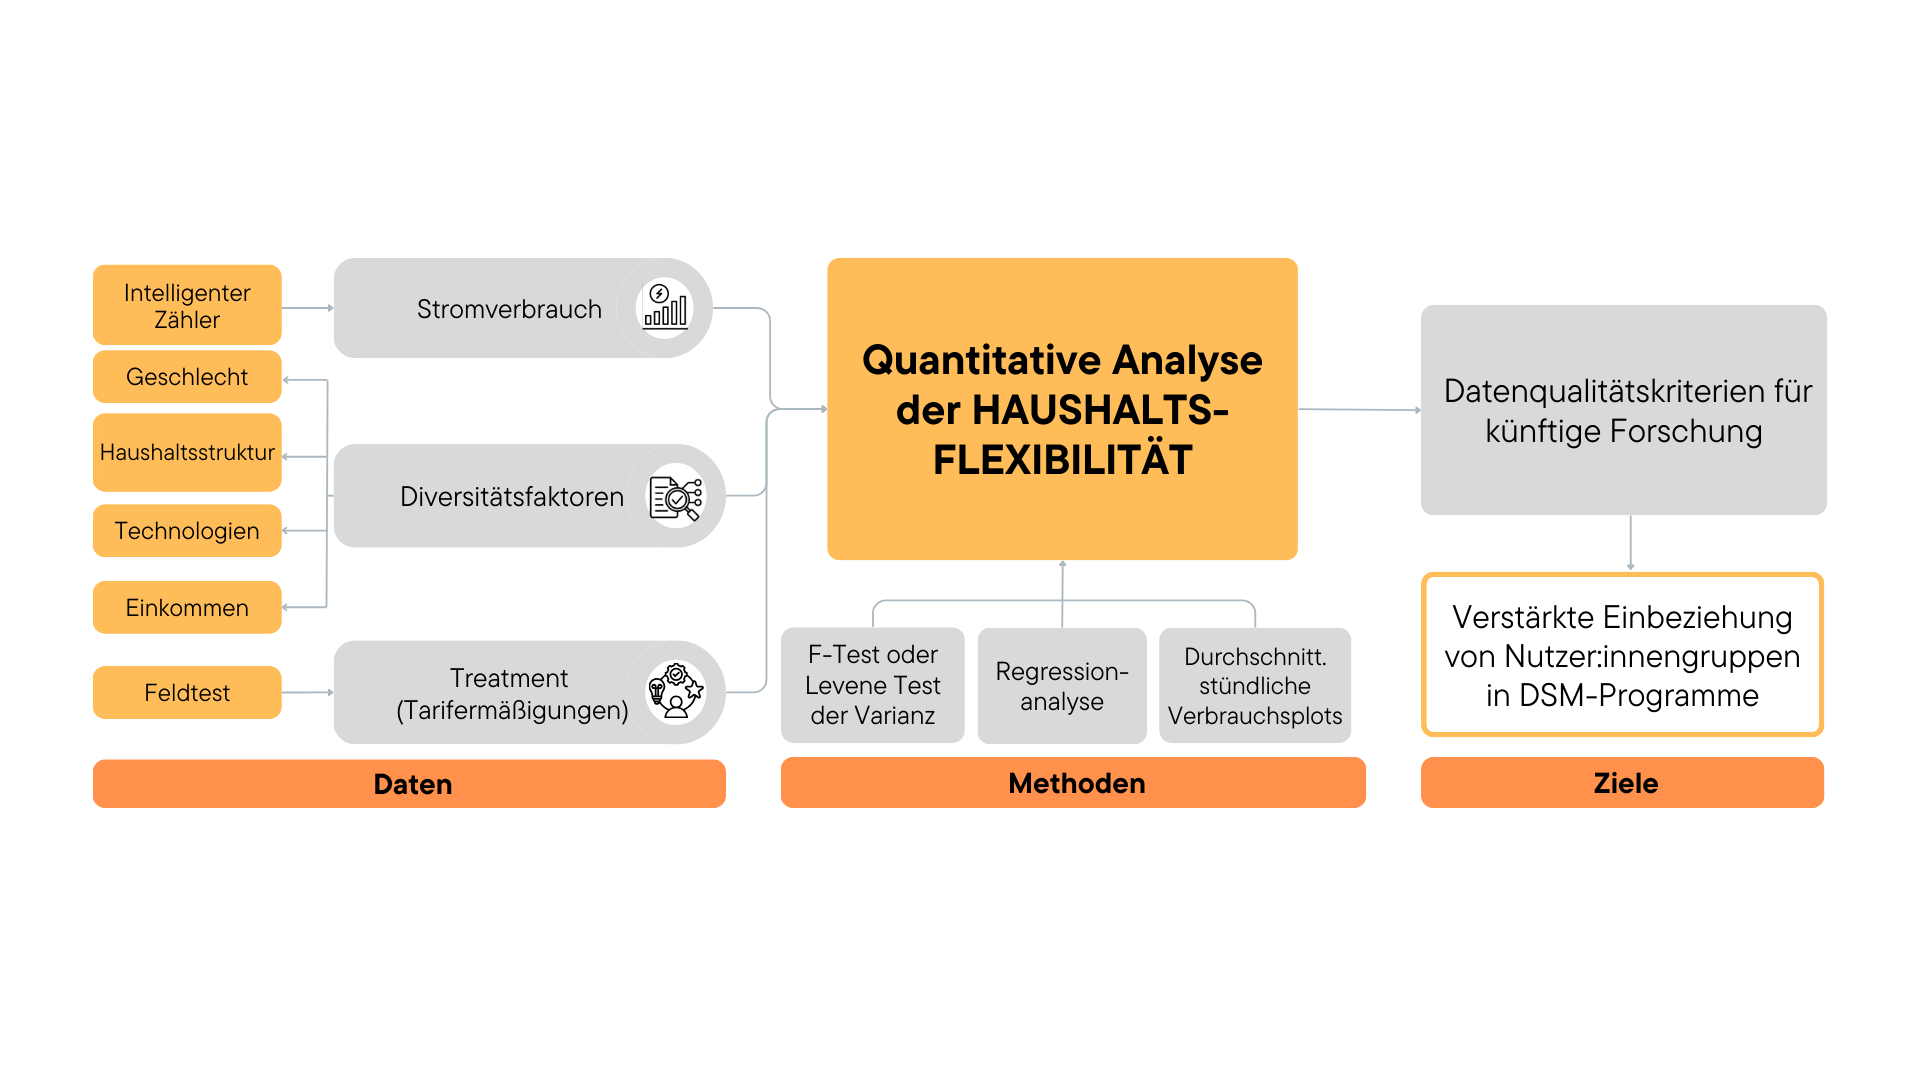
The graphic provides an overview of the approach to the quantitative analysis of household flexibility and the conclusions derived from it. Electricity consumption, recorded via smart meters, was combined with diversity dimensions and associated aspects such as gender, household structure, income, and available technologies. Treatments implemented during field tests, such as tariff reductions for peak load reductions, were documented in the dataset. Quantitative methods, including F-tests or Levene's test for variance, regression analysis, and plots of average consumption, were used to gain insights into consumption patterns and identify diversity-specific differences. Building on these findings, data quality criteria for future research were formulated, and a stronger inclusion of diverse user groups in demand-side management (DSM) programs was recommended.
Copyright: SLA2.0
Methods
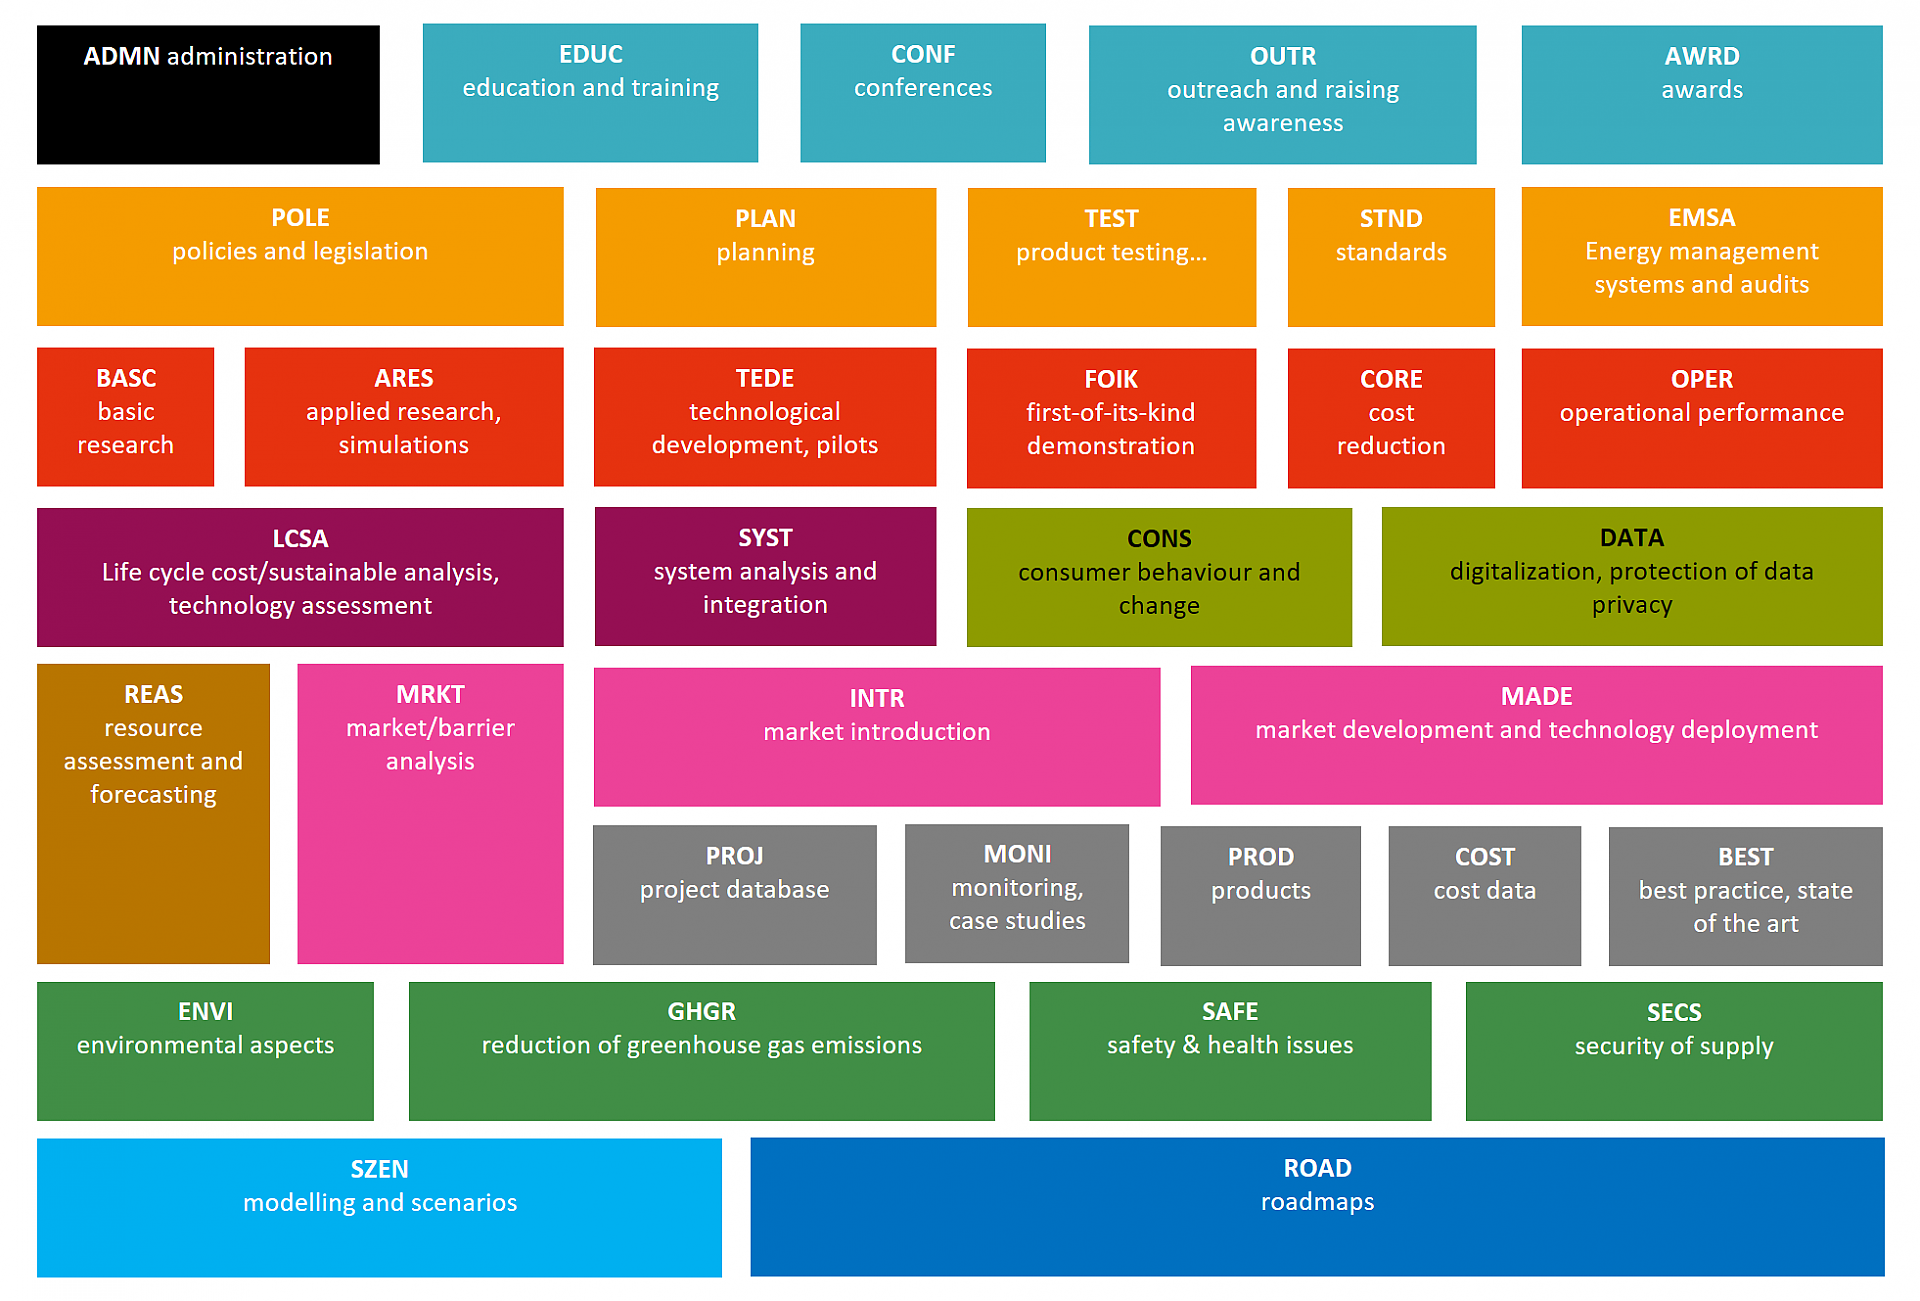
Set of methods to classify the type of activity of TCP Tasks and Annexes.
Copyright: Austrian Energy Agency
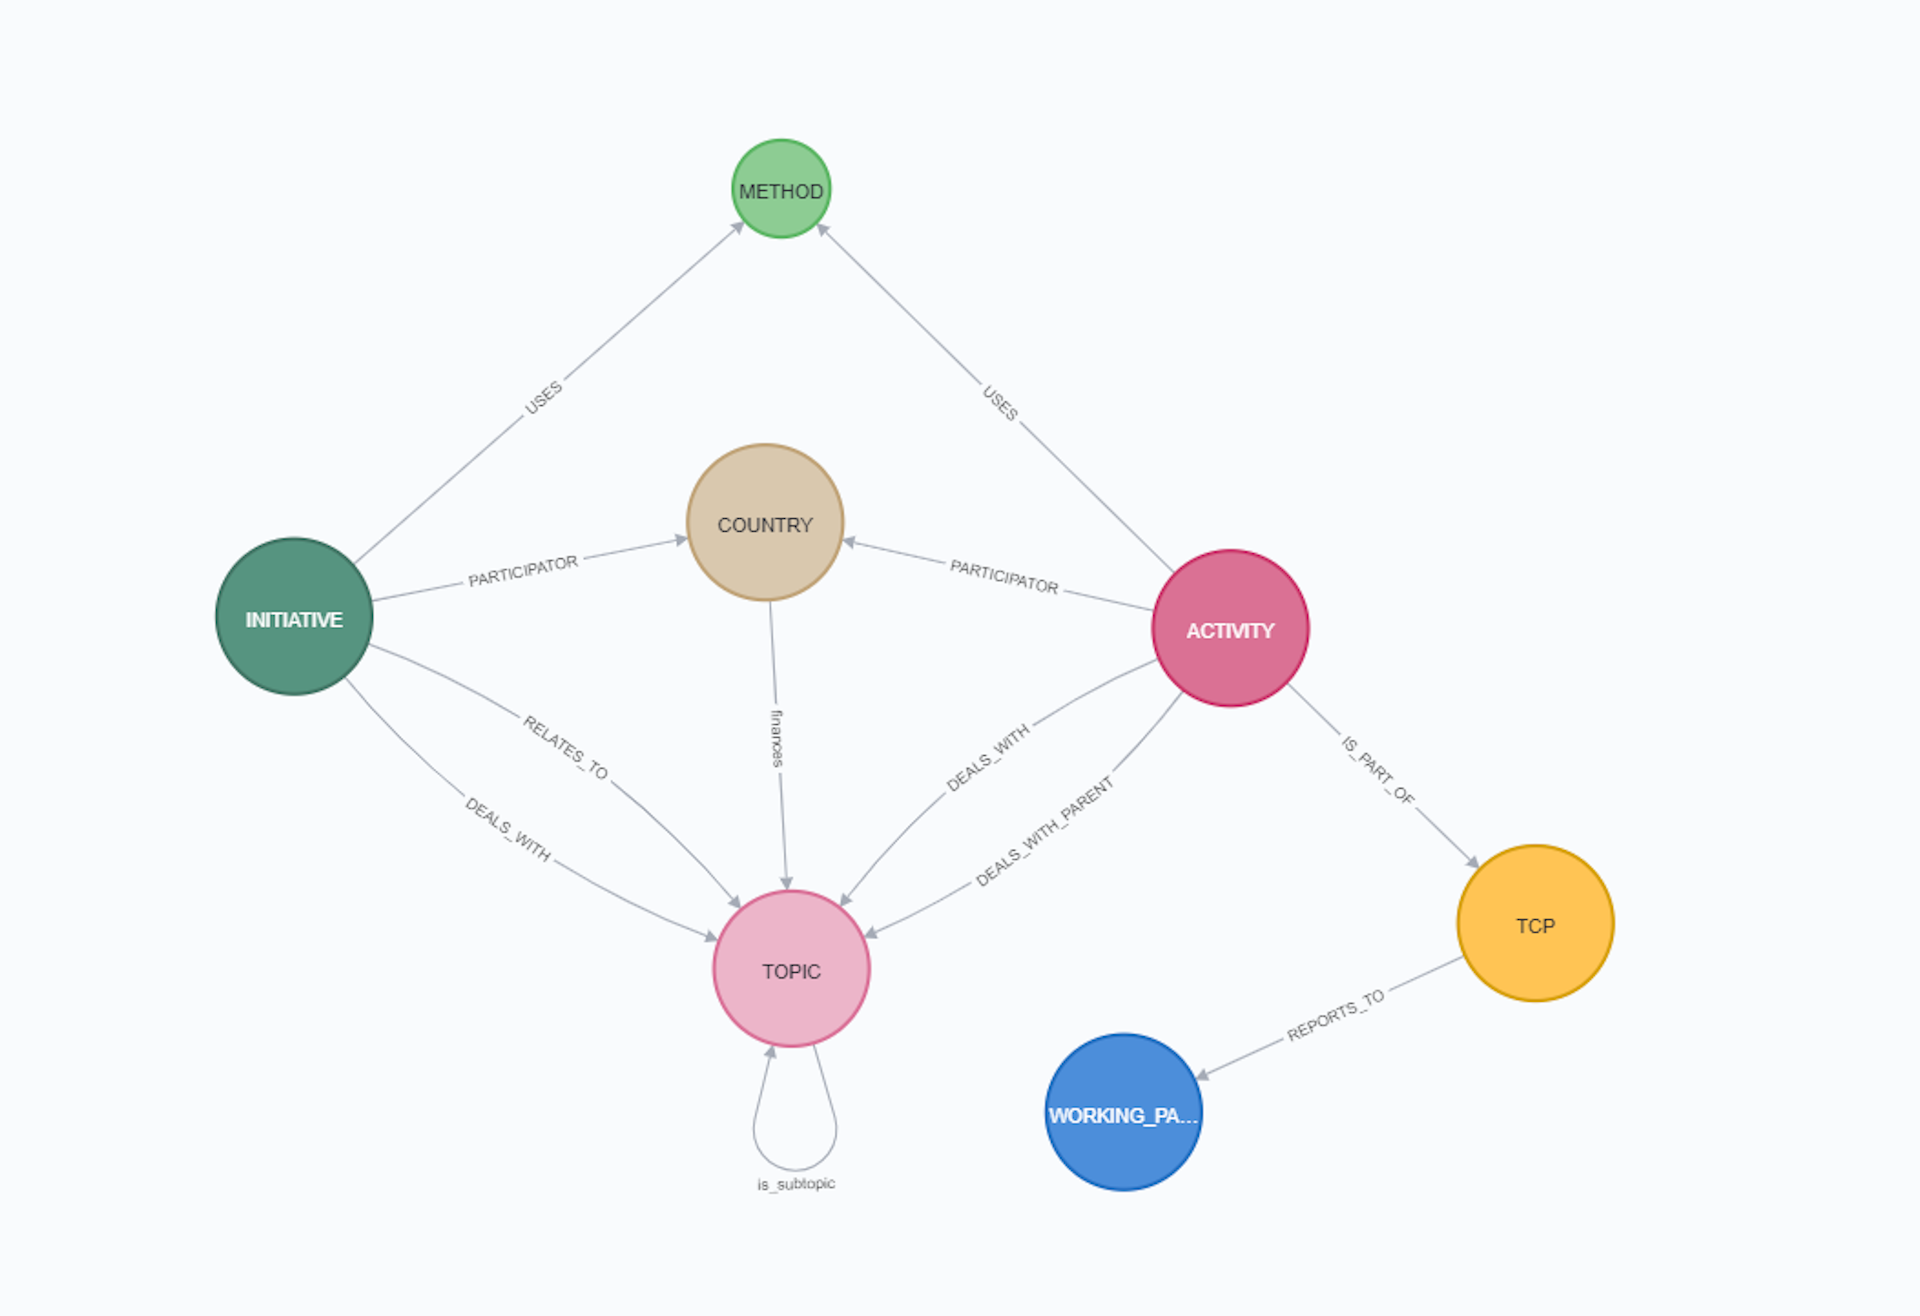
Graph Datastructure
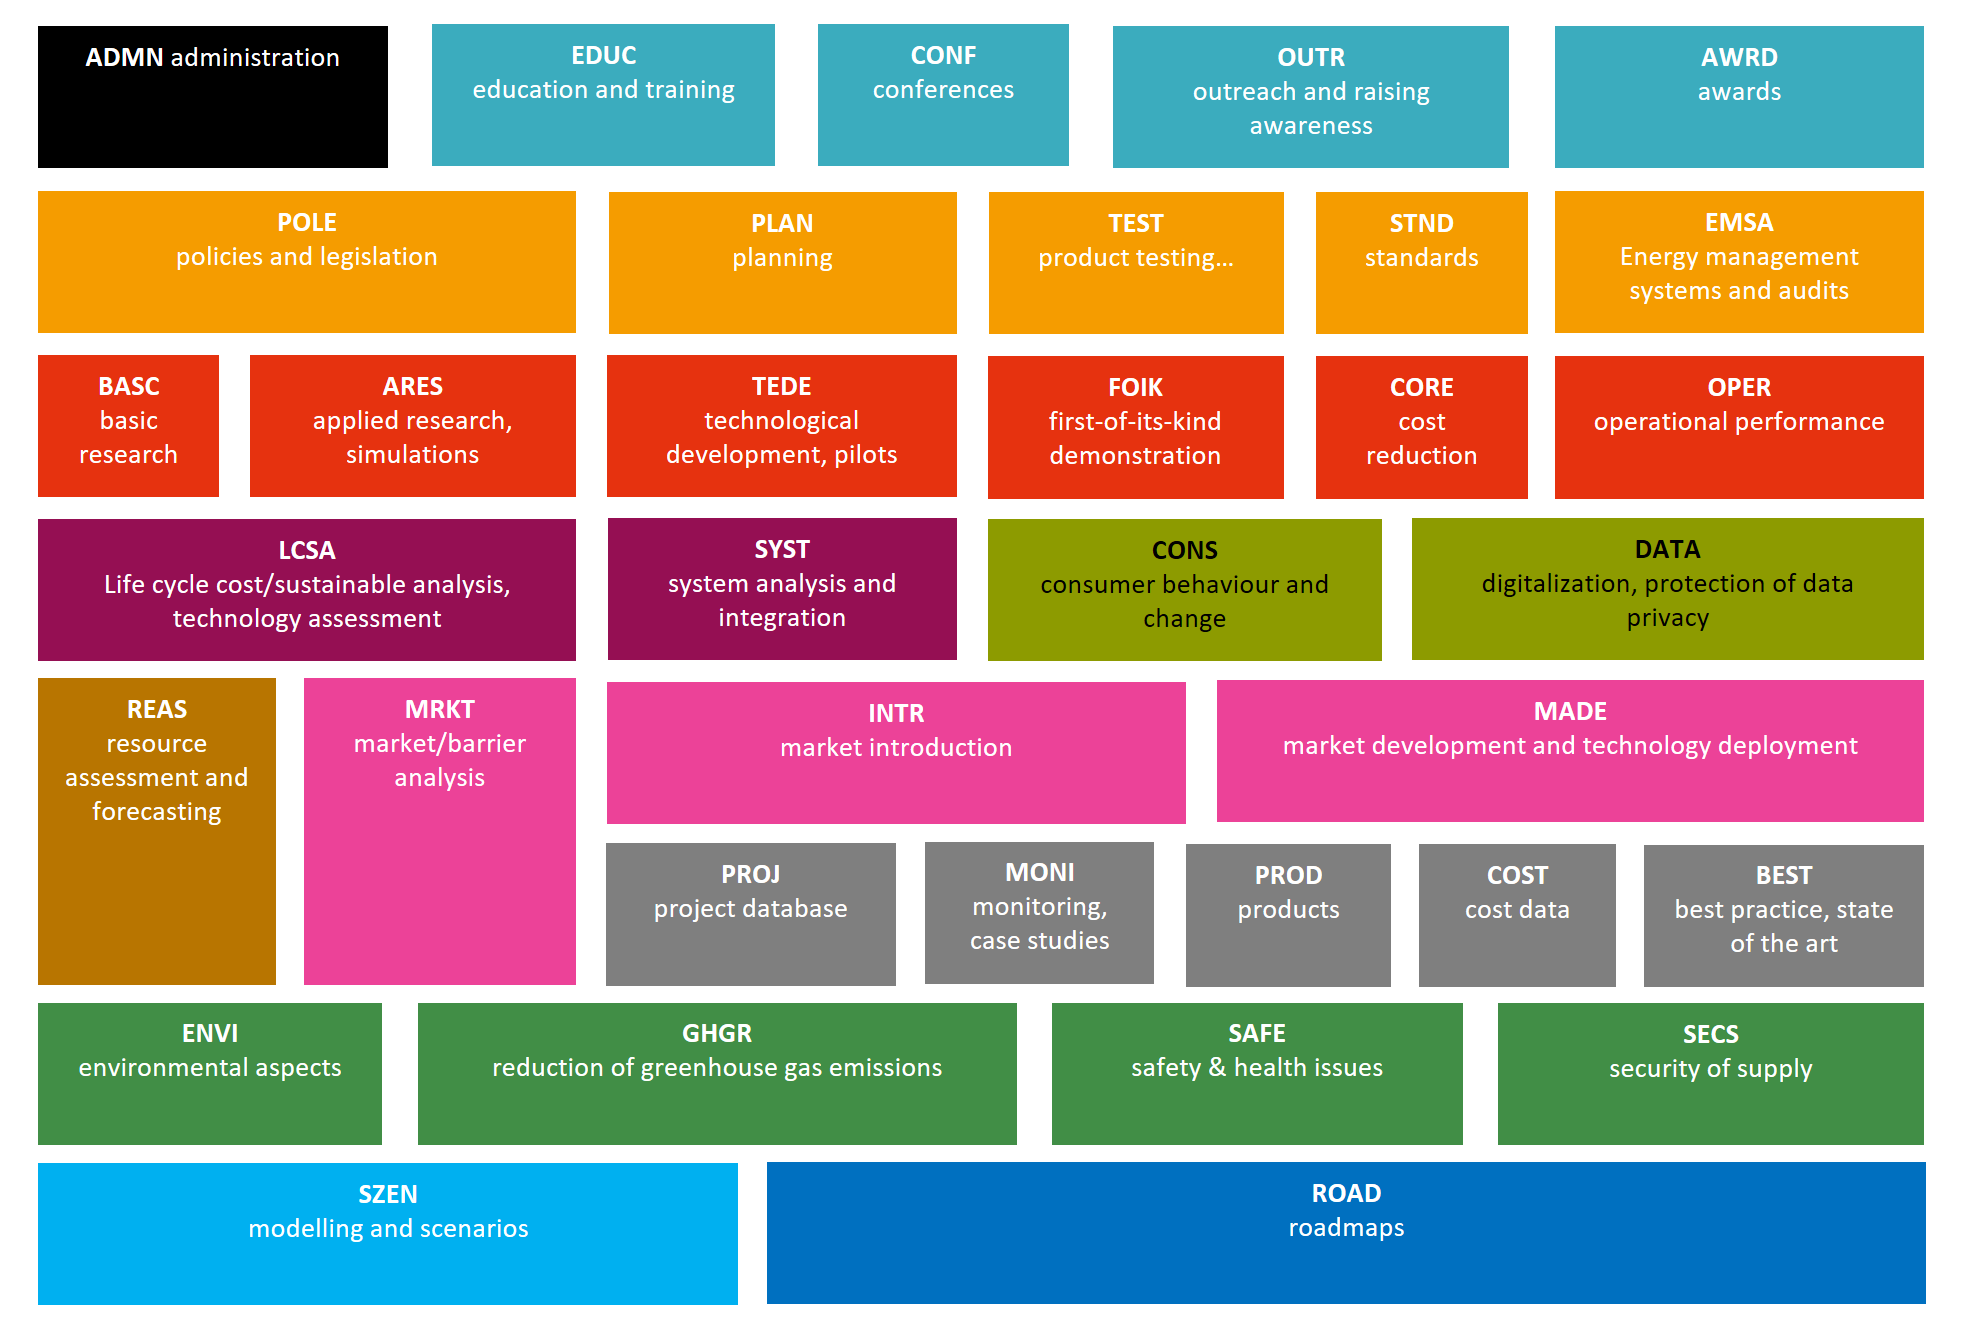
Graphbased datastructure of the open access IEA-TCP dataset.
Copyright: Austrian Energy Agency
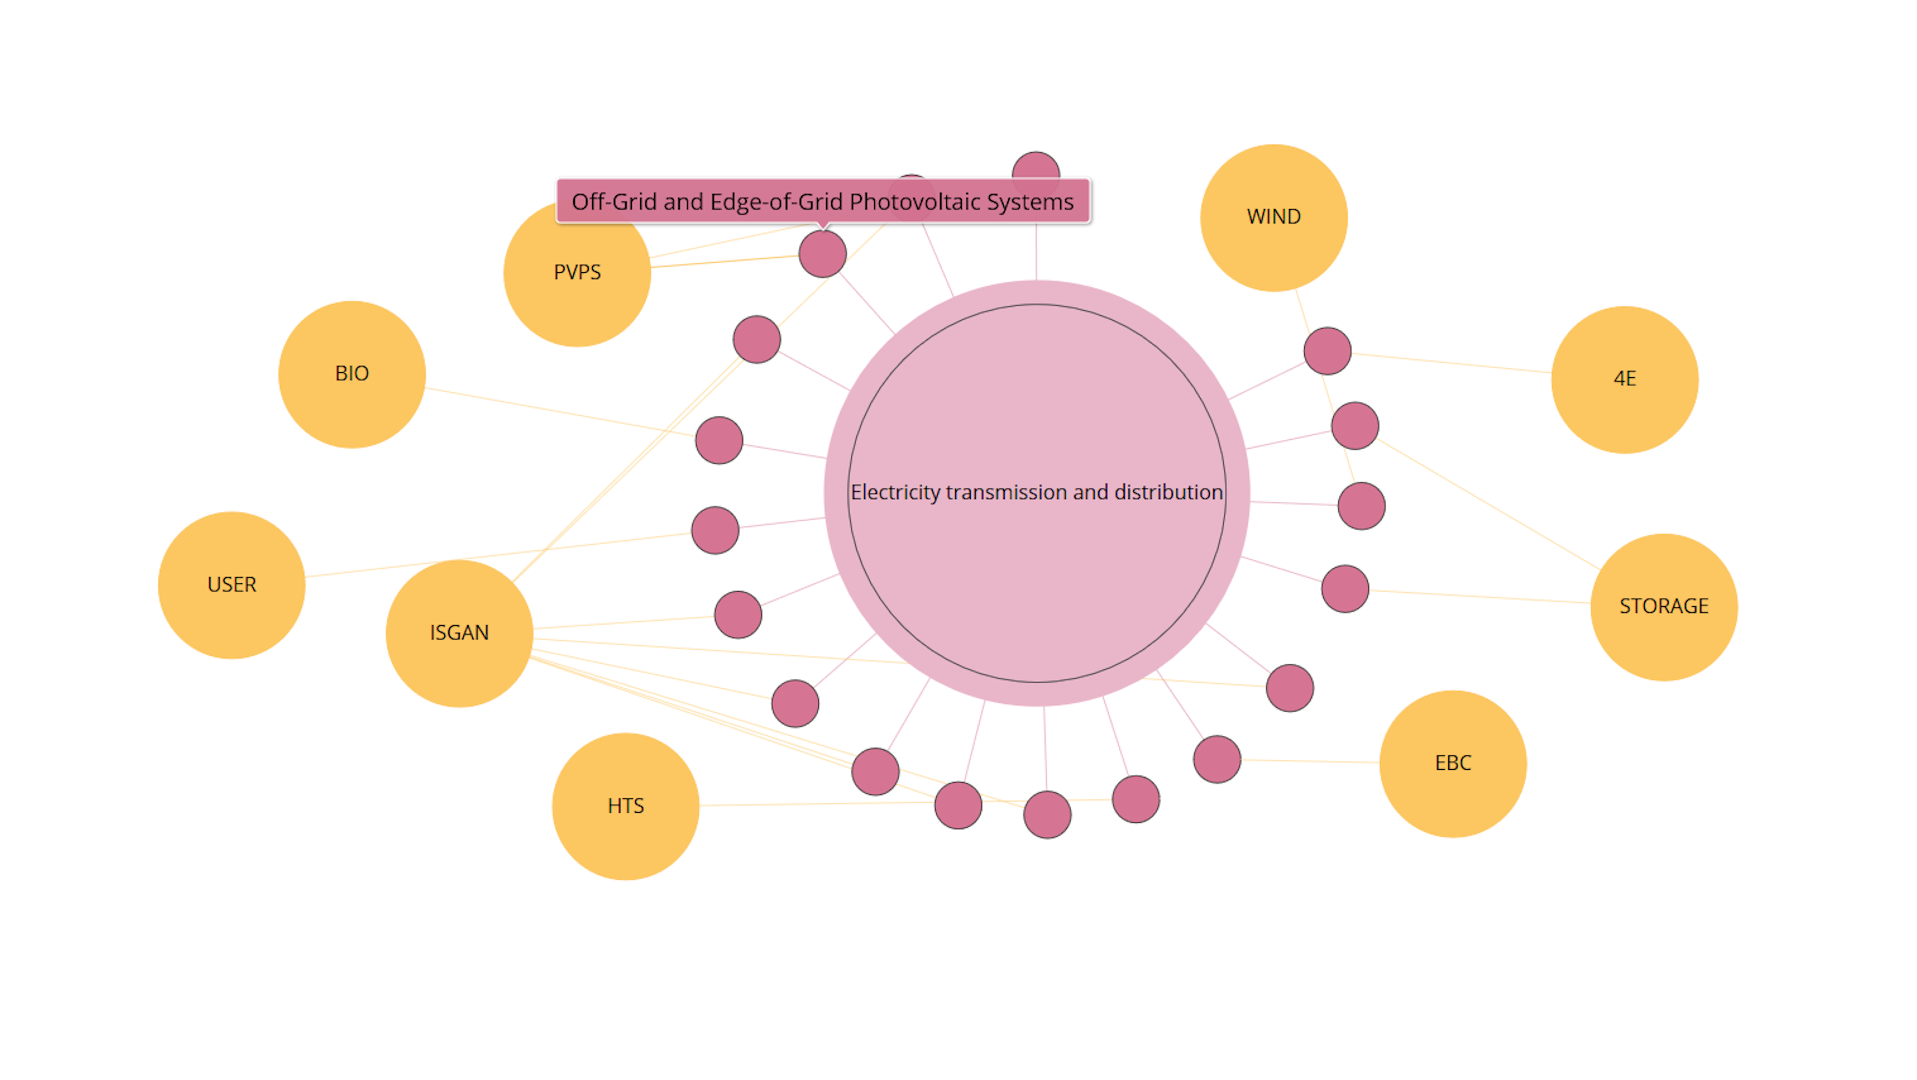
Visualisation of TCPs
After selecting a topic (in this example "Electricity transmission and distribution" was selected), this graph shows all tasks (activities) focussing on the selected topic. The topics are structured according to the IEA energy RD&D budget/expenditure statistics. Additionally, you can see the related Technology Collaboration Programmes (TCPs). Activities which had been ongoing in Summer 2020 from all IEA-TCPs are covered in this analysis. You can re-arrange the different bubbles to better meet the needs of your analysis. If a TCP consists of more than one task (activity), it also contains one entry in the database labelled “ExCo-Activities”. Available at https://nachhaltigwirtschaften.at/en/iea/visualisations/tcps-focussing-on-a-topic.php
Copyright: Austrian Energy Agency
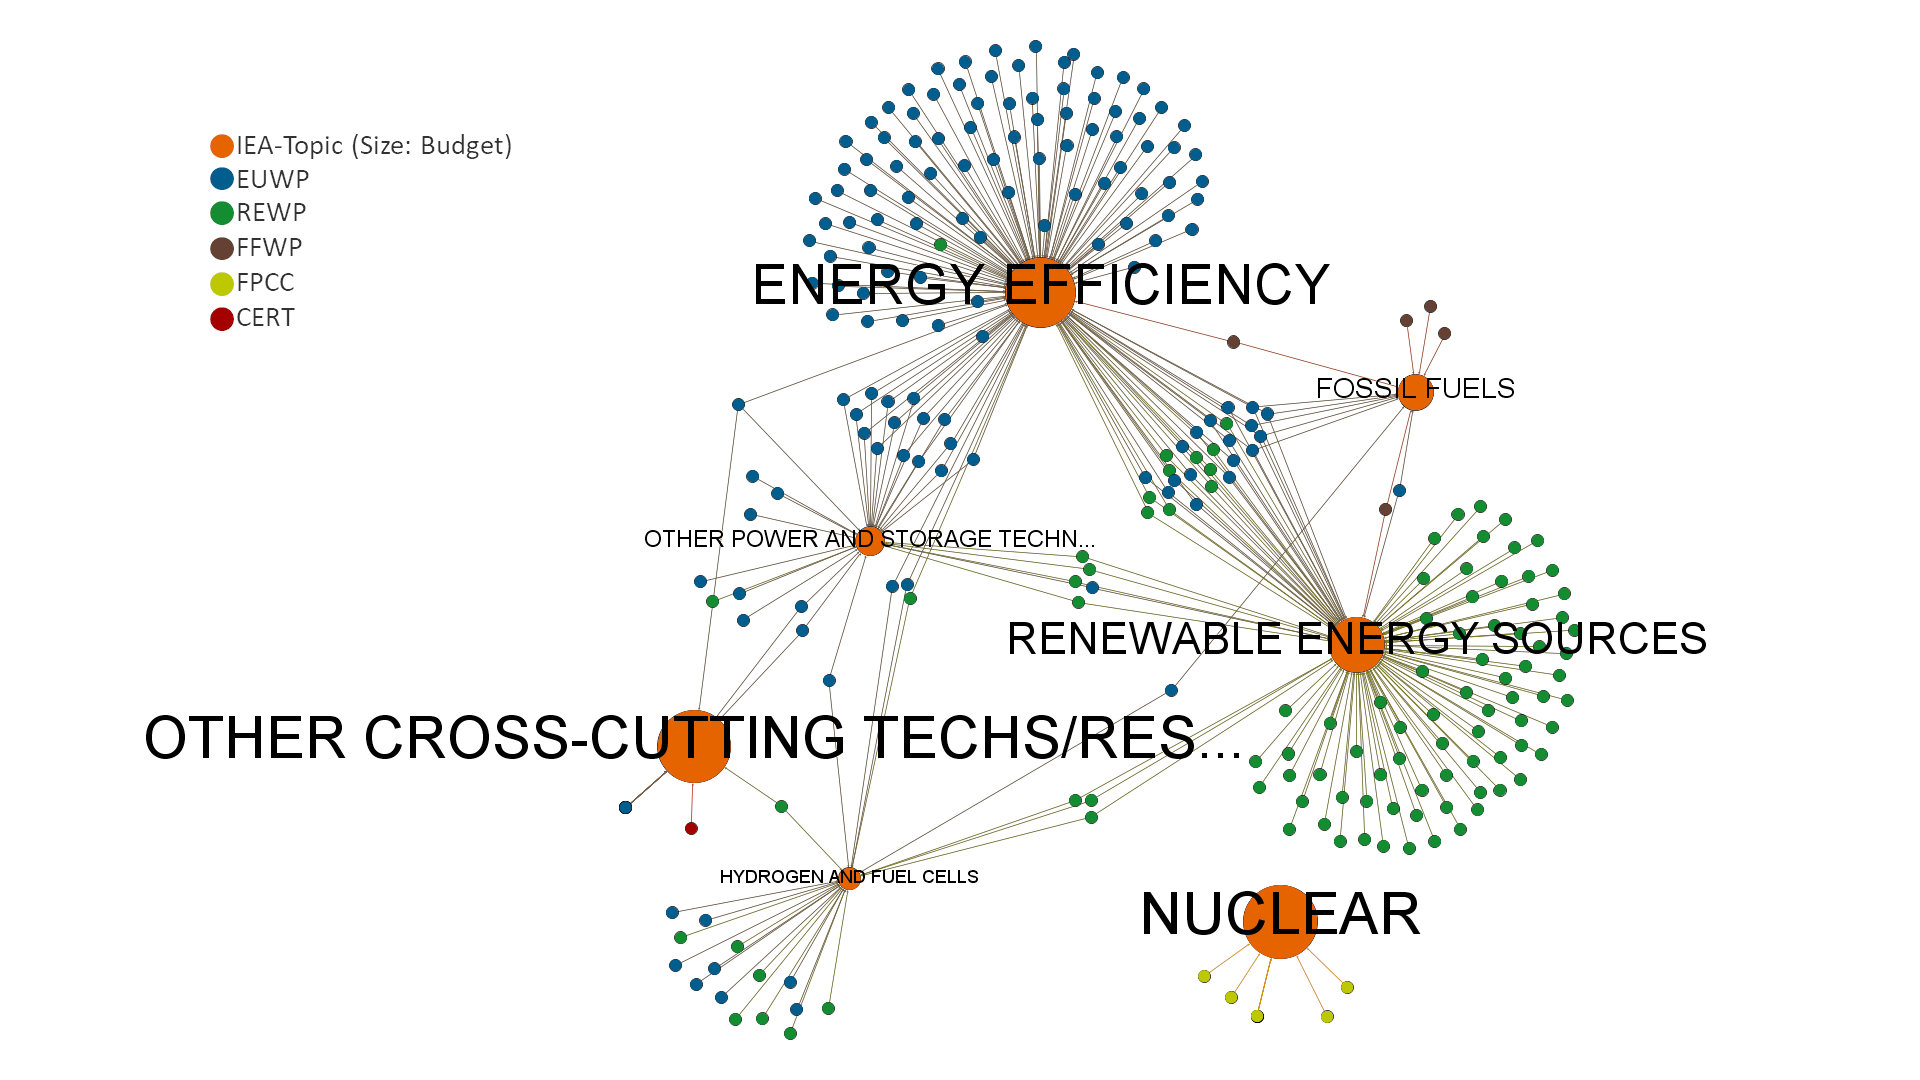
R&D Map
Visualisation of all ongoing Tasks and Annexes ("Activities") and their respective research topics.
Copyright: Austrian Energy Agency
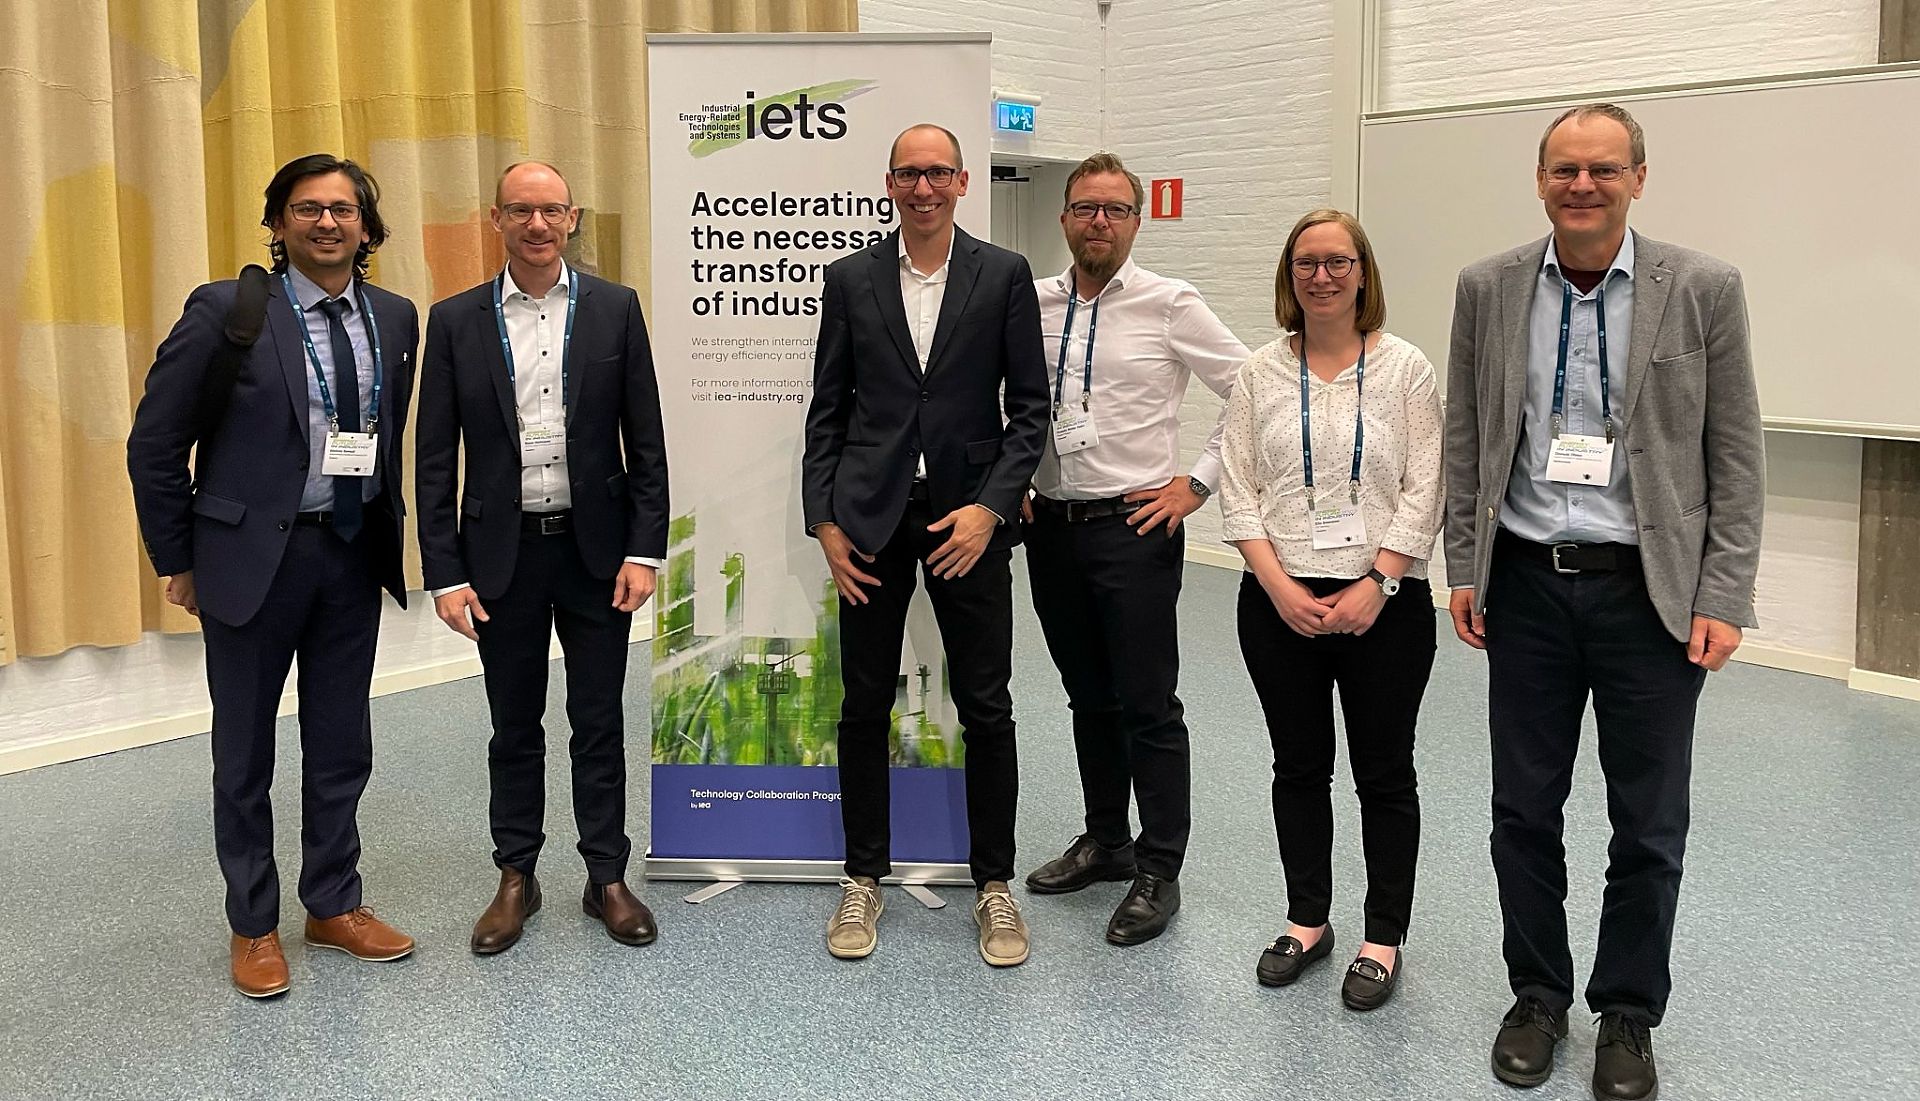
Speakers at the Energy.Future.Industry conference in Gothenburg
Speakers (left to right): Akshay Bansal PhD, Prof. René Hofmann (Lead of Task 18 Subtask 2), Dr. Felix Birkelbach, Fridolin Holm MSc, Dr. Elin Svensson, Dr. Donald Olsen.
Copyright: IEA IETS

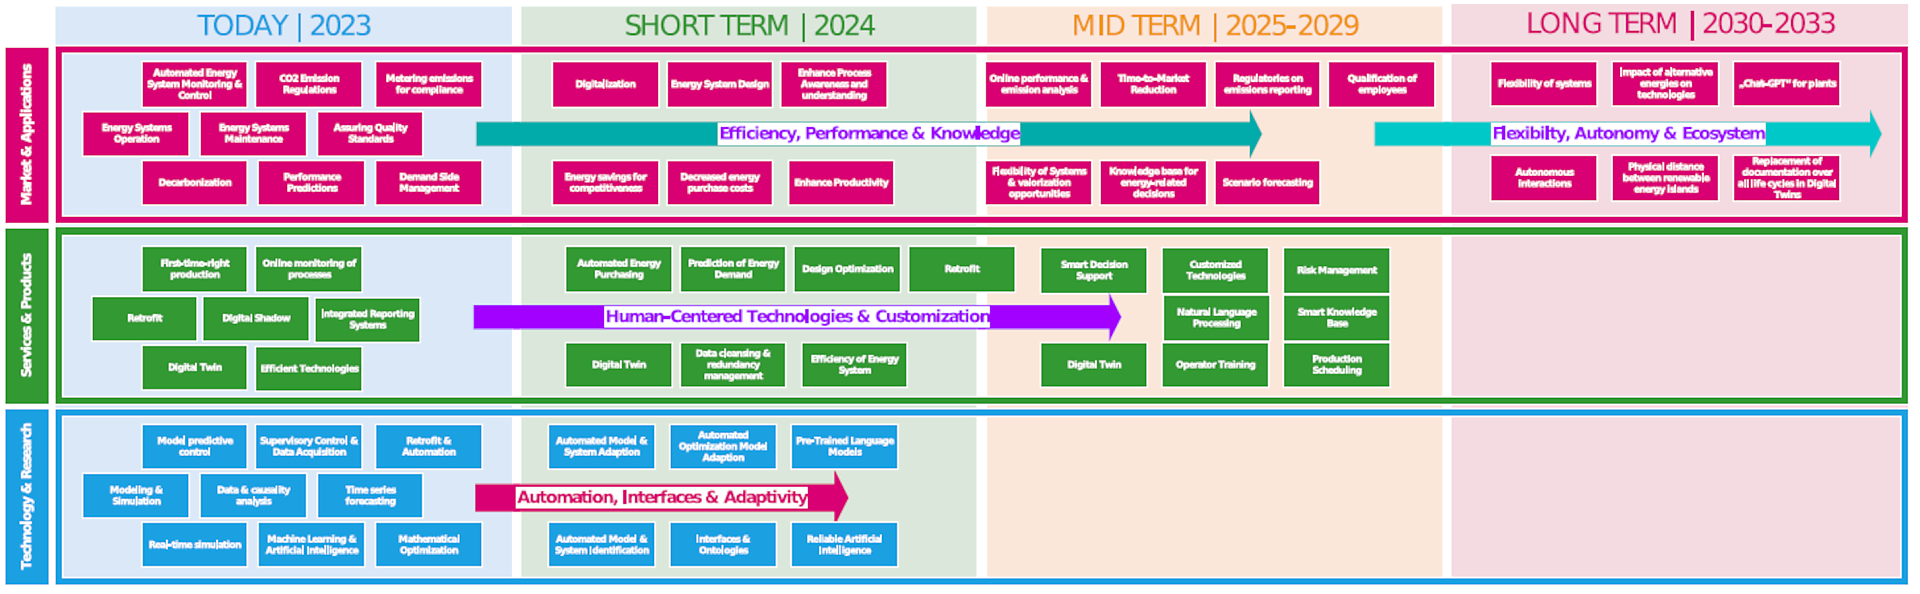
Illustration of the "Roadmap on Digitalization" that was developed in the Annex.
The roadmap shows the keywords with regard to future application areas of digital twins, which were identified during workshops in the Annex.
Copyright: TU Wien
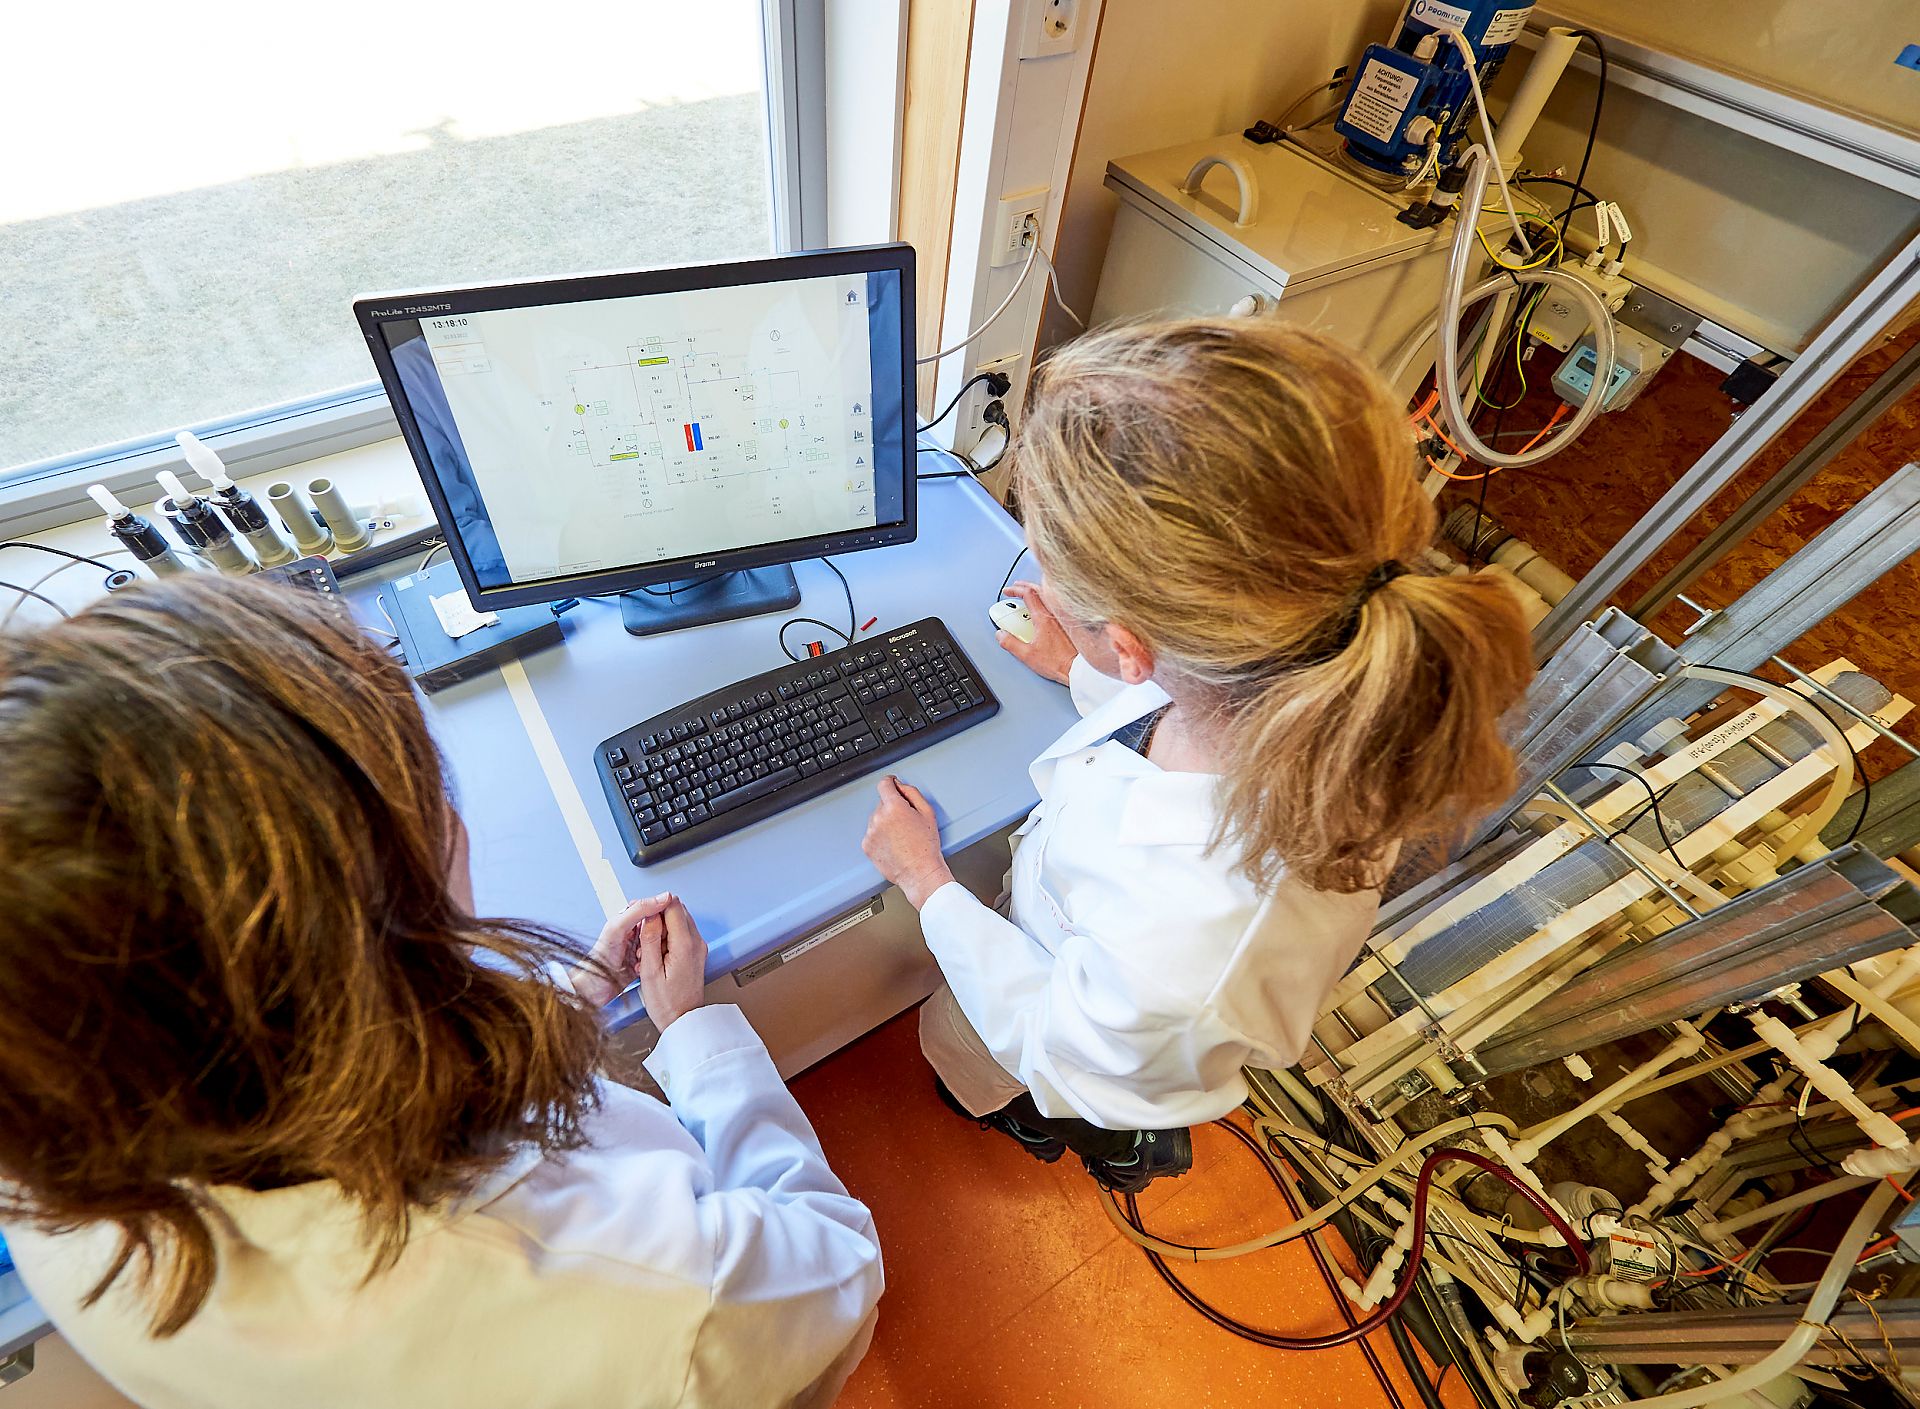
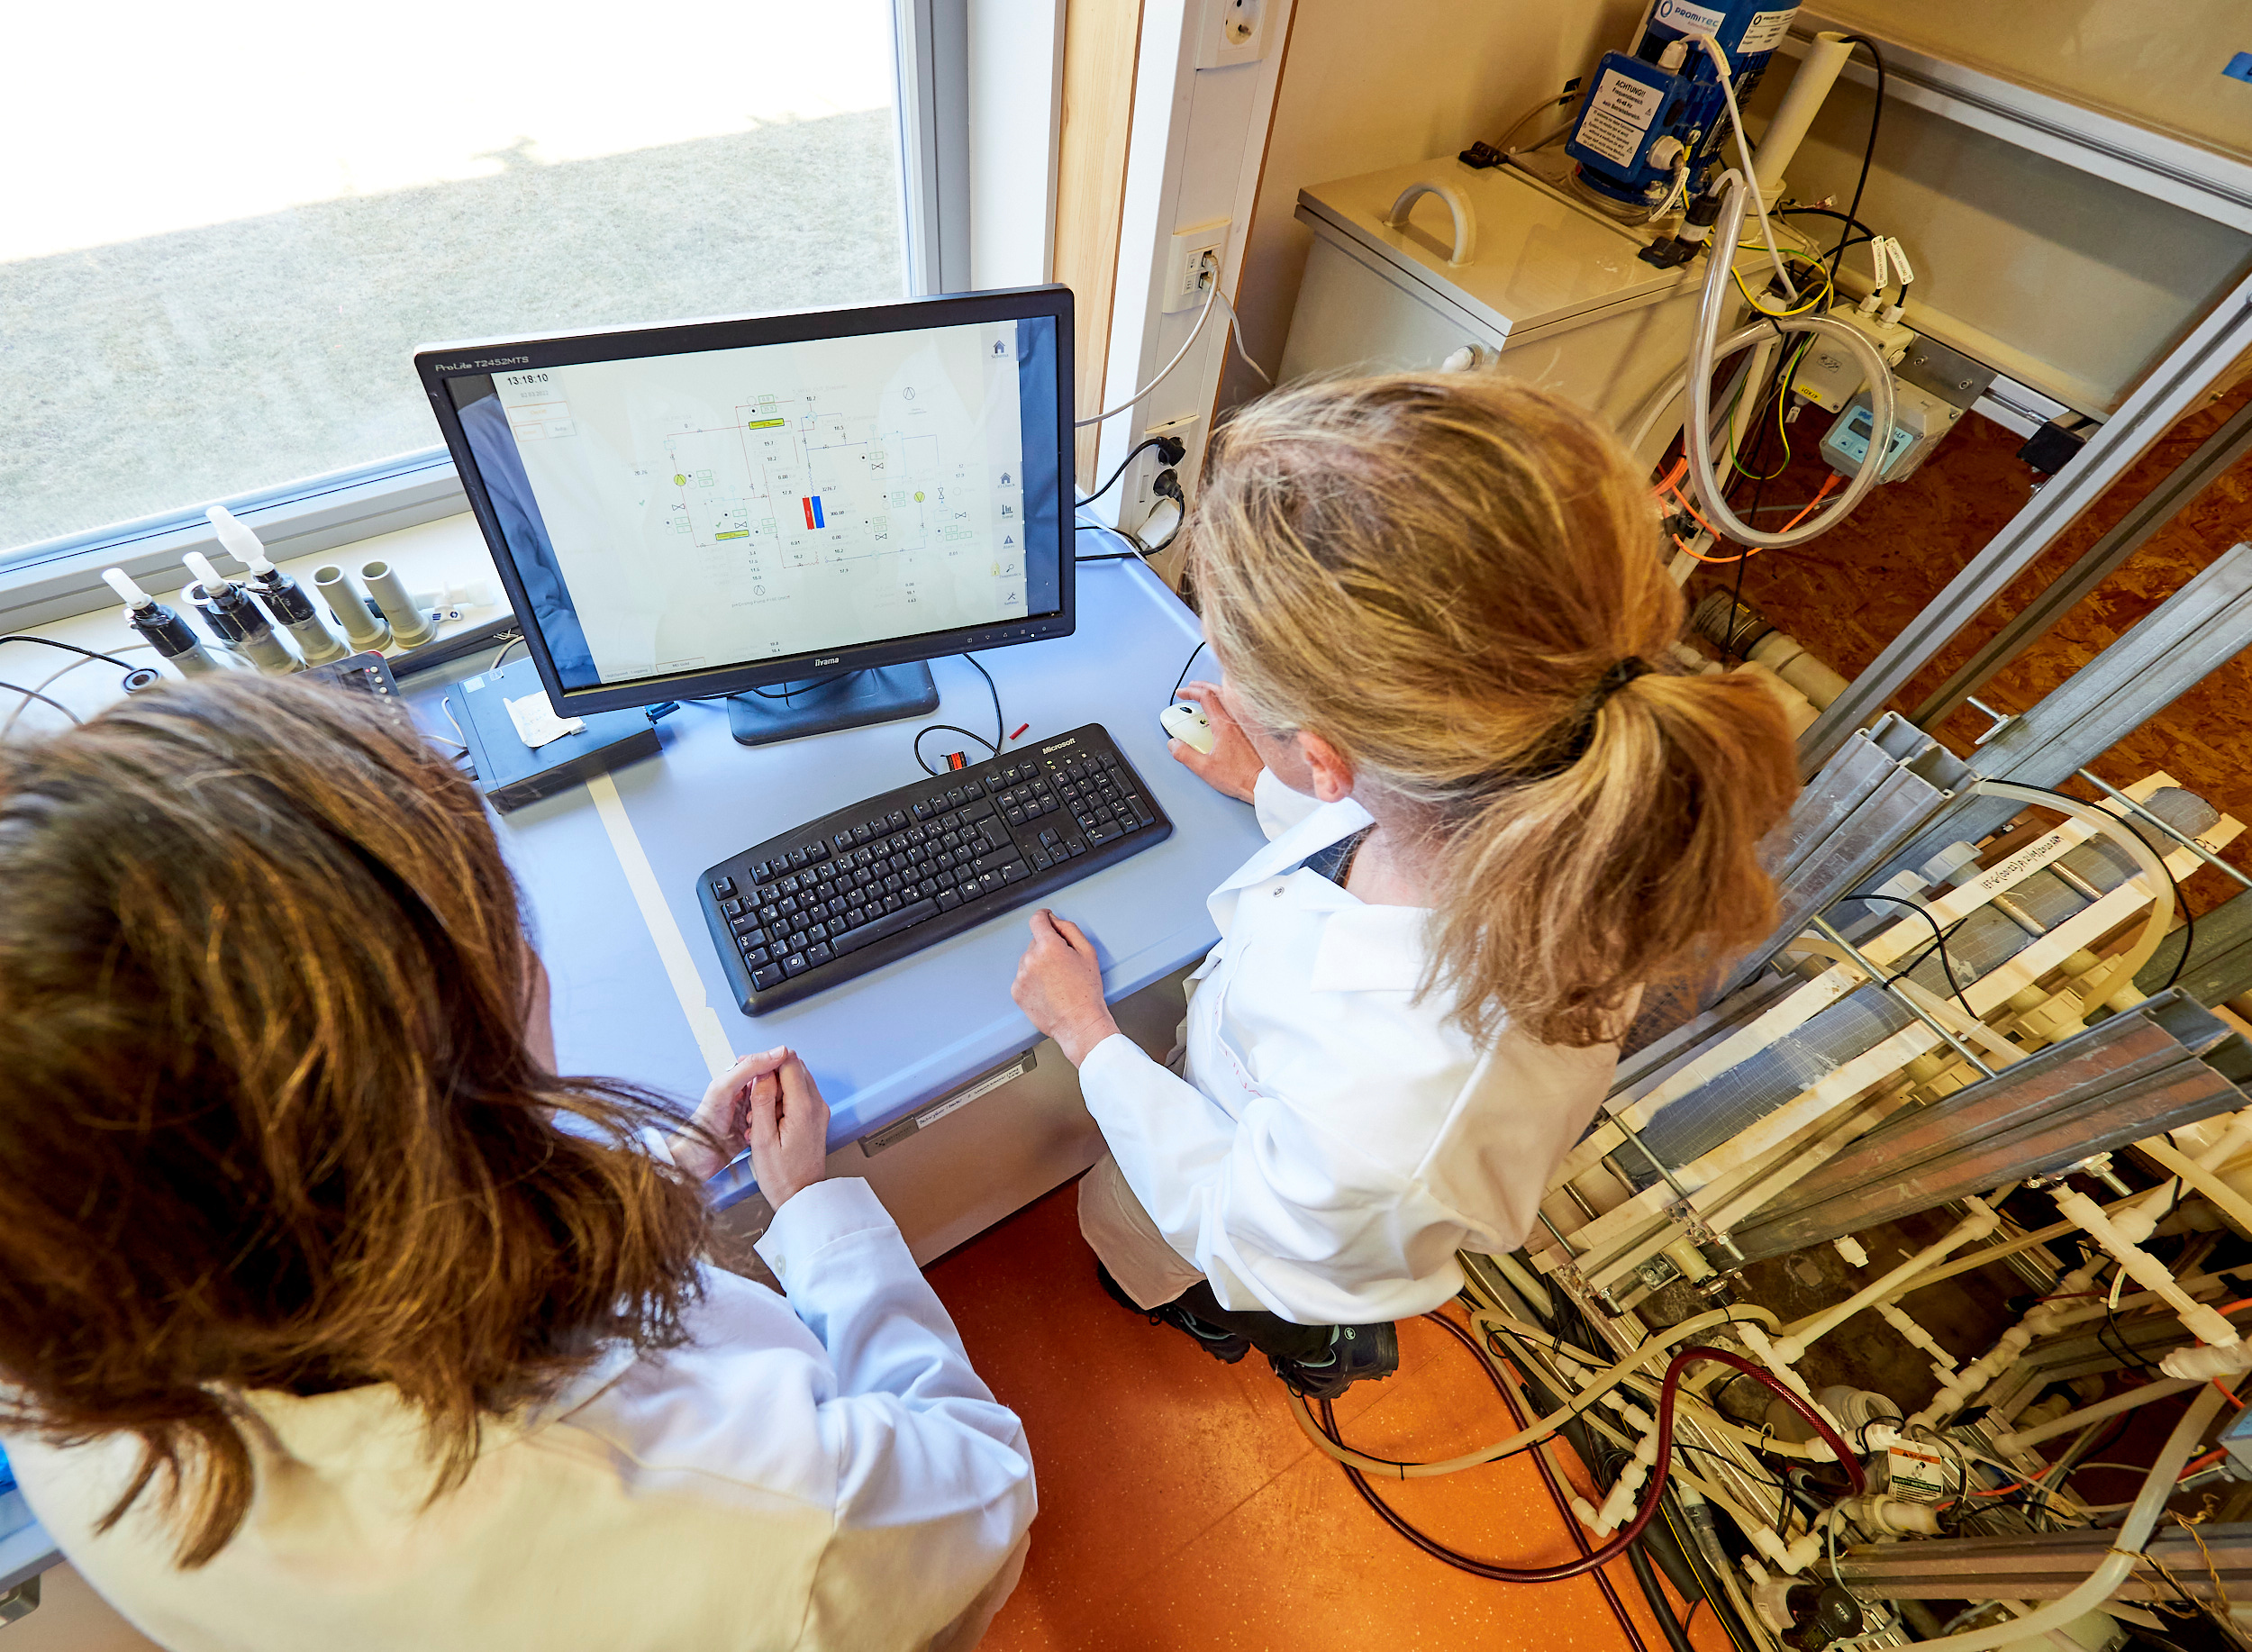
Membrane distillation plant @ AEE INTEC
The membrane distillation plant in the laboratory of AEE INTEC in Gleisdorf offers the possibility to test different types and sizes of membrane modules under varying conditions.
Copyright: ACR/schewig-fotodesign
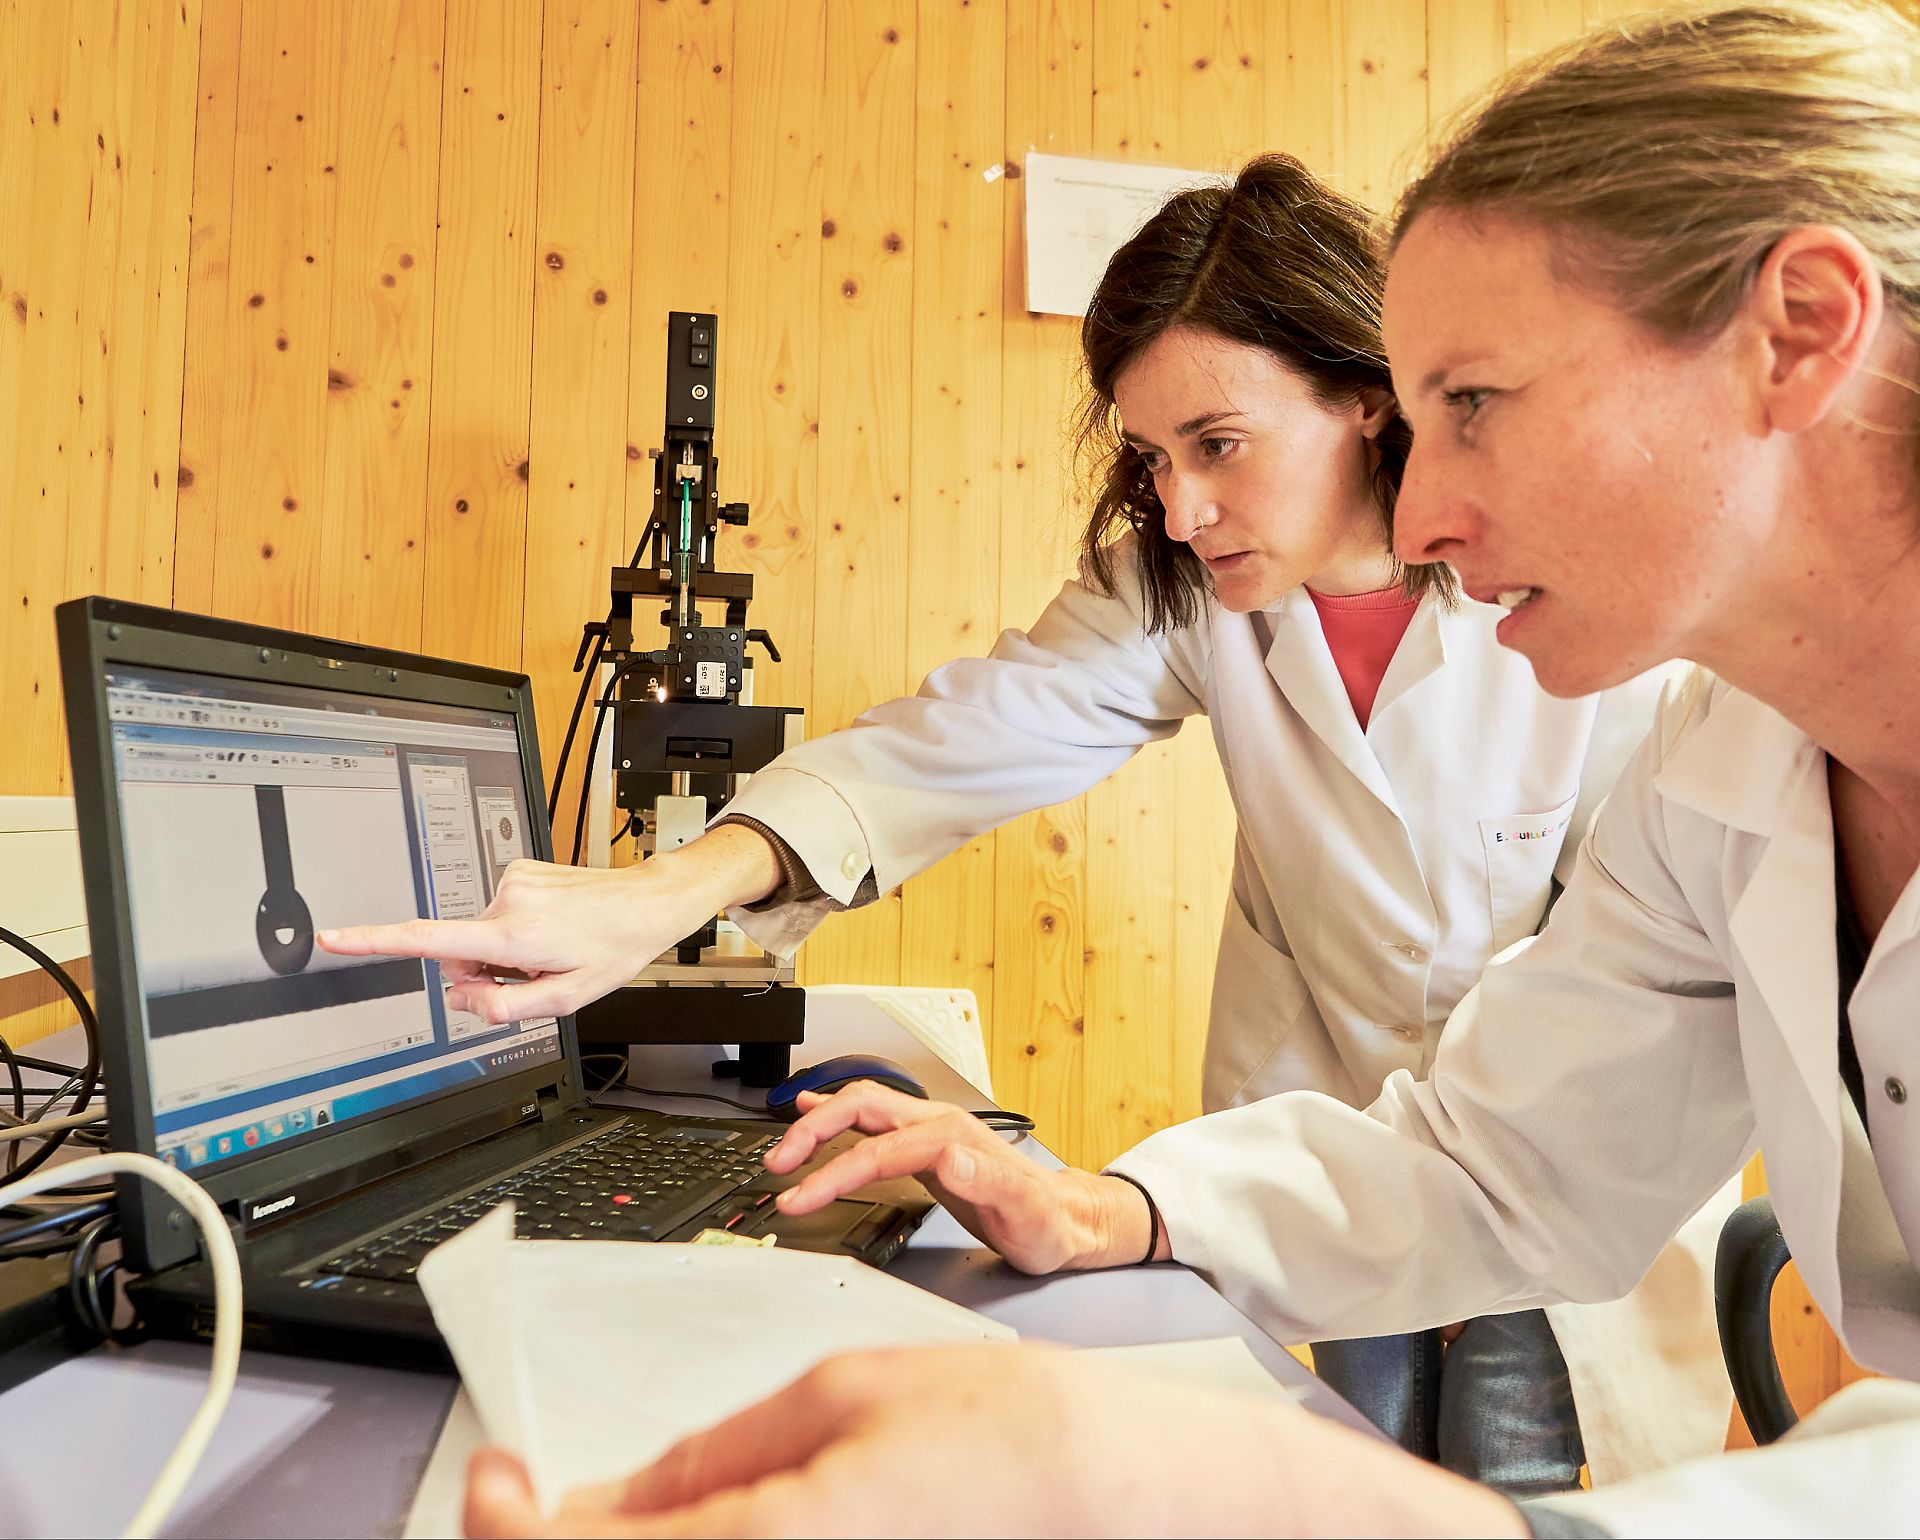
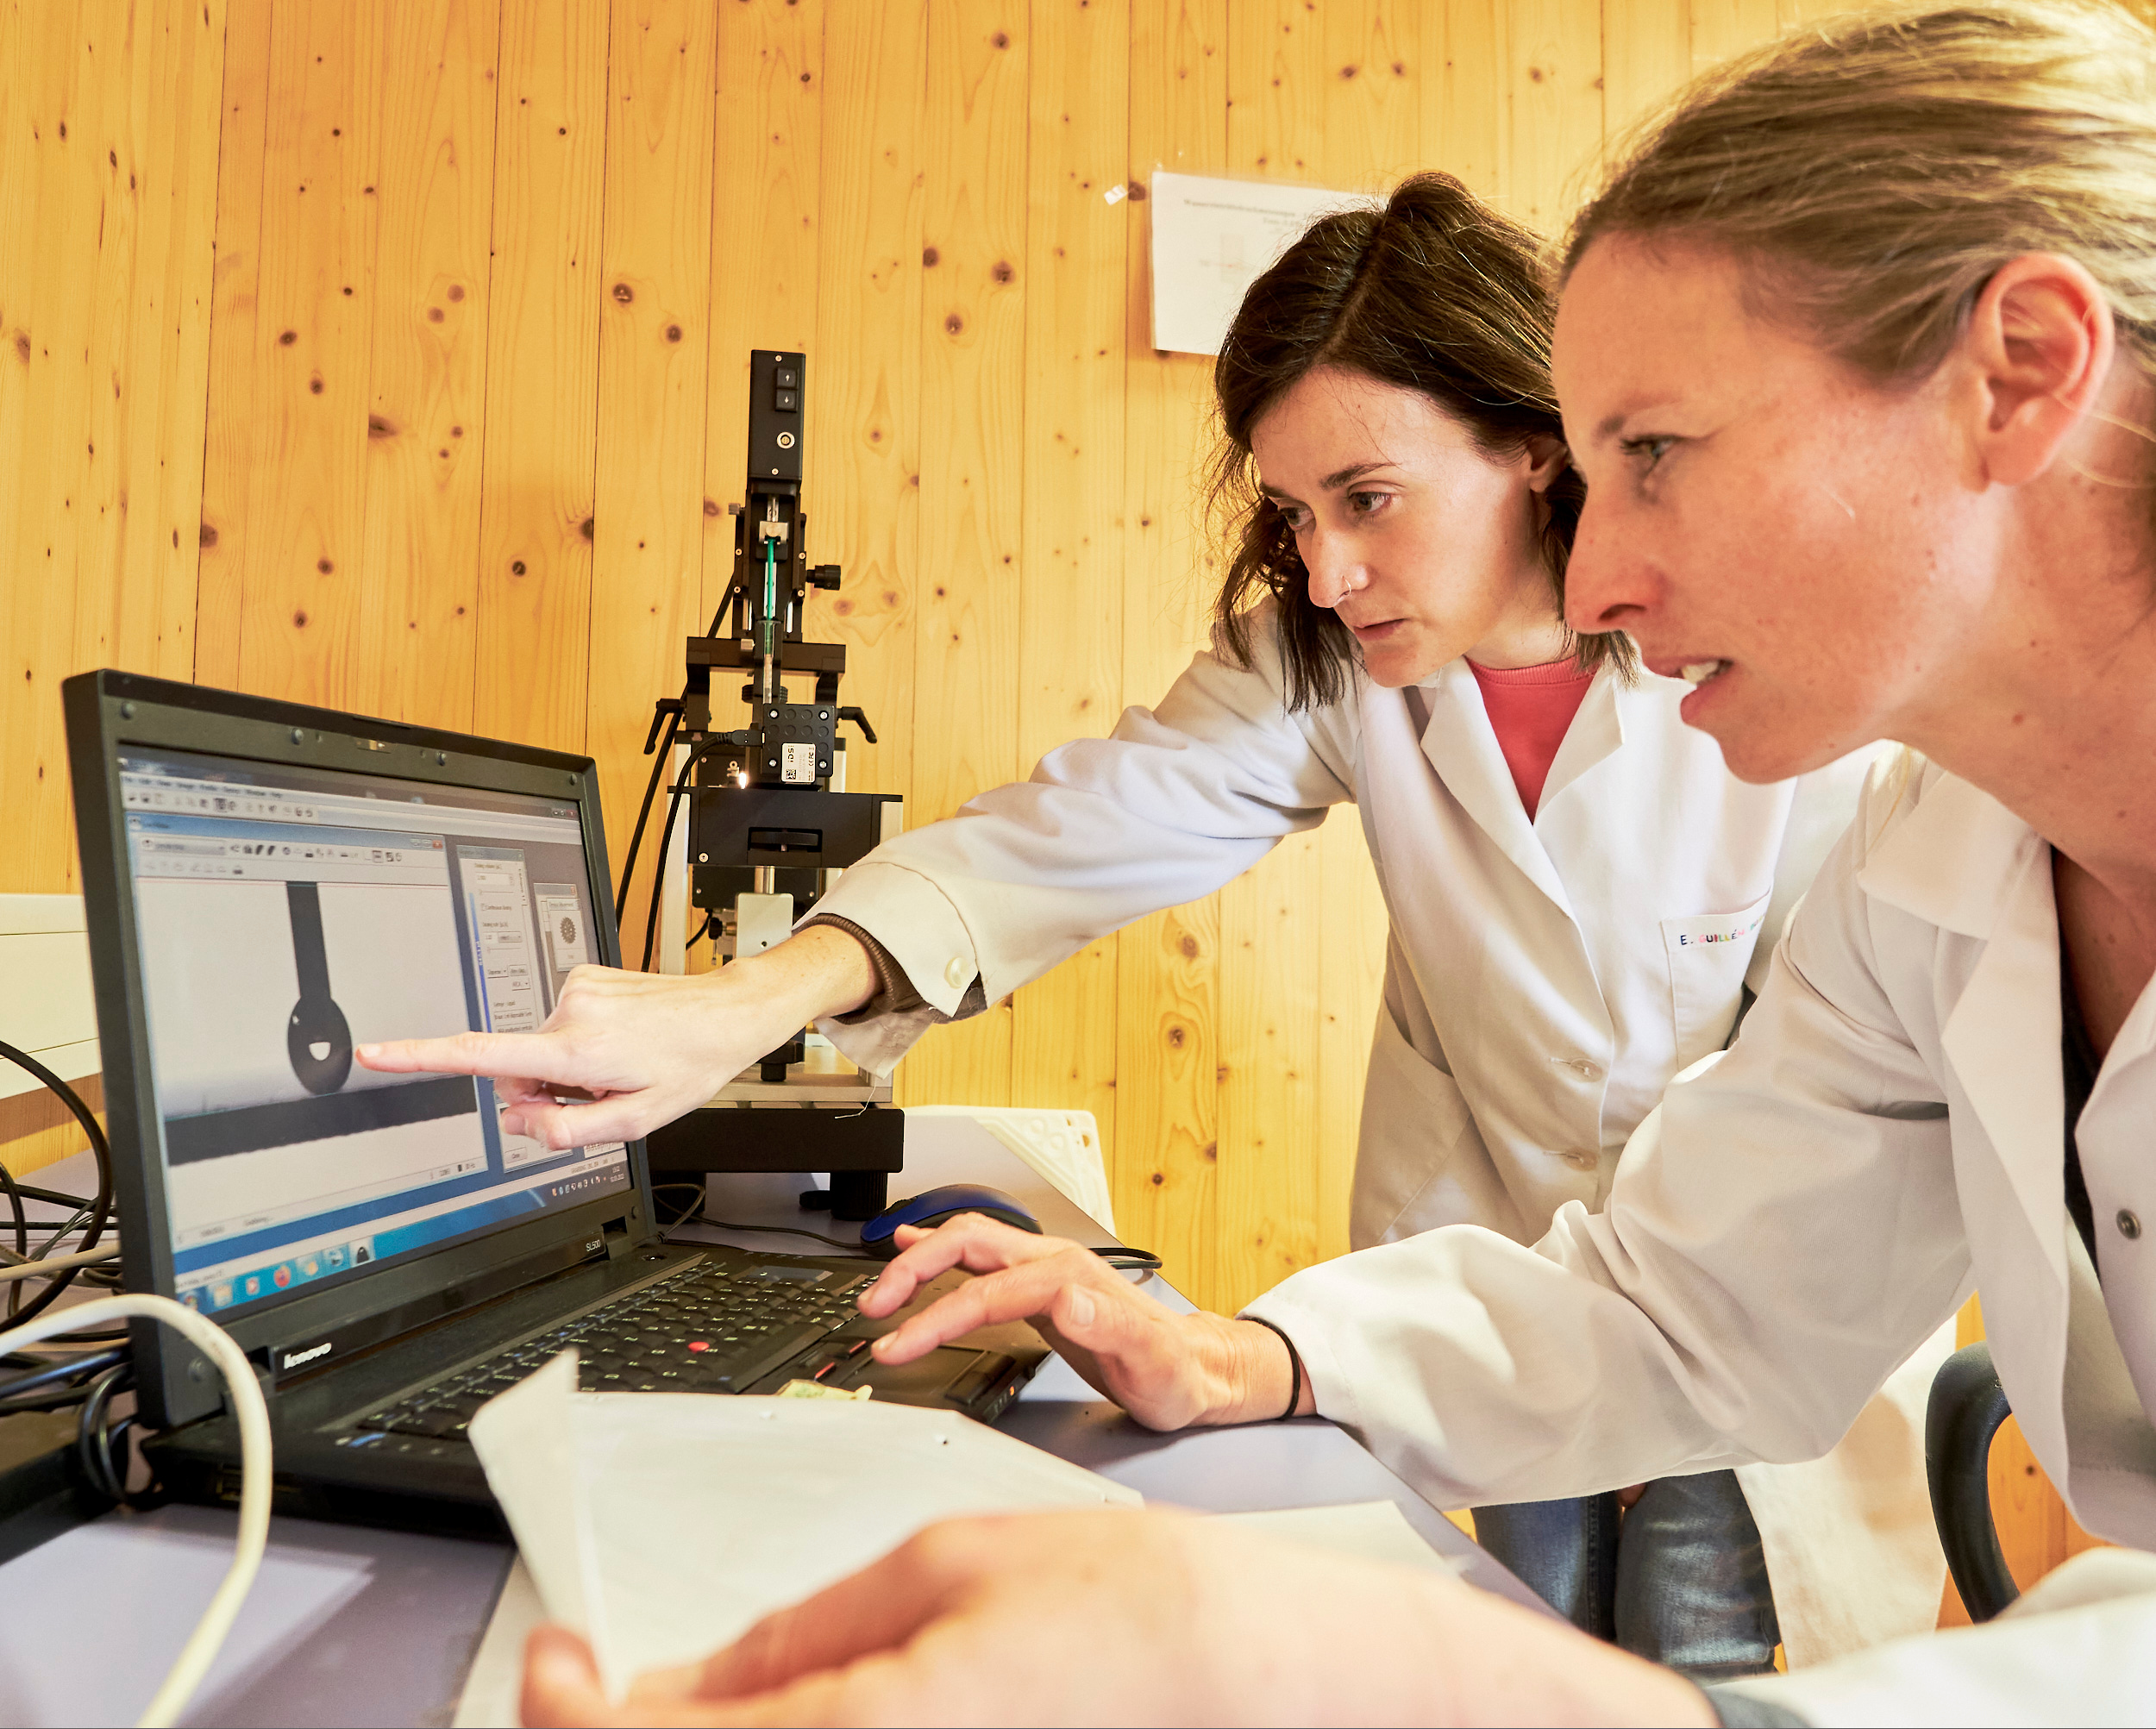
Membrane tests for the analysis of surface properties
By means of contact angle measurements, the membrane can be analyzed before and after its application and conclusions can be drawn about its functionality and usability.
Copyright: ACR/schewig-fotodesign
sandTES
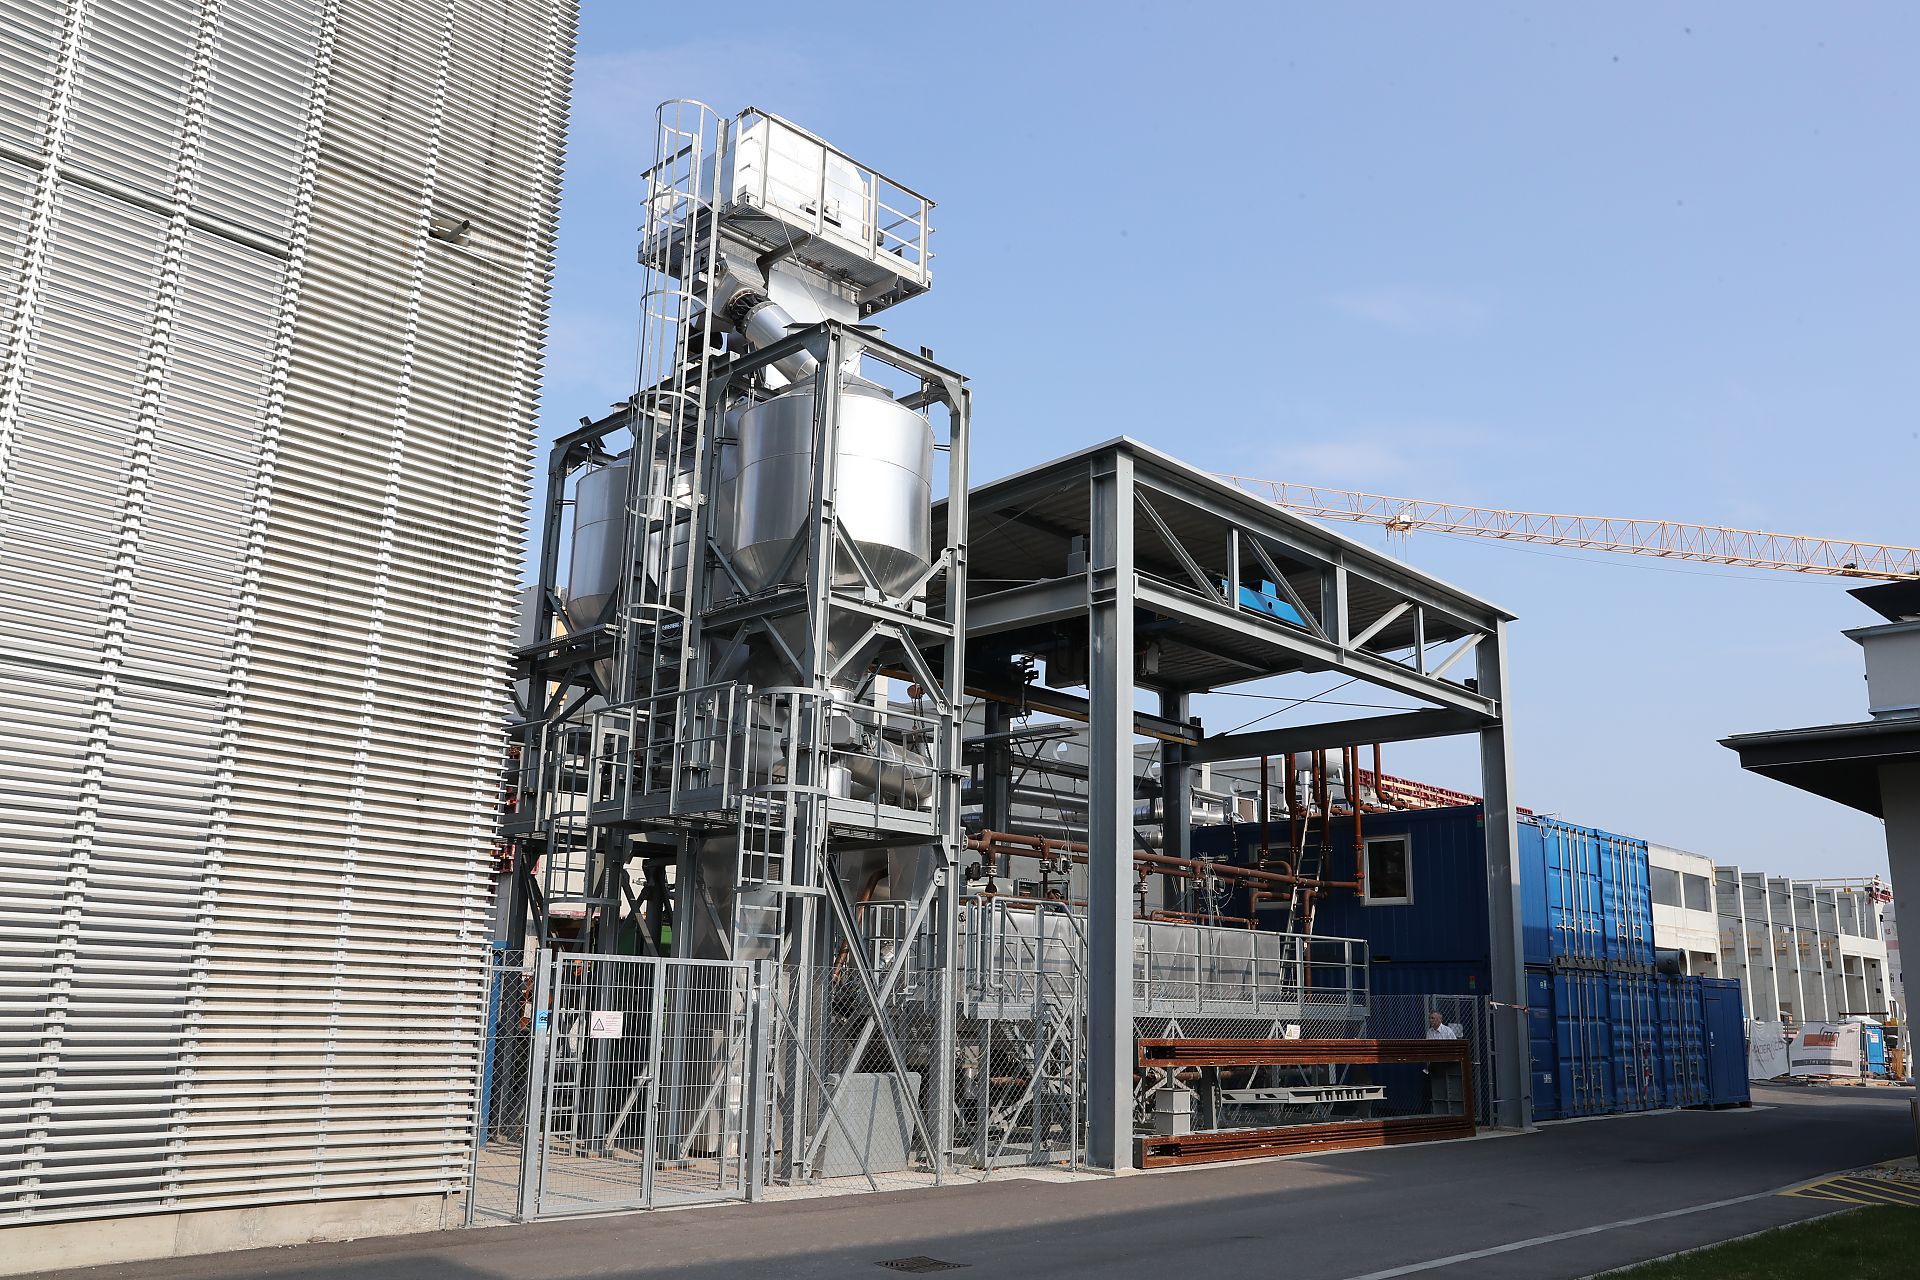
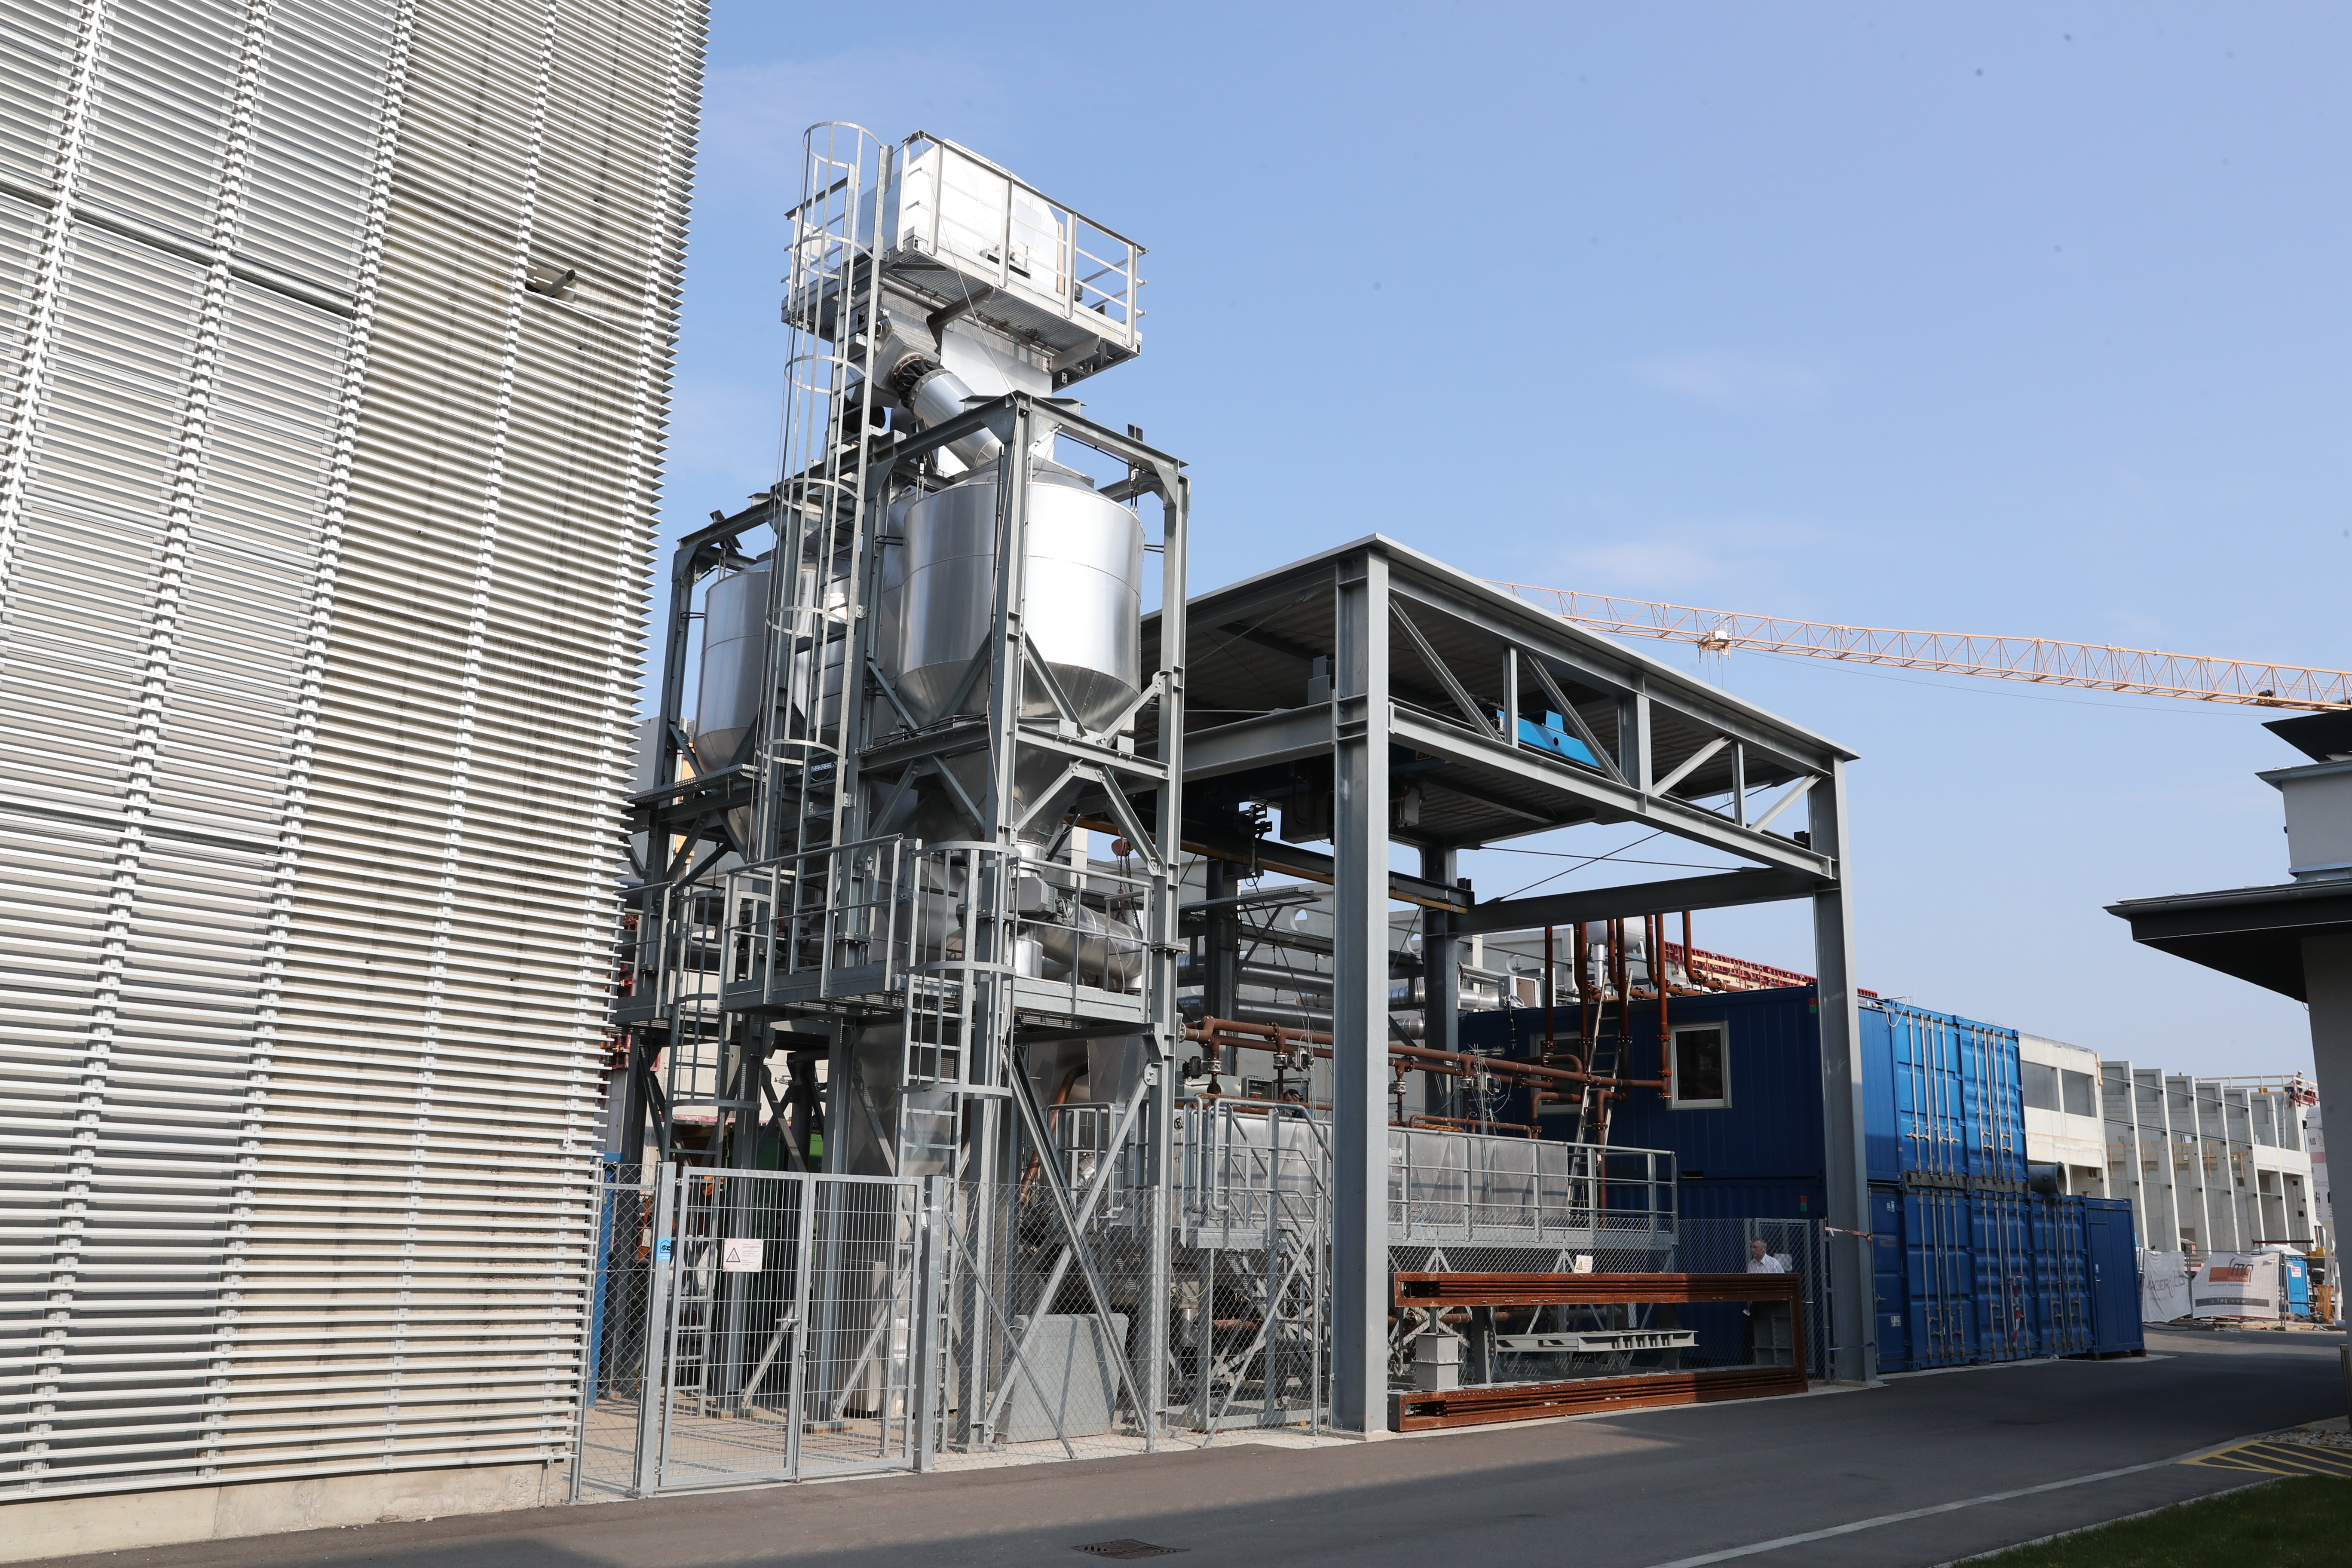
active fluidized bed storage "sandTES" of the Institute for Energy Systems and Thermodynamics (TU Wien)
Copyright: Institut für Thermodynamik und Energietechnik, TU Wien
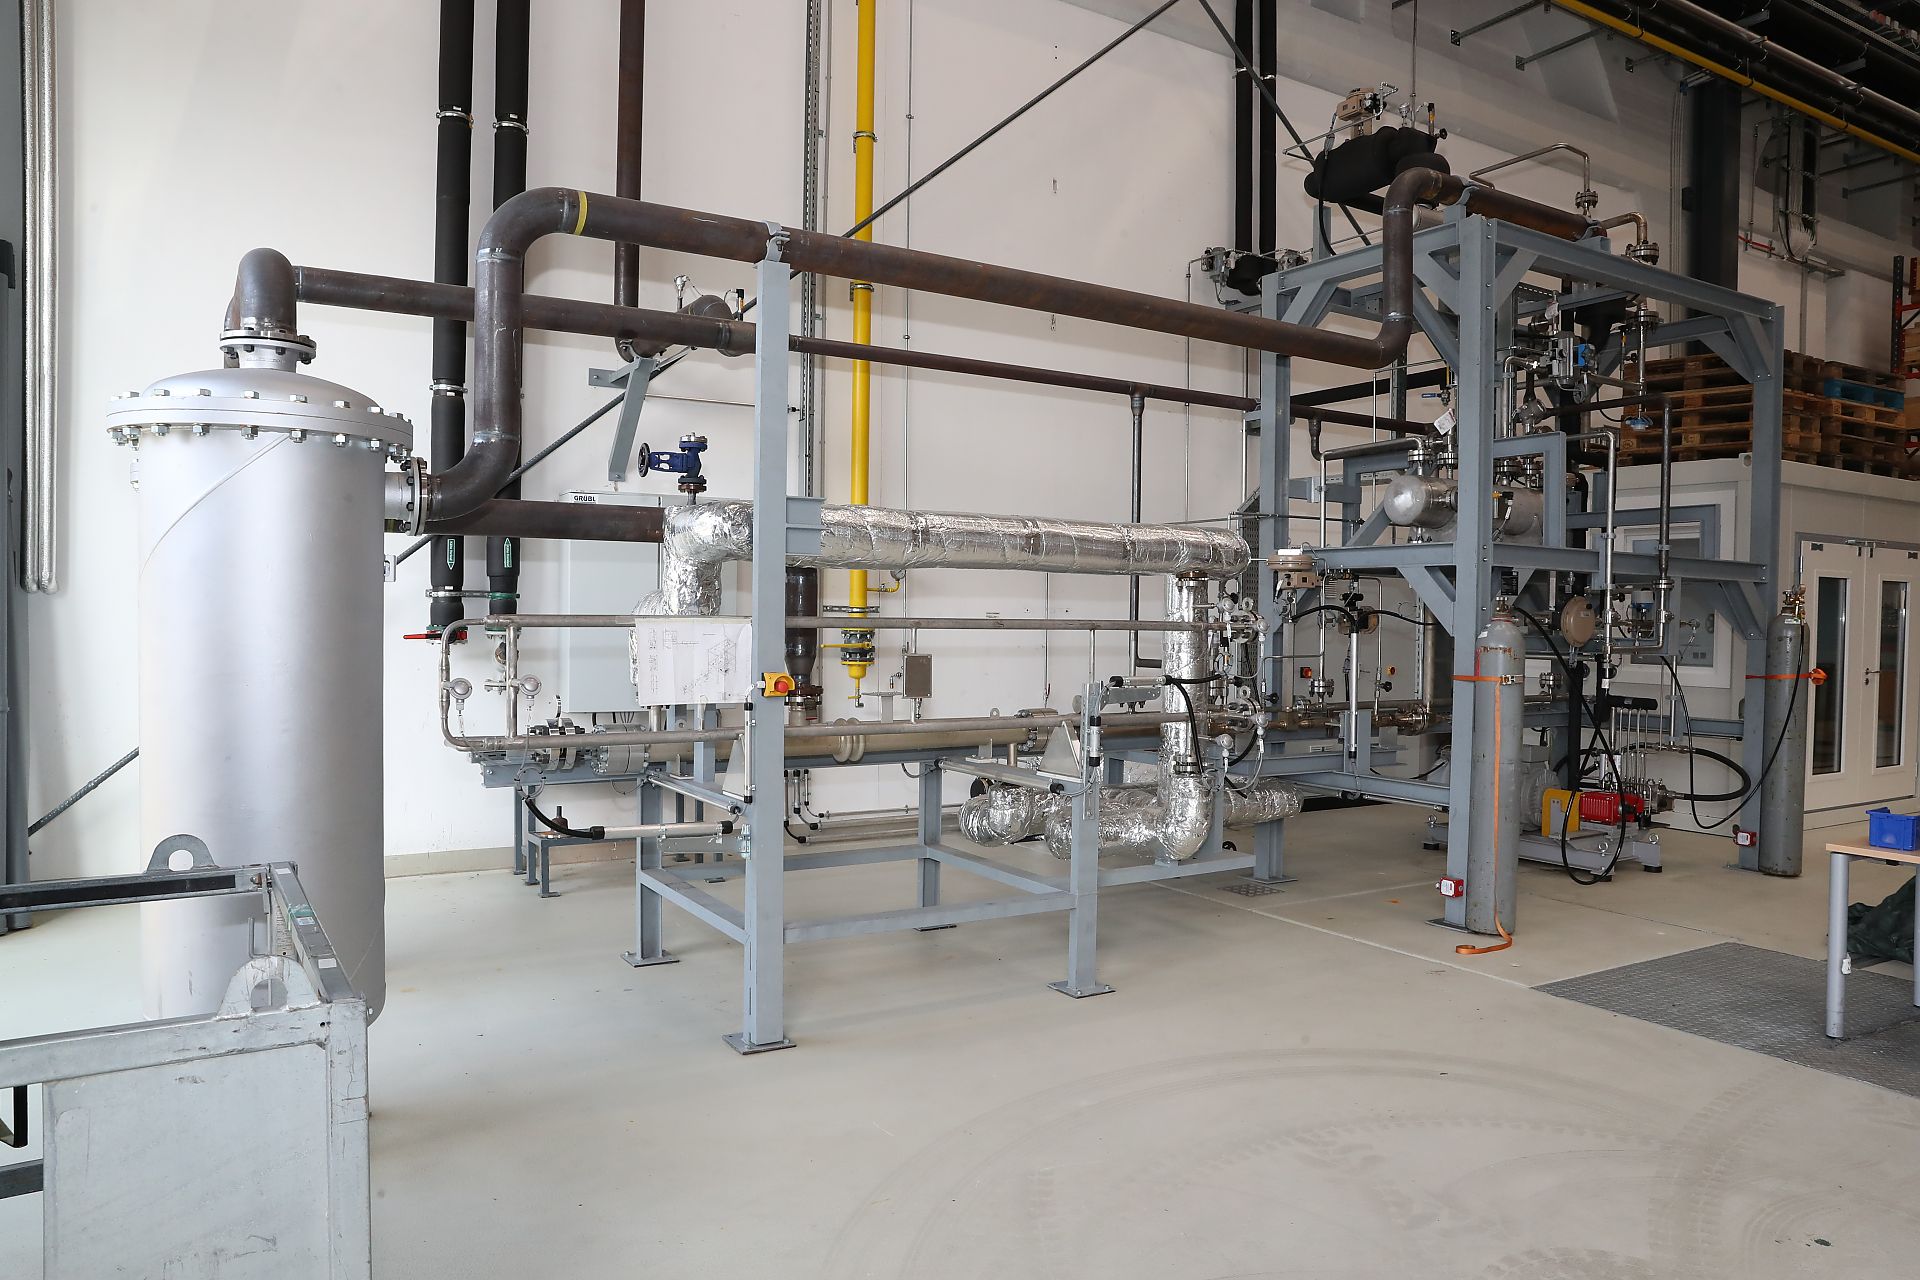
supercritical CO2 cycle
supercritical CO2 cycle for electrification of waste heat at the Institute for Energy Systems and Thermodynamics (TU Wien)
Copyright: Institut für Thermodynamik und Energietechnik, TU Wien

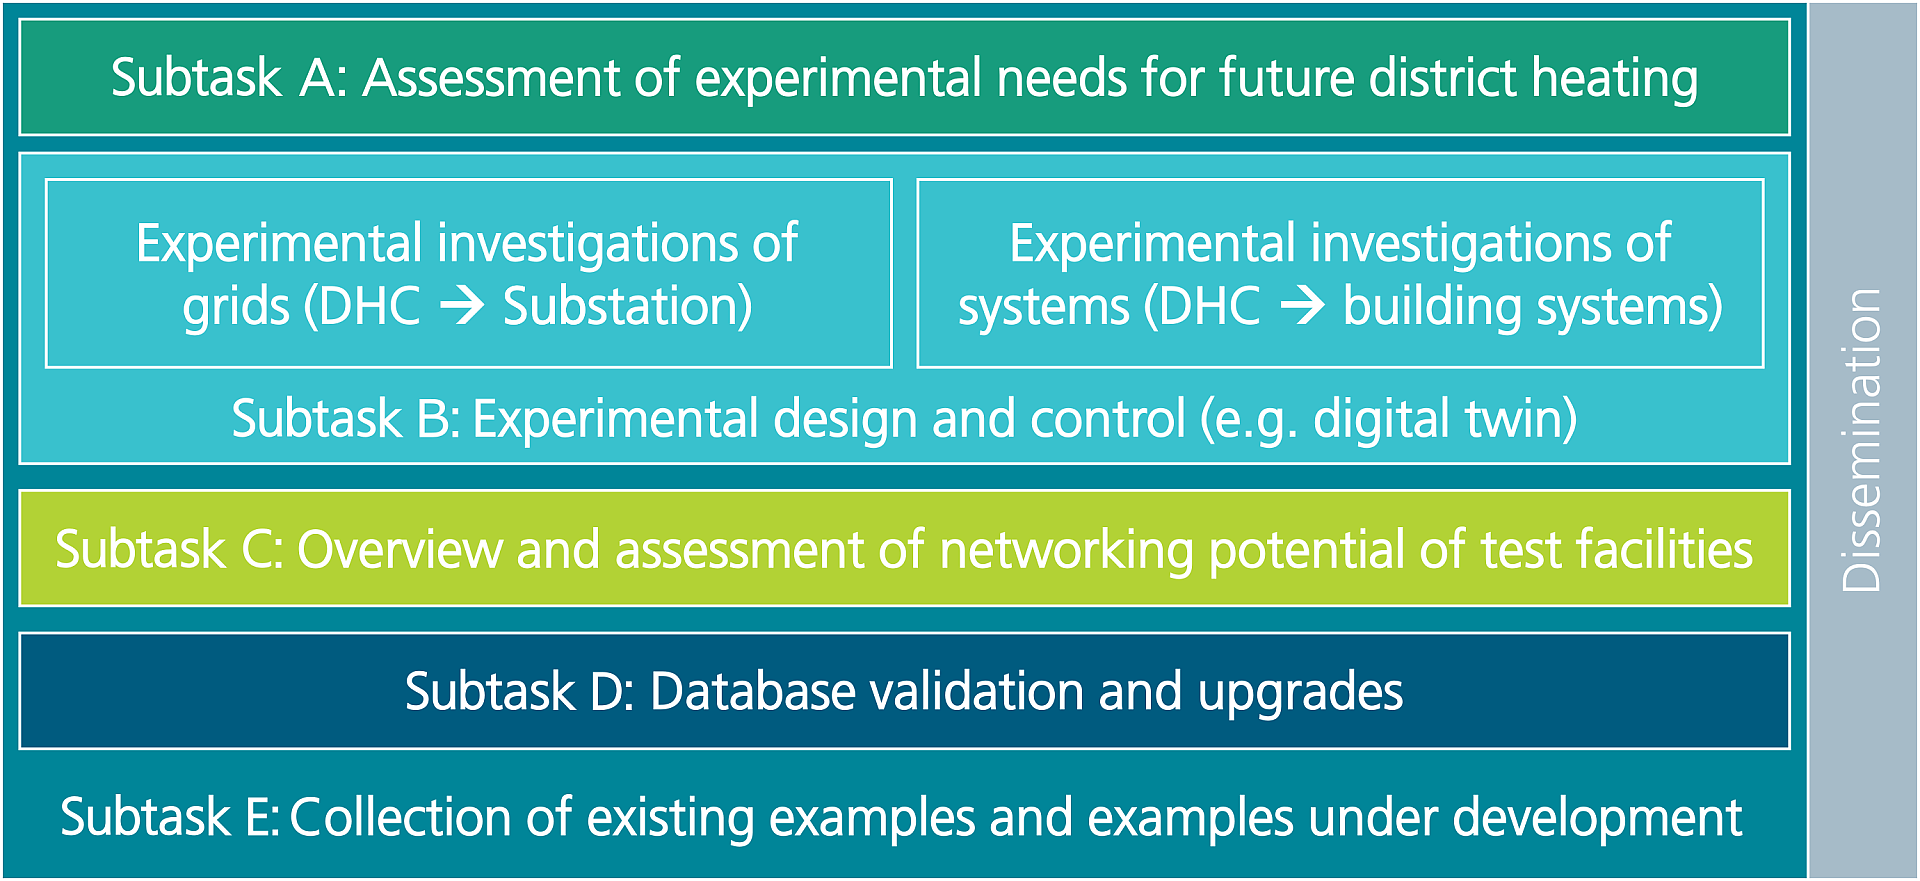
IEA DHC Annex TS8: Overview of subtasks
The international cooperation within the IEA DHC Annex TS8 is structured into 5 work packages (subtasks).
Copyright: IEA DHC Annex TS8

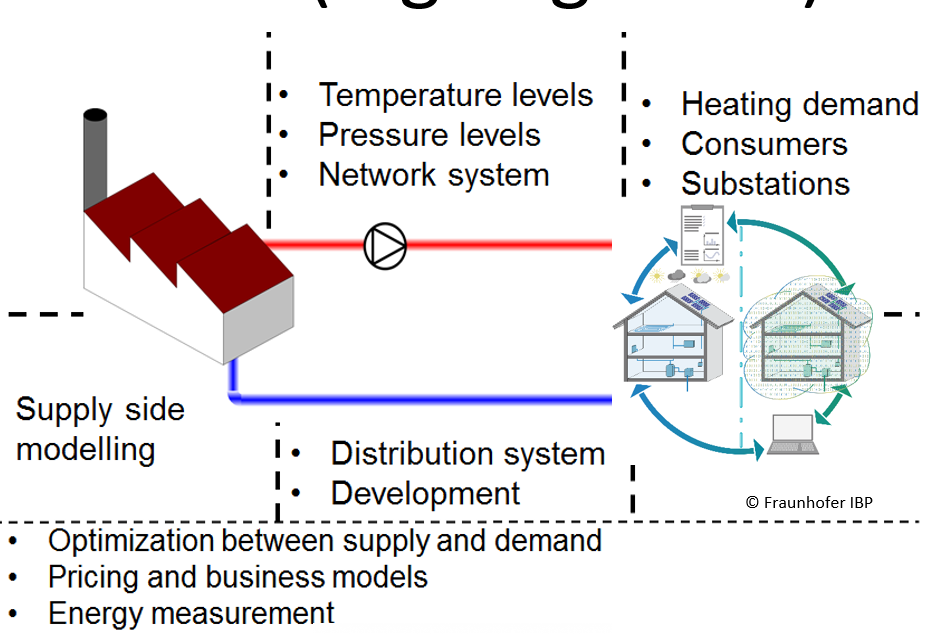
IEA DHC Annex TS8: System boundaries
Overview of the various system boundaries as considered in IEA DHC Annex TS8.
Copyright: IEA DHC Annex TS8
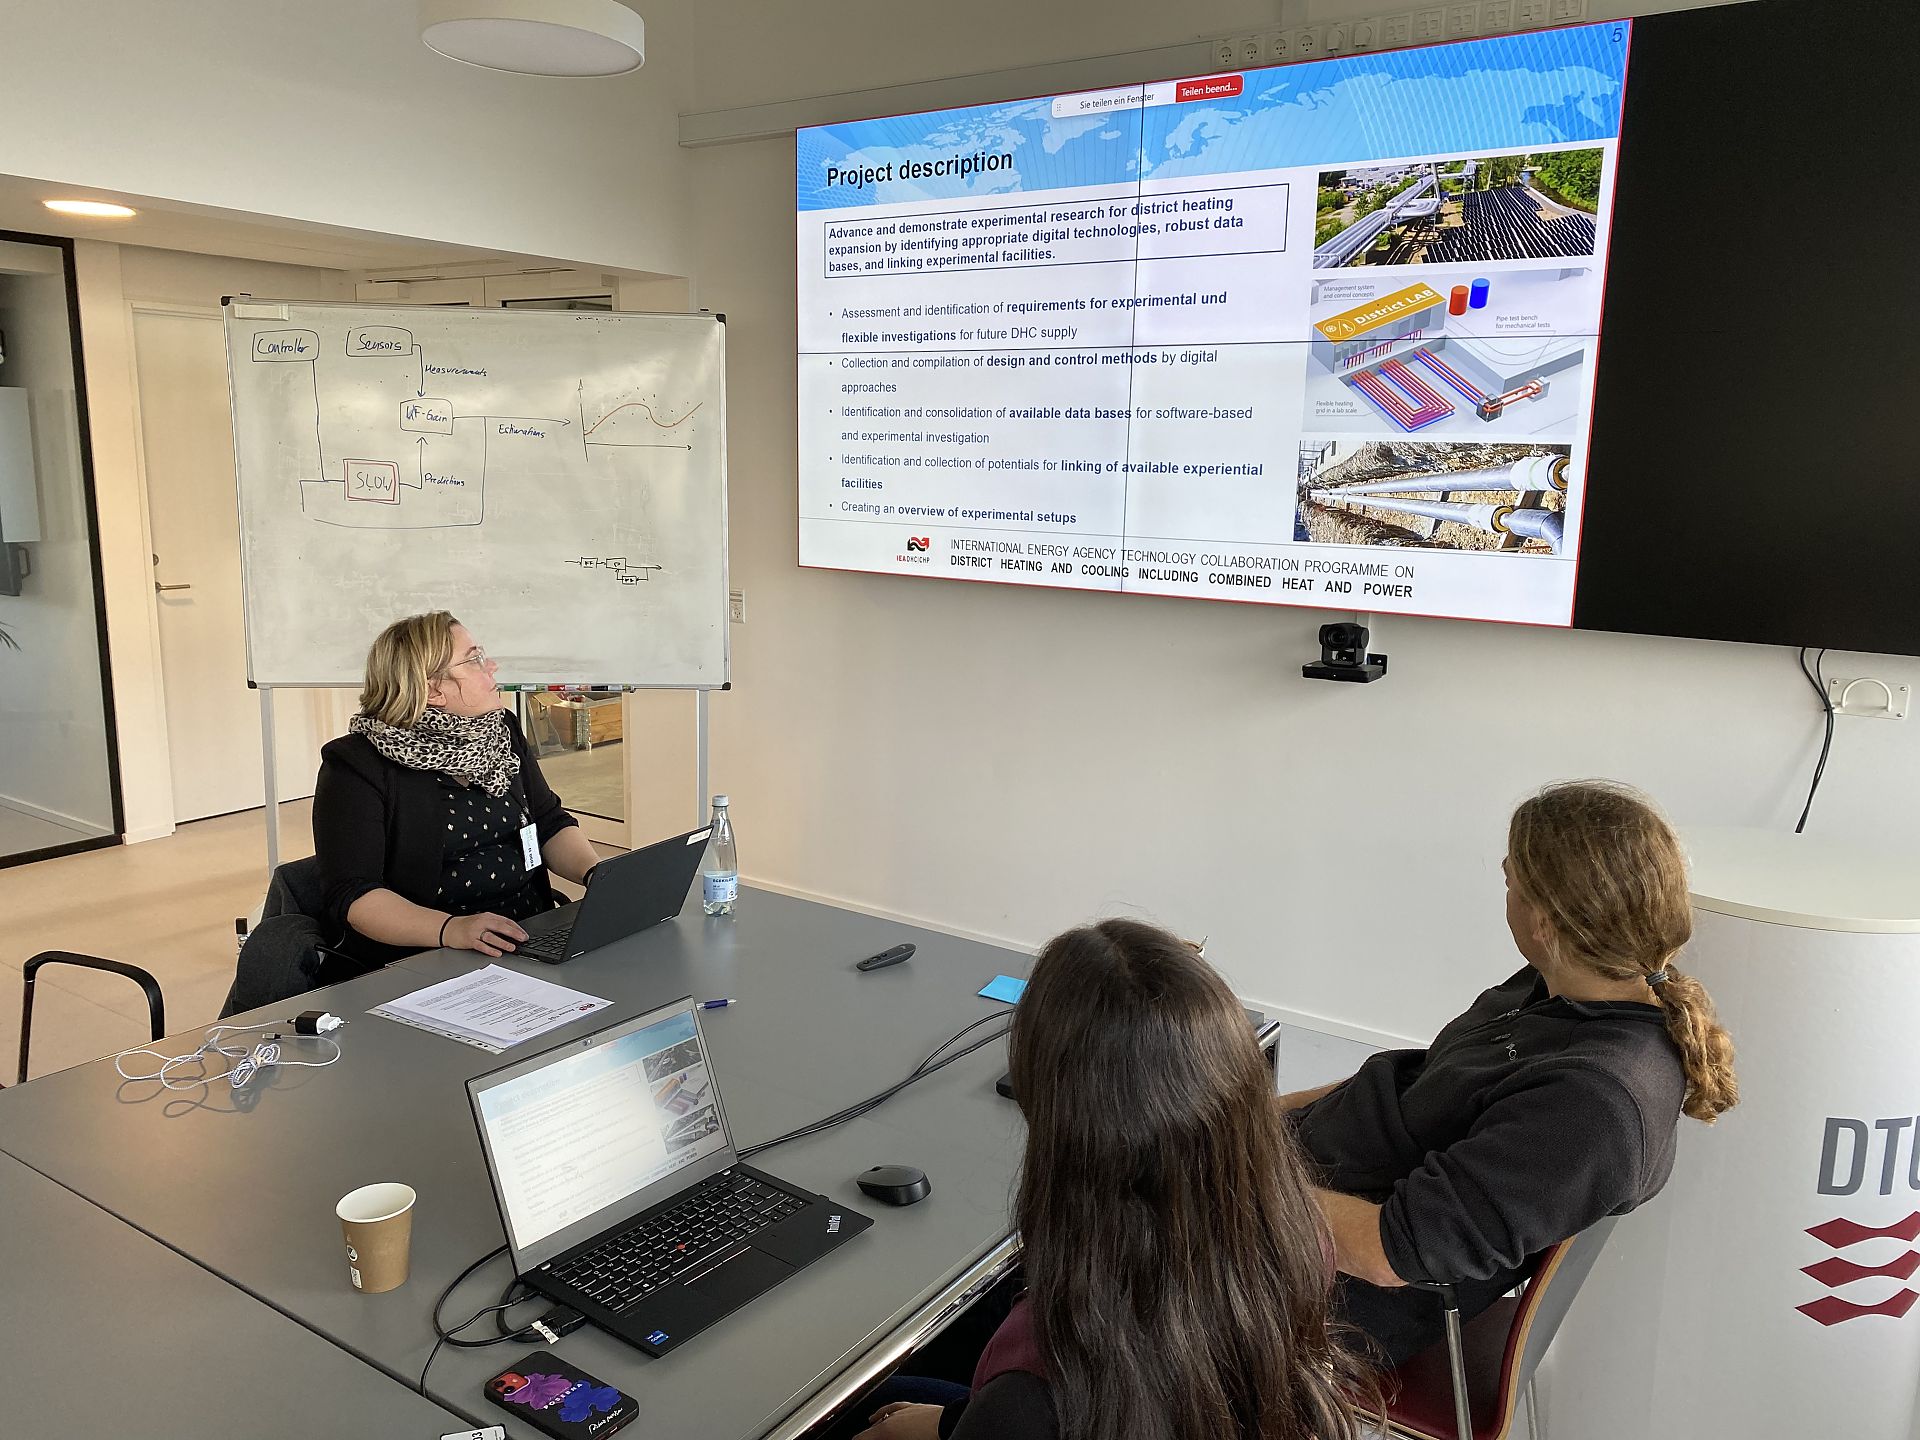
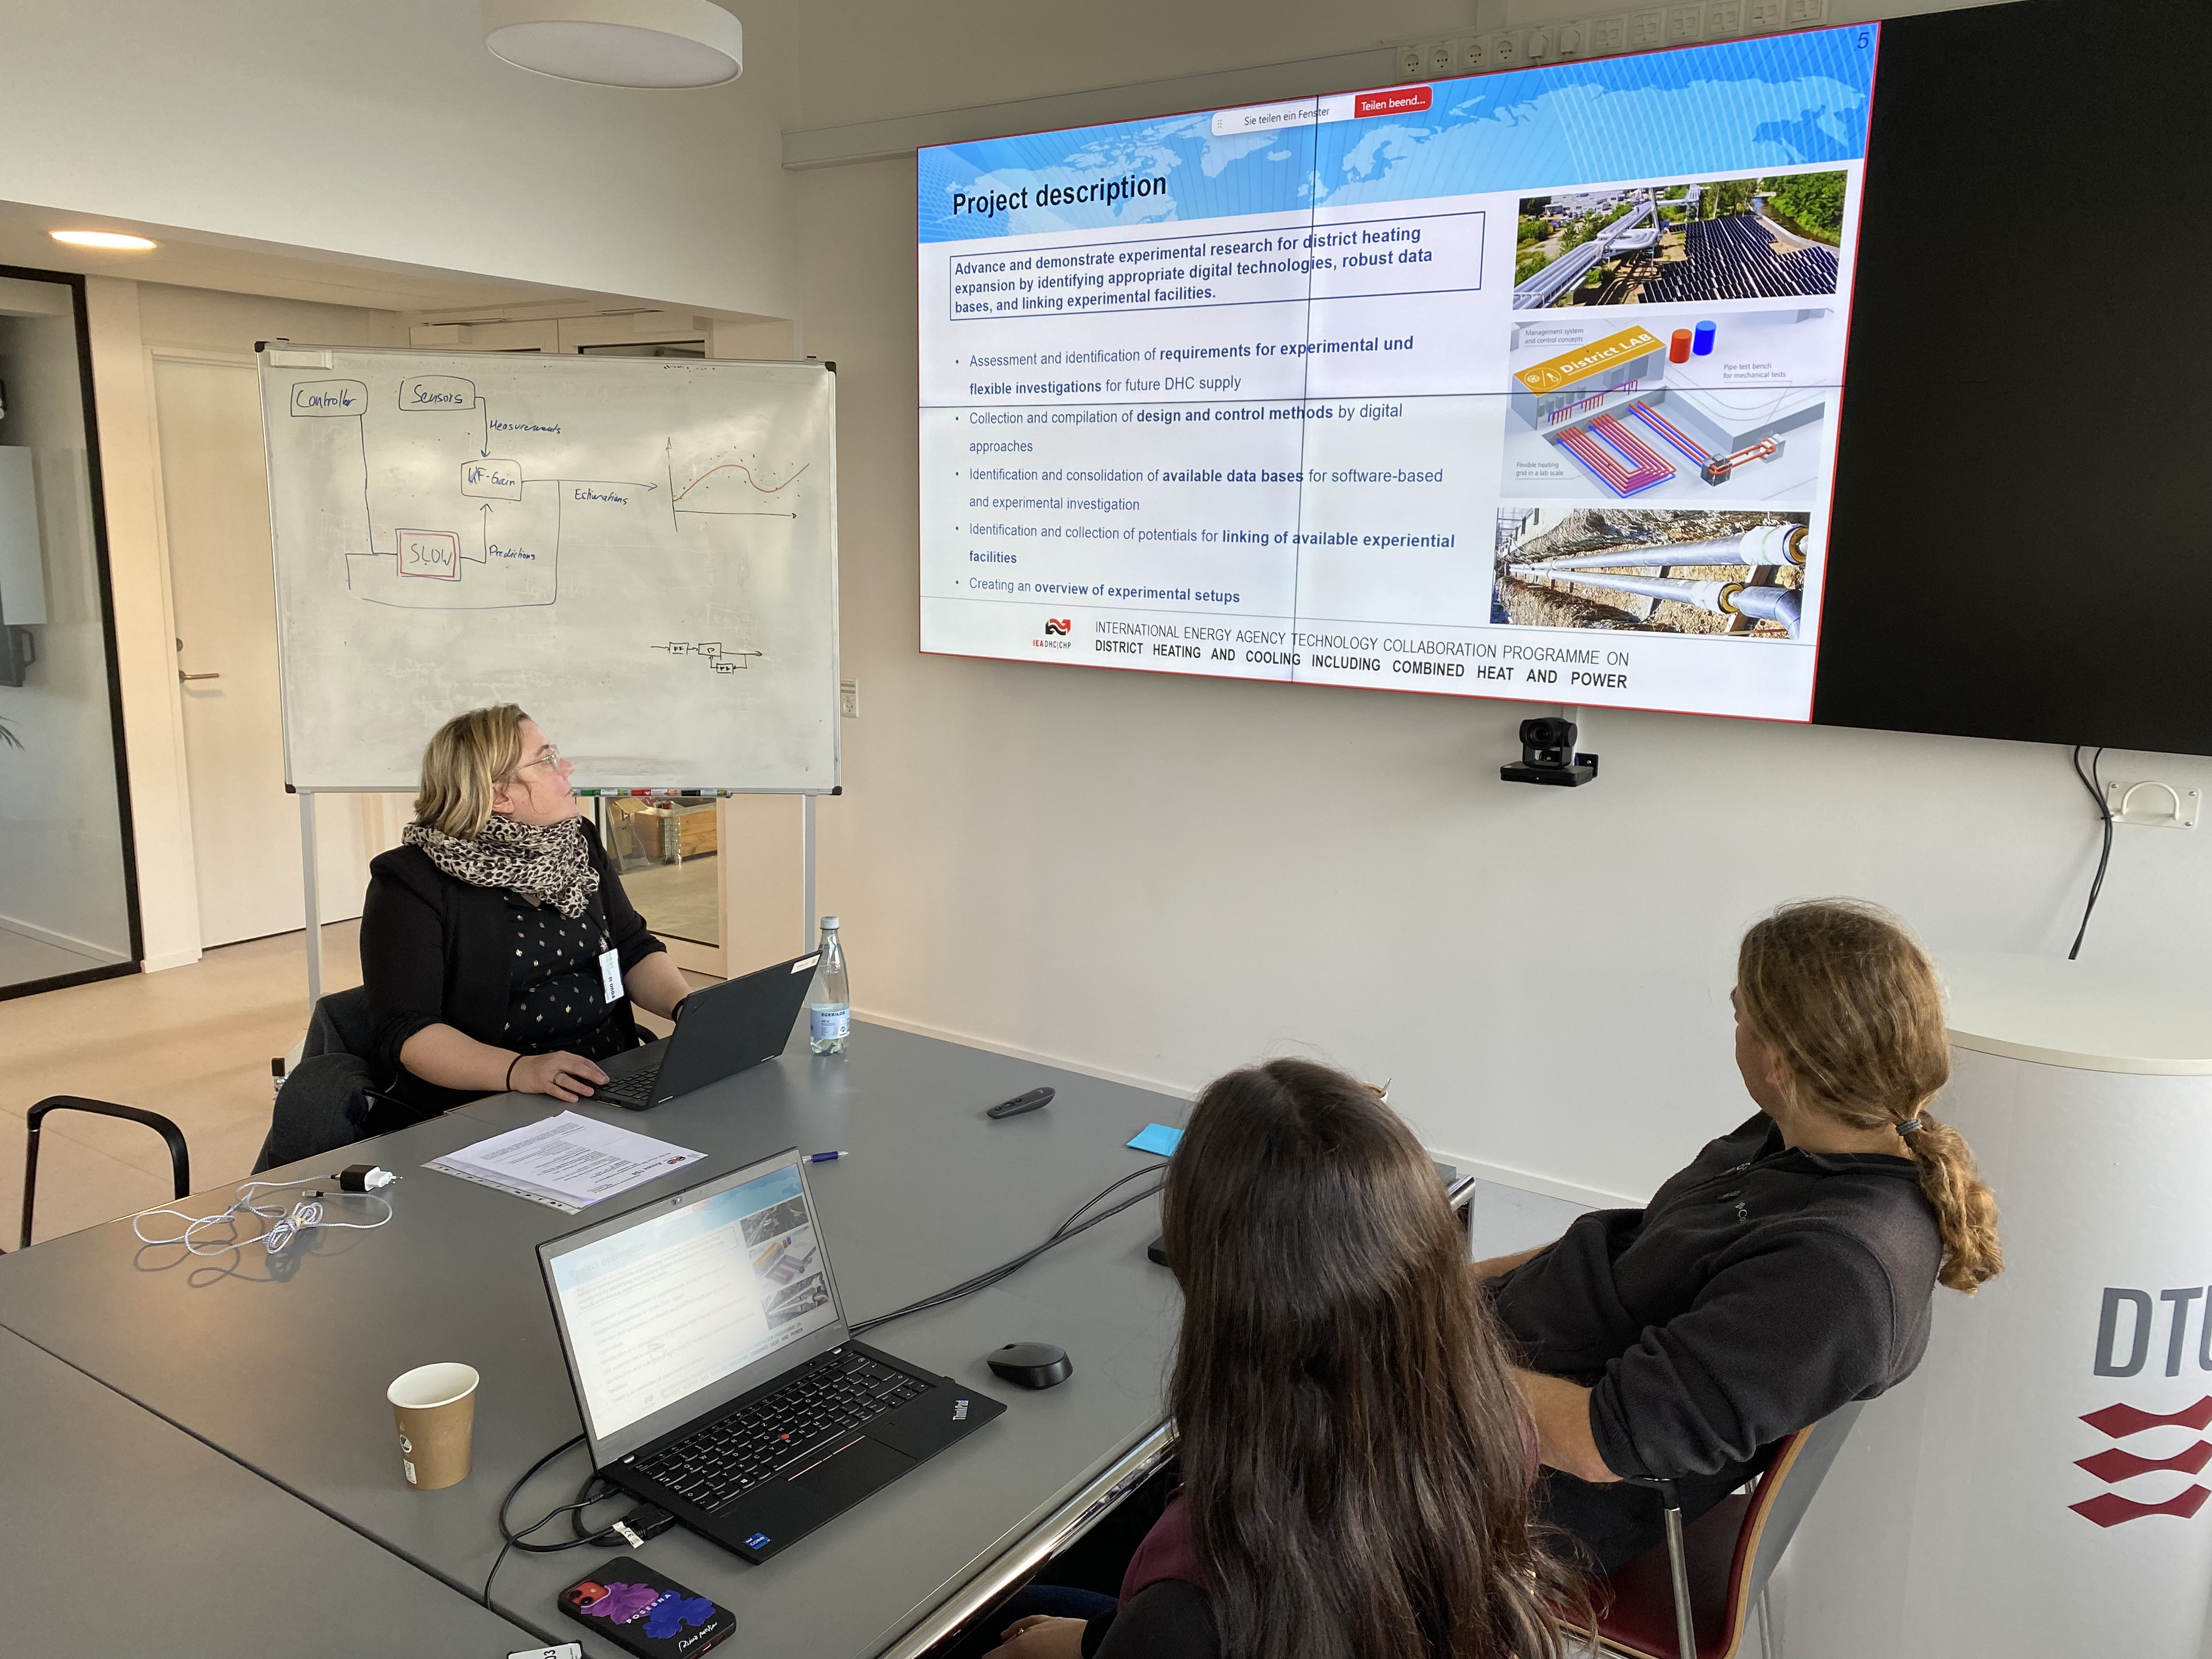
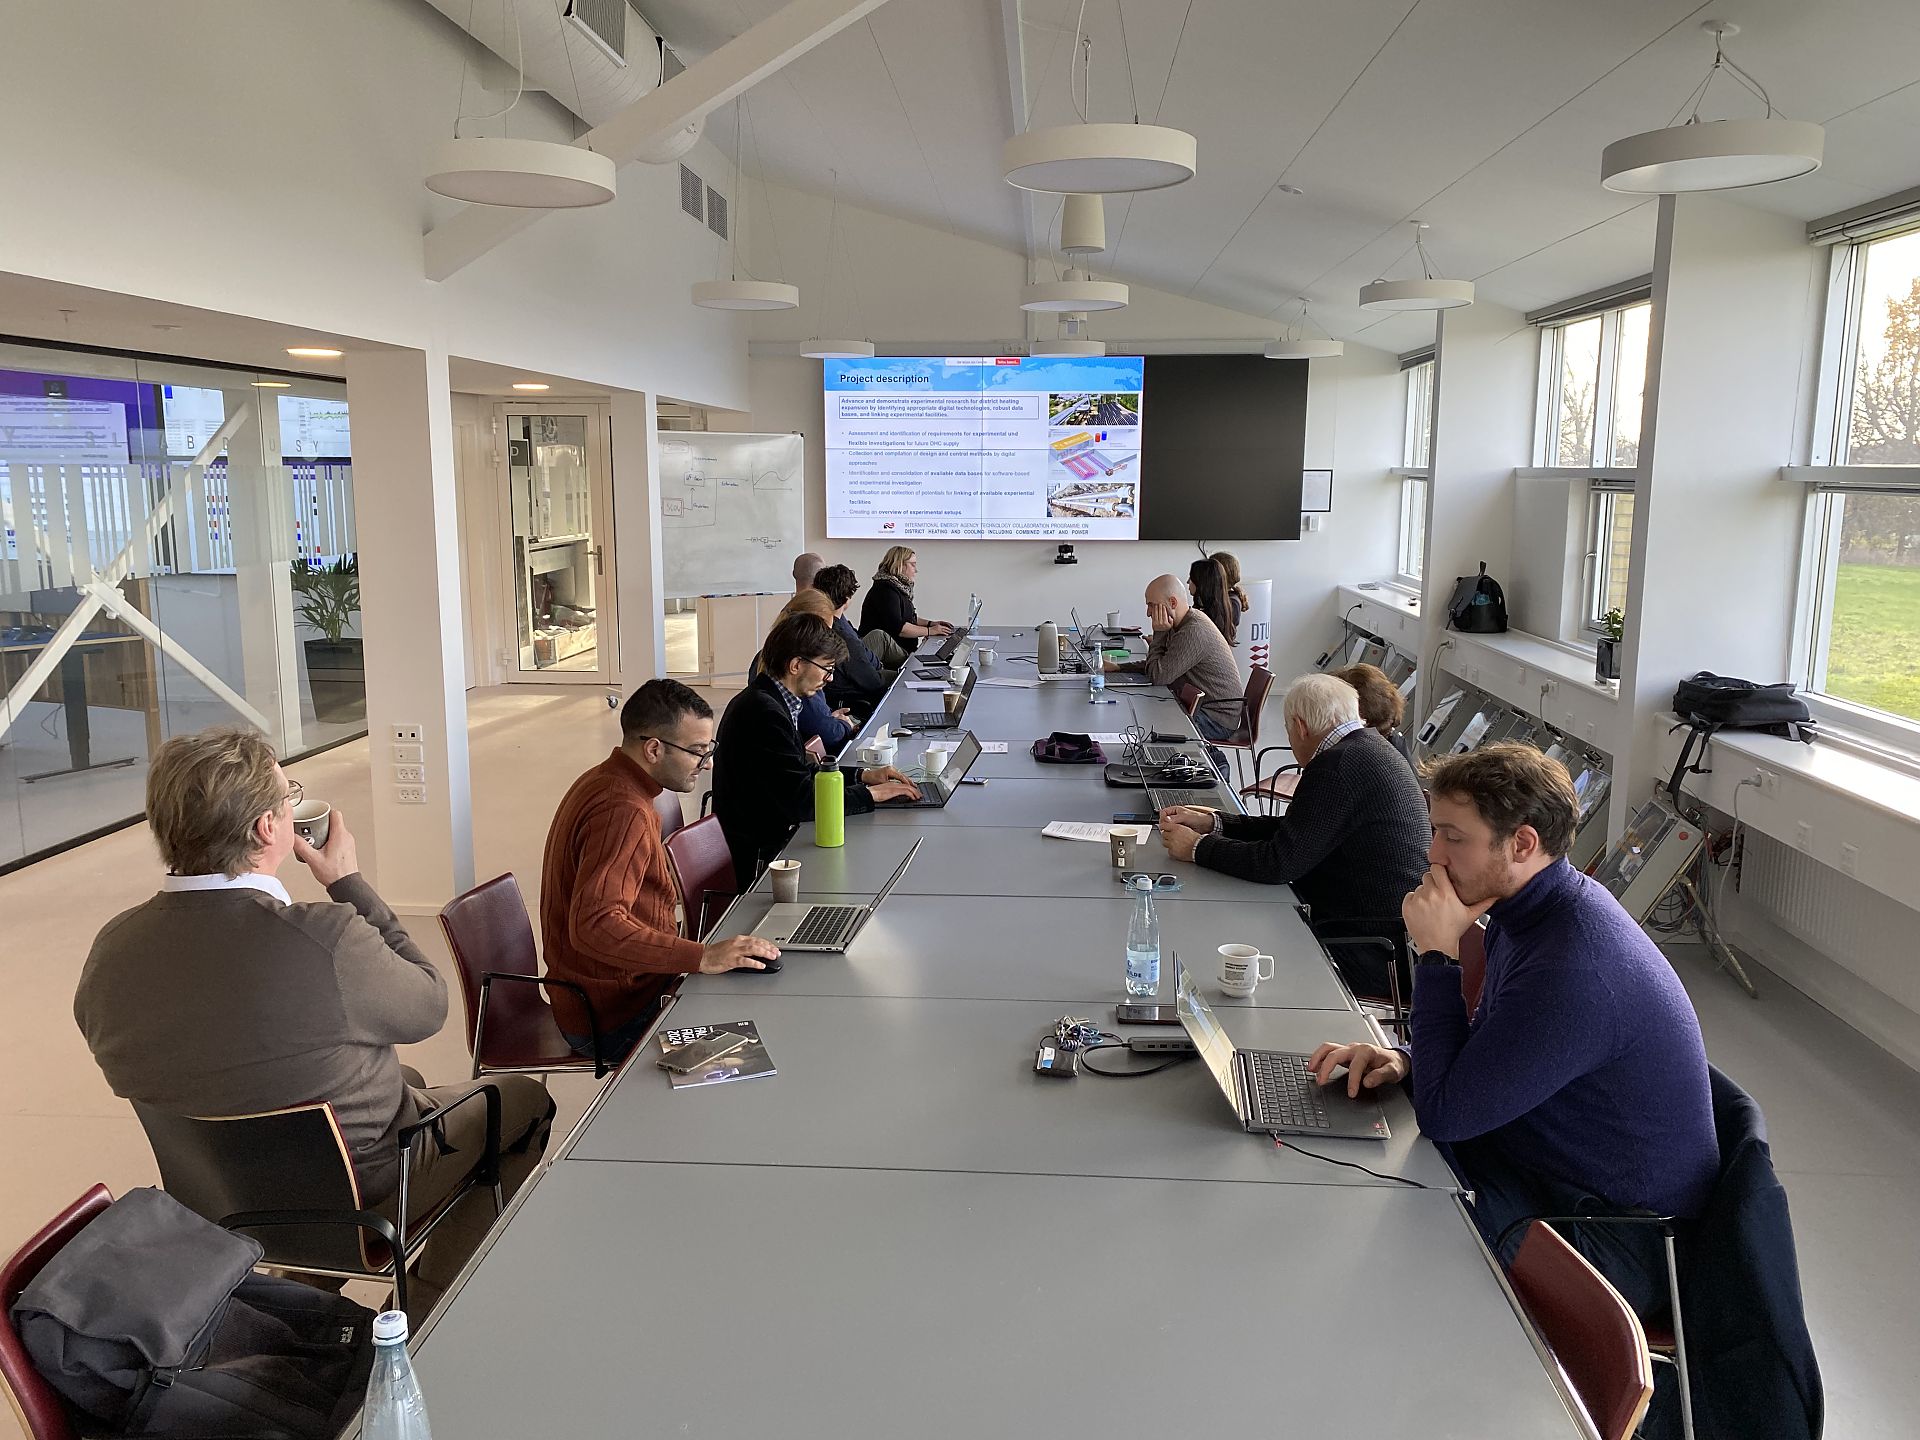
IEA DHC Annex TS8: 2. Working Phase Meeting (Picture 1/2)
The international cooperation in IEA DHC Annex TS8 also includes working meetings. The 2nd working meeting took place on 26/27 November 2024 at the DTU Risø Campus.
Copyright: Edmund Widl
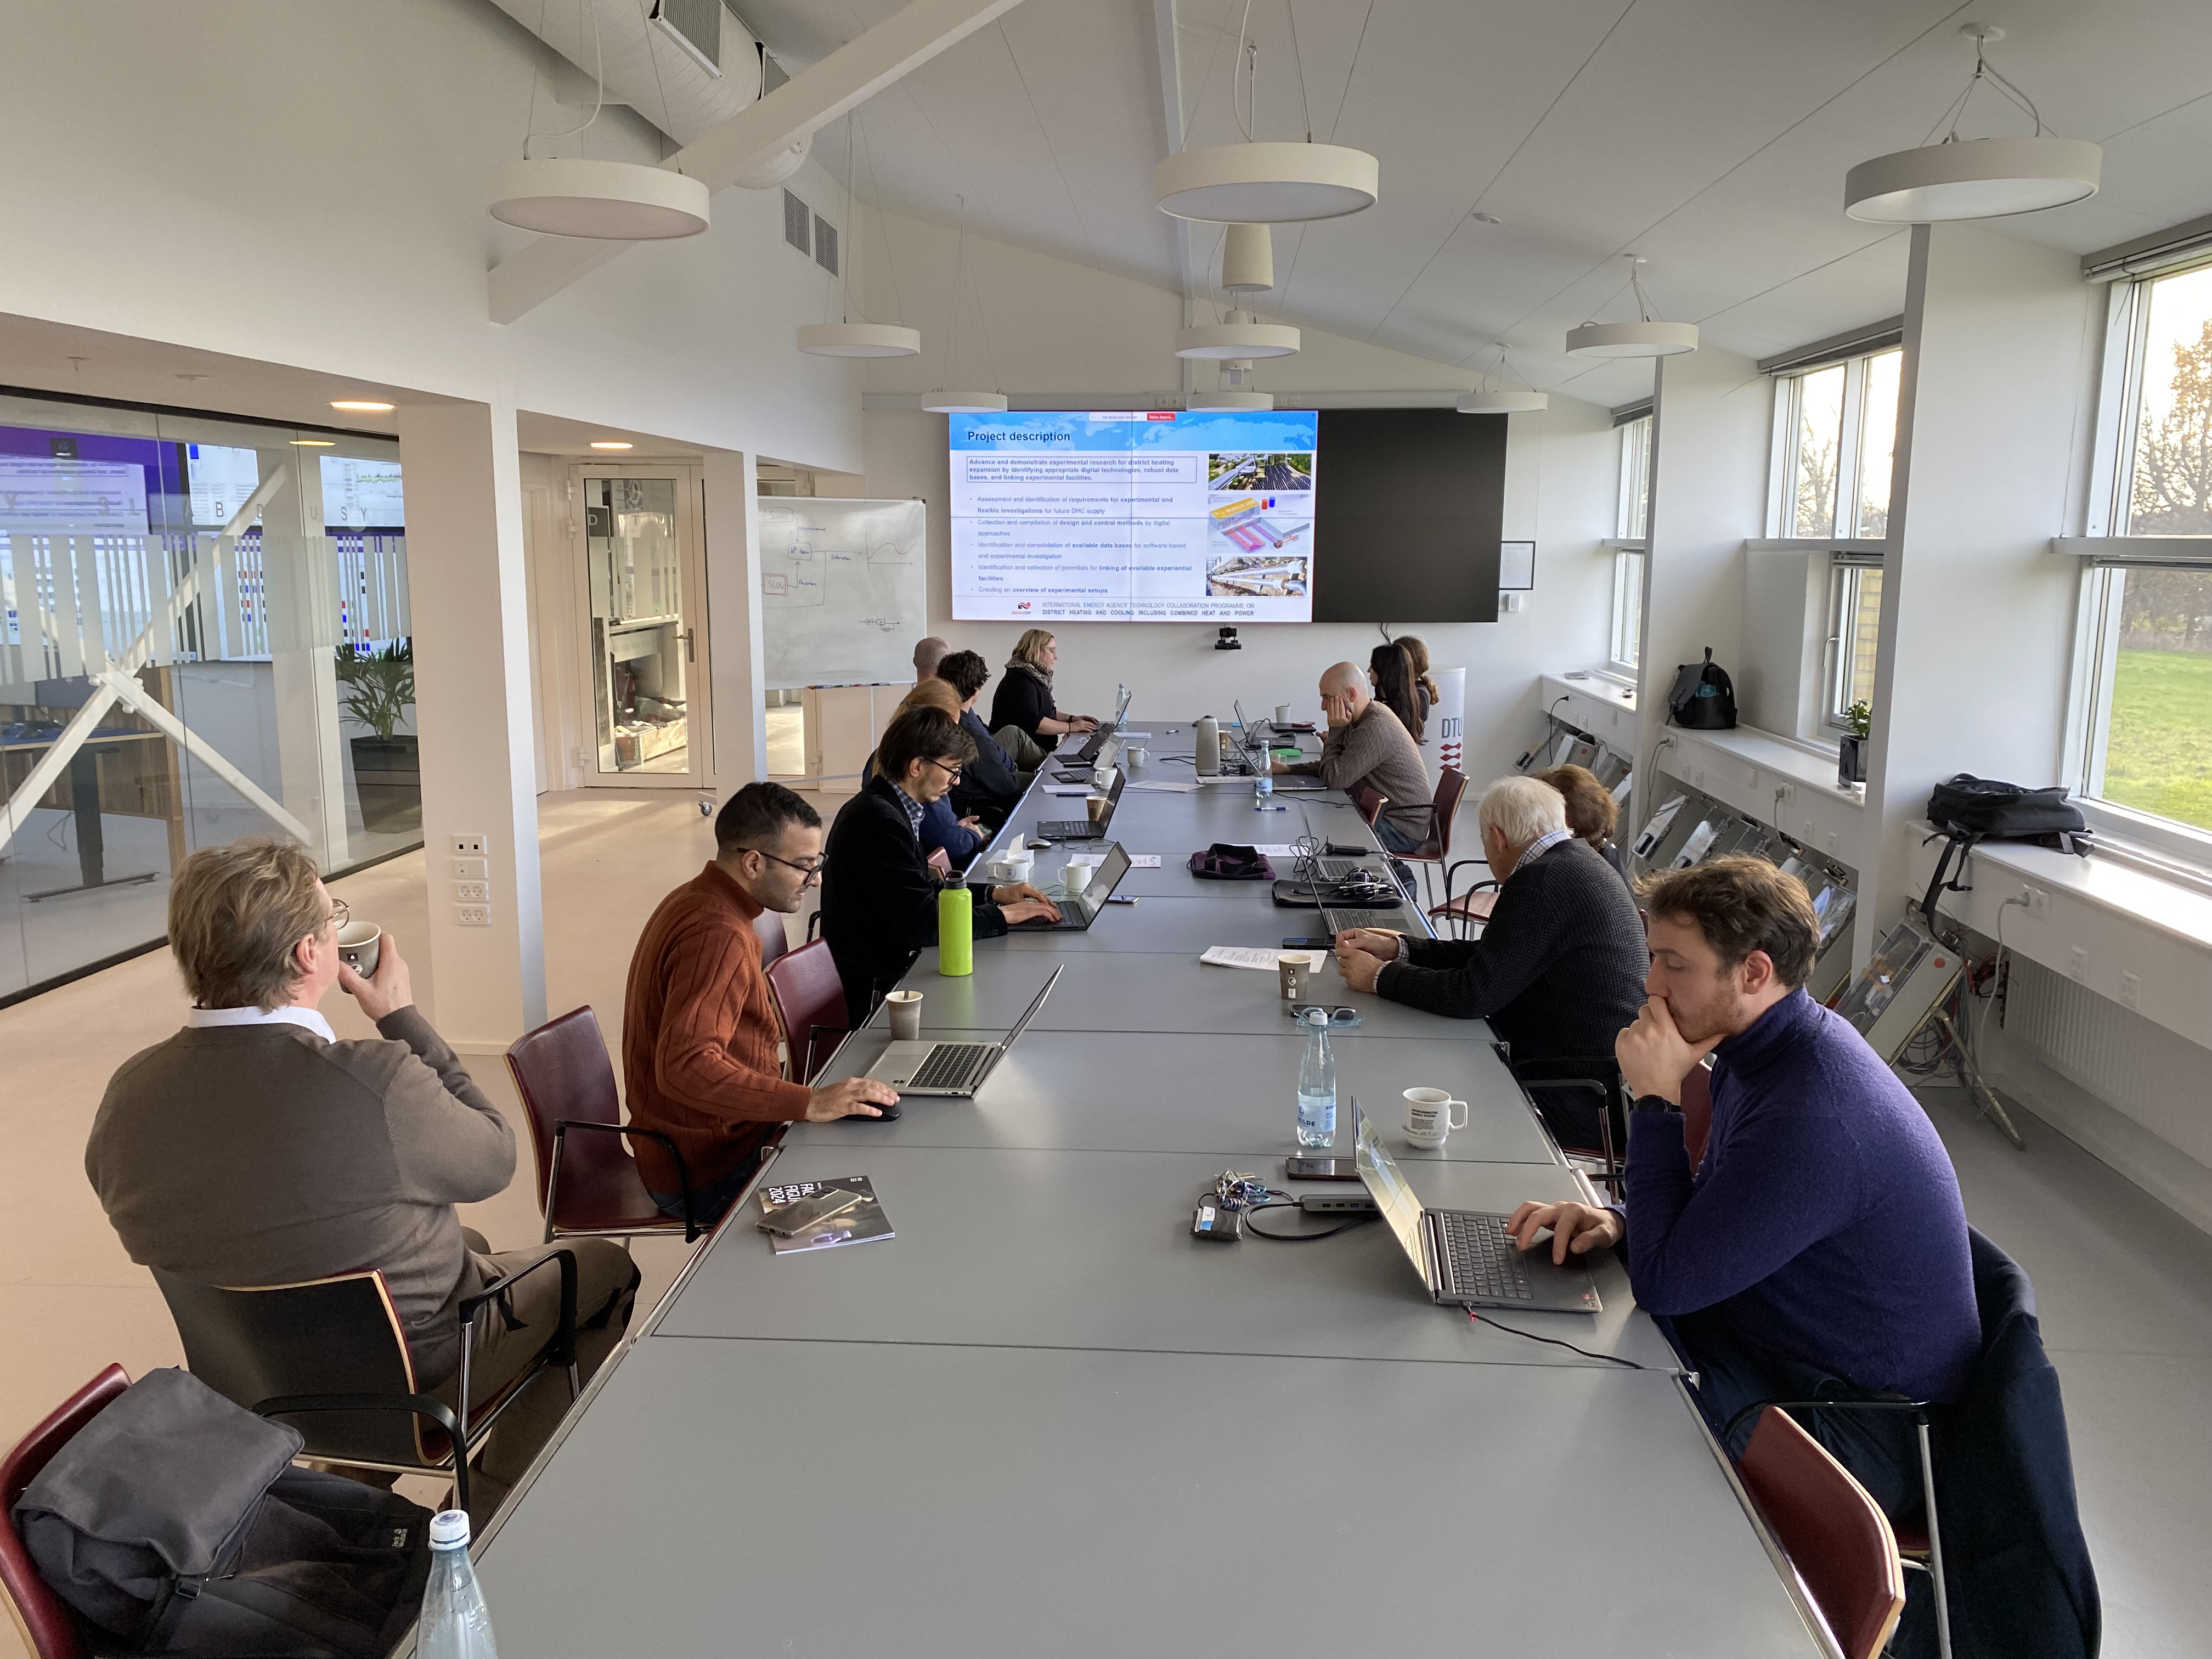
IEA DHC Annex TS8: 2. Working Phase Meeting (Picture 2/2)
The international cooperation in IEA DHC Annex TS8 also includes working meetings. The 2nd working meeting took place on 26/27 November 2024 at the DTU Risø Campus.
Copyright: Edmund Widl
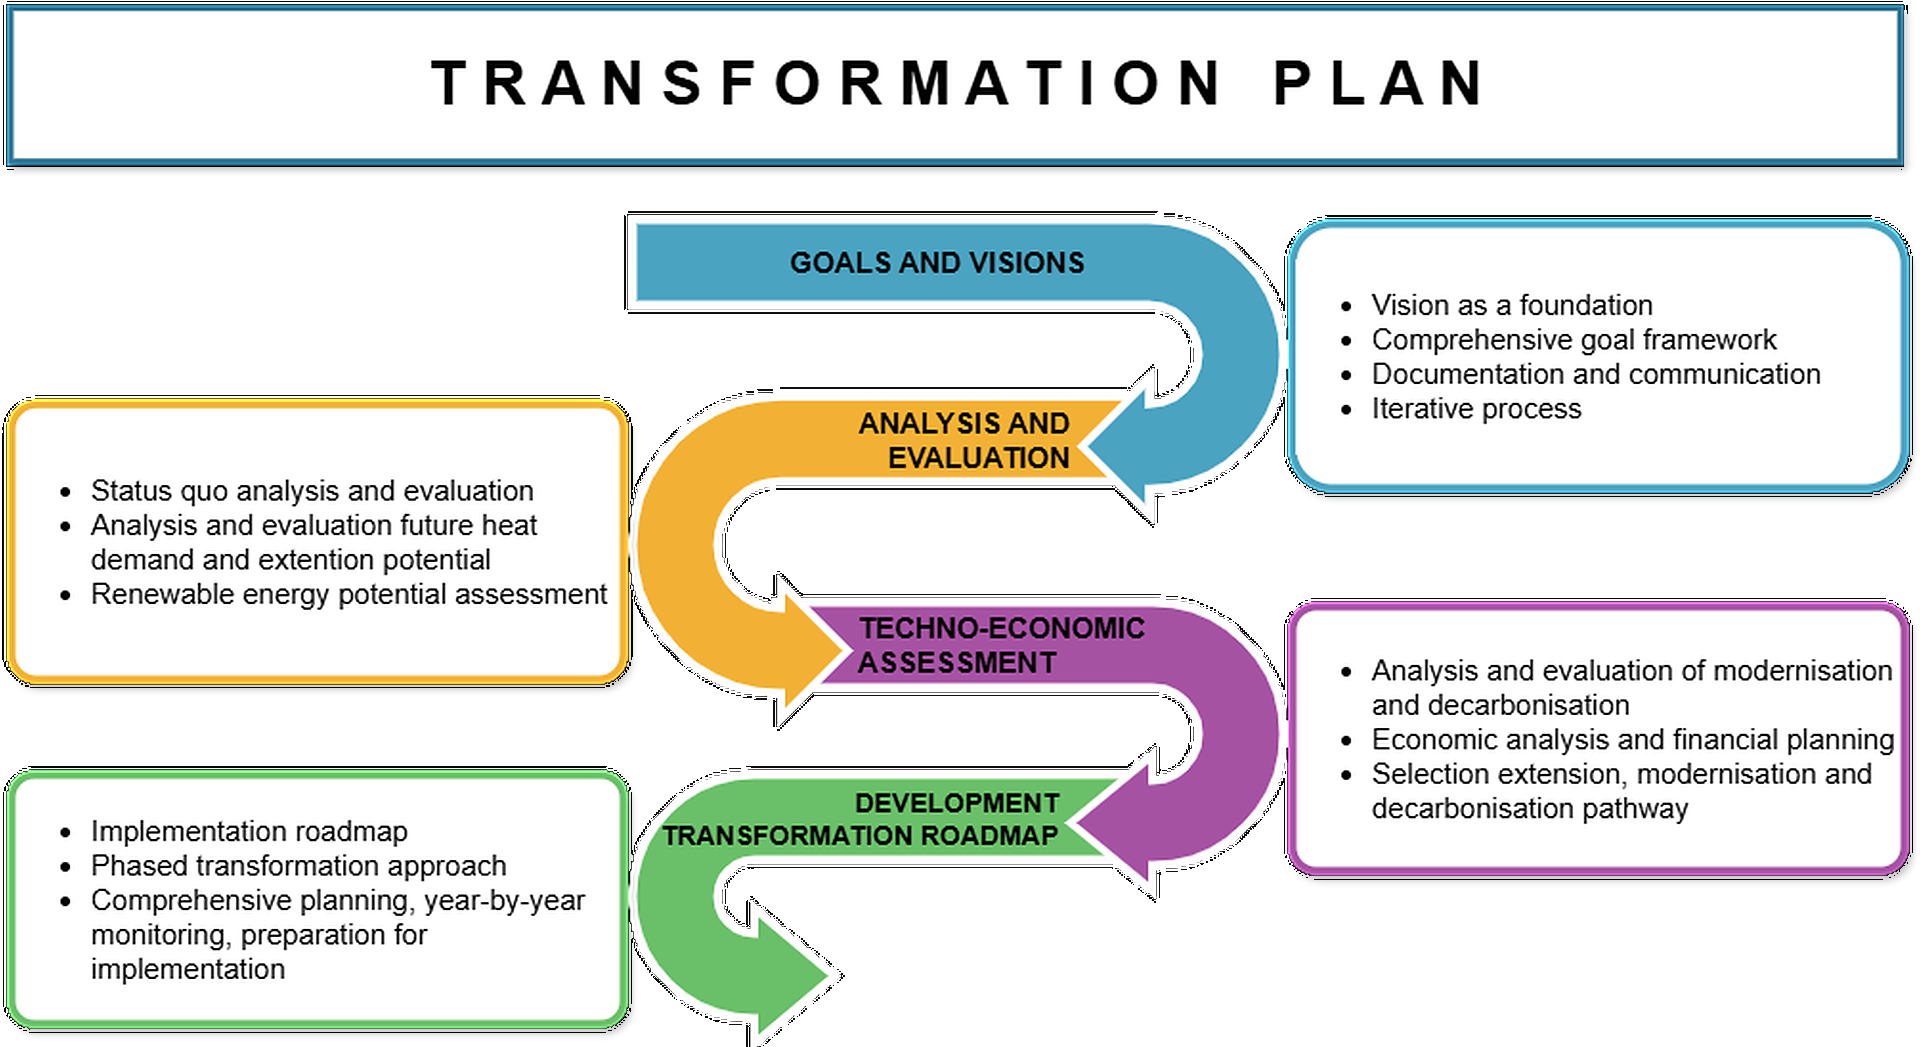
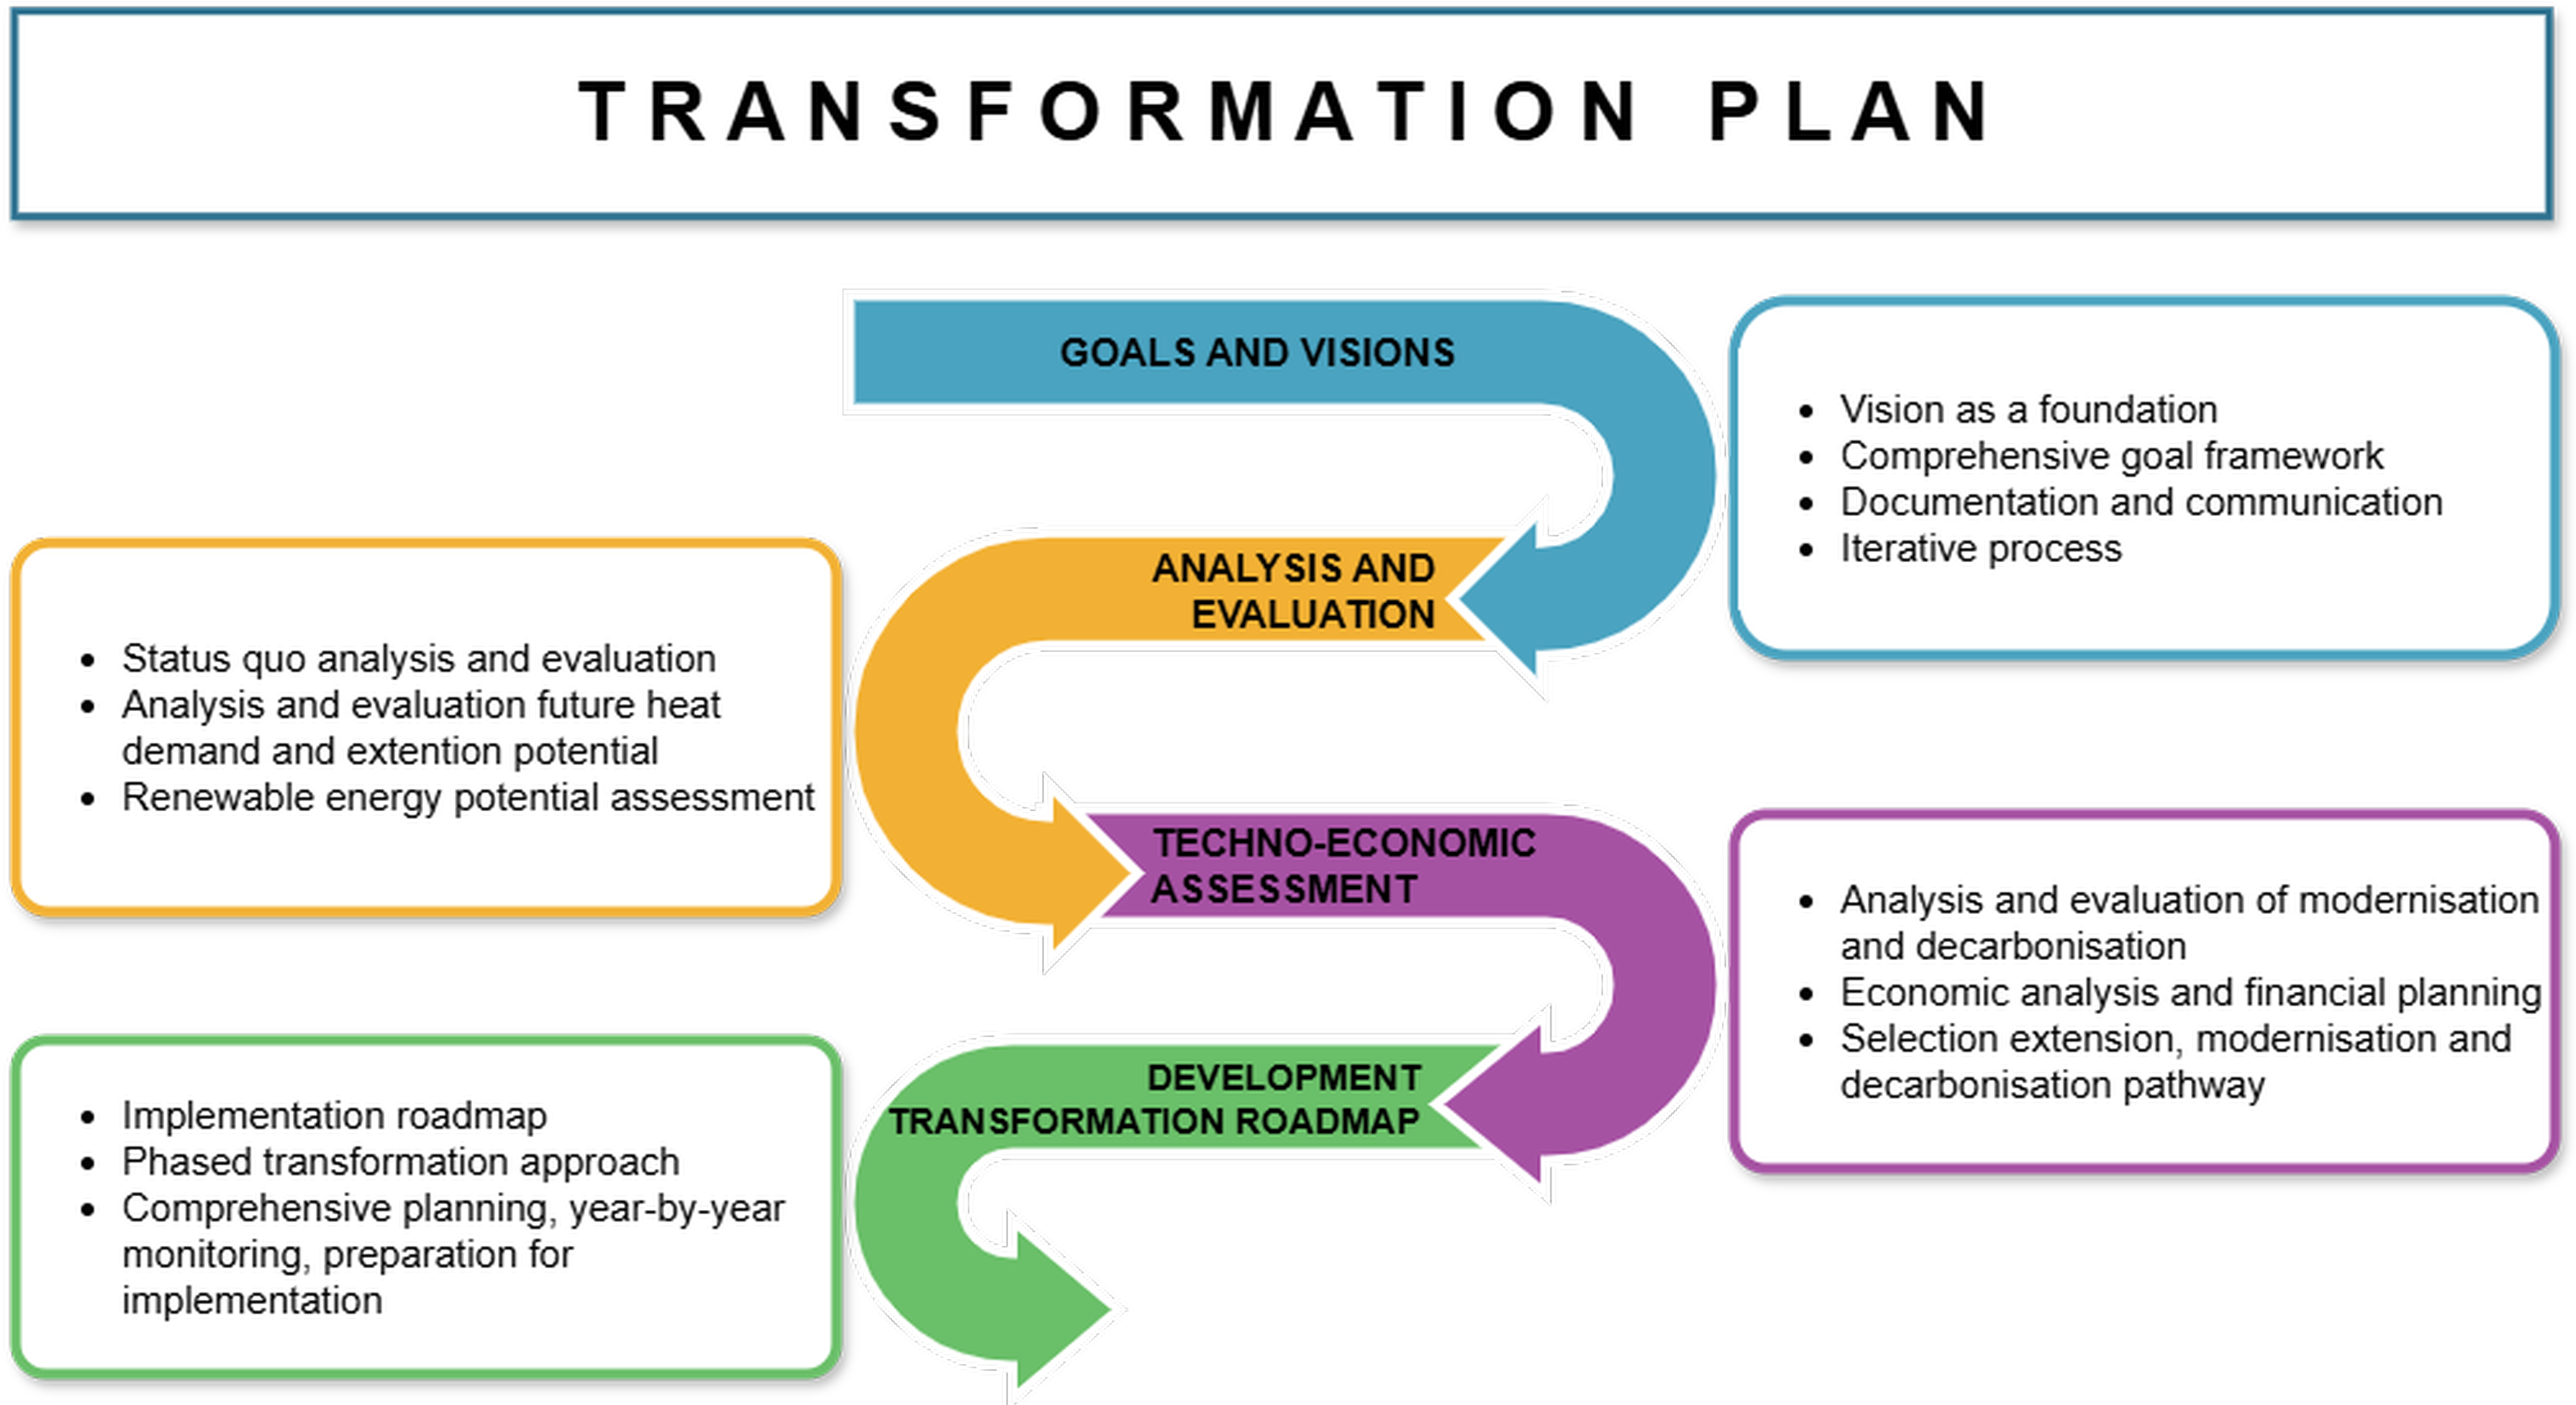
Overview transformation plan
Overview transformation plan
Copyright: AEE INTEC / Ingo Leusbrock
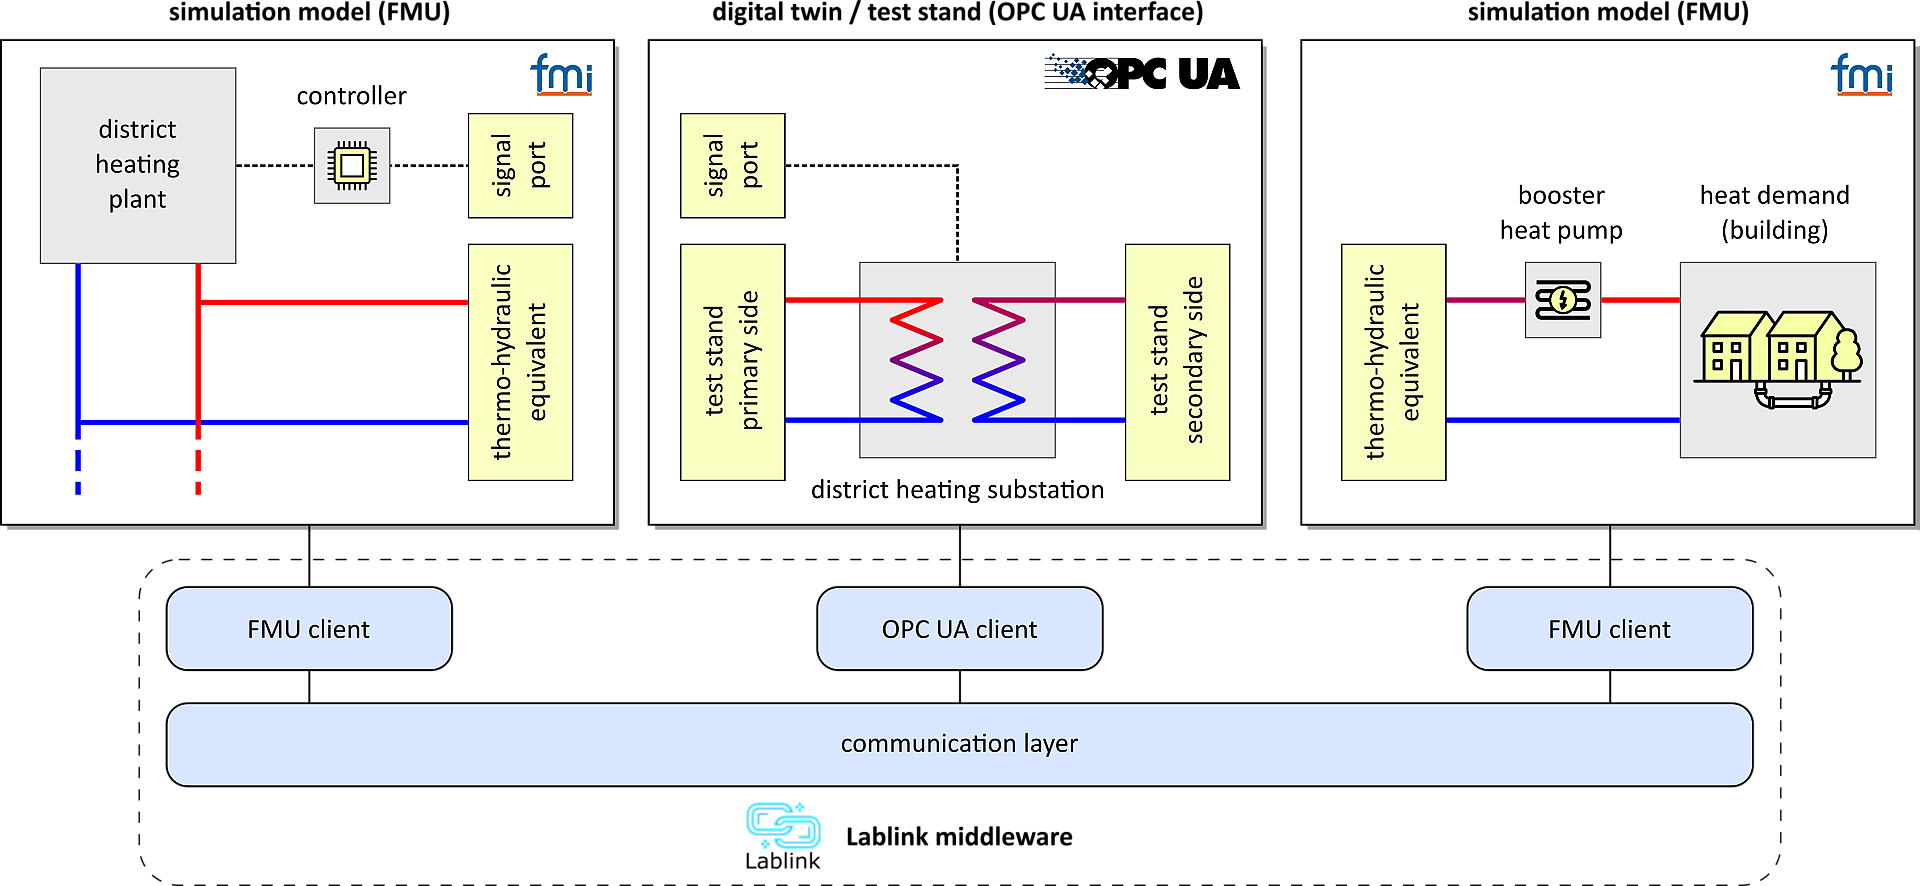
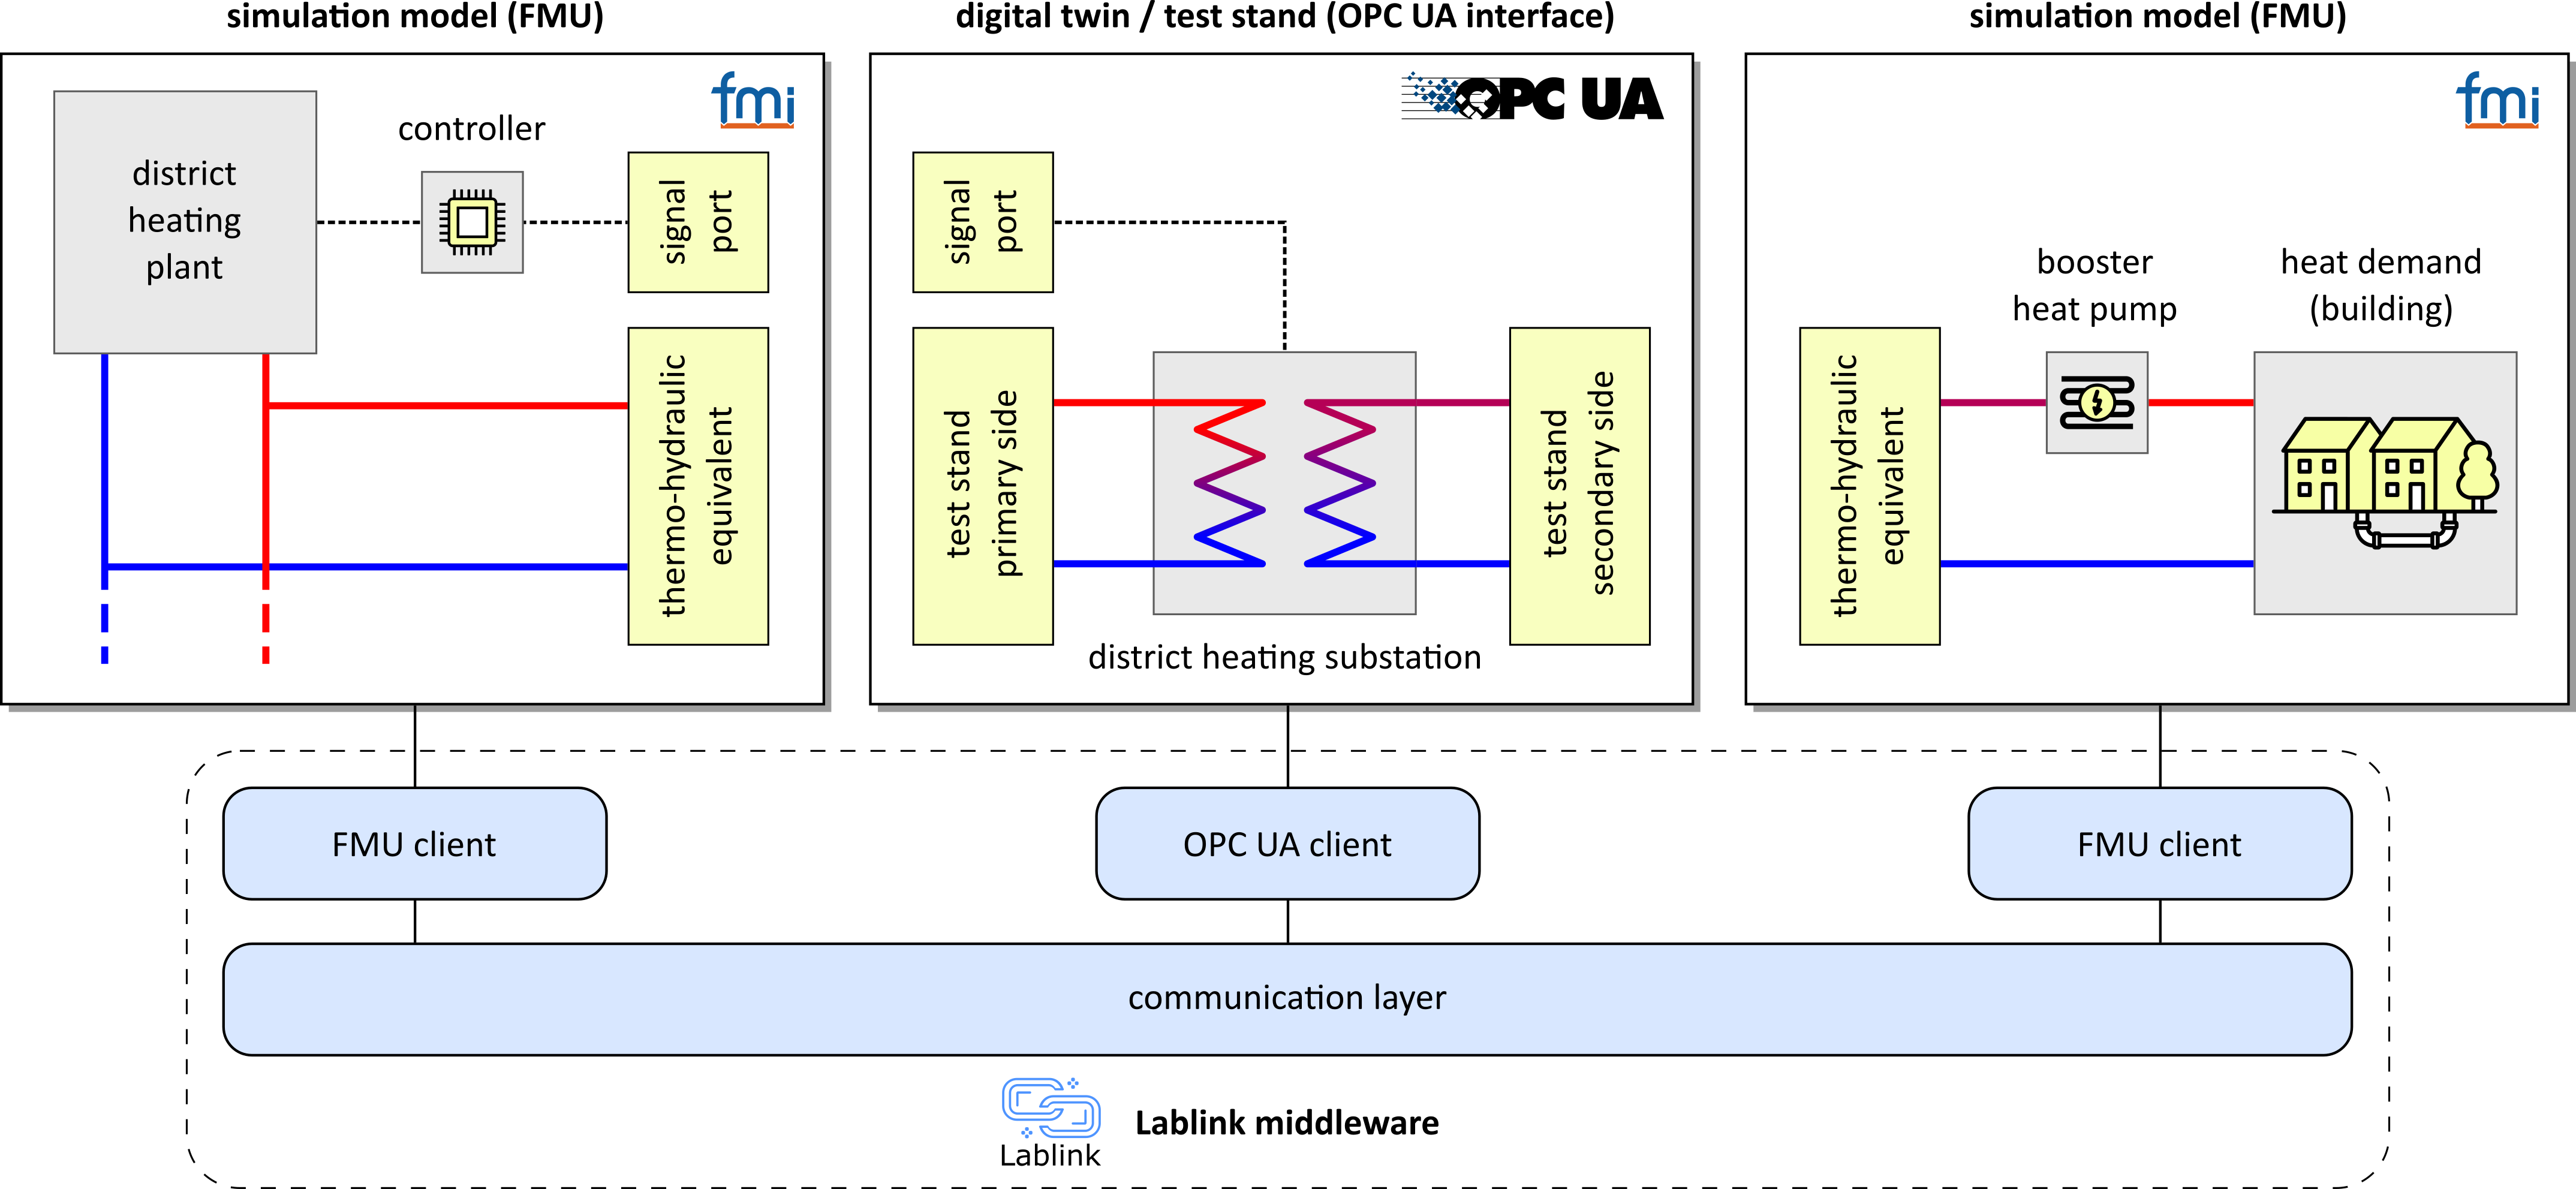
Digital Twins can serve as virtual components in lab setups.
Mapping of a proof-of-concept test case to the DigitalEnergyTestbed setup using the Digital Twin of the DH substation test stand.