Project Image Pool
There are 186 results.
Terms of use: The pictures on this site originate from the projects in the frame of the programmes City of Tomorrow, Building of Tomorrow and the IEA Research Cooperation. They may be used credited for non-commercial purposes under the Creative Commons License Attribution-NonCommercial (CC BY-NC).
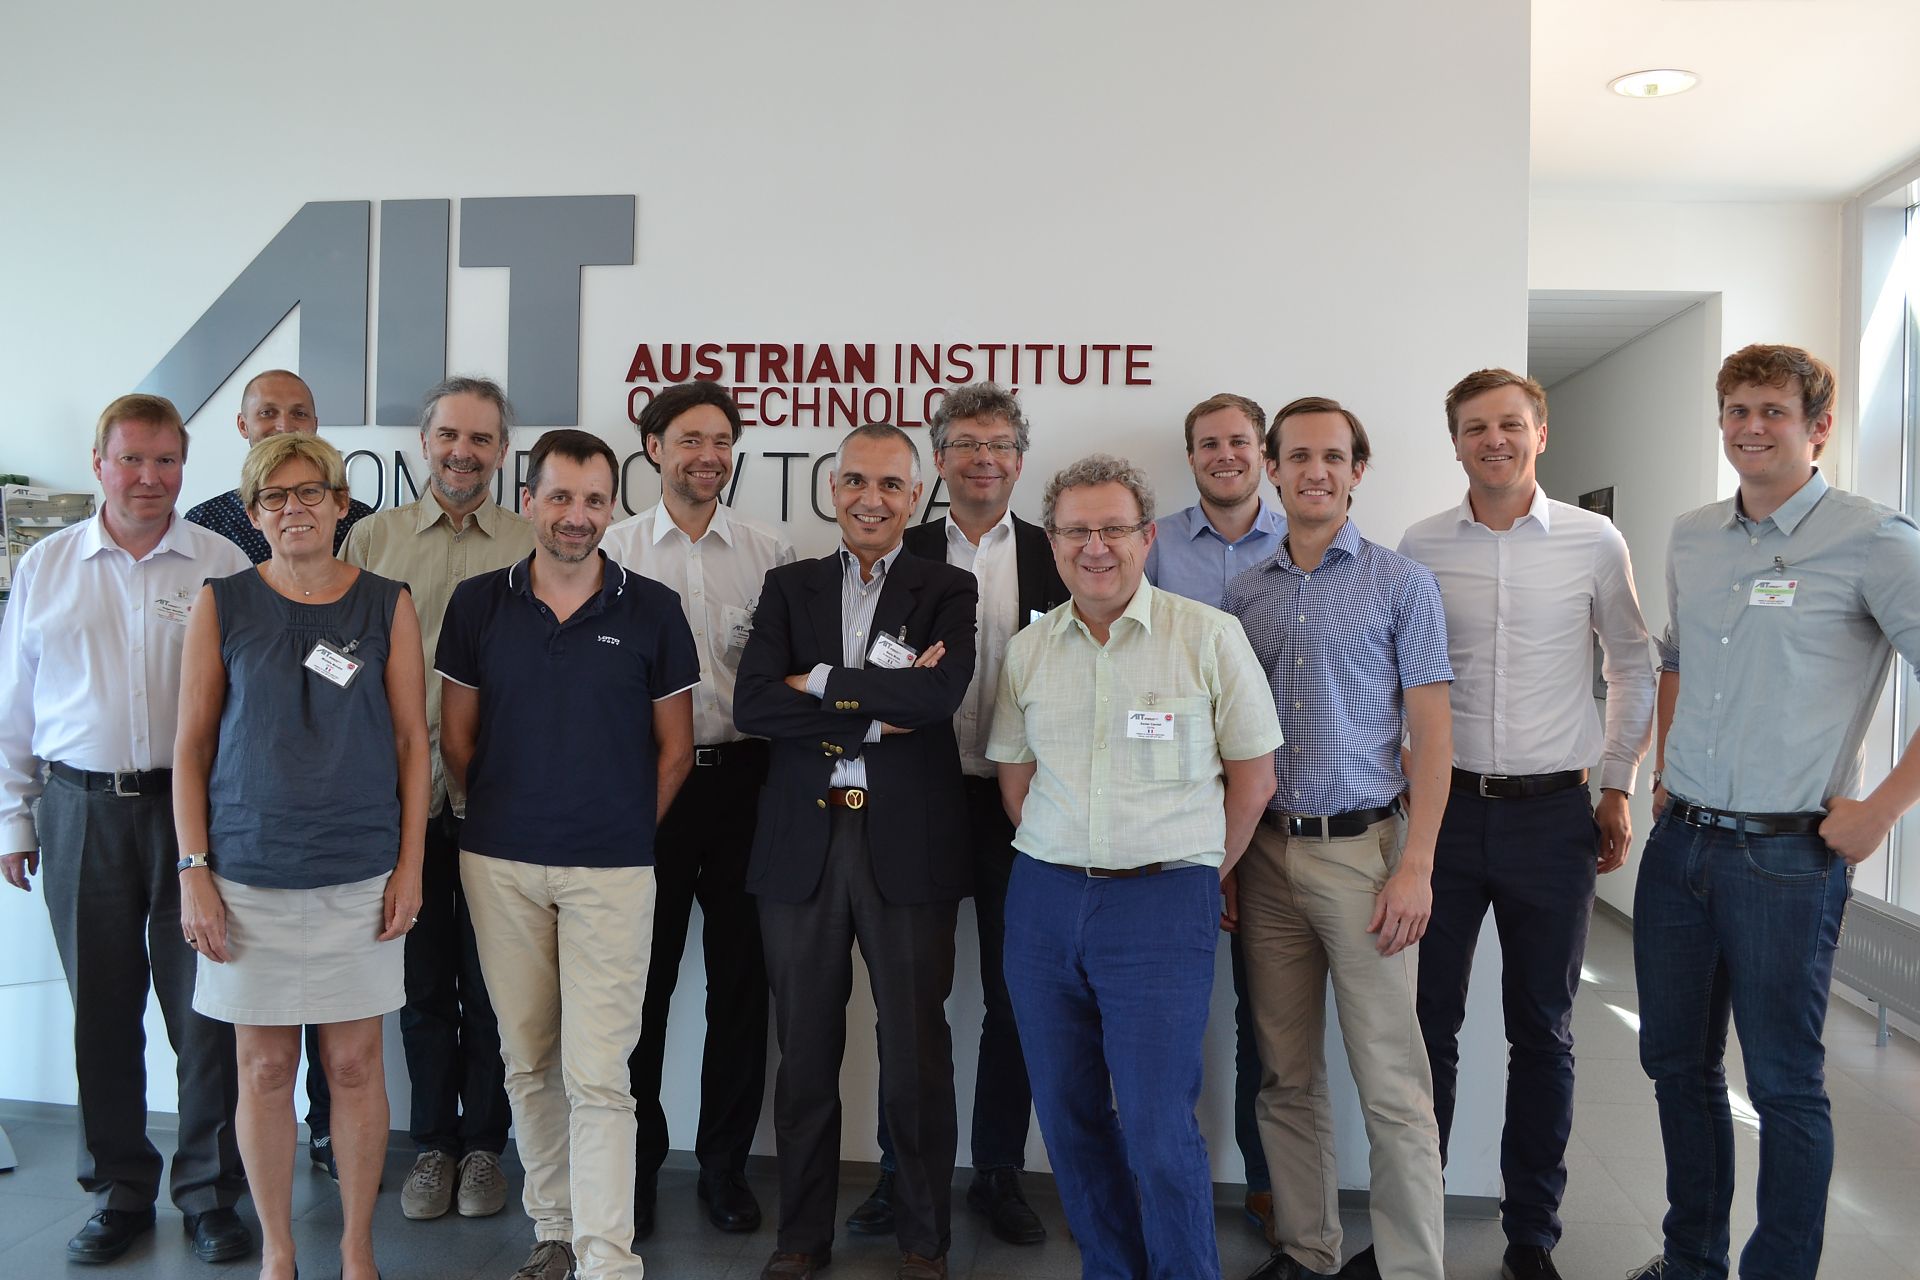
Group photo of the IEA HPT Annex 51 team
Group photo of the IEA HPT Annex 51 team at the kickoff meeting at AIT in Vienna from 20-21 June 2017.
Copyright: AIT, Österreich

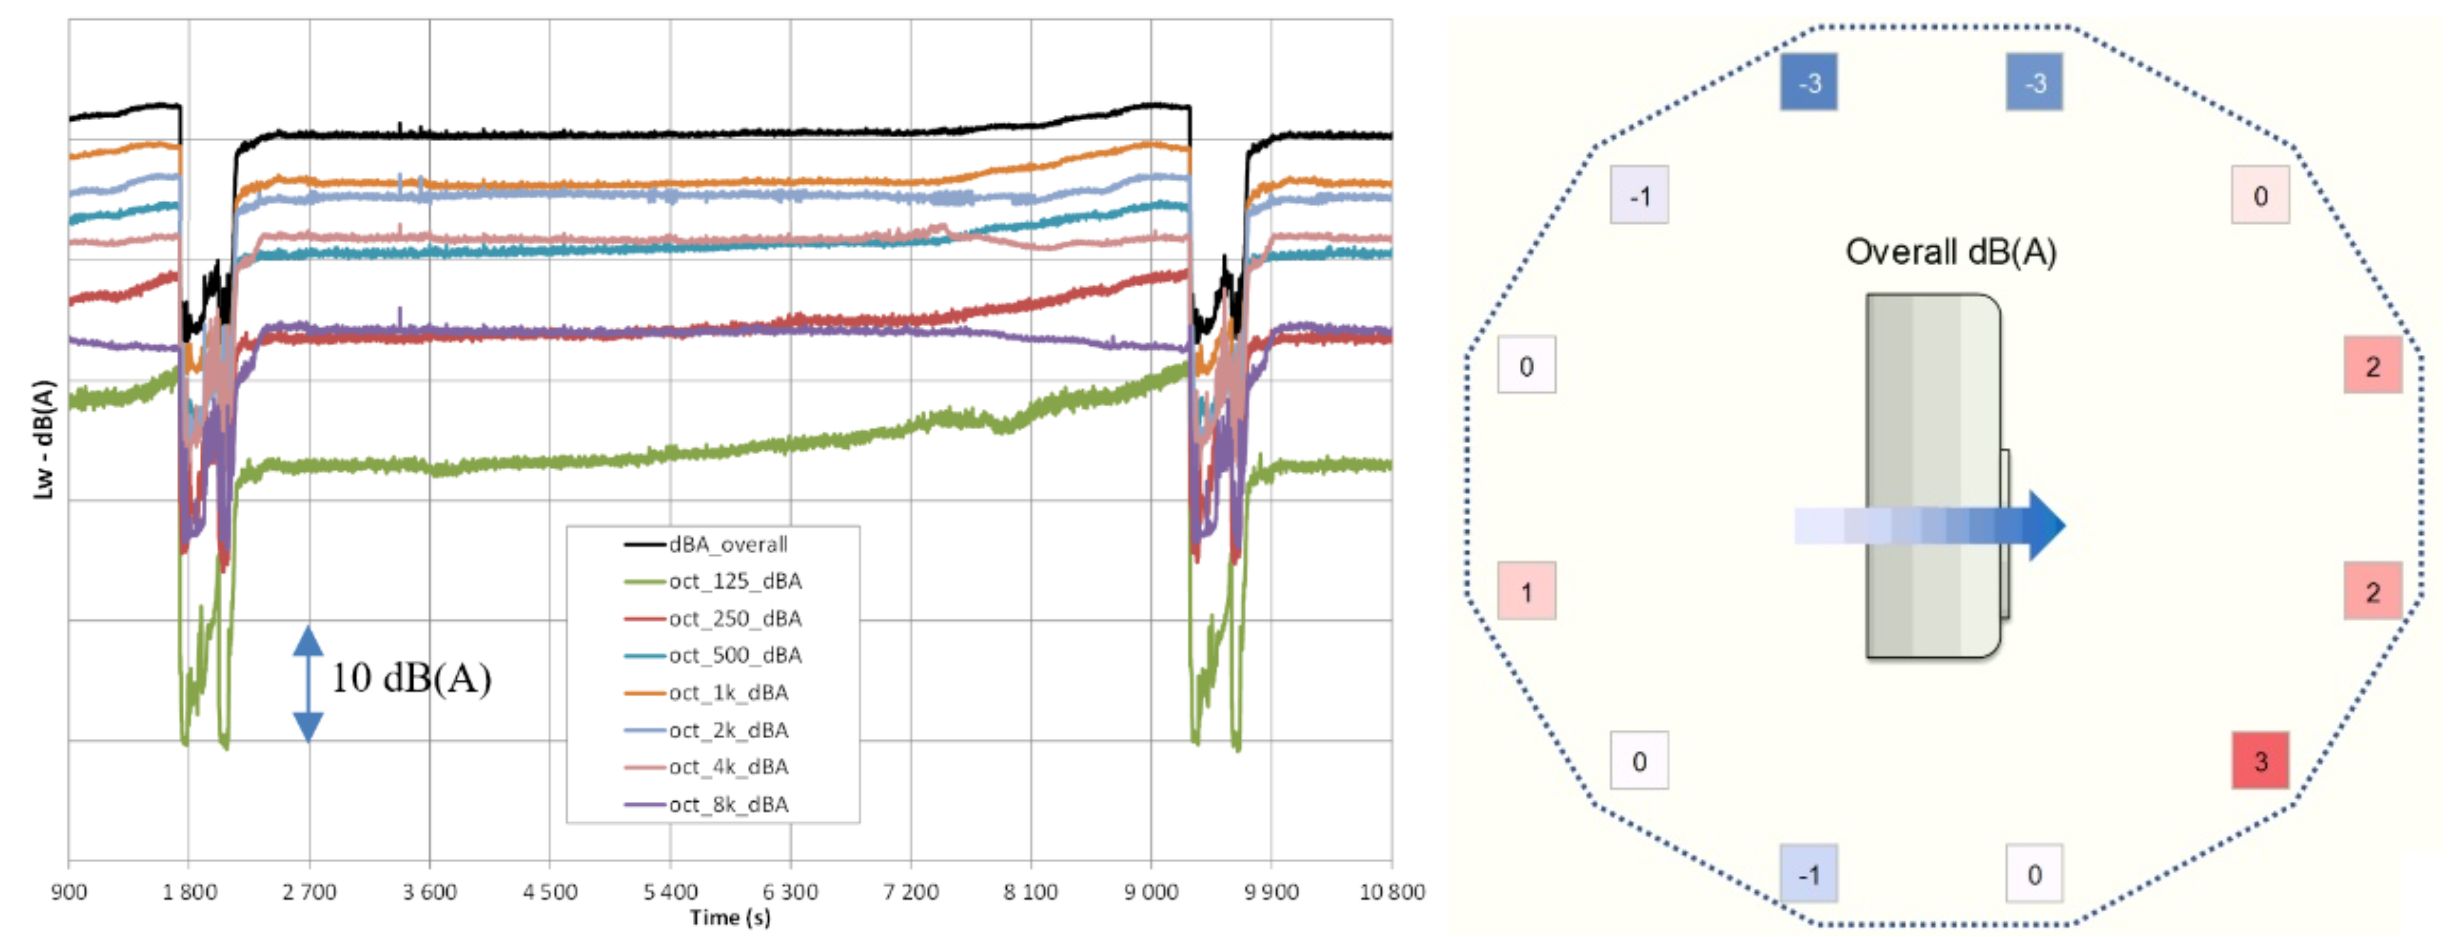
Time evolution of sound power level and radiation pattern
(left) Time-dependent A-weighted sound power level (in octave bands) between two de-frosting phases. (right) Directivity for the A-weighted total sound pressure level at a height of 75 cm.
Copyright: AIT, Österreich
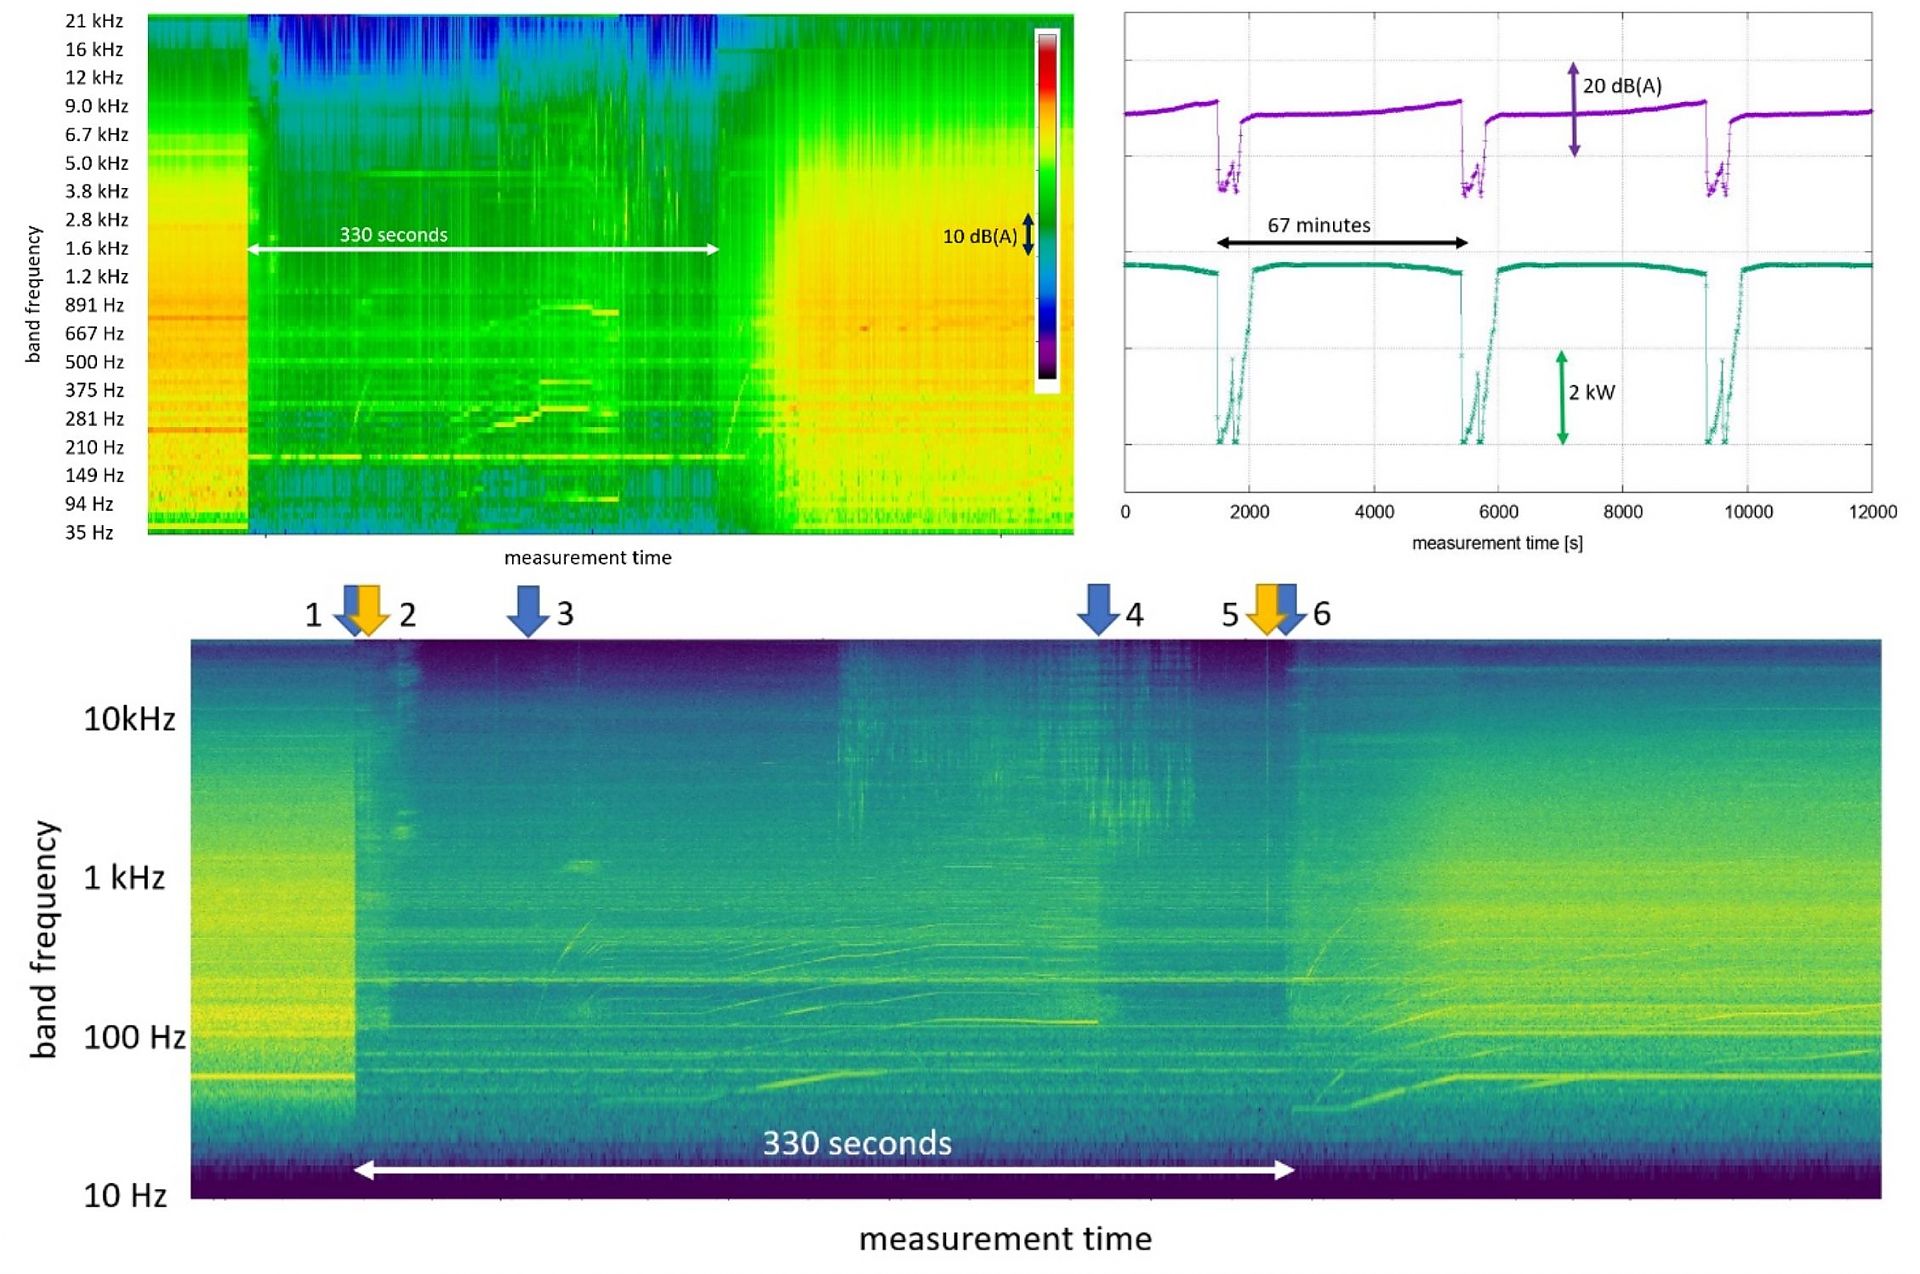
Acoustic signatus and time evolution of the sound power level during de-frosting
(top left) Frequency-resolved acoustic signatures (waterfall representation) during defrosting of an air-to-water heat pump. Time-resolved sound power level in third-octave band representation. (bottom) Time-resolved sound pressure level at a selected microphone position in narrow-band representation. (top right) A-weighted sound power level and electrical power consumption of an air-to-water heat pump with multiple defrost cycles.
Copyright: AIT, Österreich
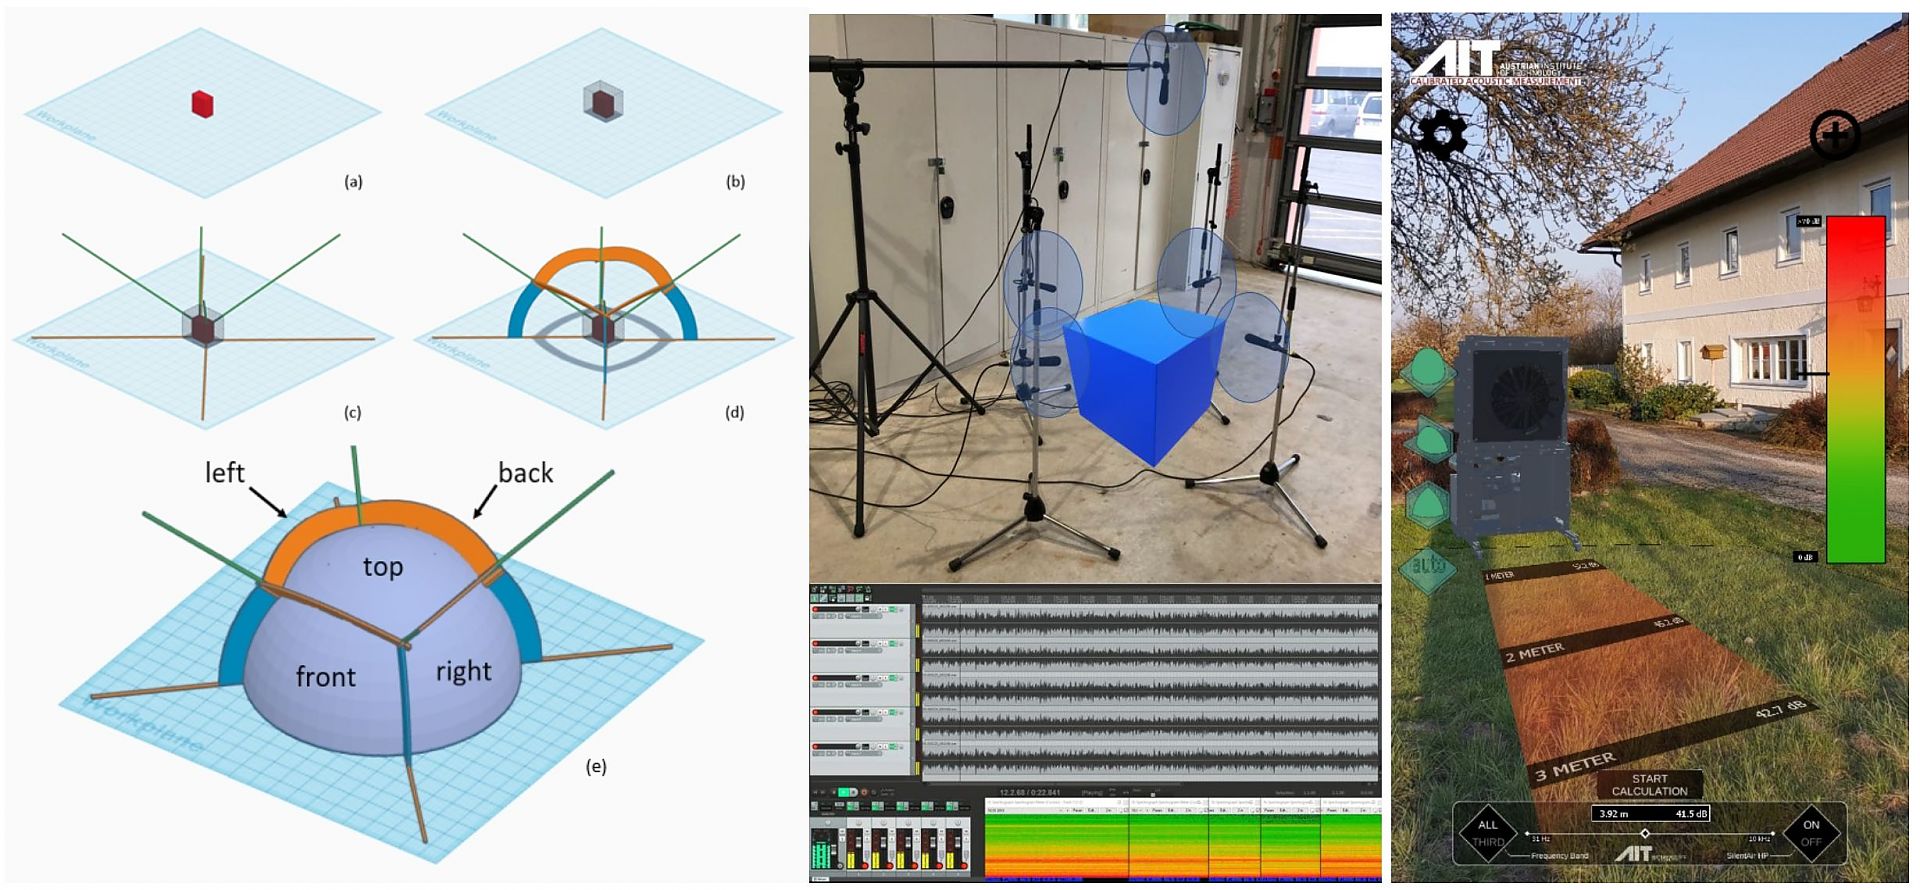
Acoustic App
(left) Visualization of the directivity measurement procedure: (a) the red box represents the sound-emitting HVAC component (e.g. heat pump); (b) sound pressure is recorded at a certain distance from the emitting surfaces at 5 locations - a measurement surface is created; (c) beams are created connecting the corners of the emitter to the corners of the measurement surface; (d) parts of the planes spanned by these beams intersect with a sphere; (e) final visualization of the 5 parts of the hemisphere associated with the 5 microphone measurement positions. (middle) 5 microphones are placed around a sound emitting object, one on each side and one from above. The lower part of the image shows the five signals and their corresponding frequency content in waterfall diagrams. (right) A laboratory heat pump (SilentAirHP) in a real environment with AR, with frequency dependent sound propagation.
Copyright: AIT, Österreich
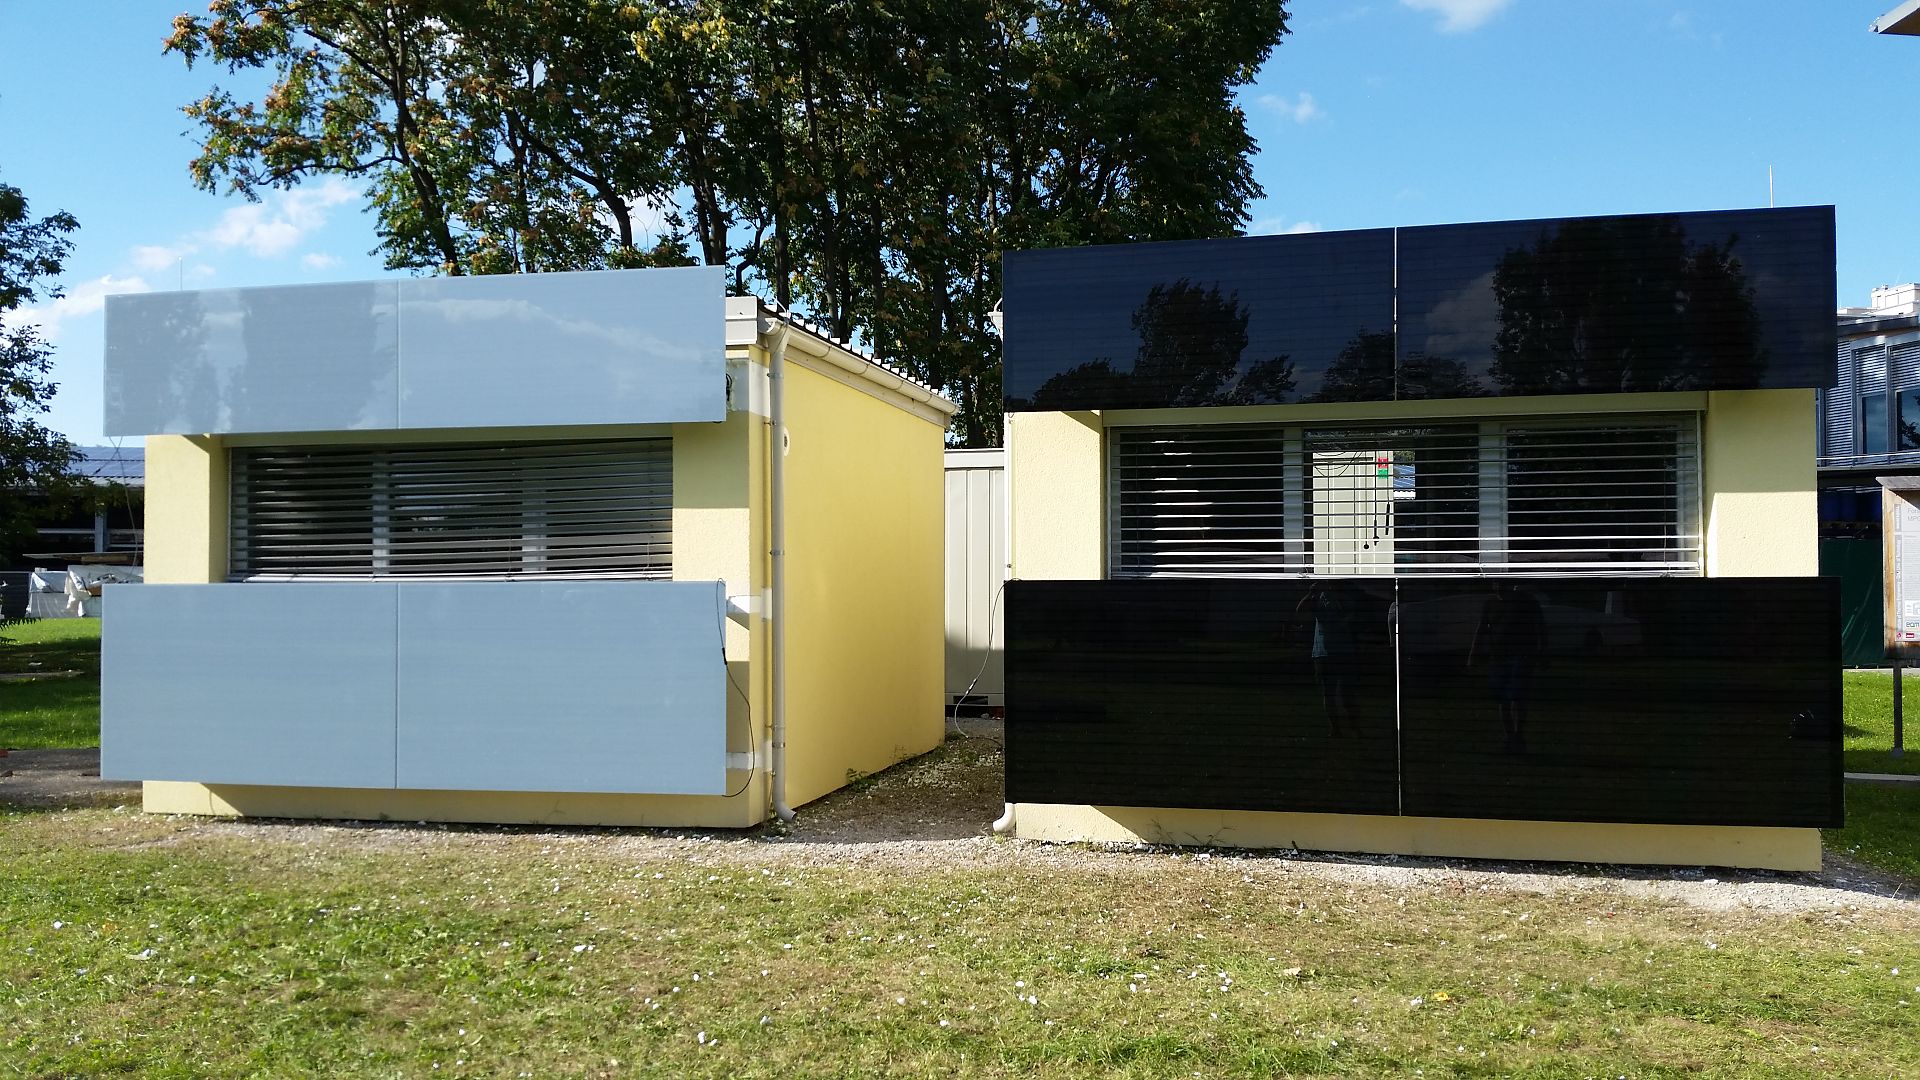
Test objects with photovoltaics from the south, left: unconditioned, right: conditioned with the COOLSKIN system
Two identical test buildings are available on the campus of Graz University of Technology, which have an almost identical thermal behaviour. The functional model of a PV-powered façade-integrated cooling and heating system developed in the COOLSKIN project was installed in one of the buildings, the second remained unconditioned. The developed system was successfully tested in a 1.5 year monitoring period.
Copyright: TU Graz

nZEB office building Post am Rochus
The building owner’s goal was to design, build and use a modern, comfortable building. The building development process aimed to have very high standards of sustainability and energy efficiency in achieving, commissioning and operation. Therefore, the construction project was supported by research experts from the Austrian Institute of Technology (AIT). The overall objective of the research project was to shorten the commissioning phase by detailed investigation and optimisation of the control strategies of the building services engineering. Through the application of integral planning, construction/operating companies were brought together with experts. The results were clearly documented and control strategies were hardware tested in advance so that malfunctions could be detected, avoided and eliminated.
Copyright: Fotos by Chrisitan Stemper für Österreichische Post AG
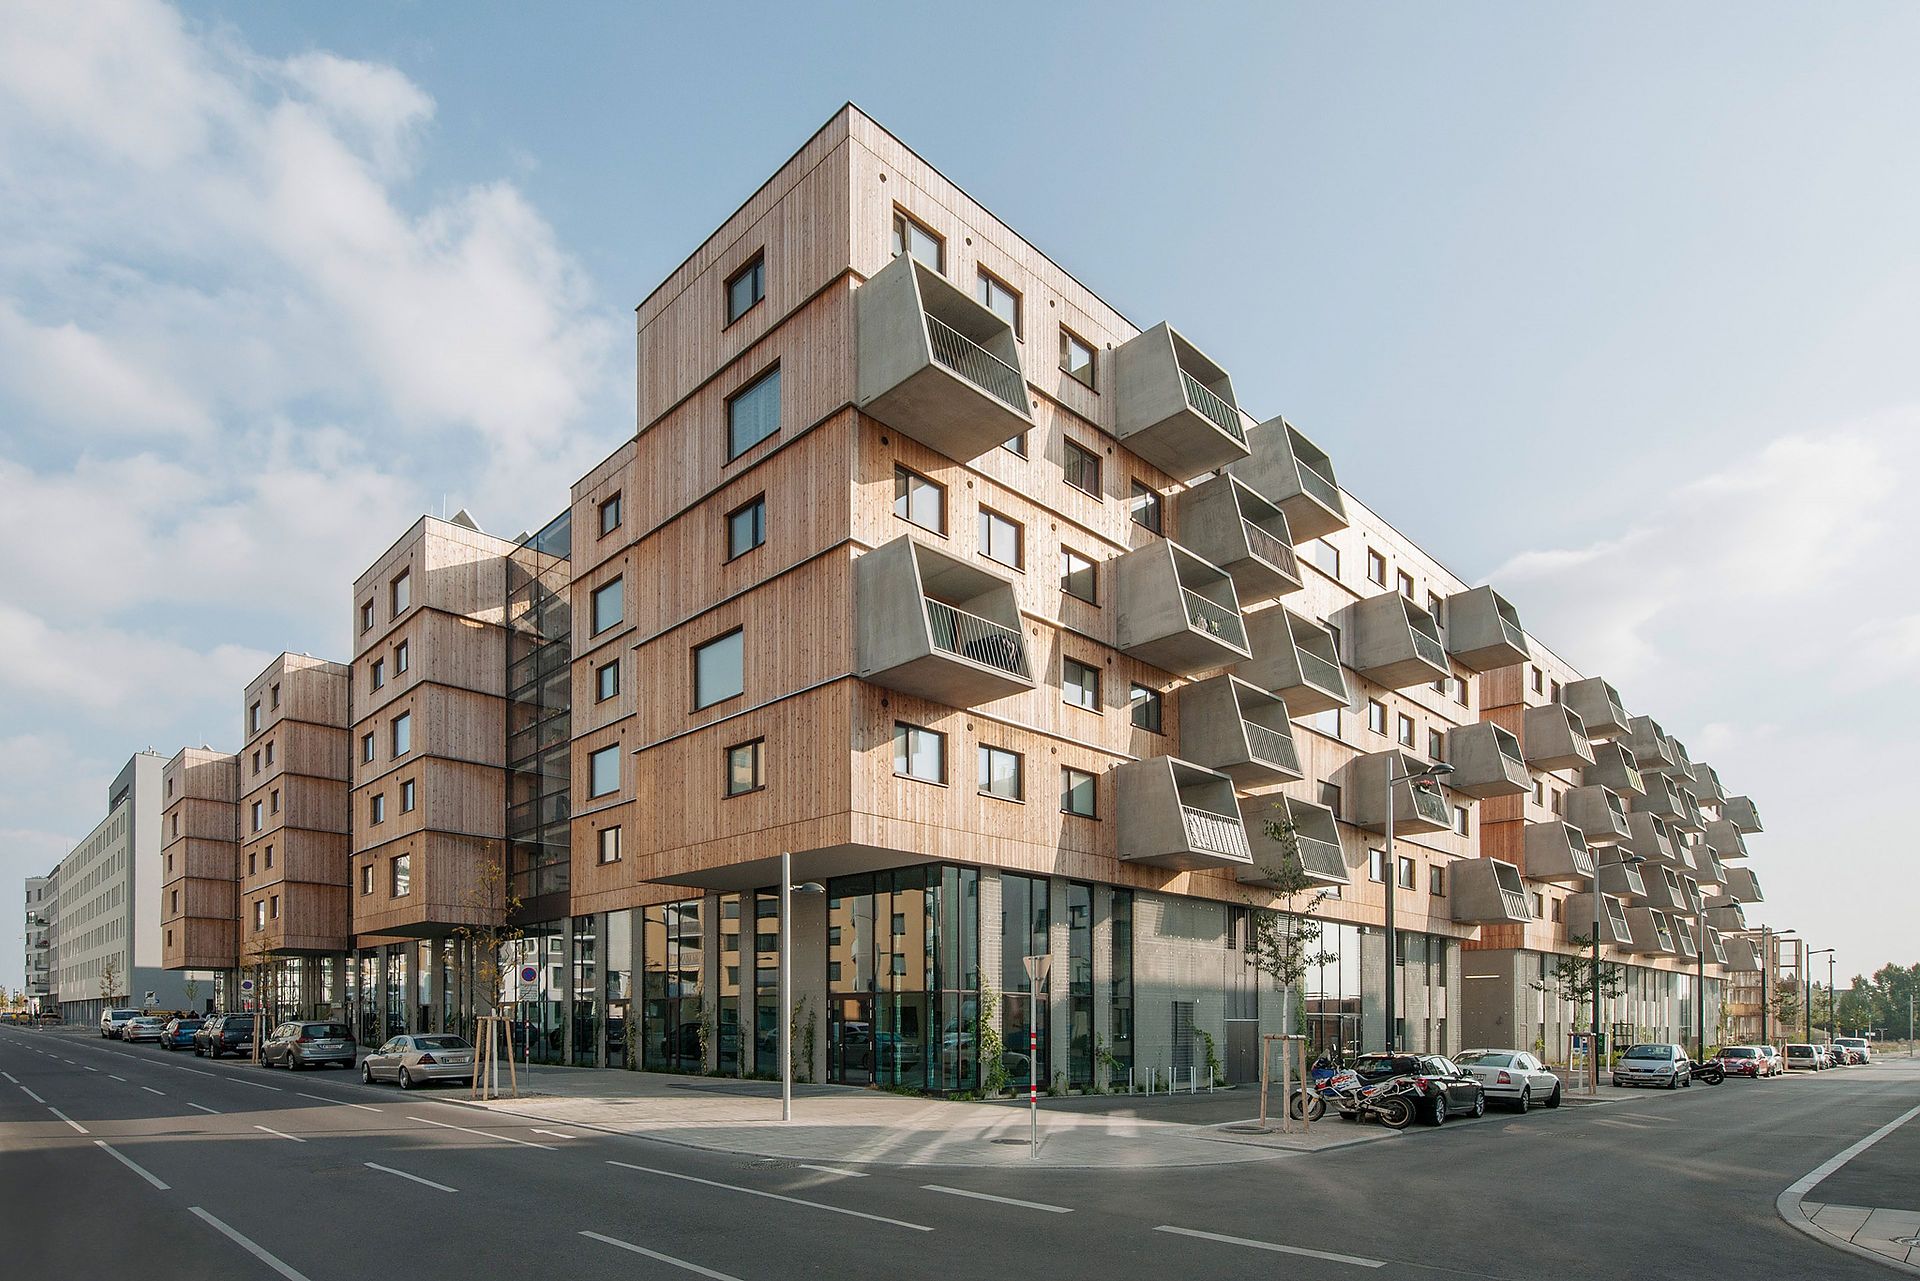
nZEB - Residential Building D12 – Aspern / Vienna / Austria
The residential building “D12” is a block of 7 buildings with 4-6 storeys each, commercial use on the ground-floor on 900 m². The conditioned gross floor area is about 19,080 m². The buildings’ heating and DHW system is basically based on different heat pump technologies. The overall energy delivering system is designed to support demand response with a multitude of different energy sources. The building blocks are in operation since March 2016.
Copyright: Fotos by Herta Hurnaus
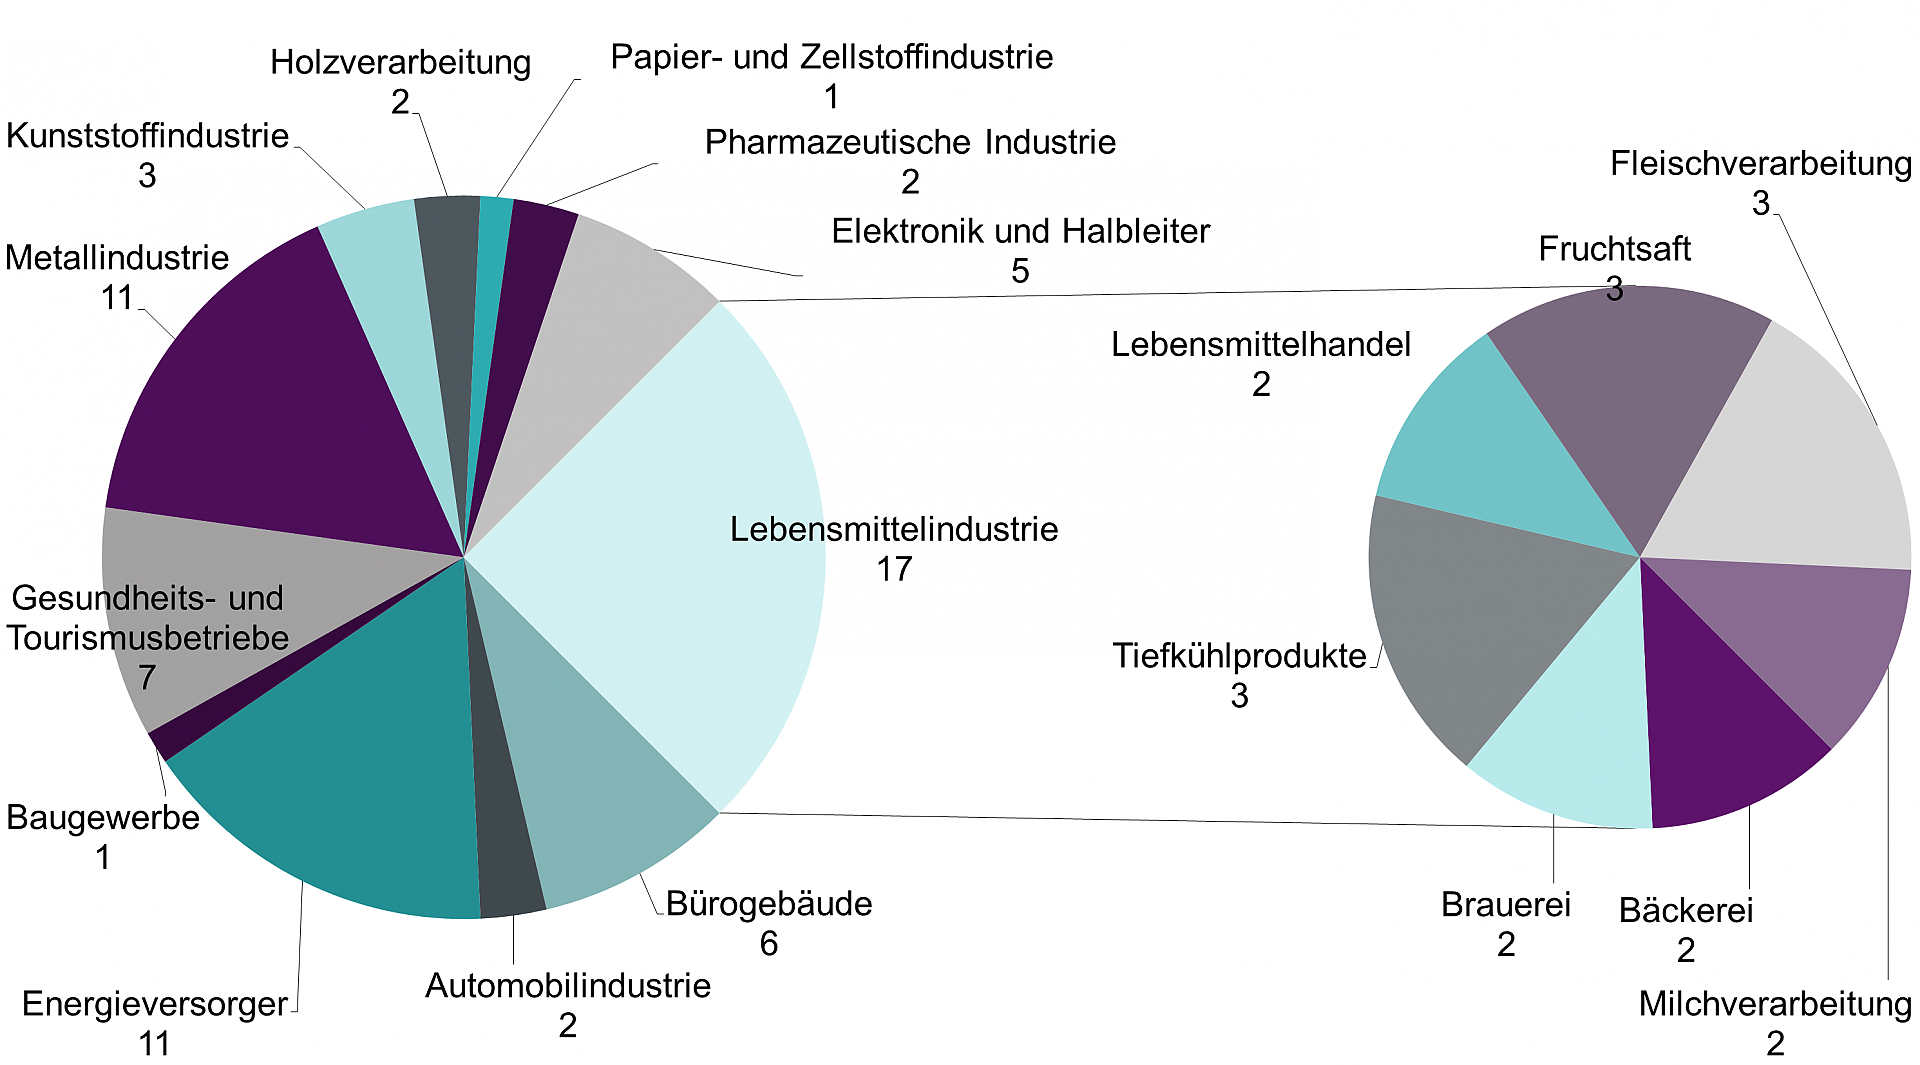
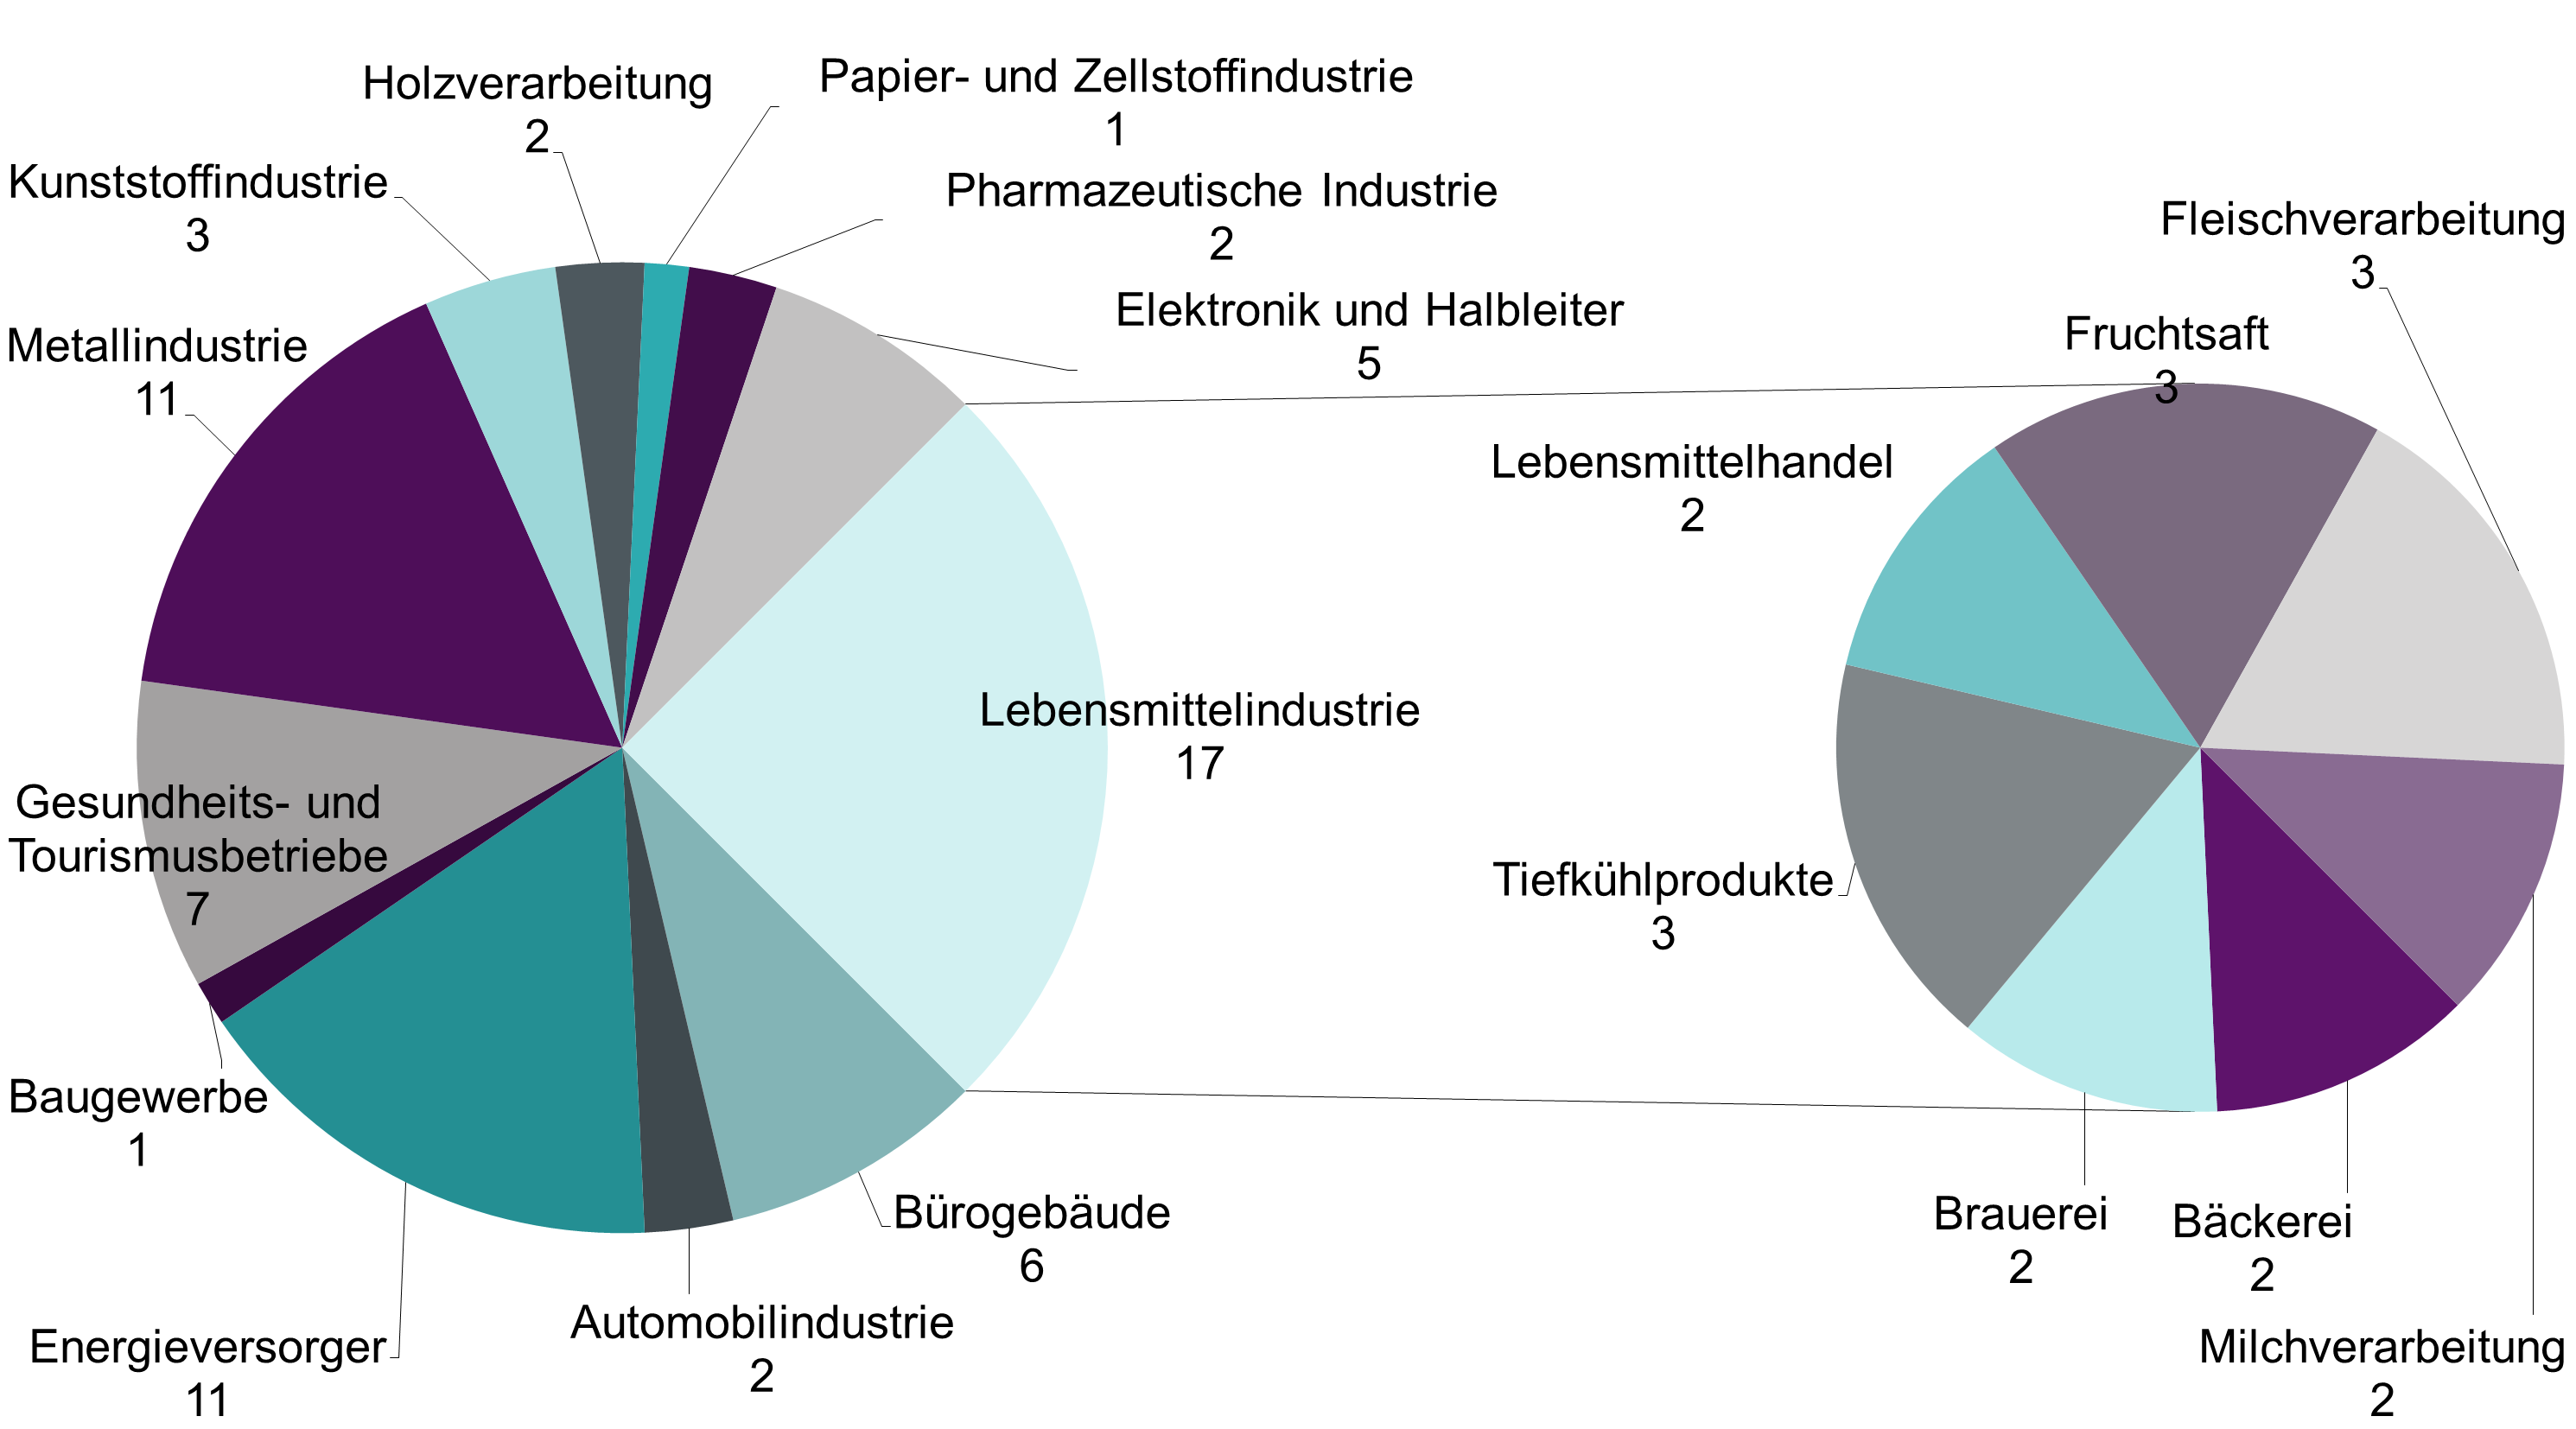
Austrian examples for industrial heat pumps, distribution in industrial sectors
A total of 68 examples of industrial heat pumps in Austria were collected. Those systems are considered that are integrated into an industrial or commercial process on the heat source and/or sink side. The examples come from various sectors whose good suitability for heat pumps is already known, such as the food industry (17 examples), energy suppliers (11 examples) and the metal processing industry (11 examples).
Copyright: AIT Austrian Institute of Technology GmbH, TU Graz

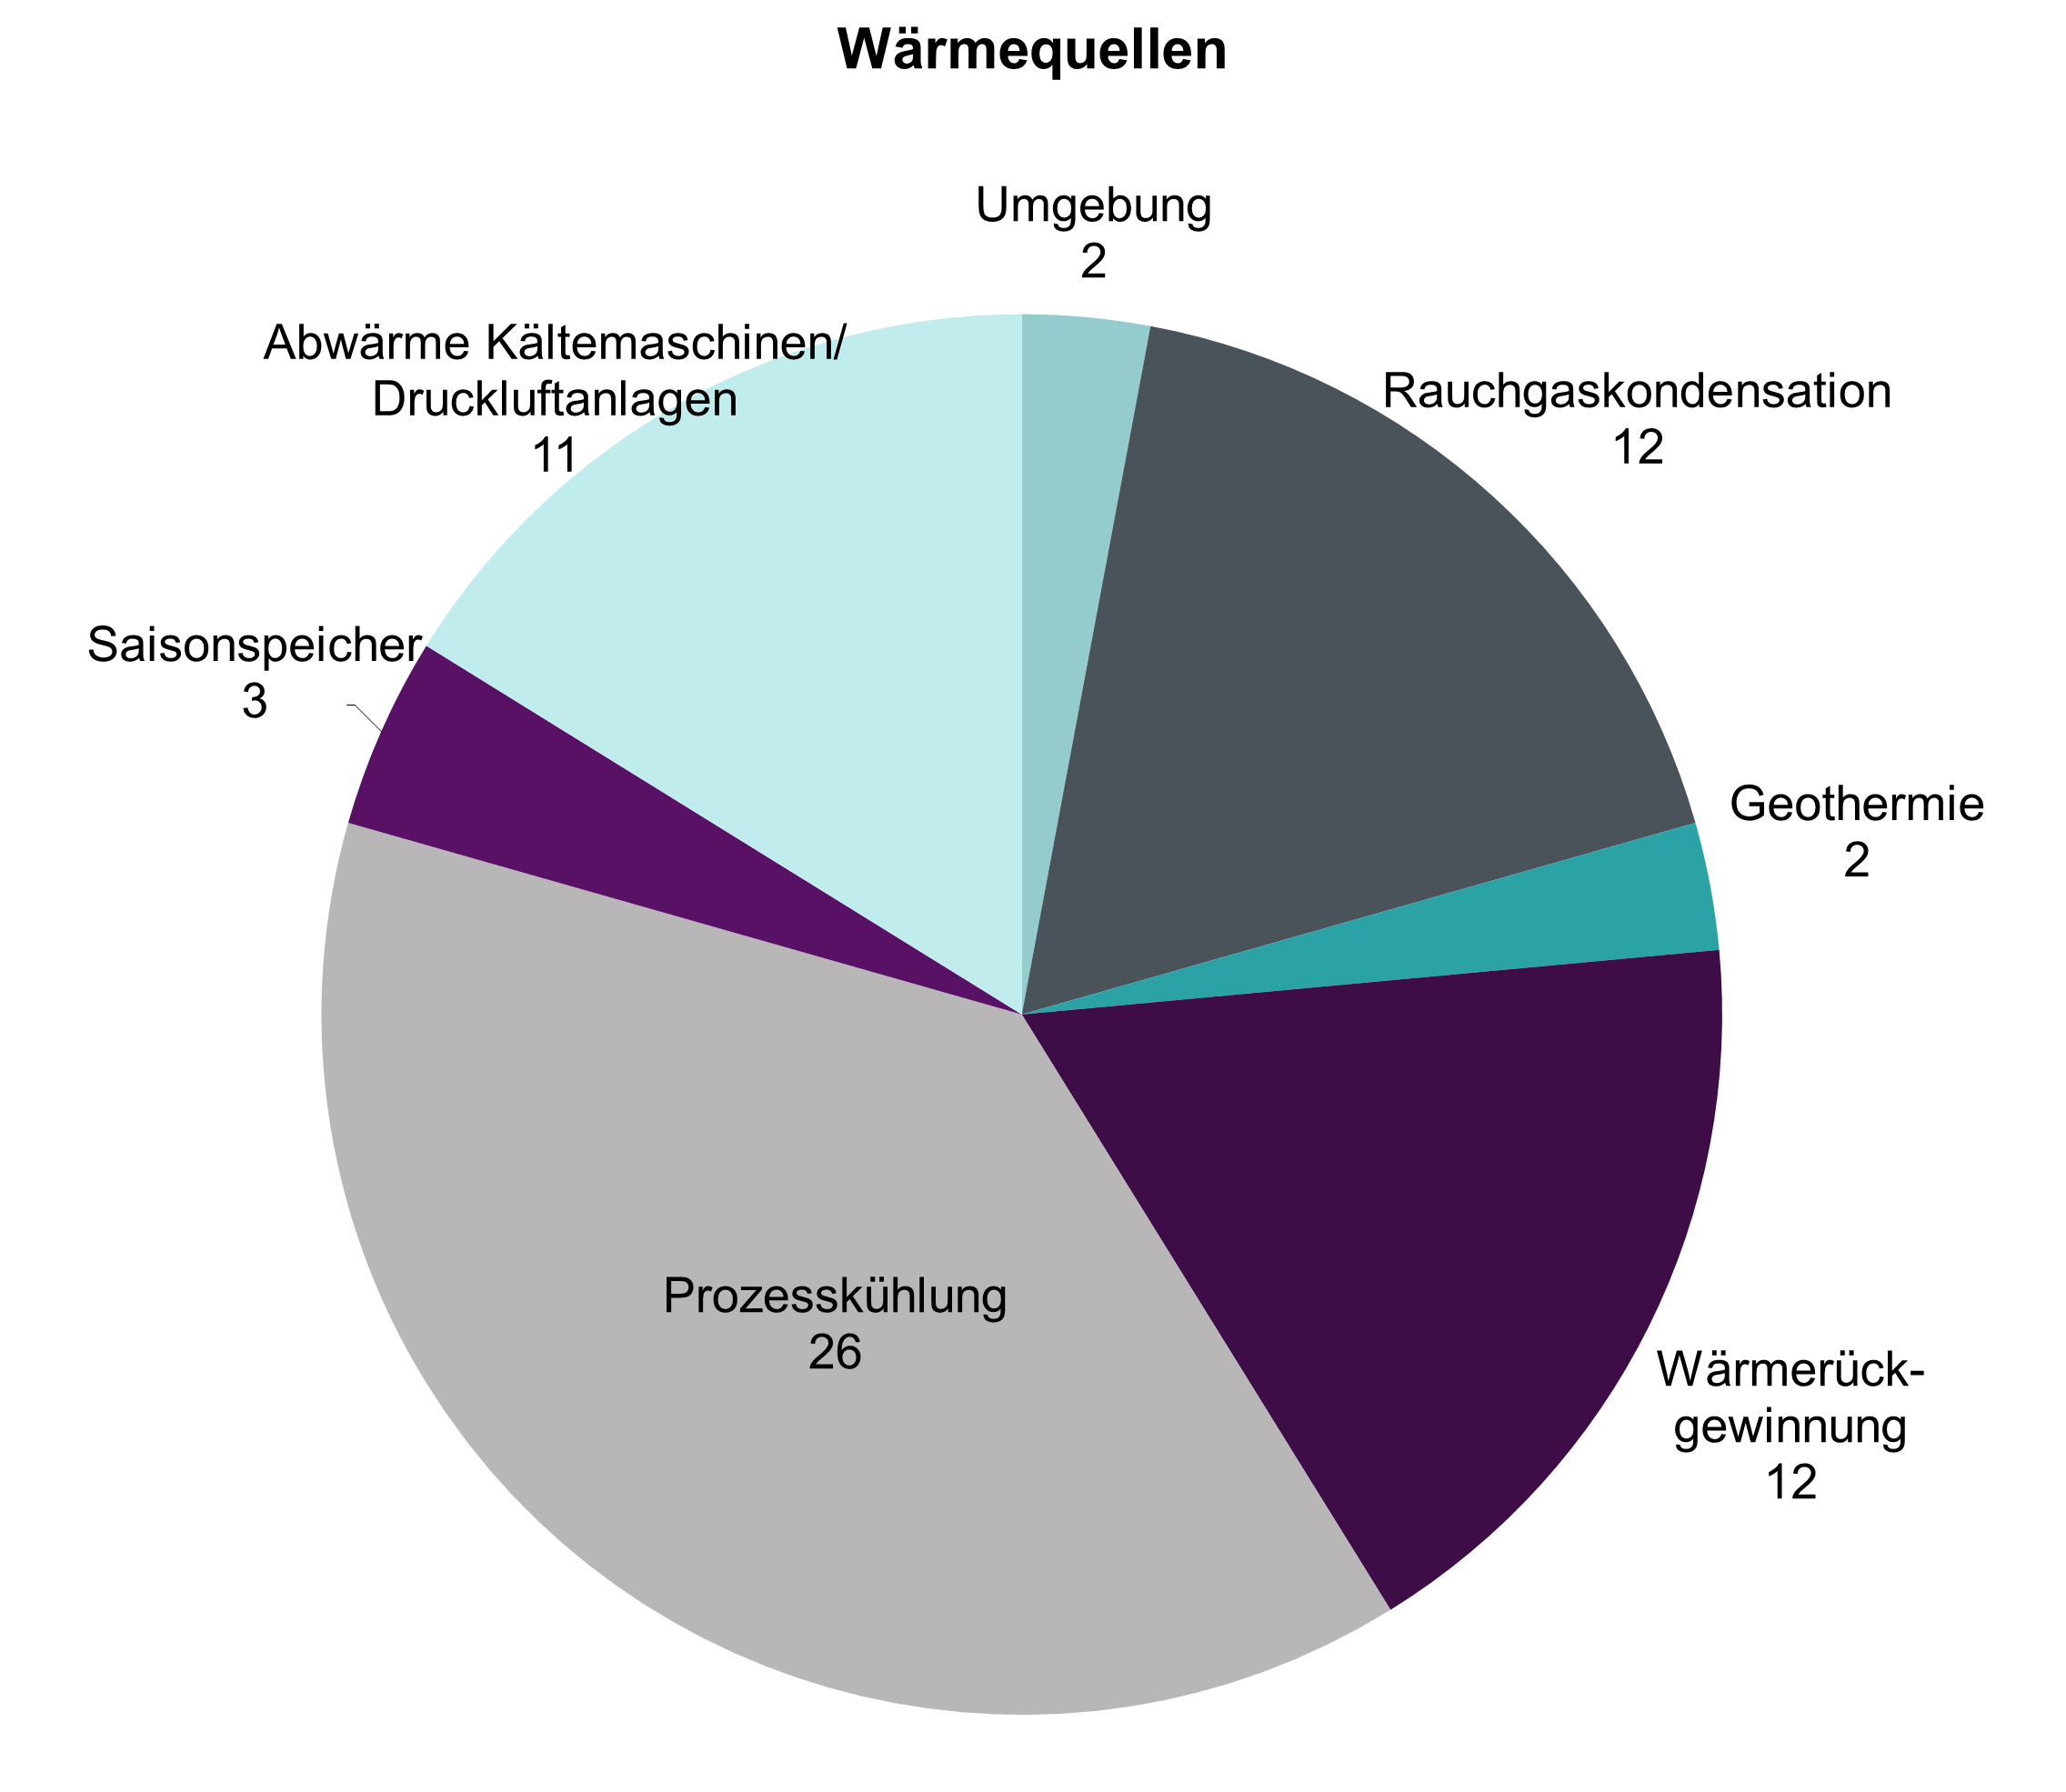
Austrian examples for industrial heat pumps: heat sources
Different heat sources are used. The most common heat sources are processes that need to be cooled and waste heat streams, that still usable heat. In addition, waste heat from refrigerating machines and compressed air systems as well as flue gas condensation is used.
Copyright: AIT Austrian Institute of Technology GmbH, TU Graz
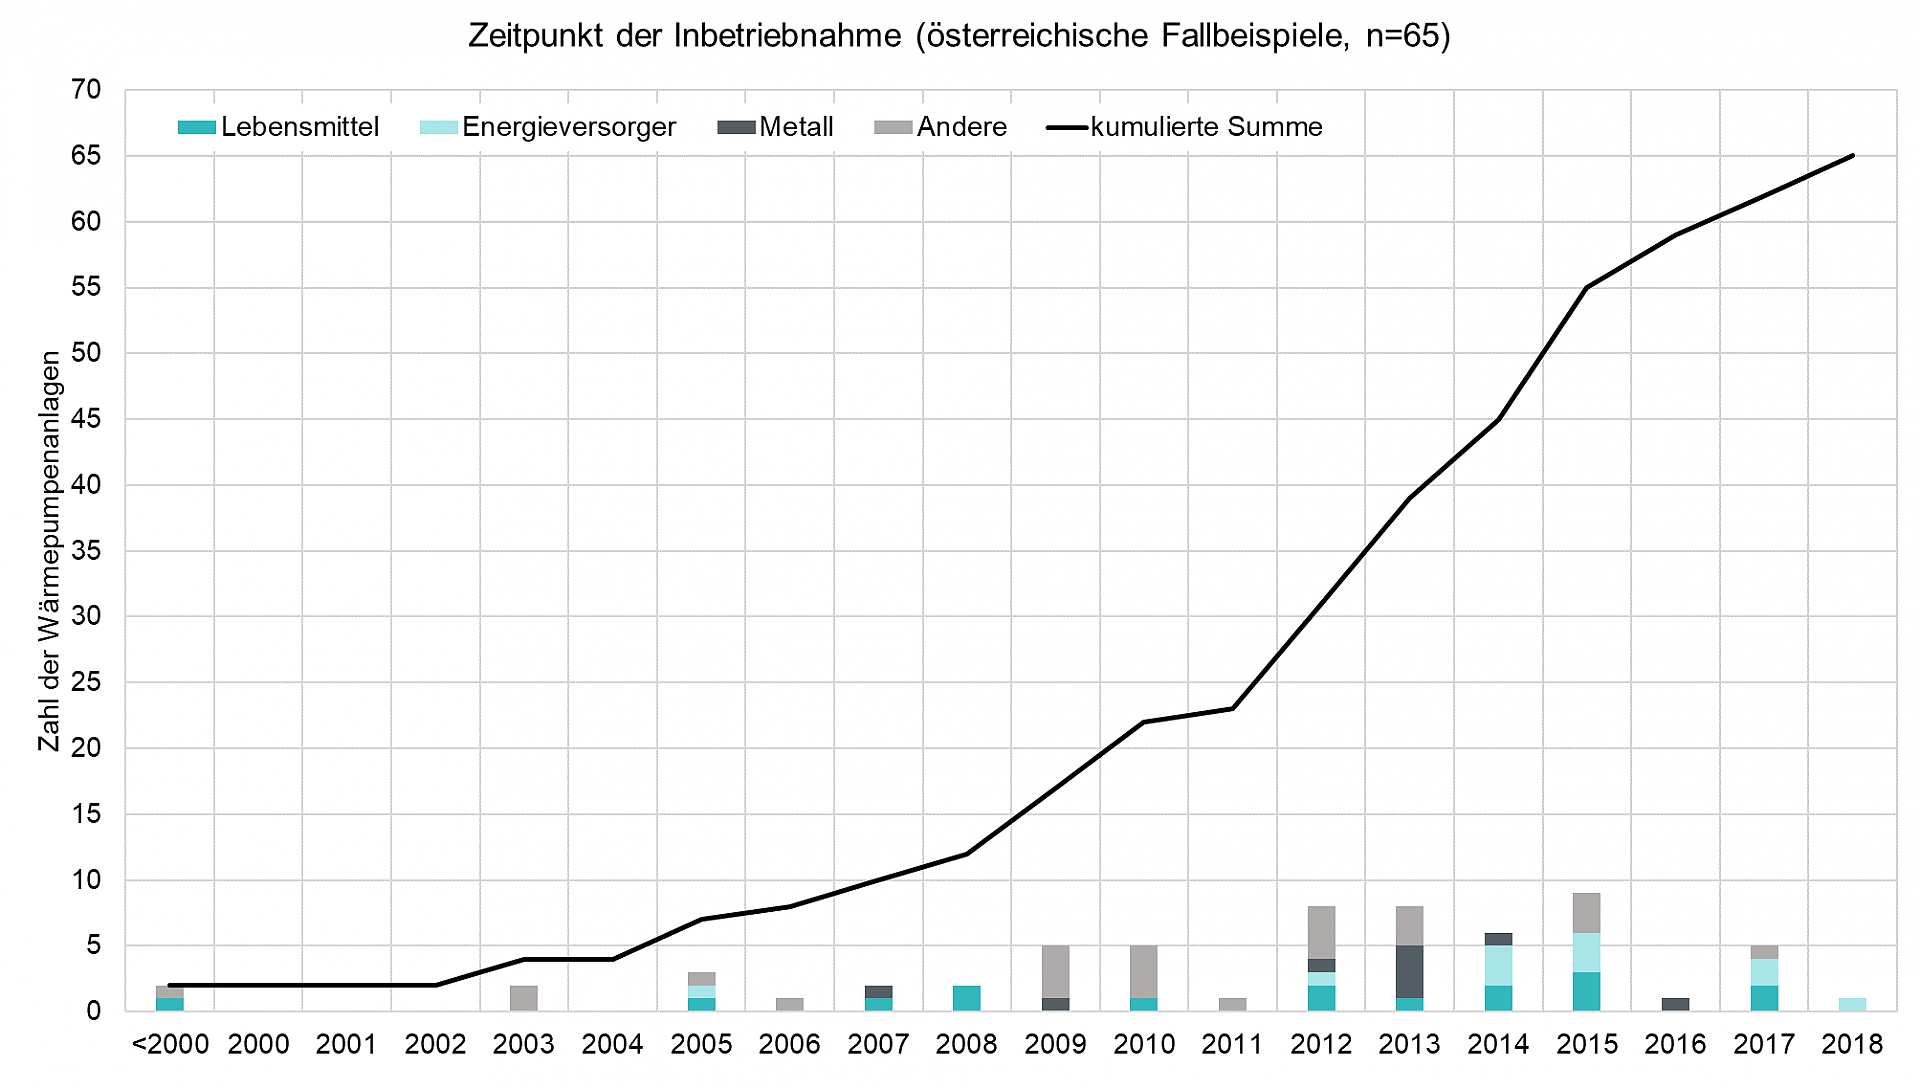
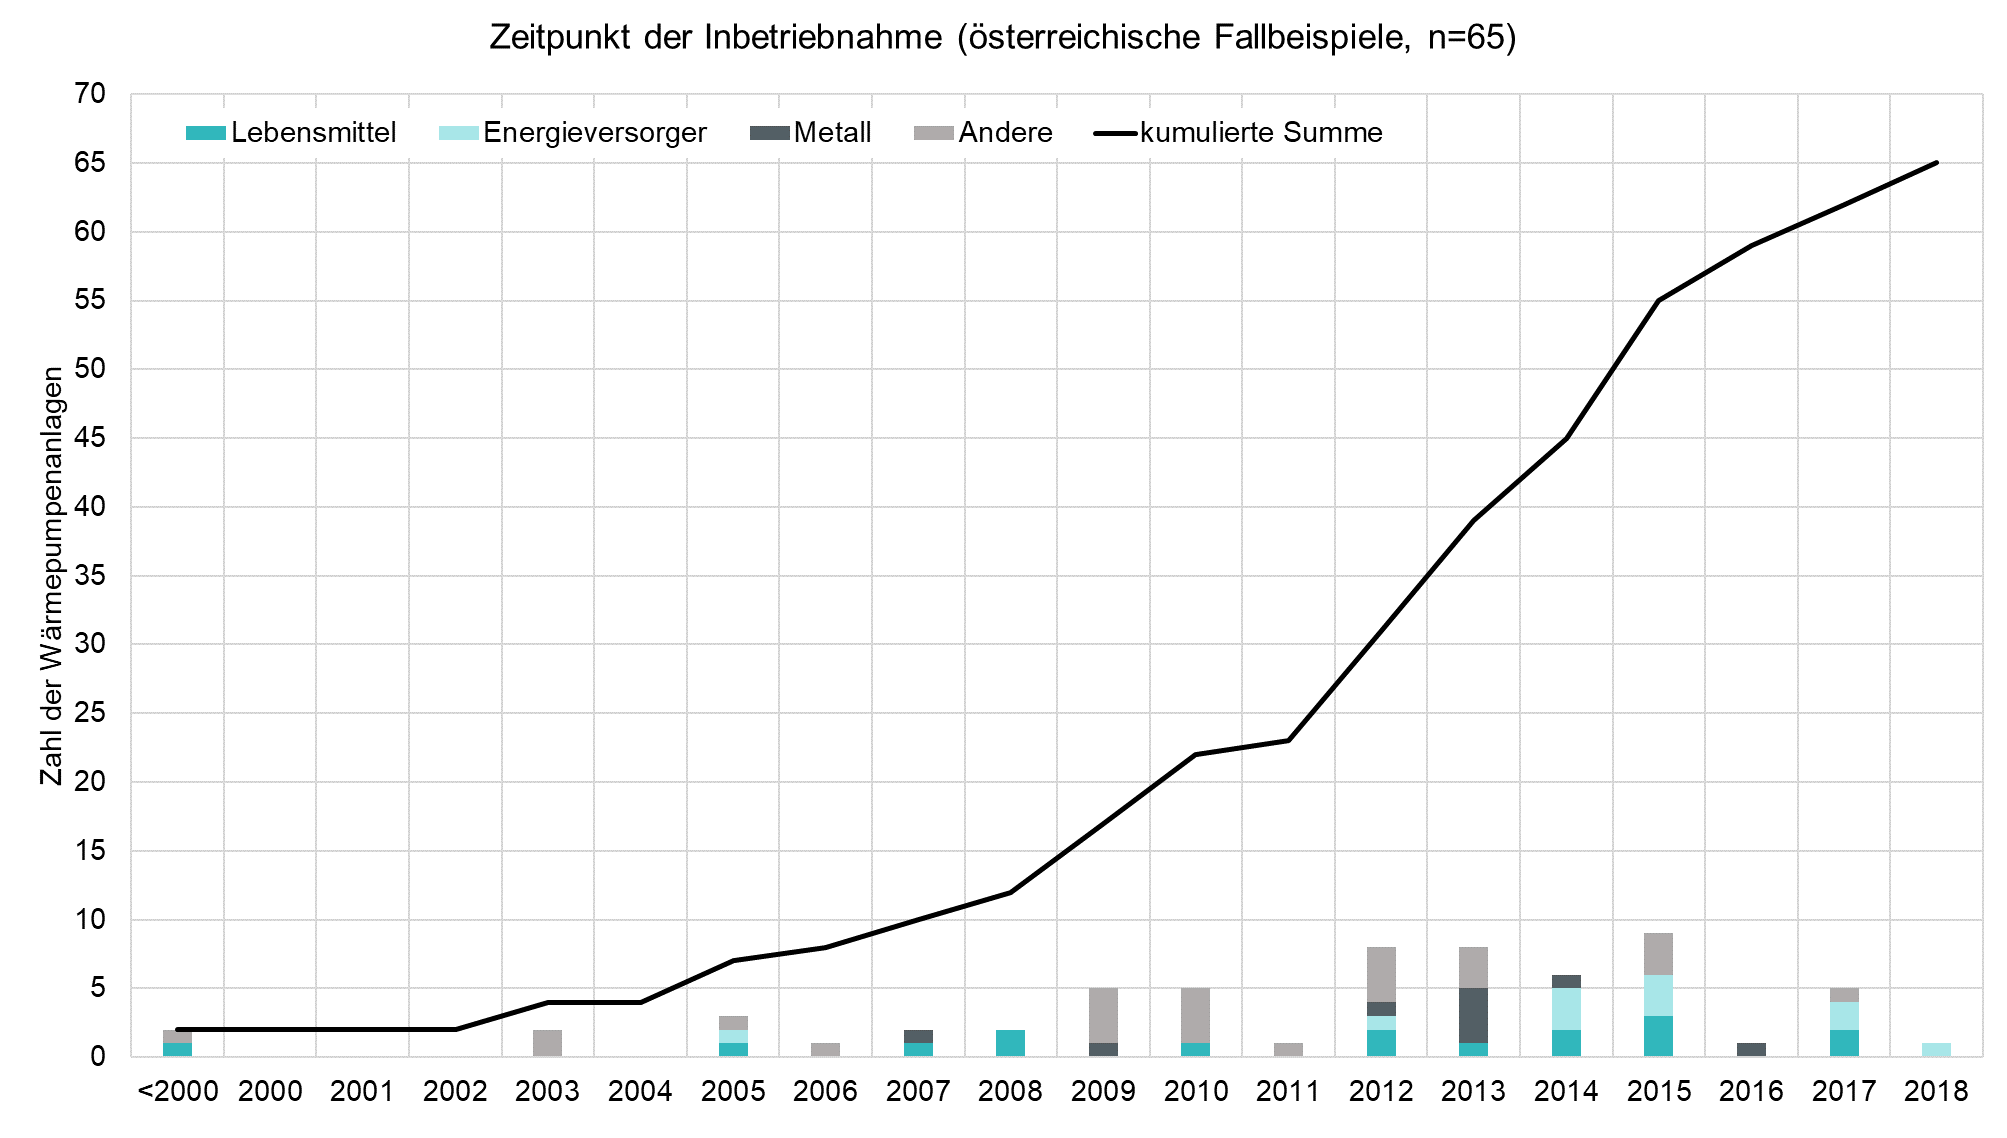
Austrian examples for industrial heat pumps: time of commissioning
Numerous industrial heat pumps were put into operation after 2012. This clearly shows that the spread of industrial heat pumps in Austria is increasing and that more information about these systems is also being published.
Copyright: AIT Austrian Institute of Technology GmbH, TU Graz
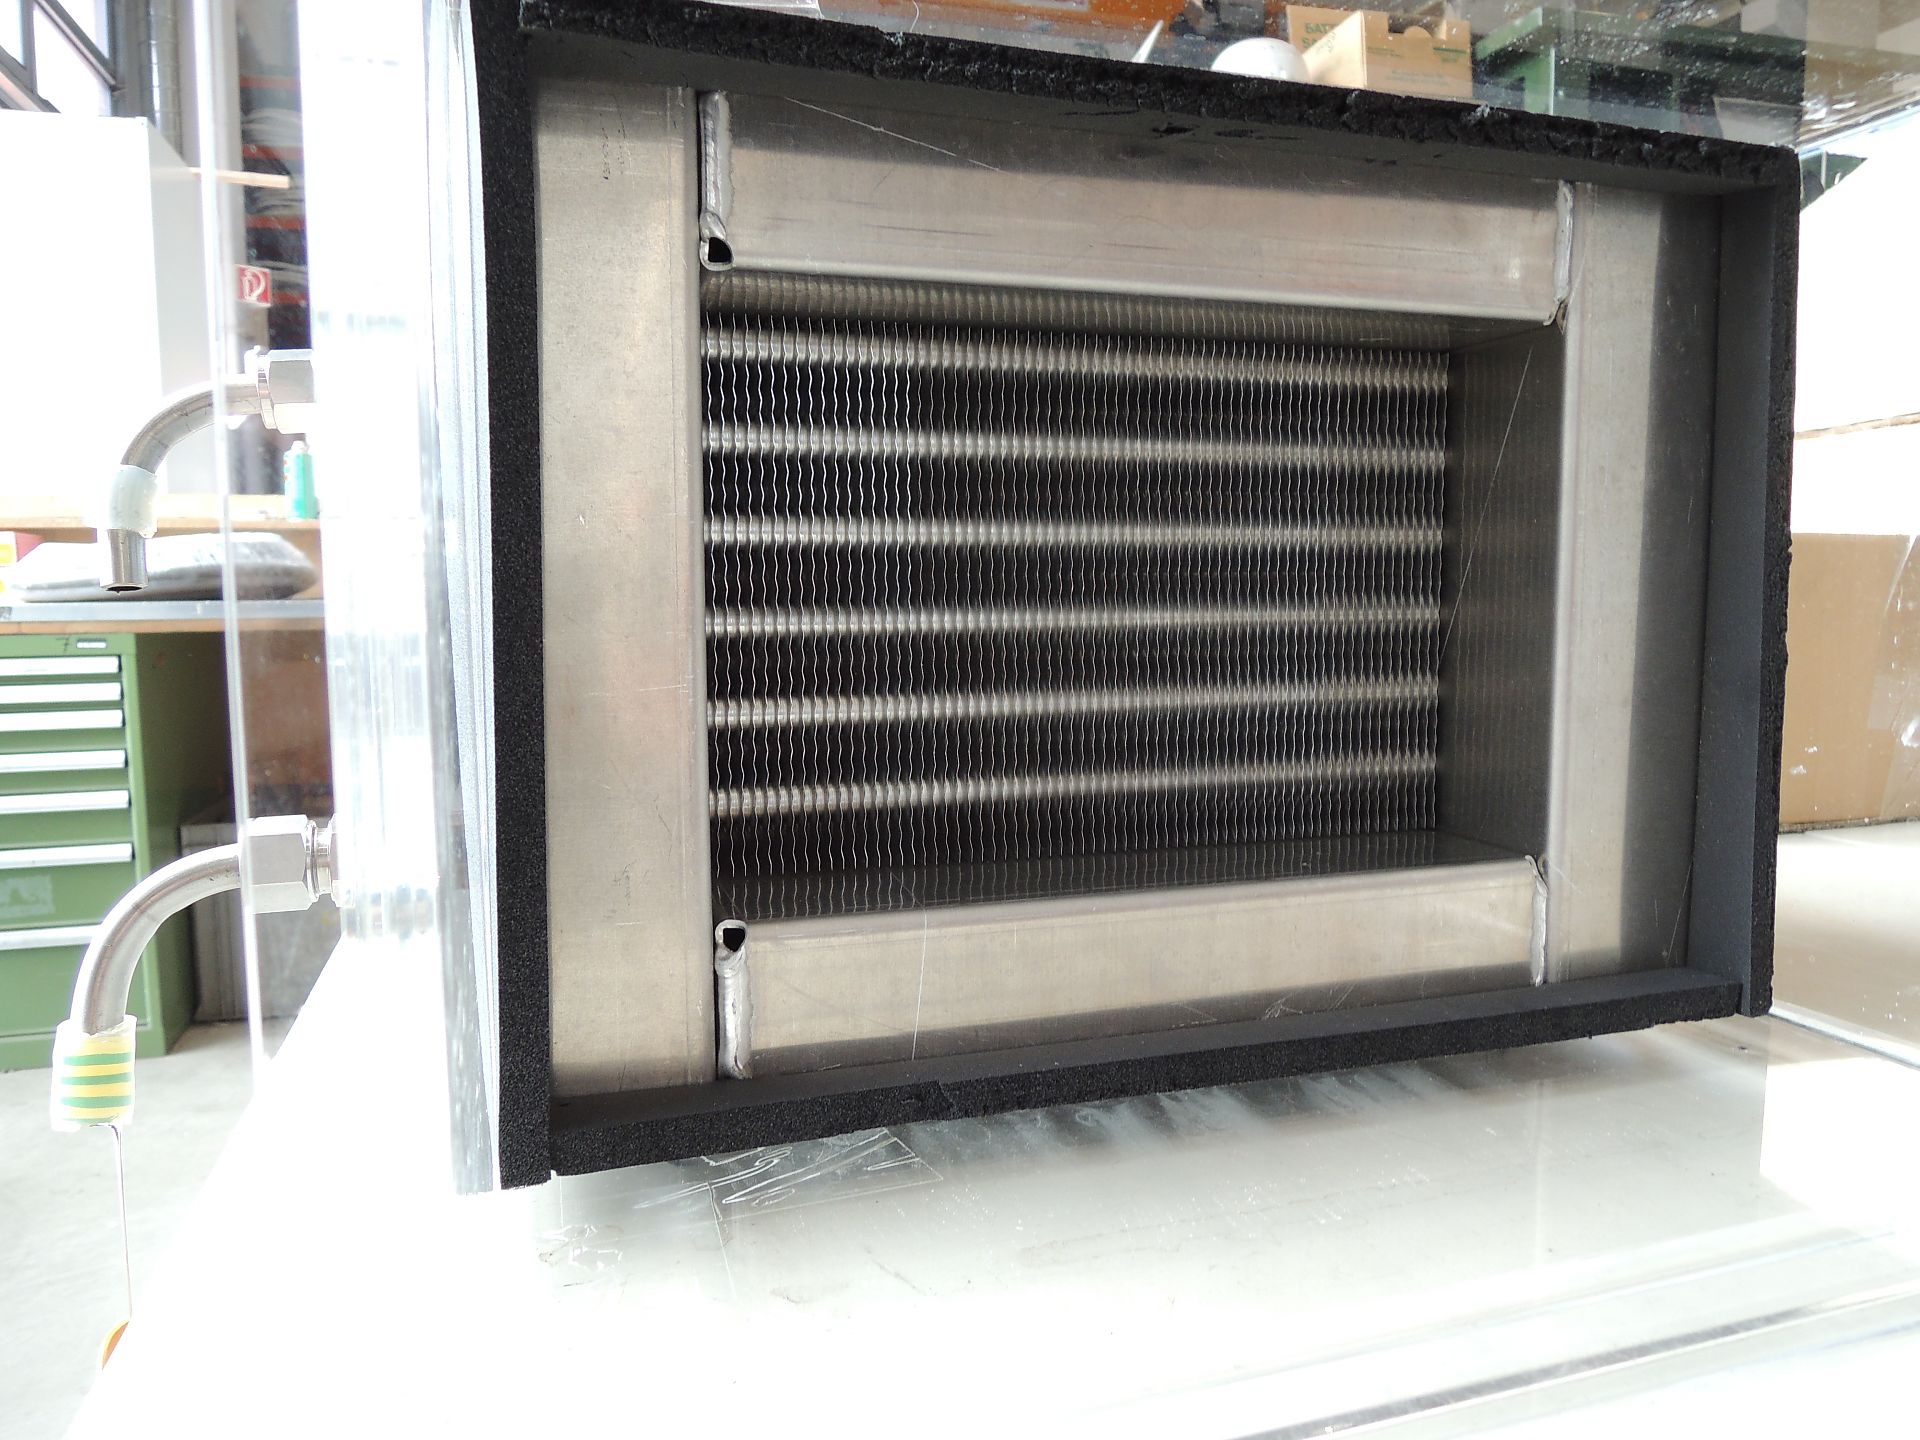
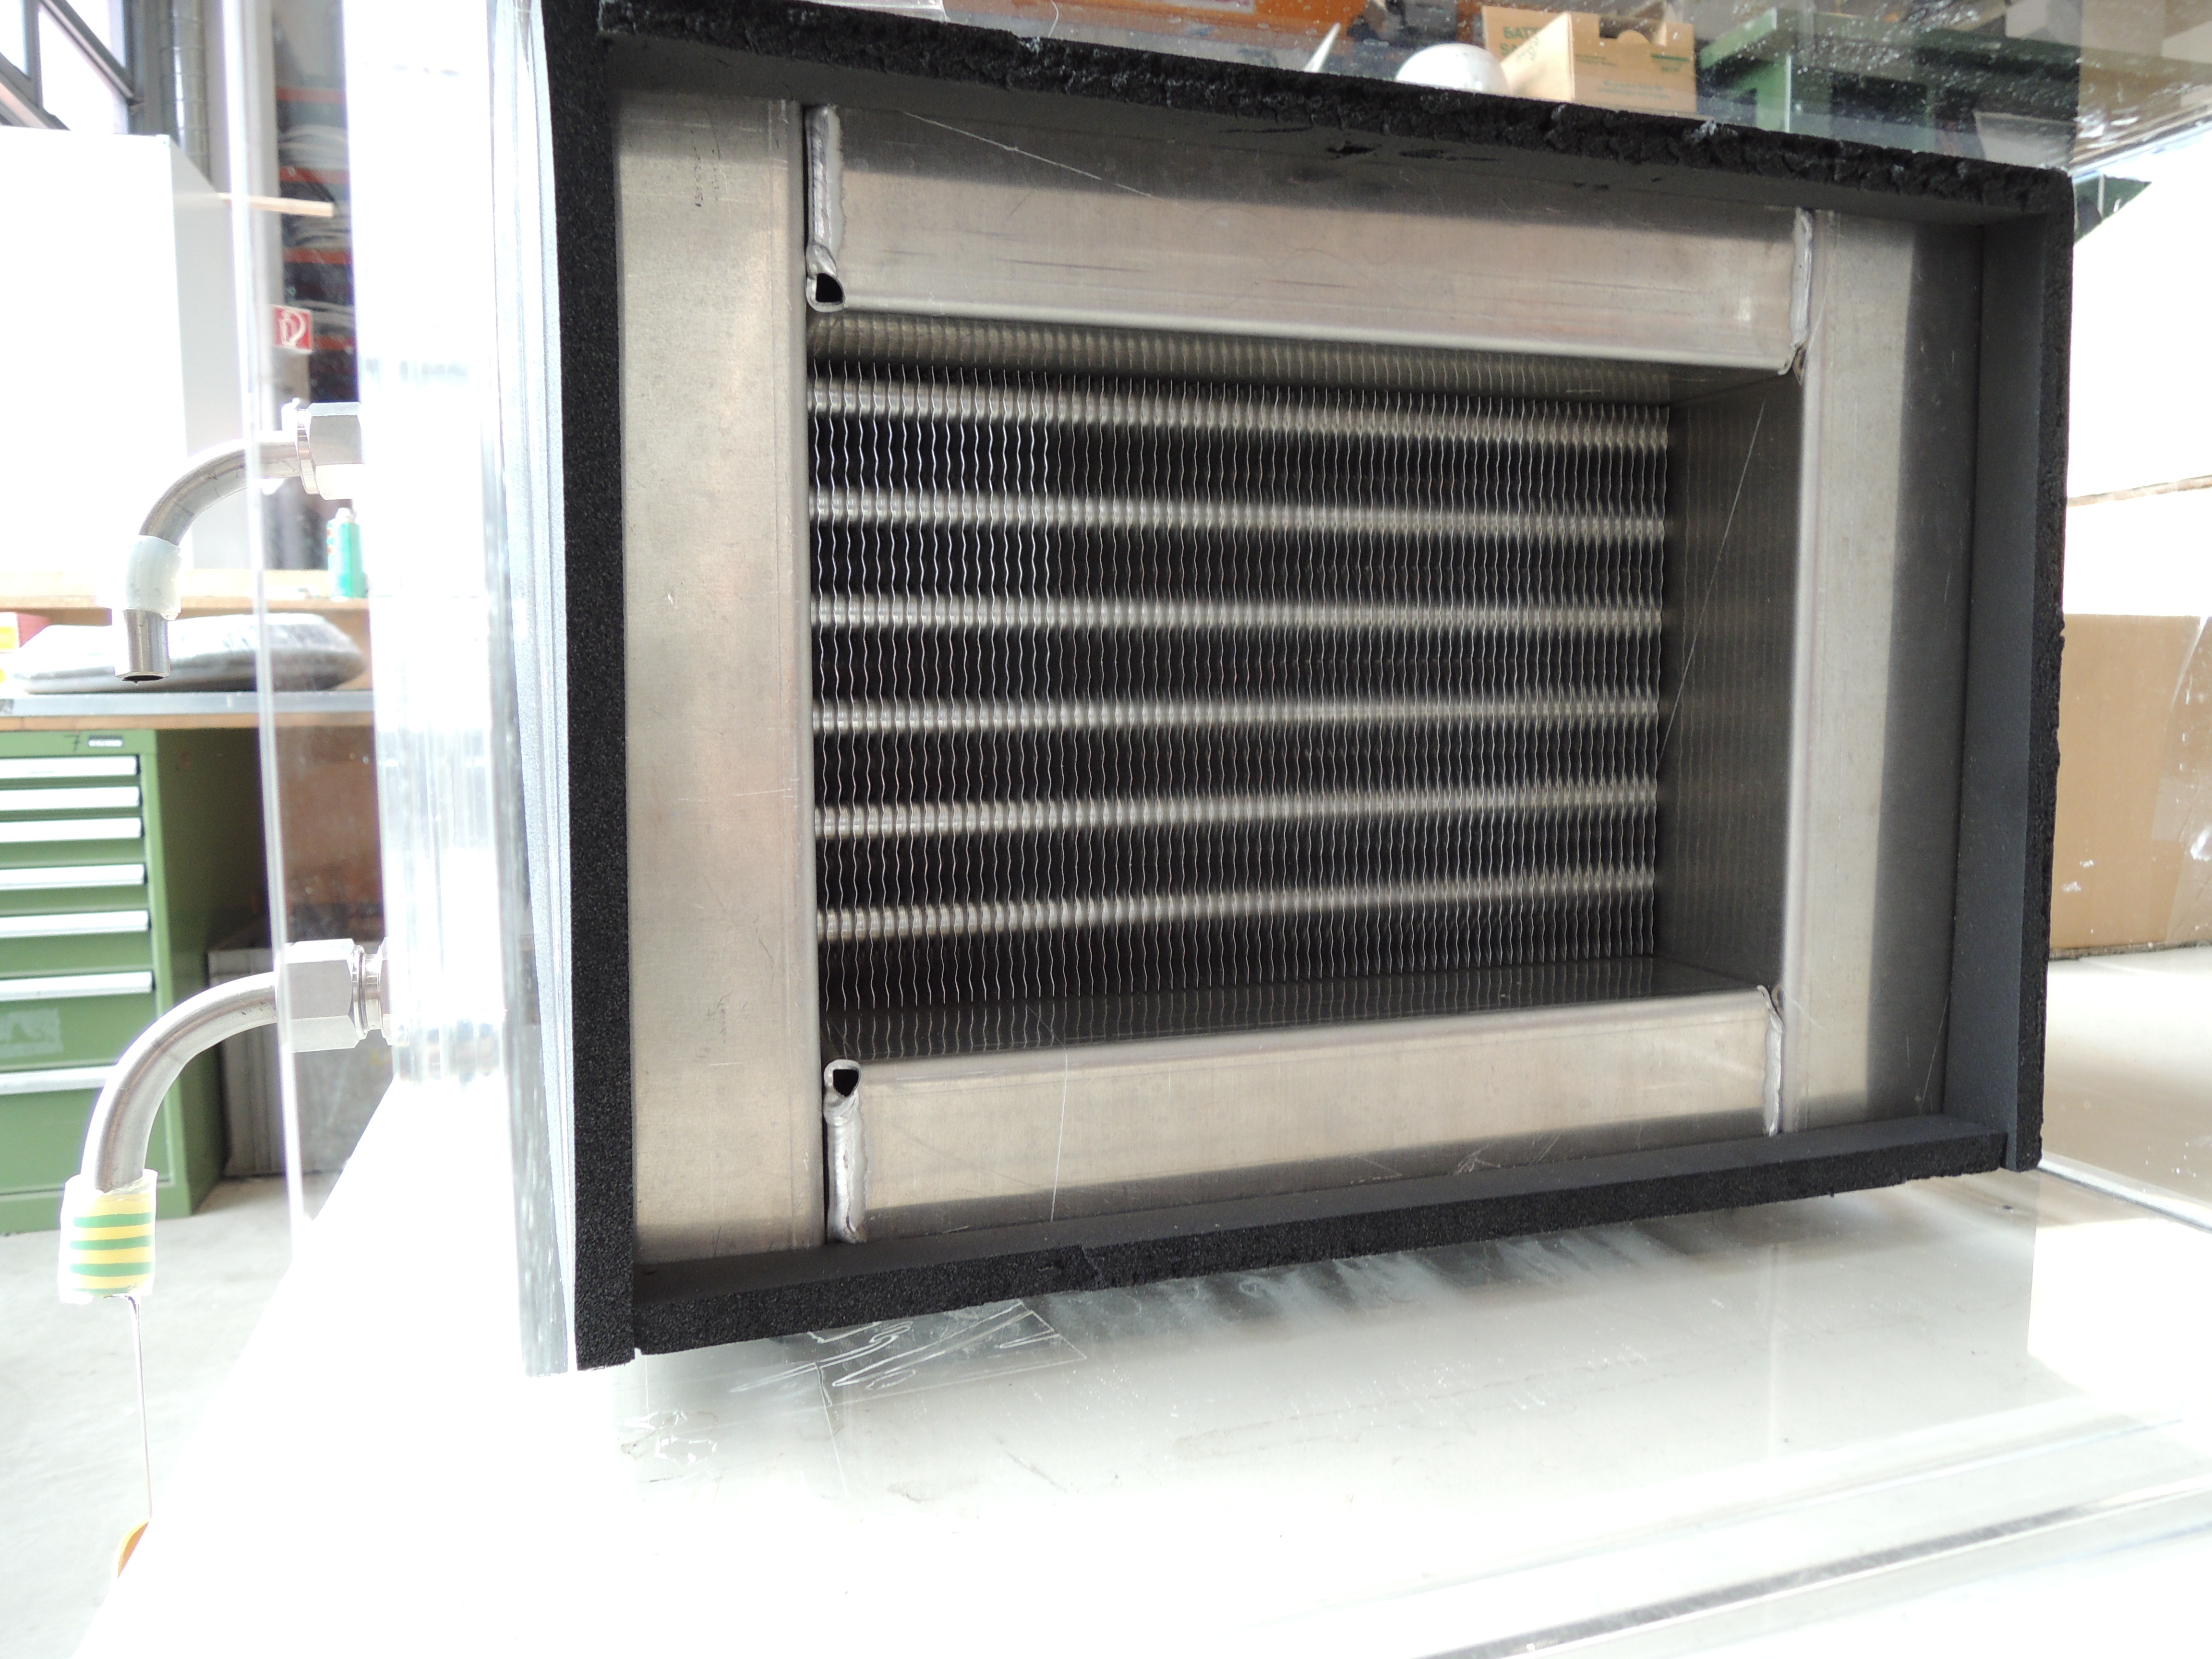
CTfin heat exchanger
Copyright: AIT Austrian Institute of Technology, Center for Energy, Sustainable Thermal Energy Systems

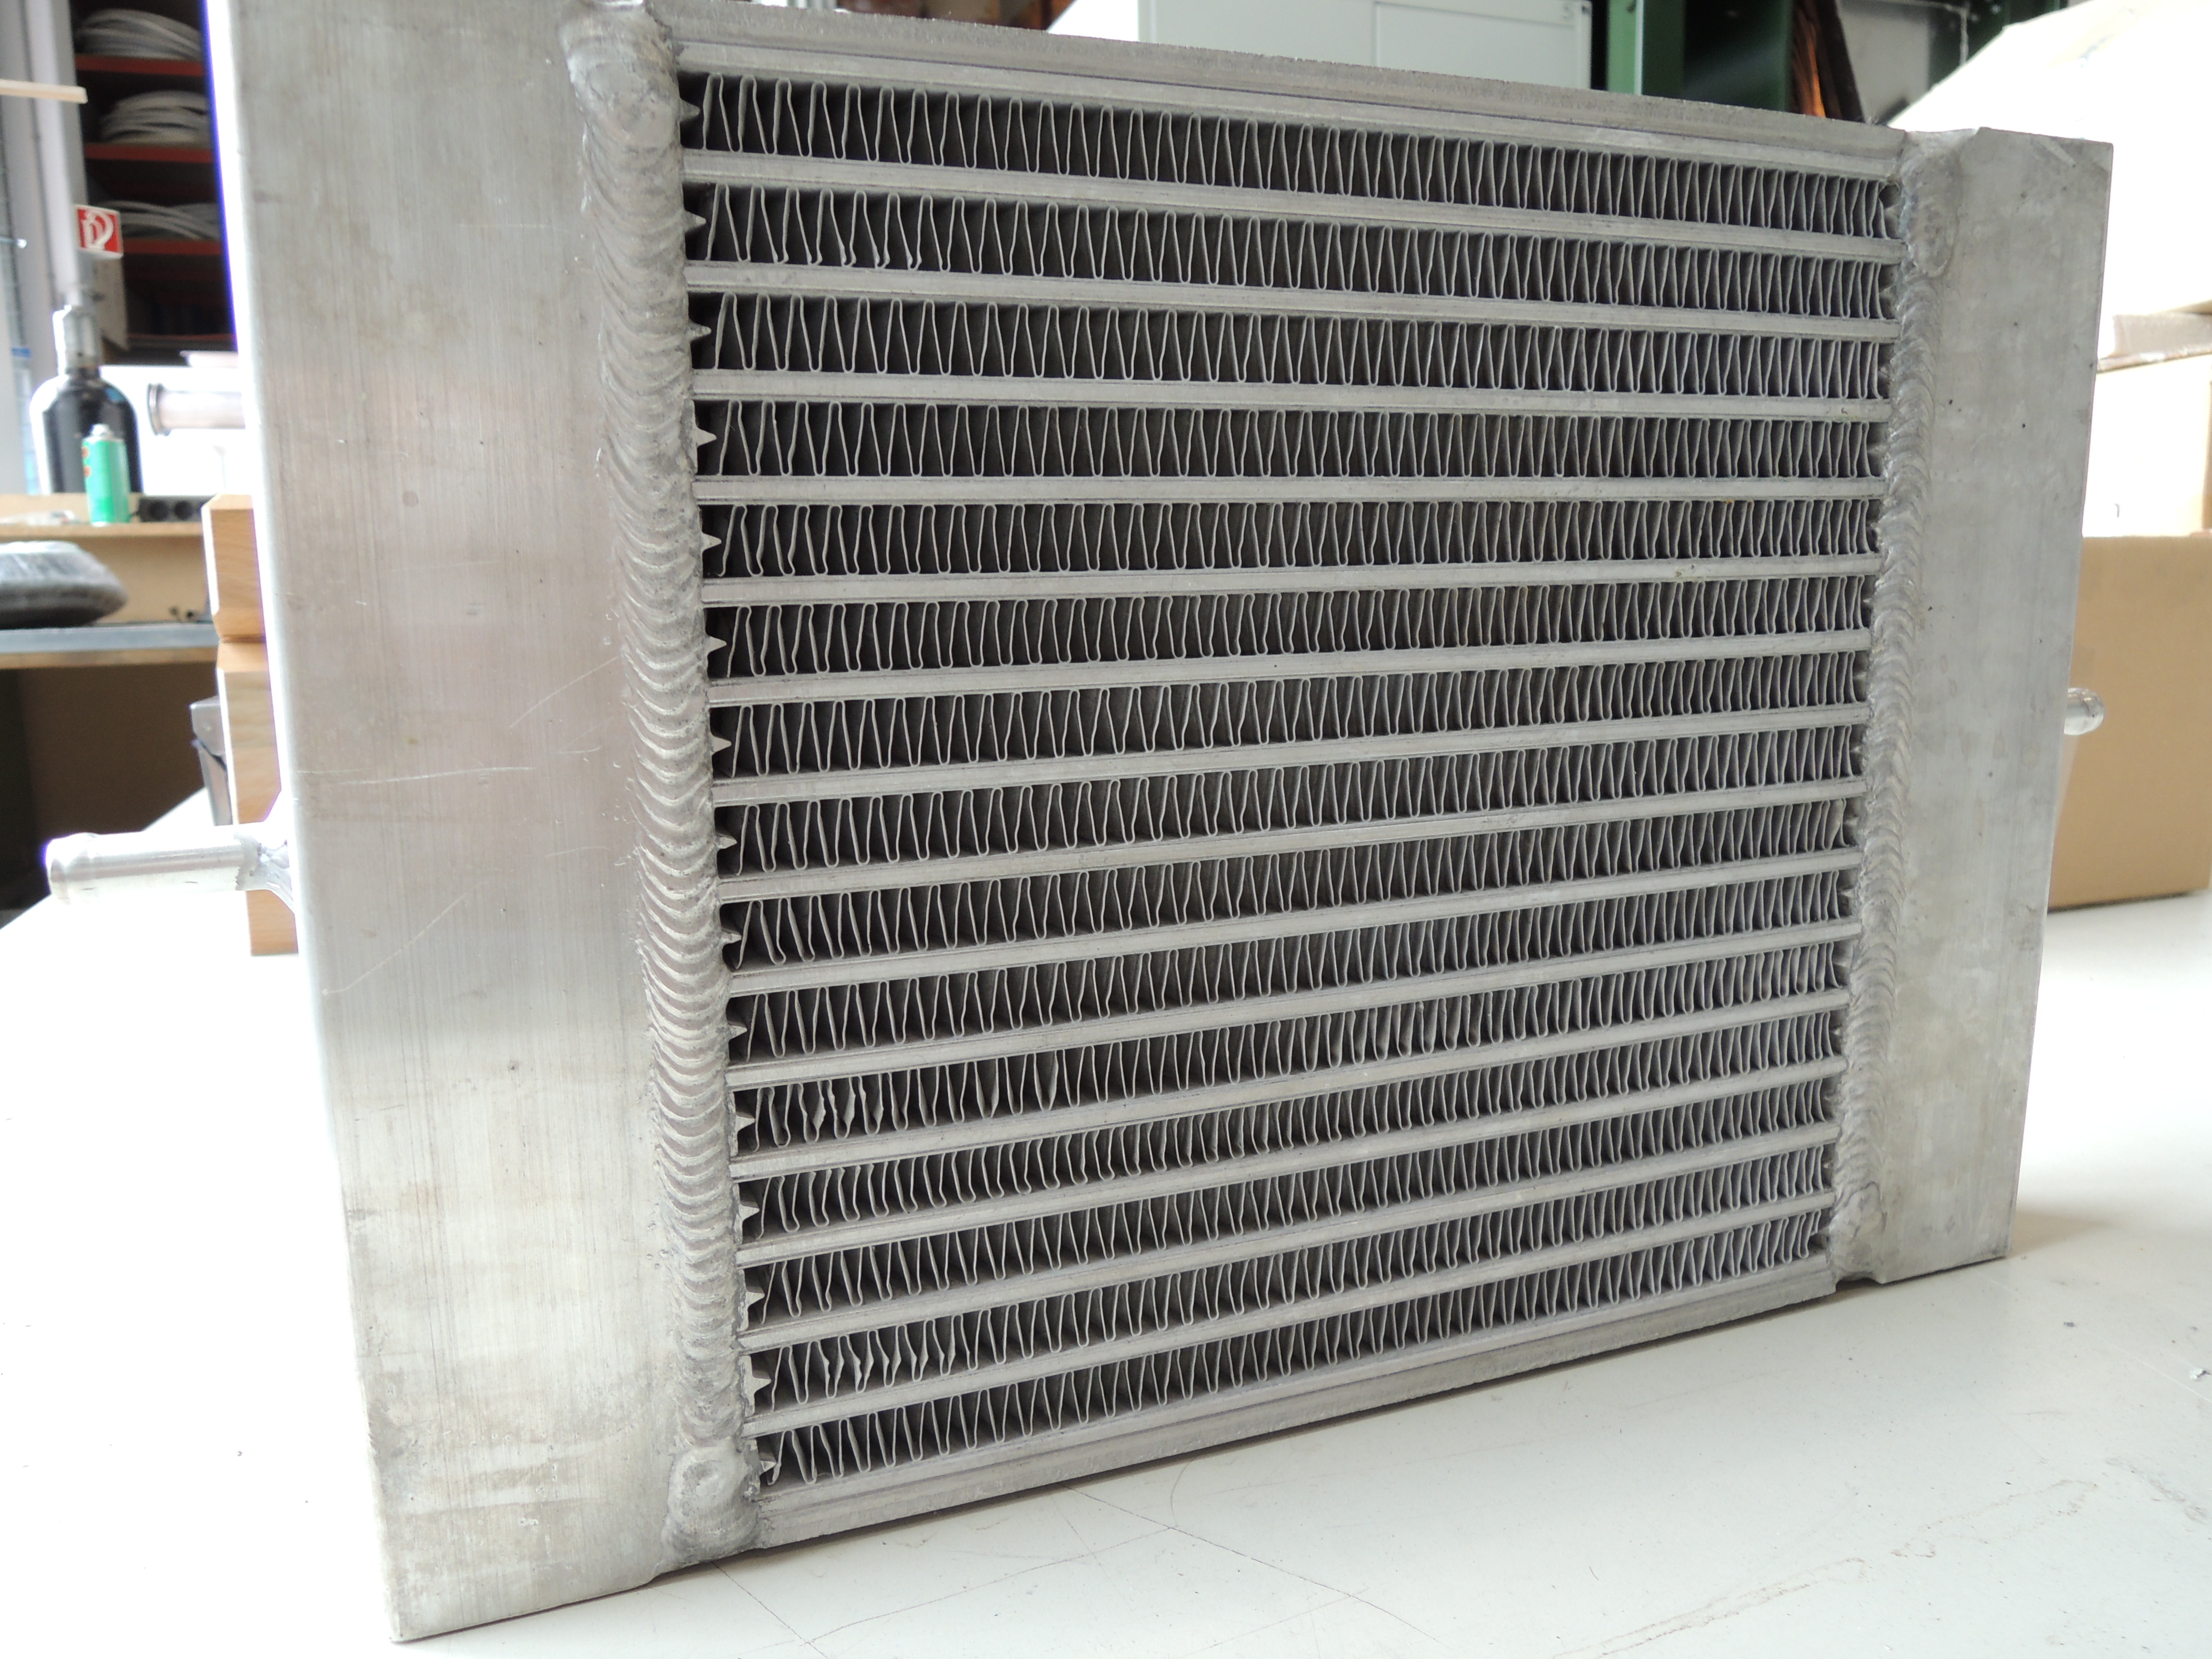
MPEfin heat exchanger
Copyright: AIT Austrian Institute of Technology, Center for Energy, Sustainable Thermal Energy Systems
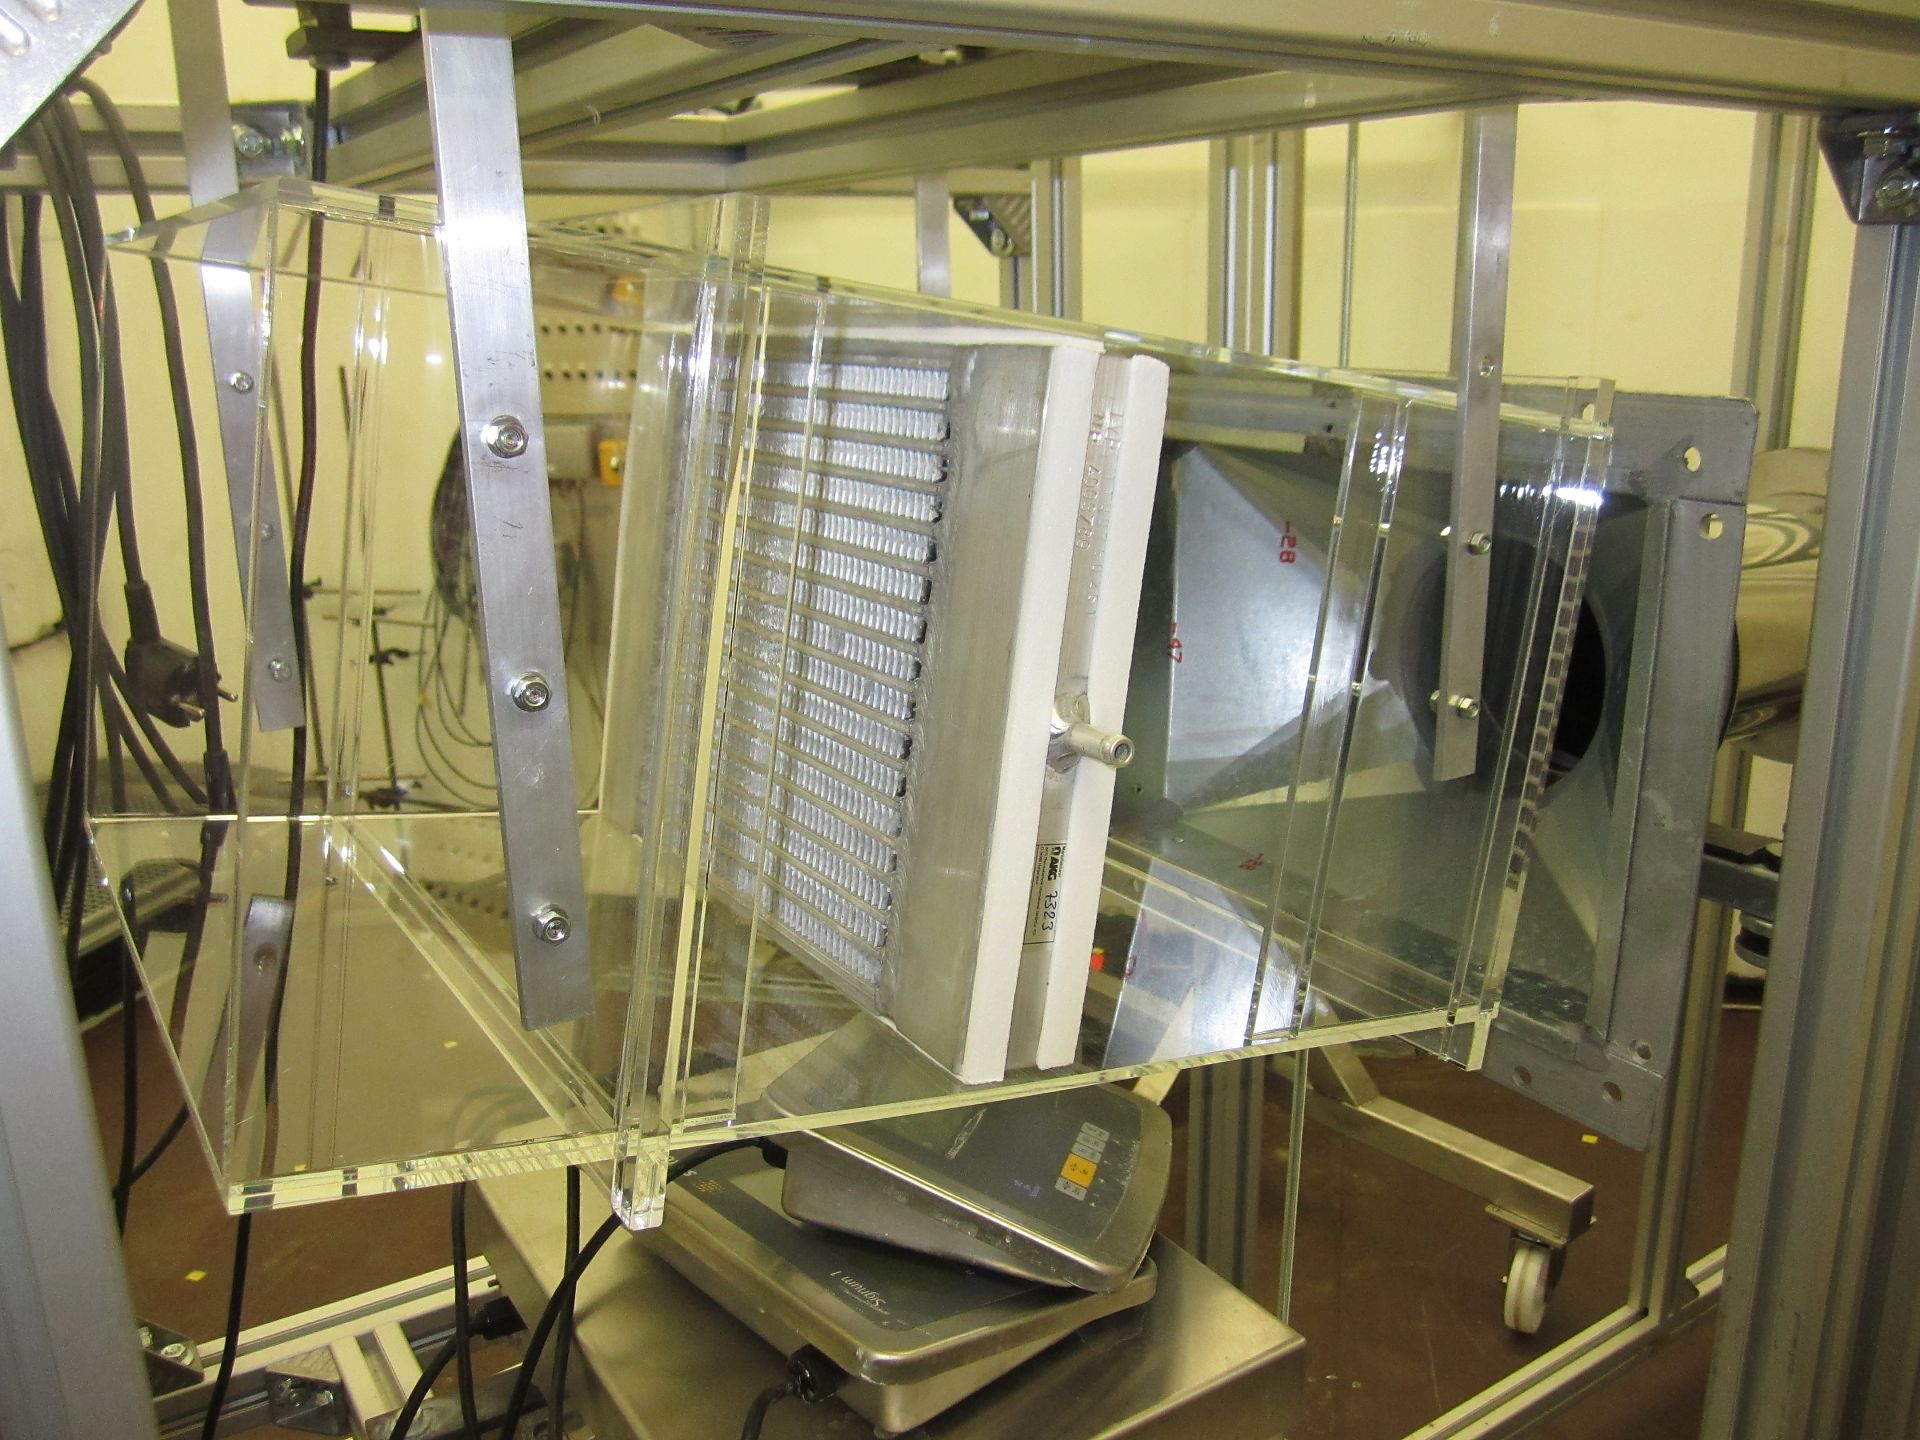
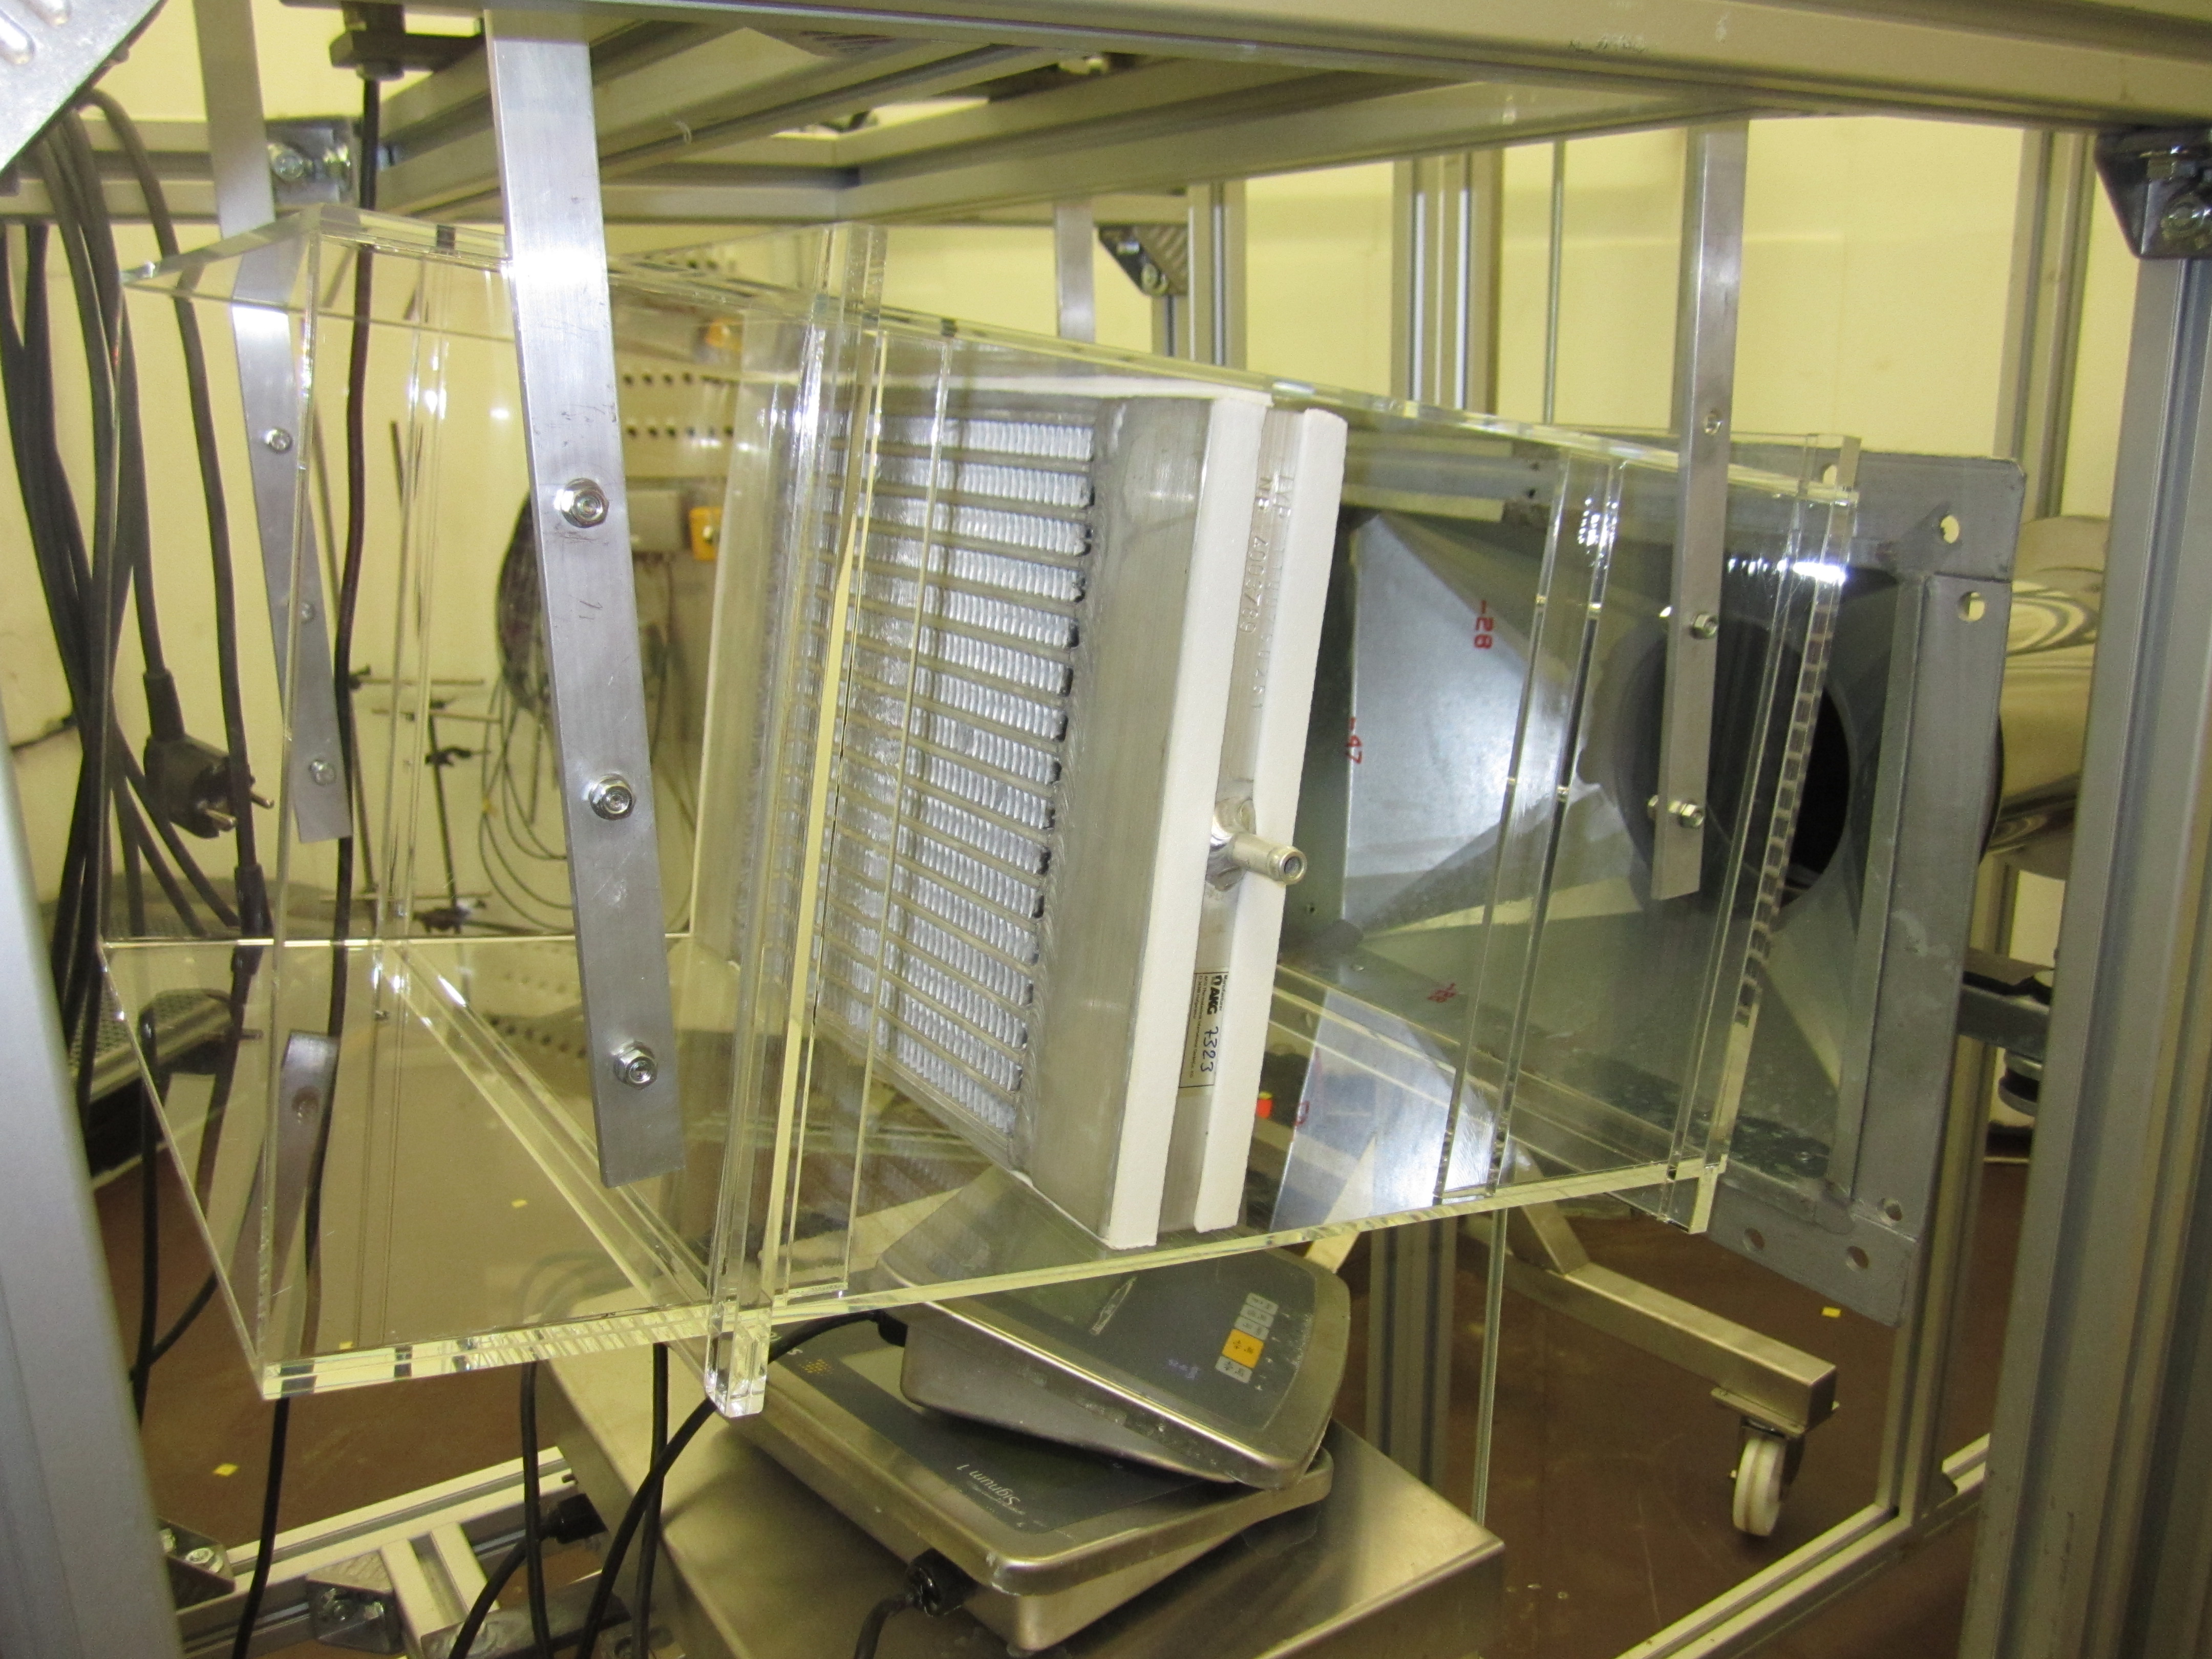
MPEfin Heat exchangers mounted in the flow channel
Copyright: AIT Austrian Institute of Technology, Center for Energy, Sustainable Thermal Energy Systems

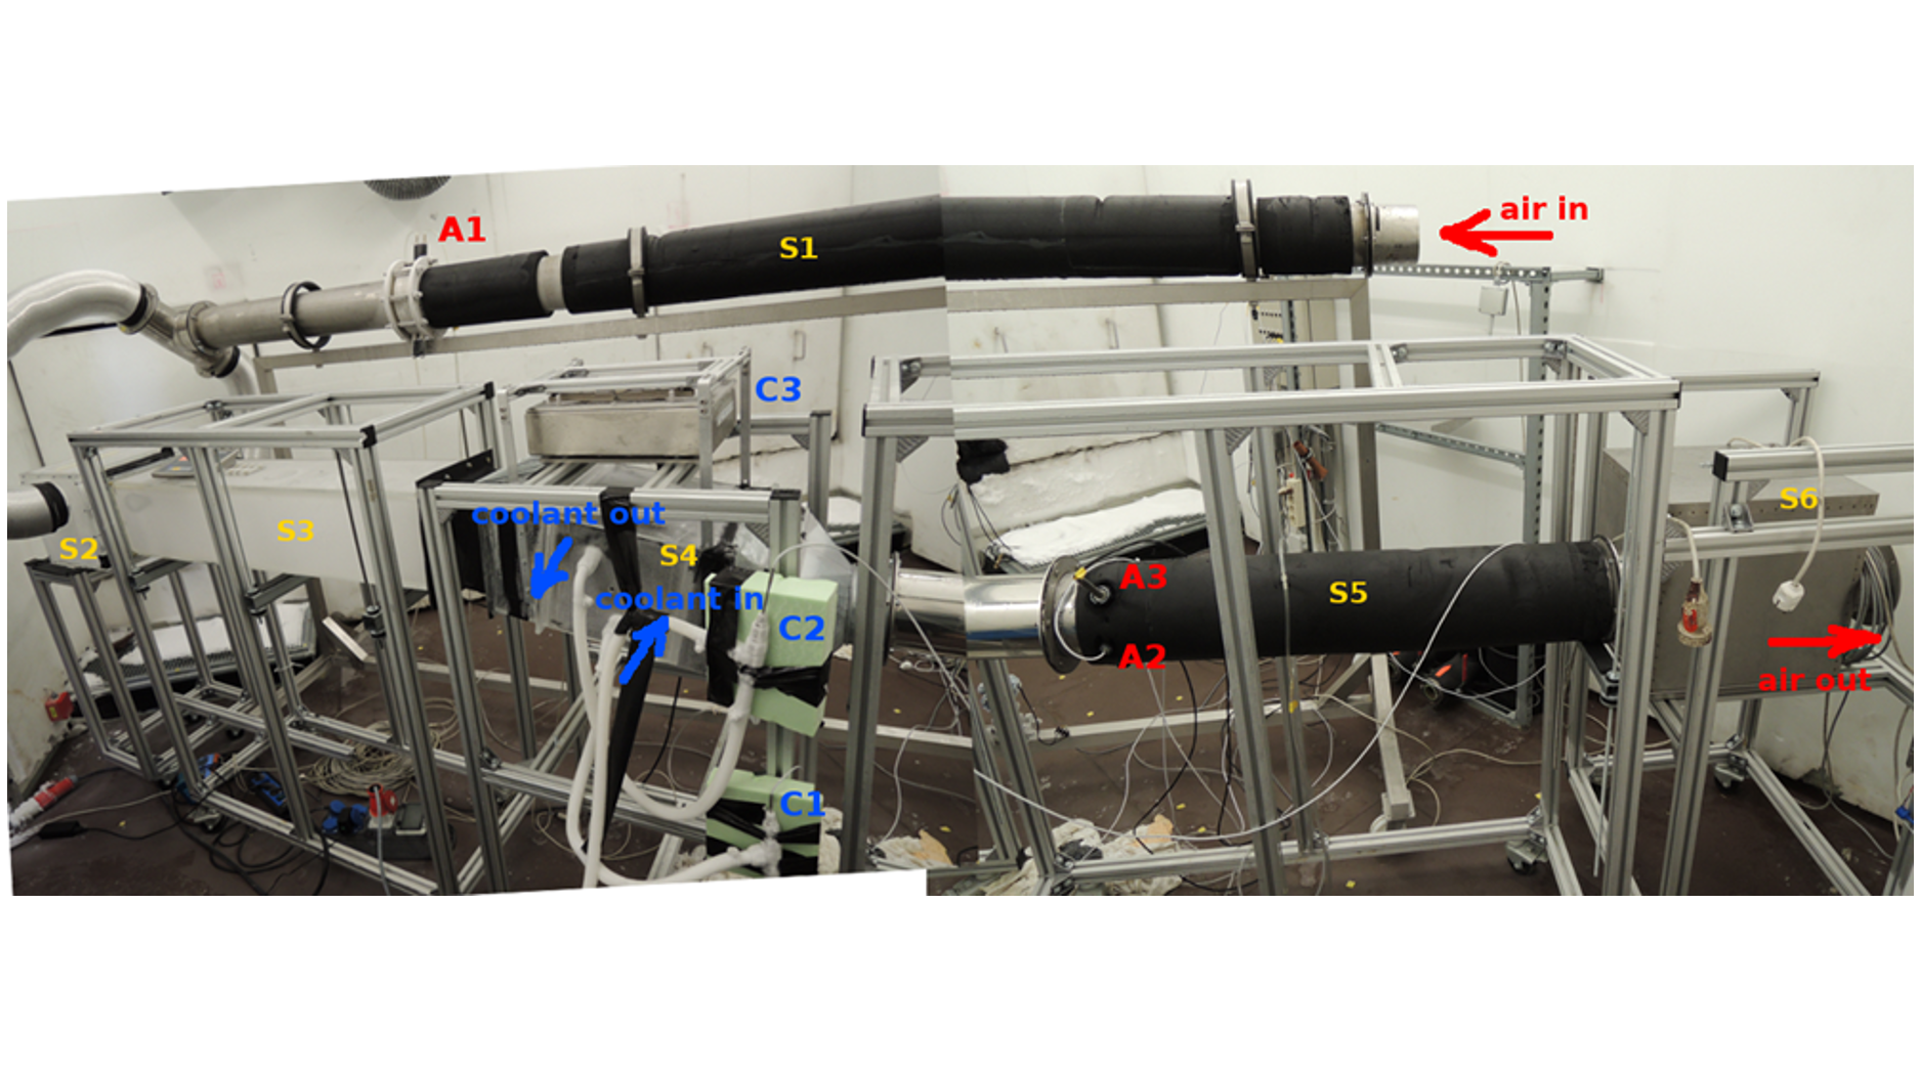
Experimental setup for investigating the frosting performance of heat exchangers at low ambient temperatures
Measurement sequence: in the initial phase the thermal mass of the heat exchanger is accommodated to the tempering conditions (A to B1), and then the main frost growth takes place (B1 to B2). Afterwards, the rapid change of the heat exchanger thermal state (at air flow rate curve steepest gradient) takes place (B2), and frost creation continues until the heat exchanger is fully blocked and the temperatures do not change any more (C).
Copyright: AIT Austrian Institute of Technology, Center for Energy, Sustainable Thermal Energy Systems
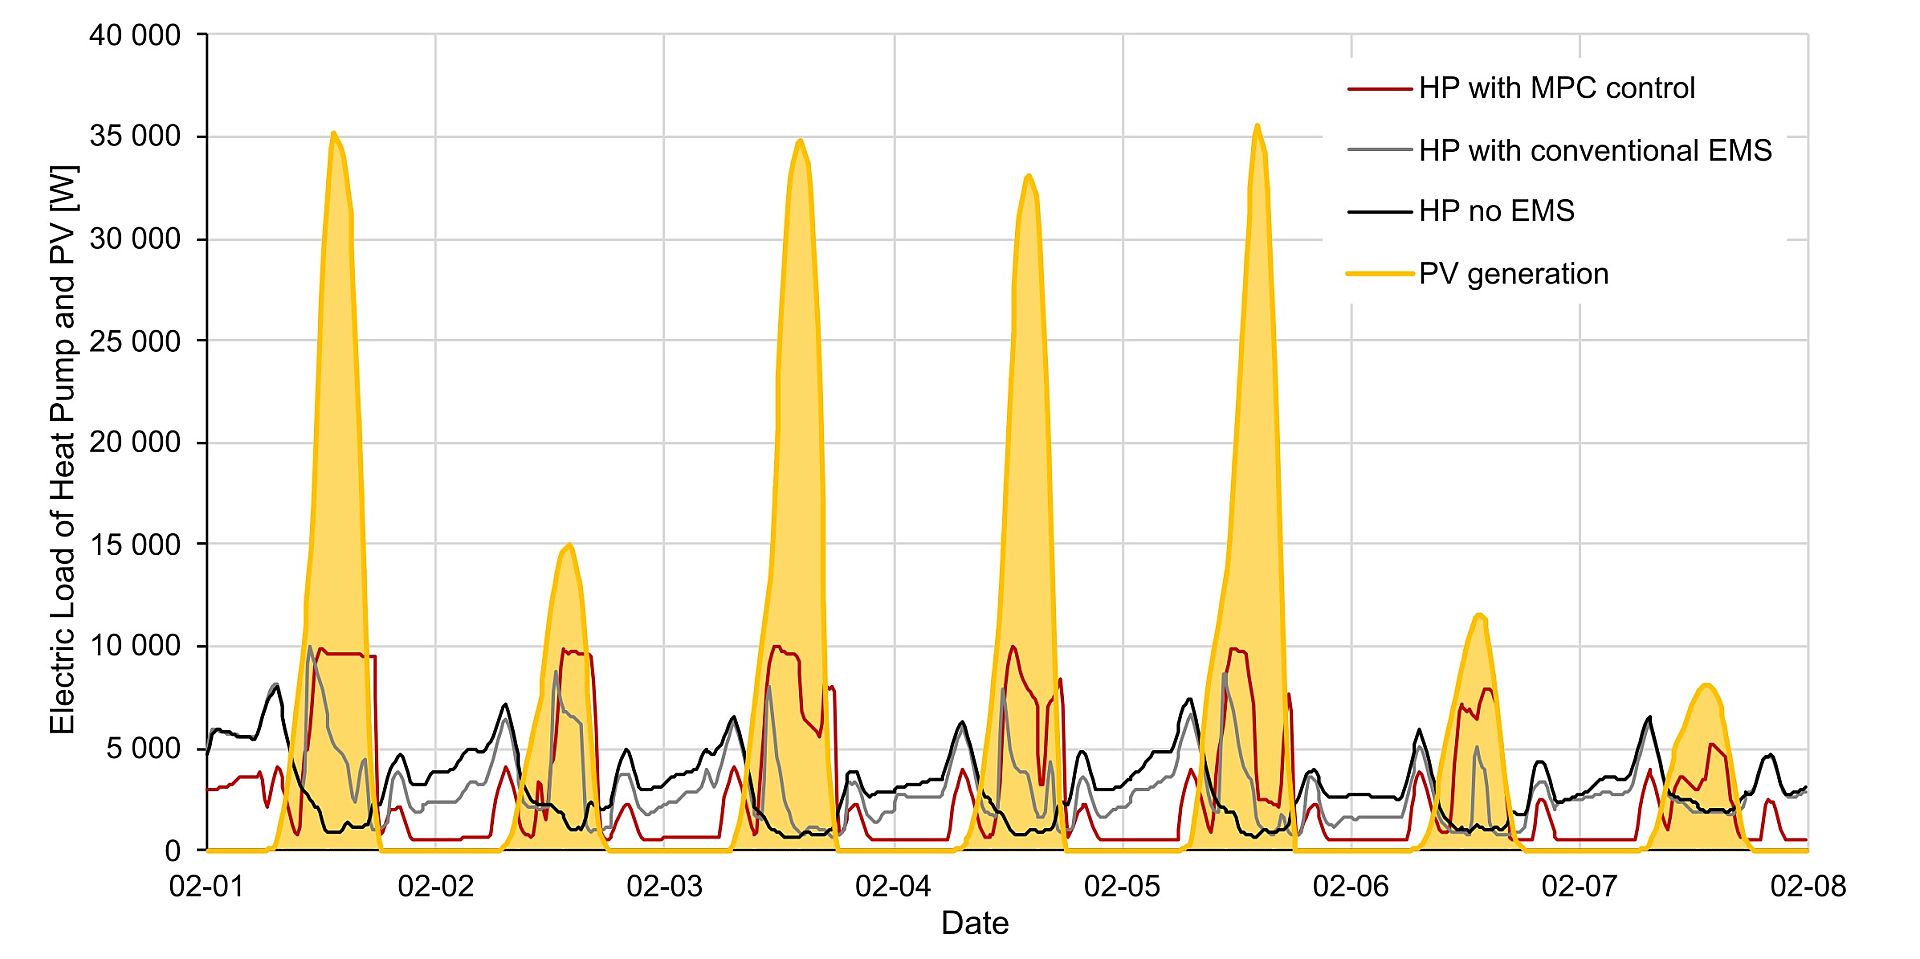
Simultaneity of PV electricity generation and heat pump electricity demand for different control strategies in the PEB use case EXCESS
Comparison of the electricity demand of heat pumps under different control strategies, simulated for the Austrian EXCESS demonstration building, in relation to the available PV generation on the façade for an average winter week in February. The building under investigation represents a use case in the IEA EBC Annex 83 project.
Copyright: AEE INTEC

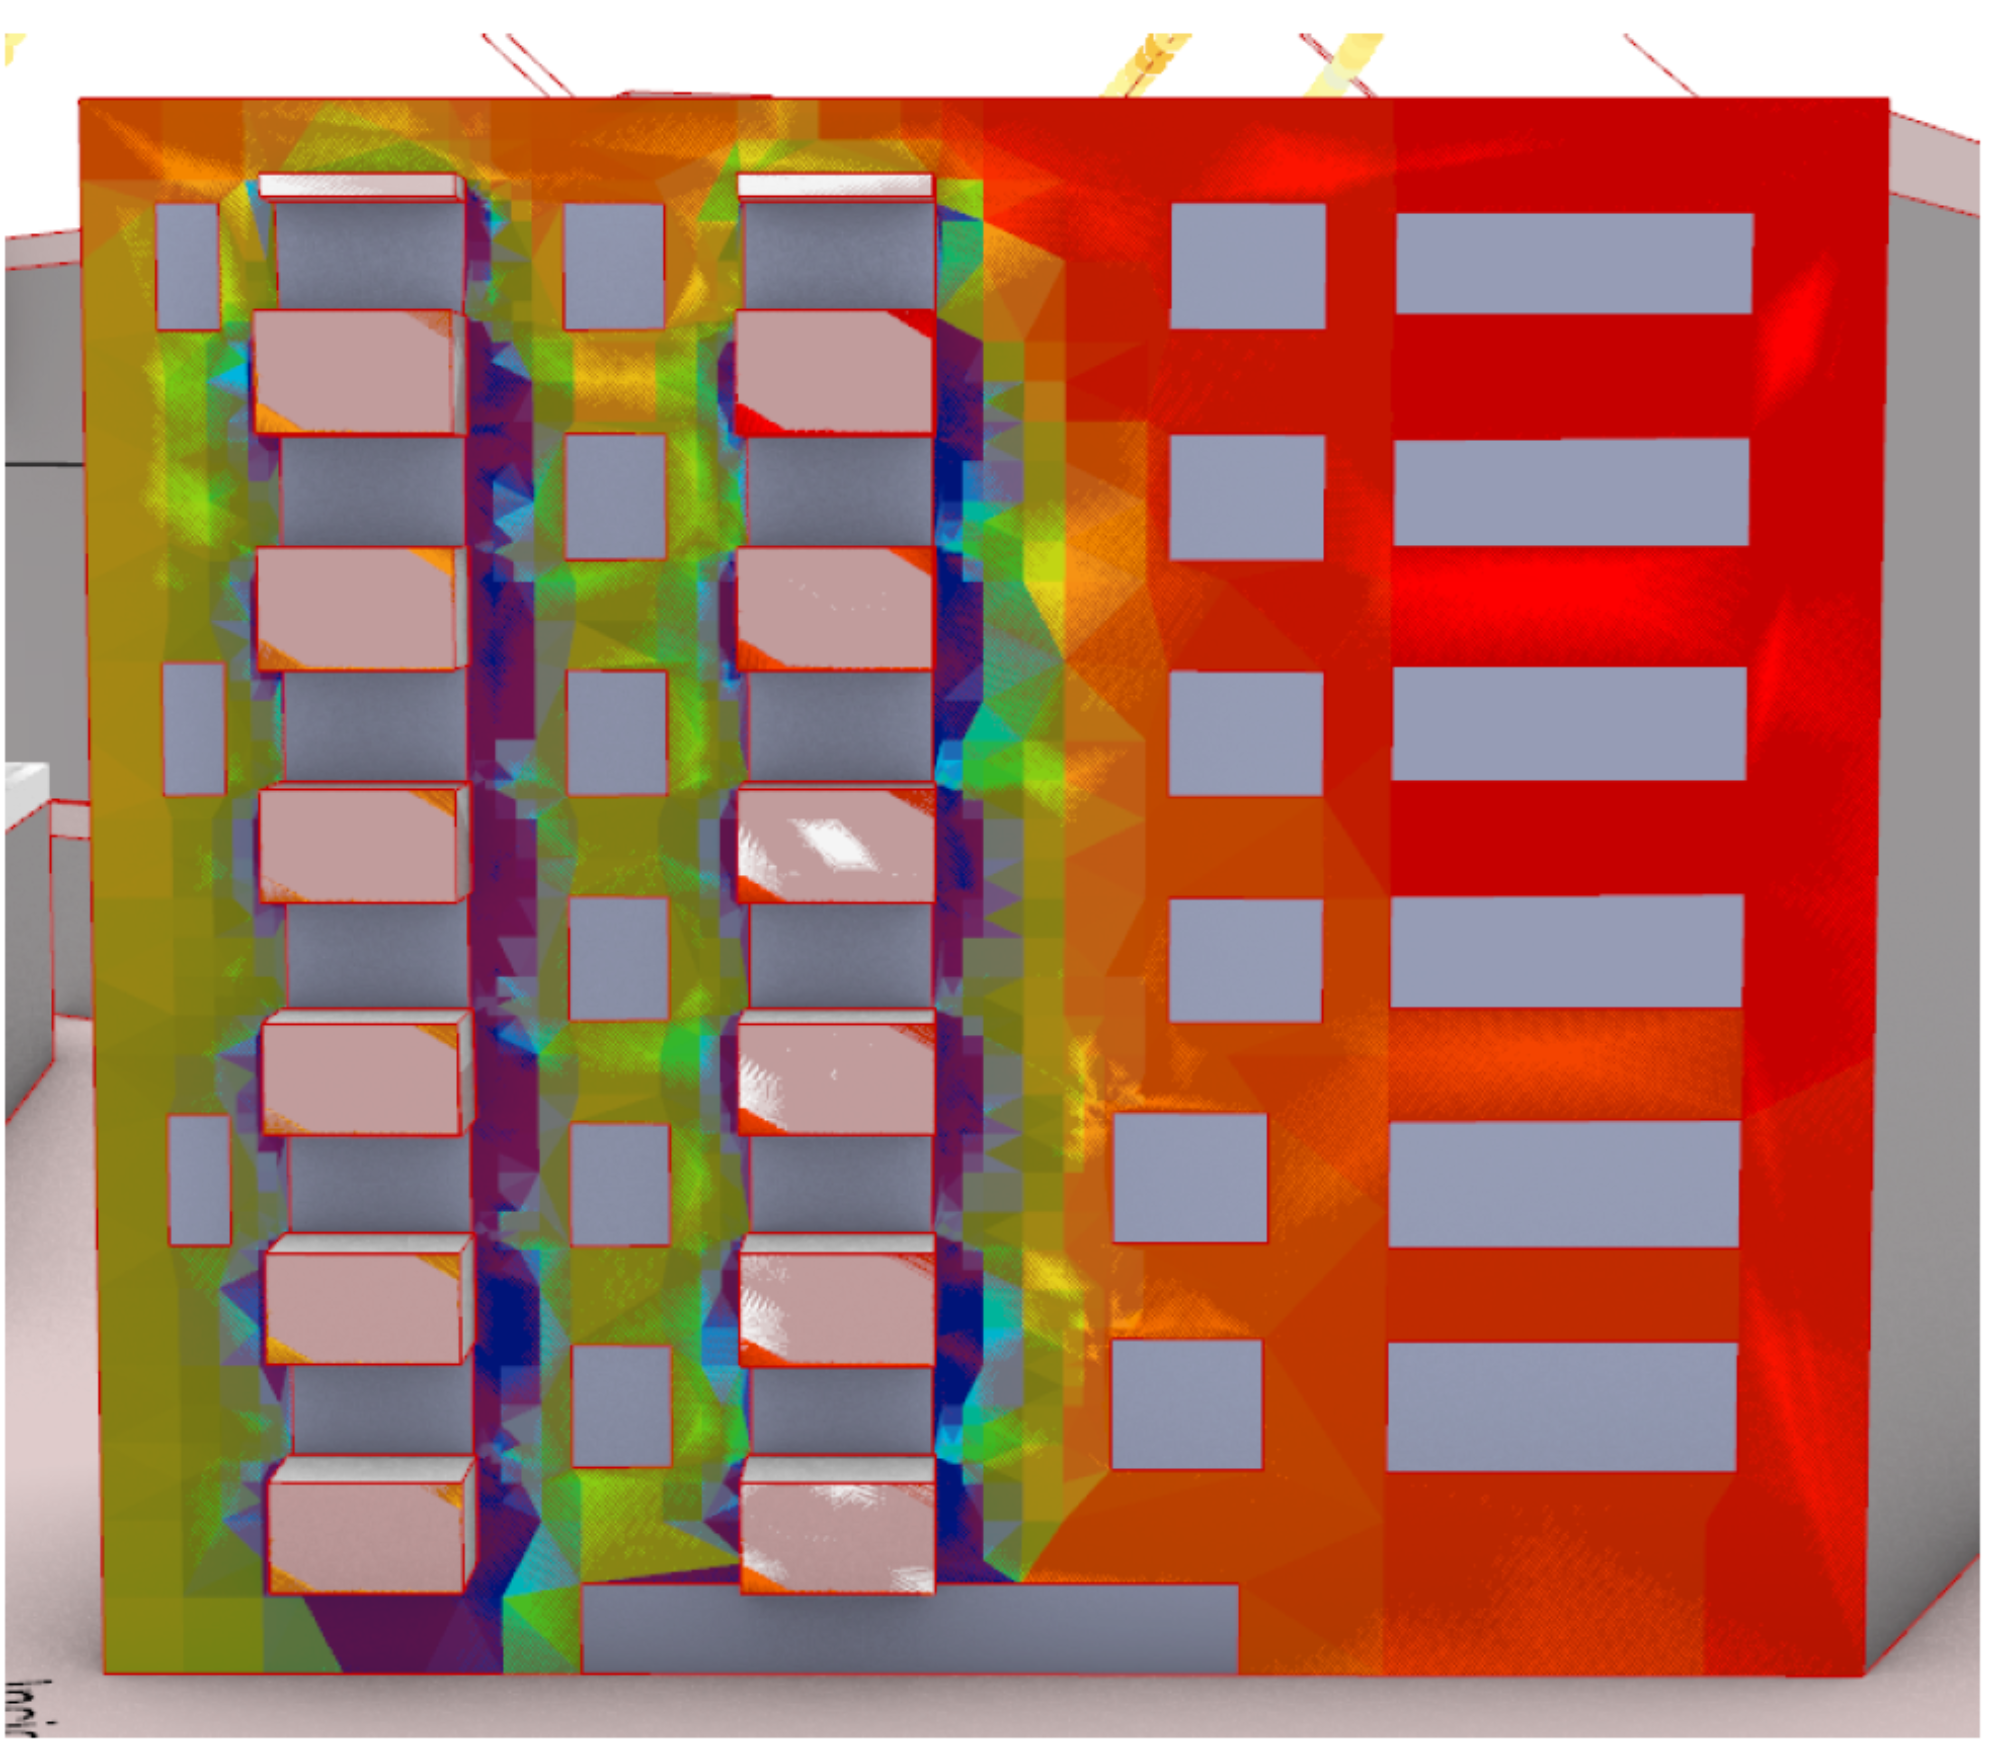
Innsbruck Campagne
PV Potential of the Facade - Project Innsbruck Campagne
Copyright: UIBK Heiß/Ochs
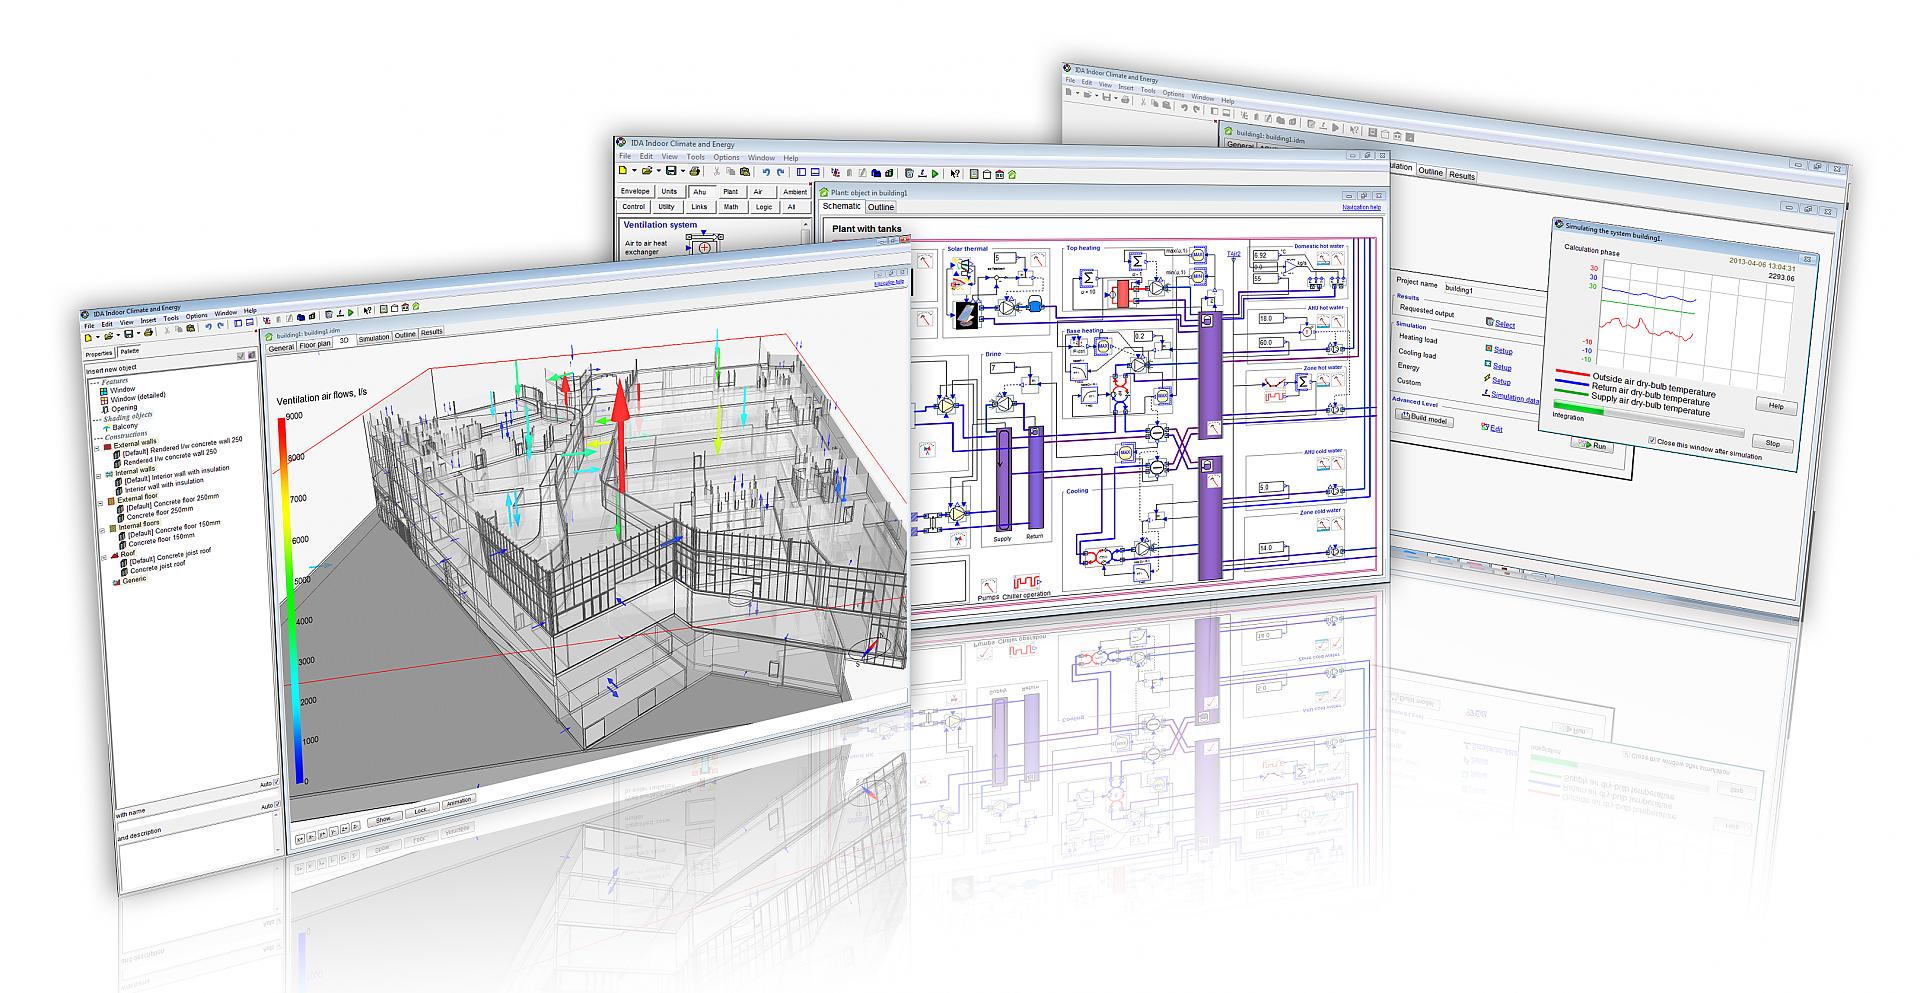
Combined building and plant simulation in real time
In a dynamic building simulation, the zones (rooms) are in contact with their surroundings and with the adjacent building components, the people, equipment and objects located in them. In the combined building and plant simulation, the dynamic interaction between building, plant and control is also taken into account. A building and plant simulation, adapted in real time to the actual weather conditions and current measurement data from the building, can help to optimize the control of the building services and thus reduce energy costs and increase user comfort.
Copyright: EQUA
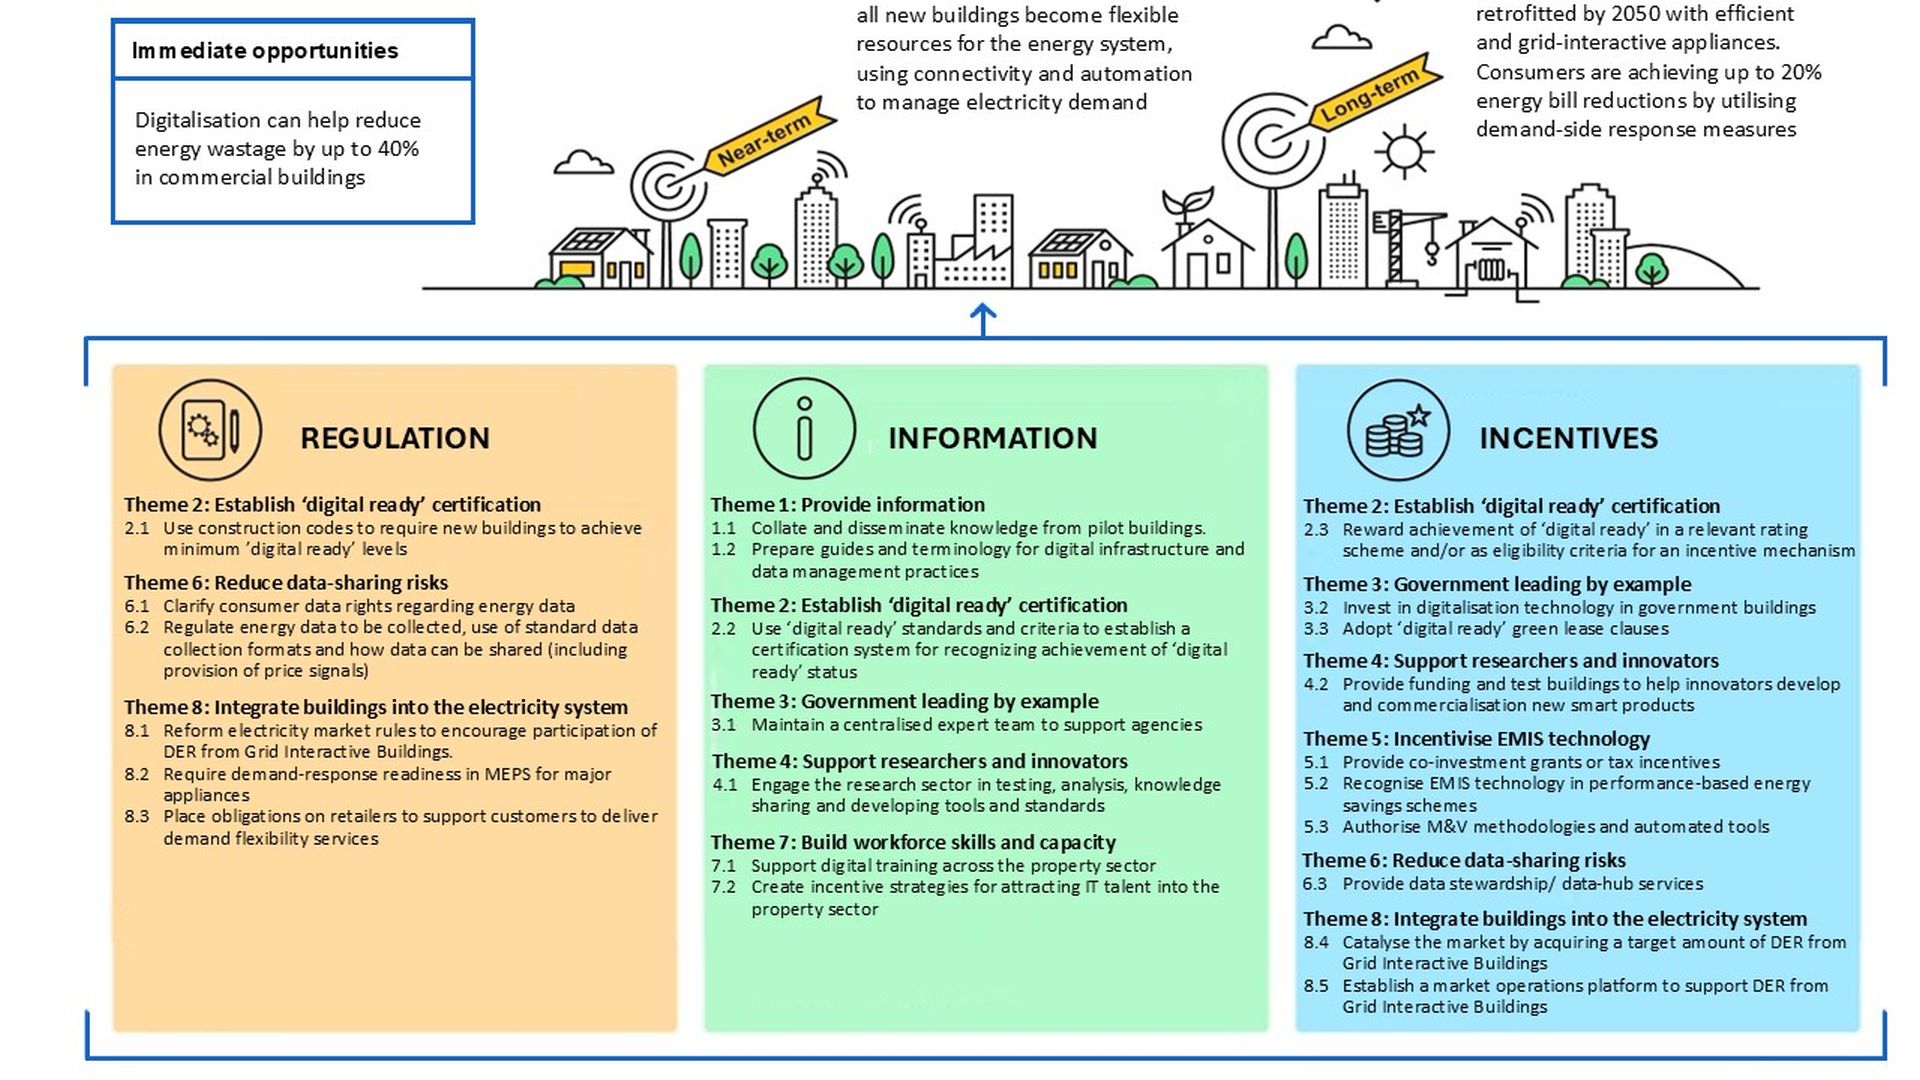
Annex 81 Policy Package
Graphic representation of the policy package of measures developed in Annex 81 to promote Data-Driven Smart Buildings.
Copyright: Stephen White - format adopted from from IEA, 2023 “Energy Efficiency Policy Toolkit 2023”,
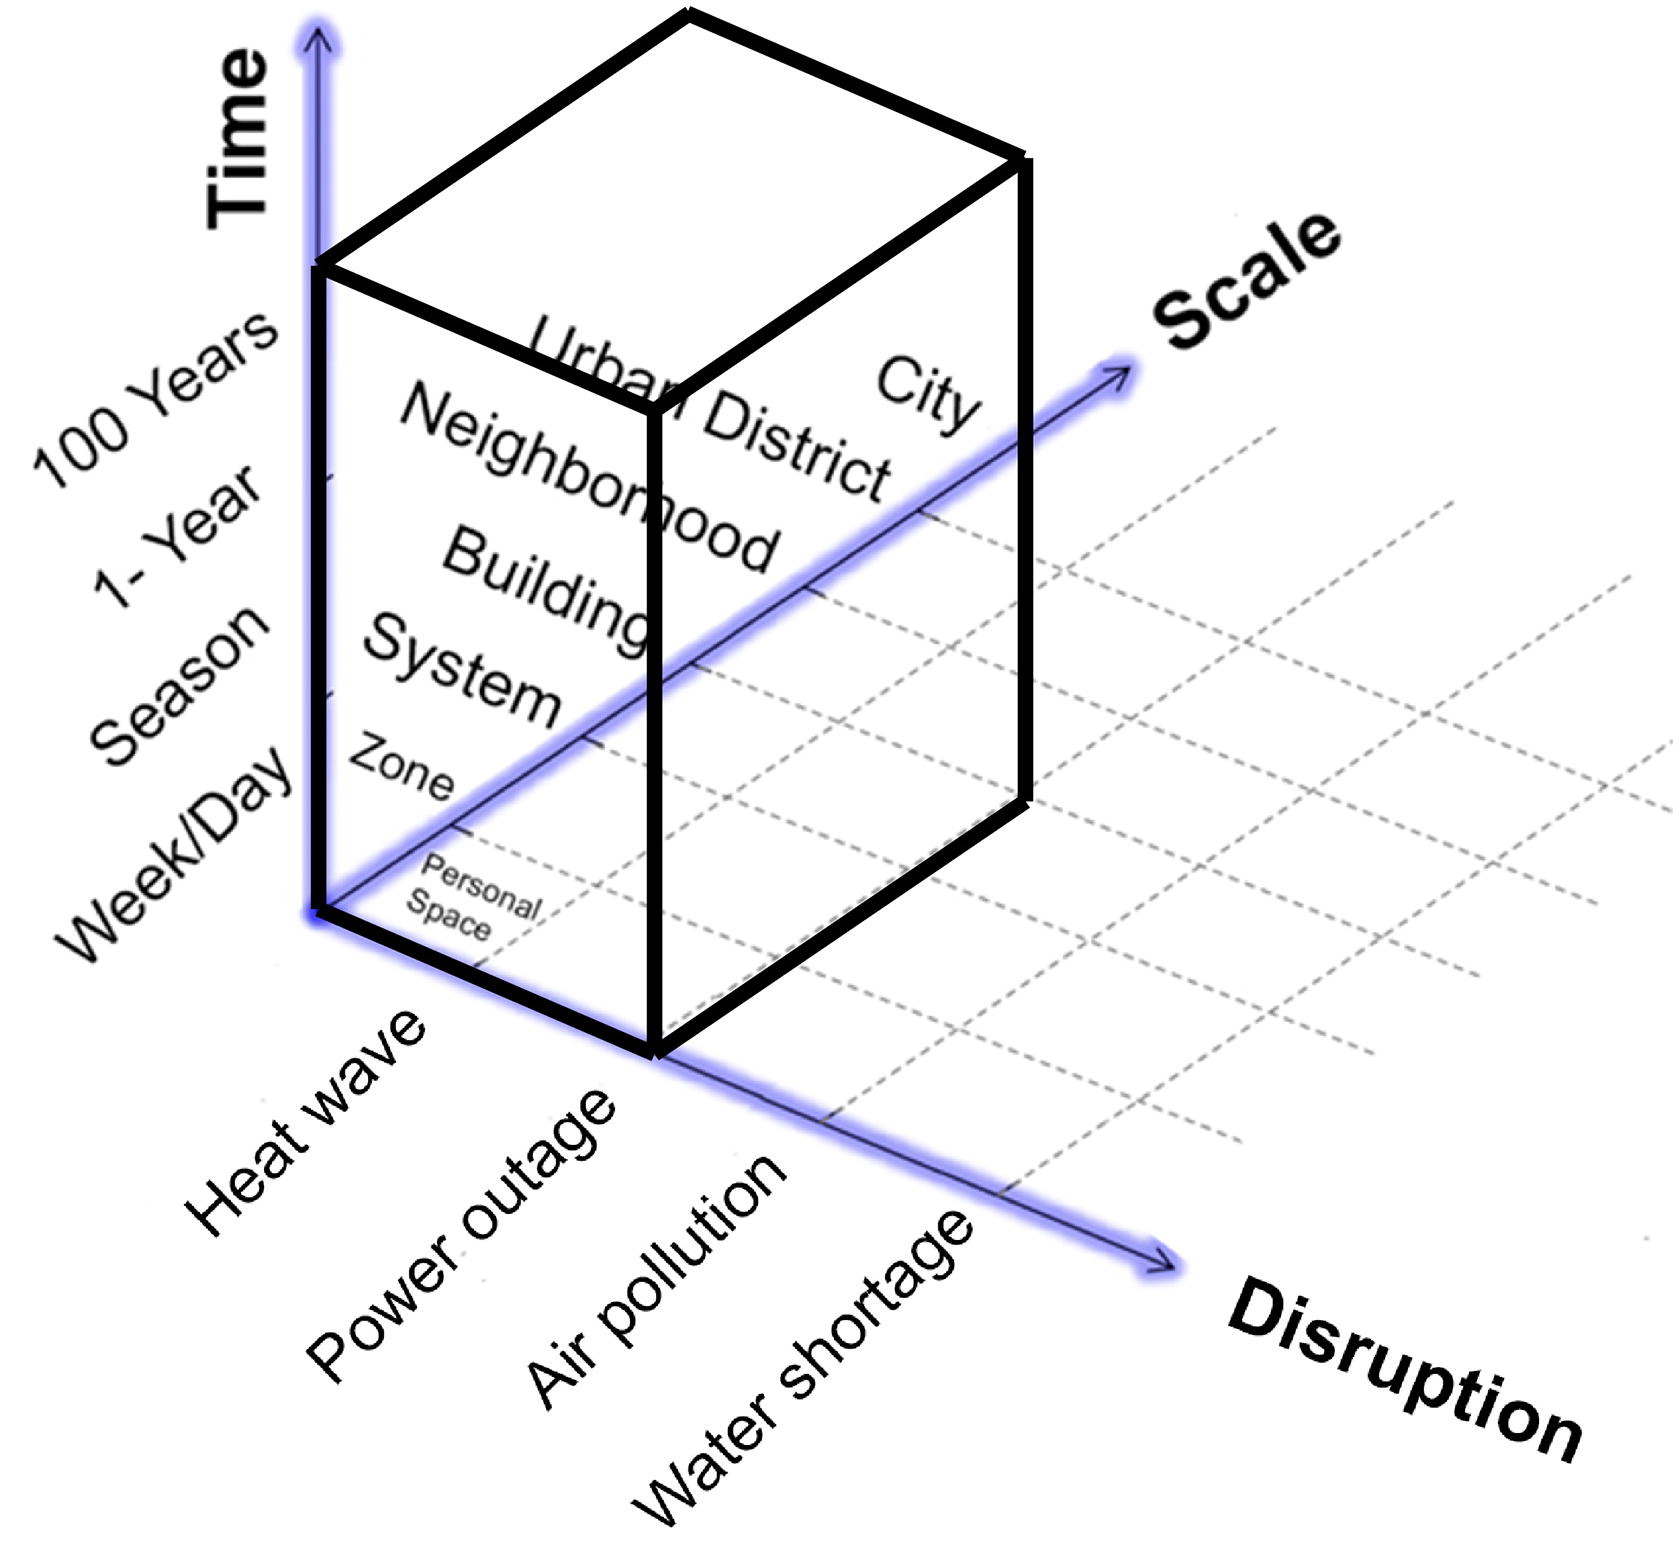
Scope of Resilience Definition
This figure illustrates the chosen framework for assessing the resilience of buildings. The definition focuses on building scale, with consideration of heat waves and power outages for a period of the next 100 years.
Copyright: Shady Attia, Ronnen Levinson, Eileen Ndongo, Peter Holzer, Ongun Berk Kazanci, Shabnam Homaei, Chen Zhang, Bjarne W. Olesen, Dahai Qi, Mohamed Hamdy, Per Heiselberg; Resilient cooling of buildings to protect against heat waves and power outages: Key concepts and definition; Energy and Buildings, Volume 239; 2021; 110869, ISSN 0378-7788, https://doi.org/10.1016/j.enbuild.2021.110869.
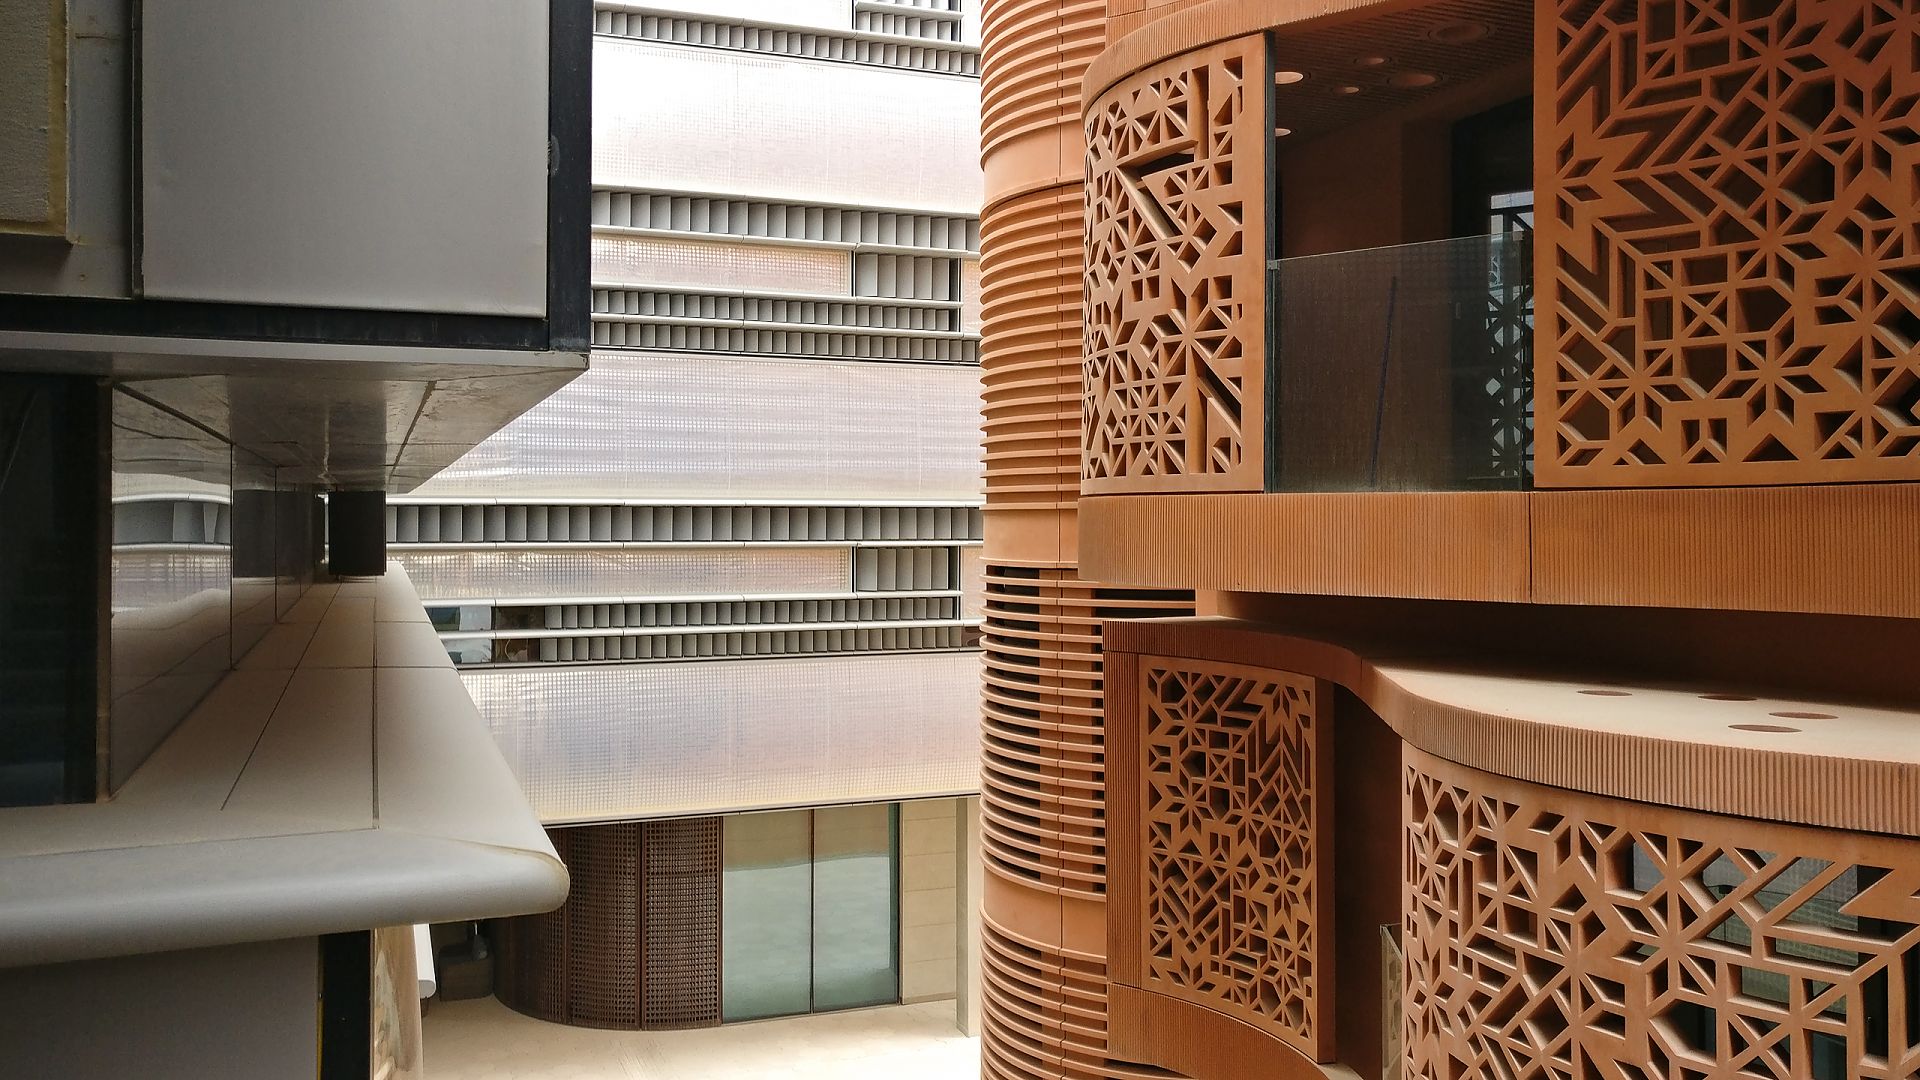
Example of Façade-integrated Shading - Masdar City, United Arab Emirates
This illustration shows solar shading. The image was taken in the experimental " ecological city" of Masdar City, United Arab Emirates.