
Project Image Pool
There are 200 results.
Terms of use: The pictures on this site originate from the projects in the frame of the programmes City of Tomorrow, Building of Tomorrow and the IEA Research Cooperation. They may be used credited for non-commercial purposes under the Creative Commons License Attribution-NonCommercial (CC BY-NC).
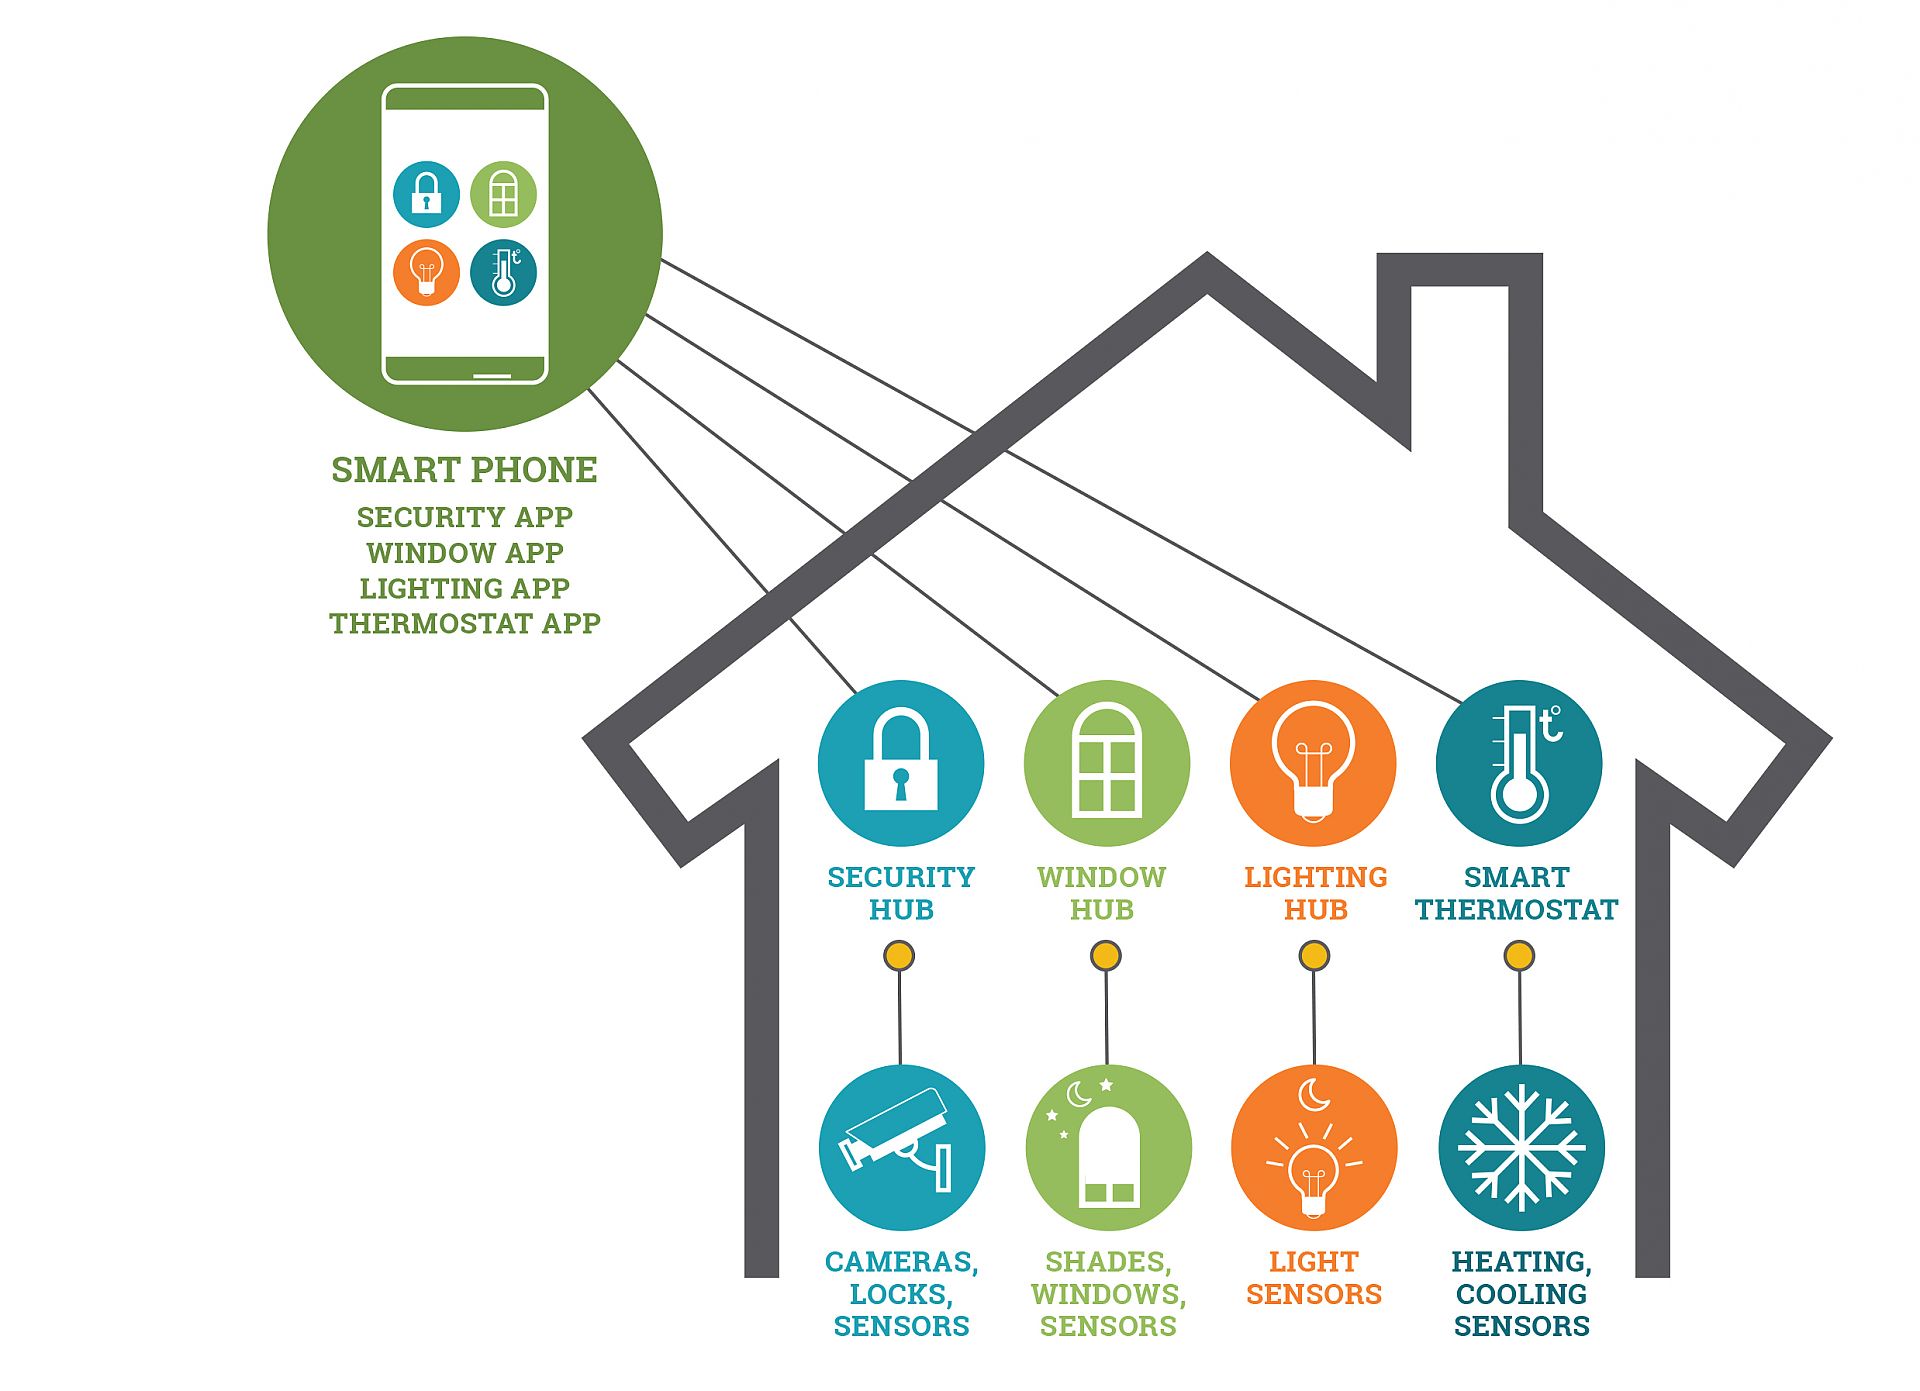
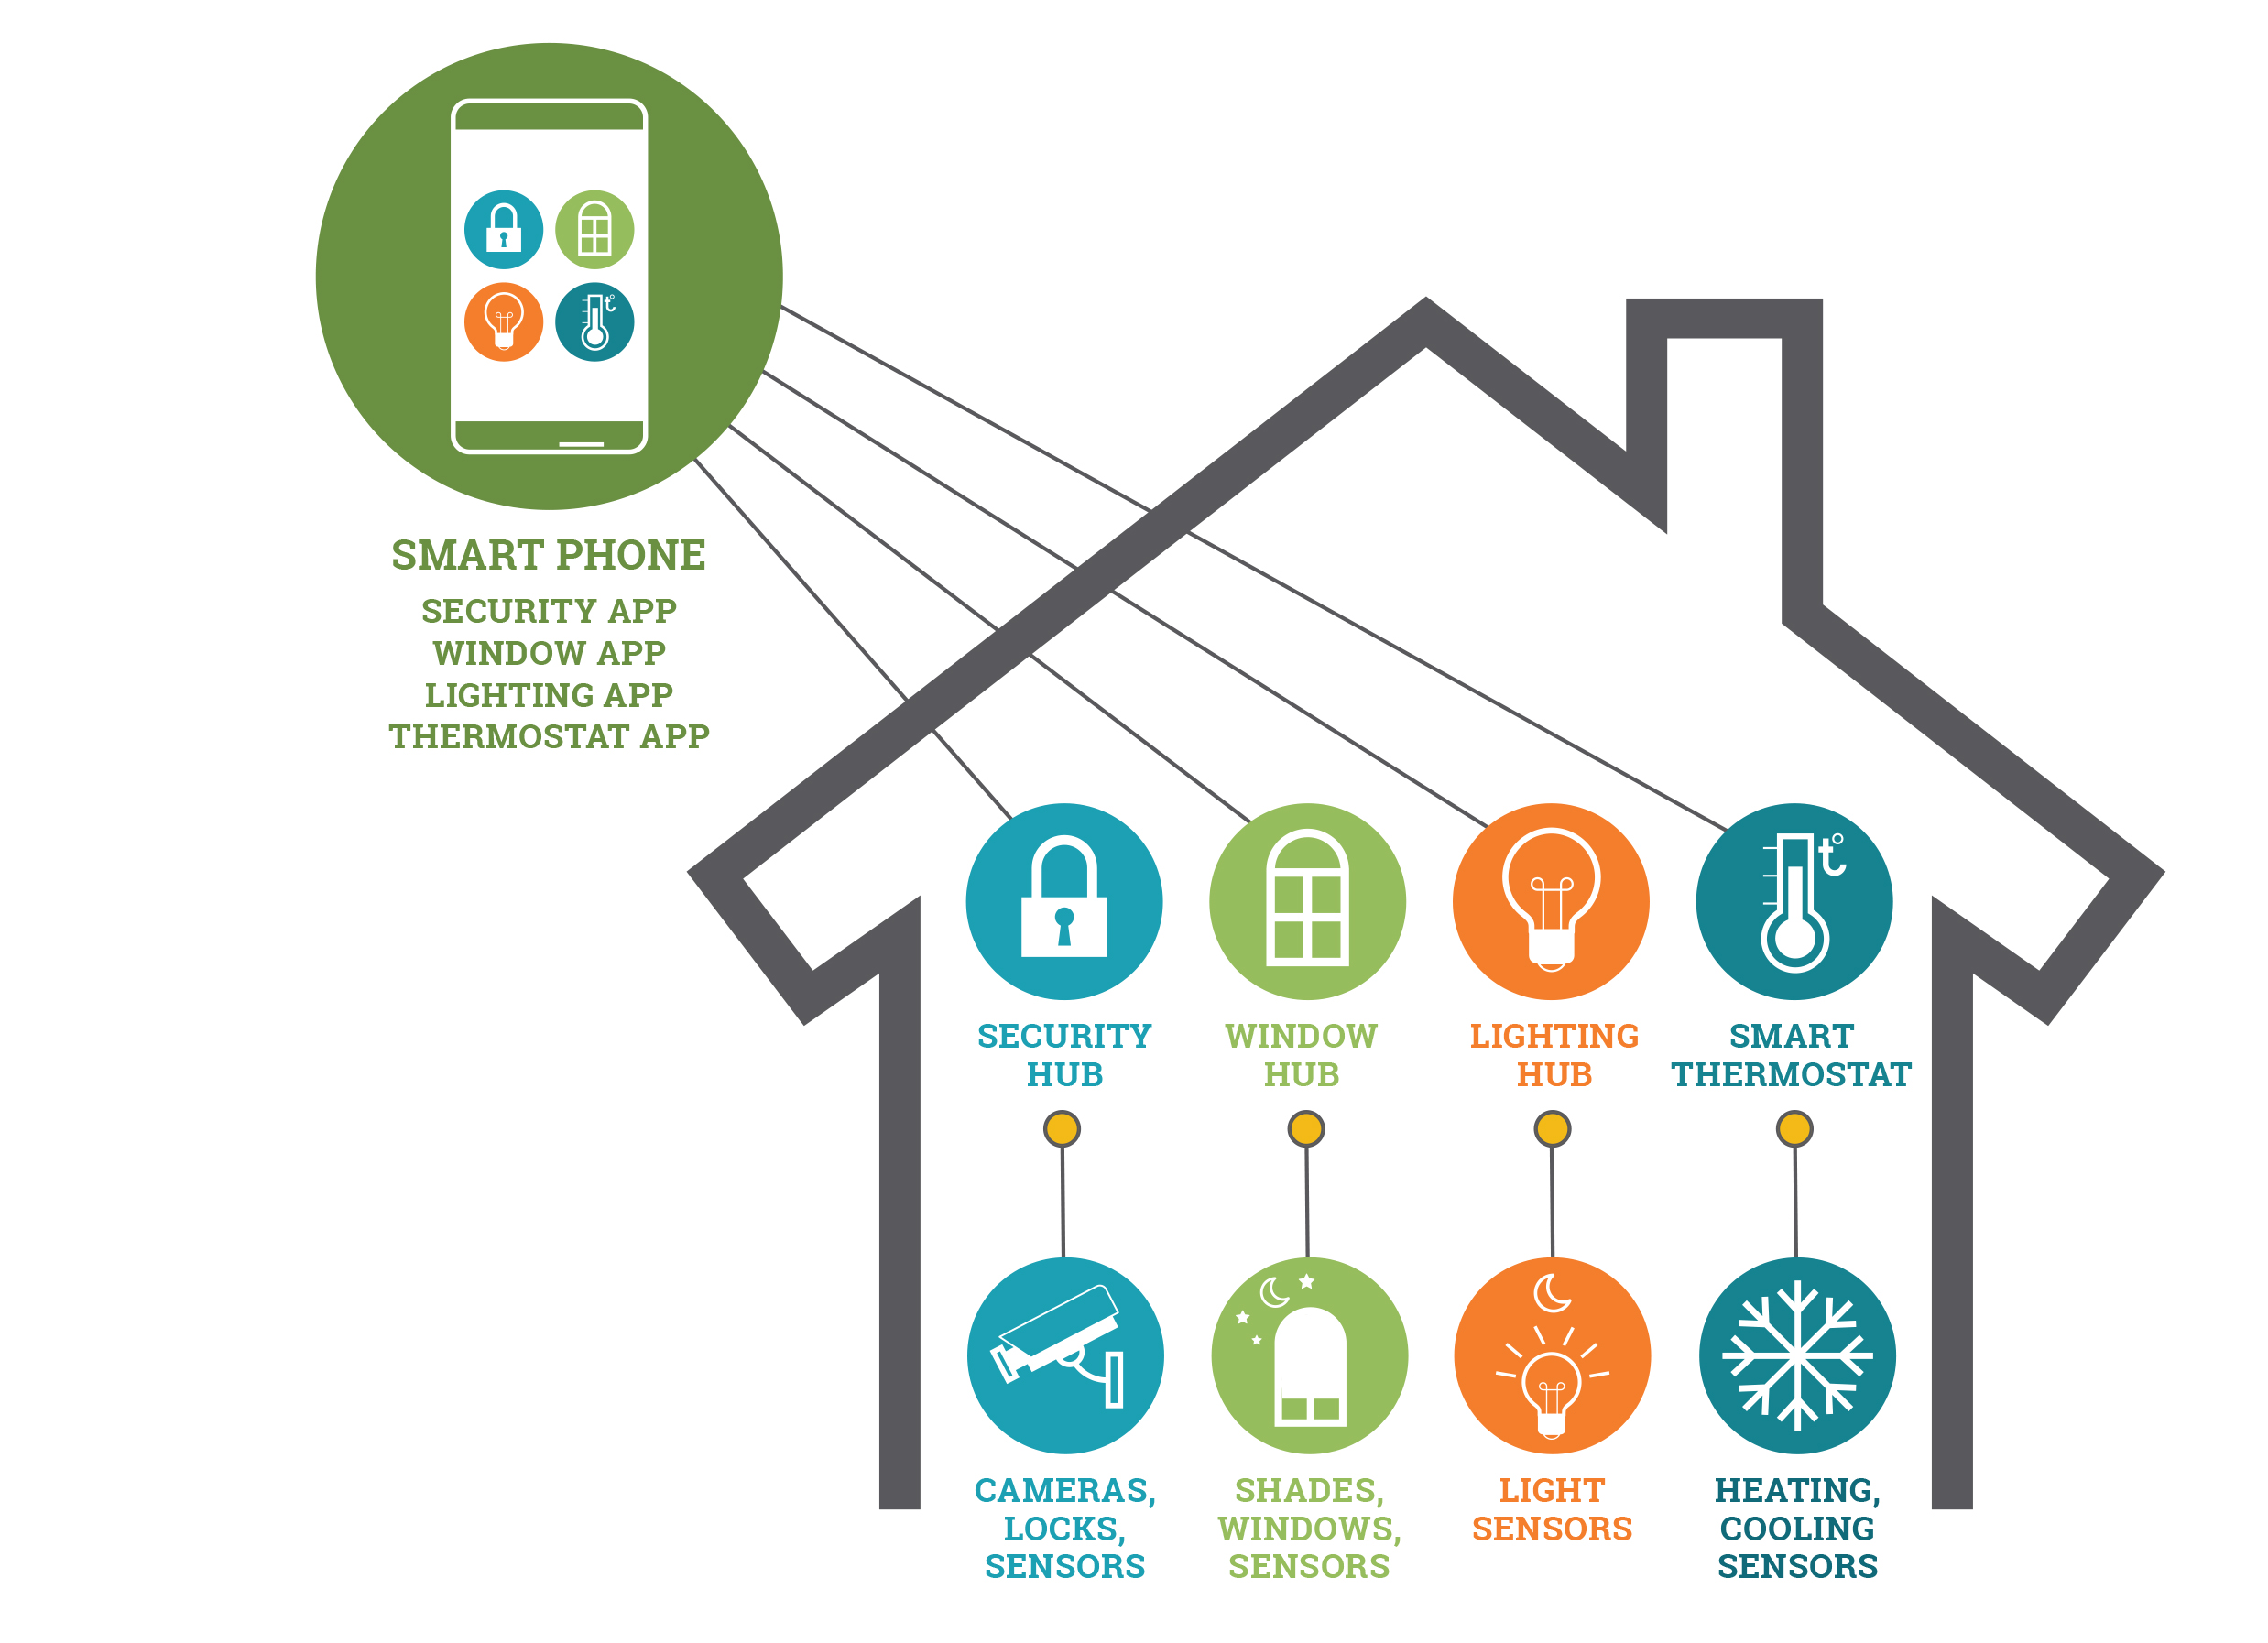
Smart home with multiple systems
Smart home with multiple smart systems and interfaces, for example, smart meter display, lighting control display, heating and cooling control display, window status display etc. (This raises concerns about interoperability and acceptance by users).
Copyright: IEA 4E Electronic Devices and Networks Annex - EDNA (https://edna.iea-4e.org/)
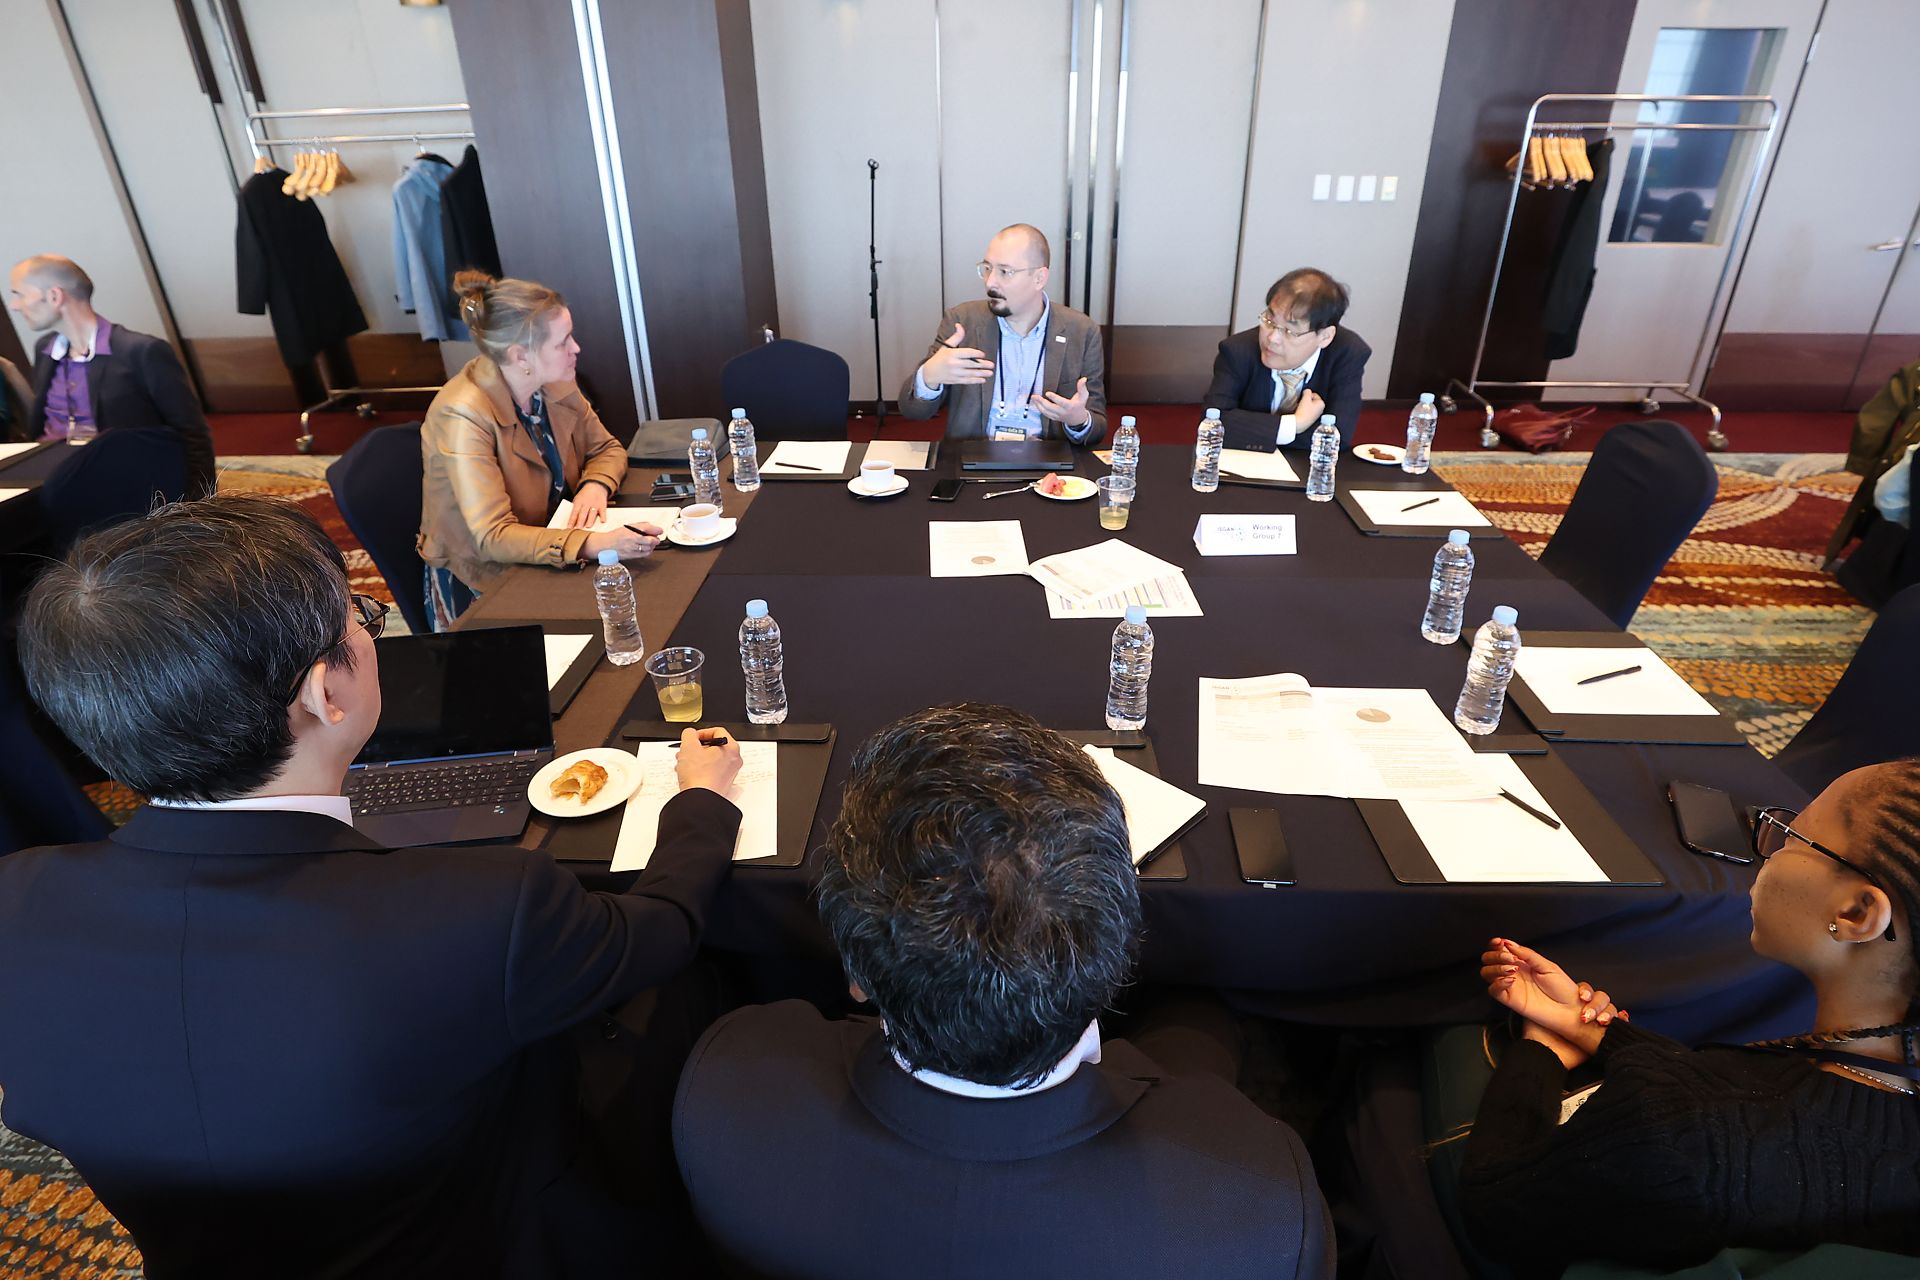
Discussion of Working Group 7 with country representatives during the Executive Committee 28 meeting
Discussion on the selection of topics and their elaboration in Working Group 7
Copyright: ISGAN

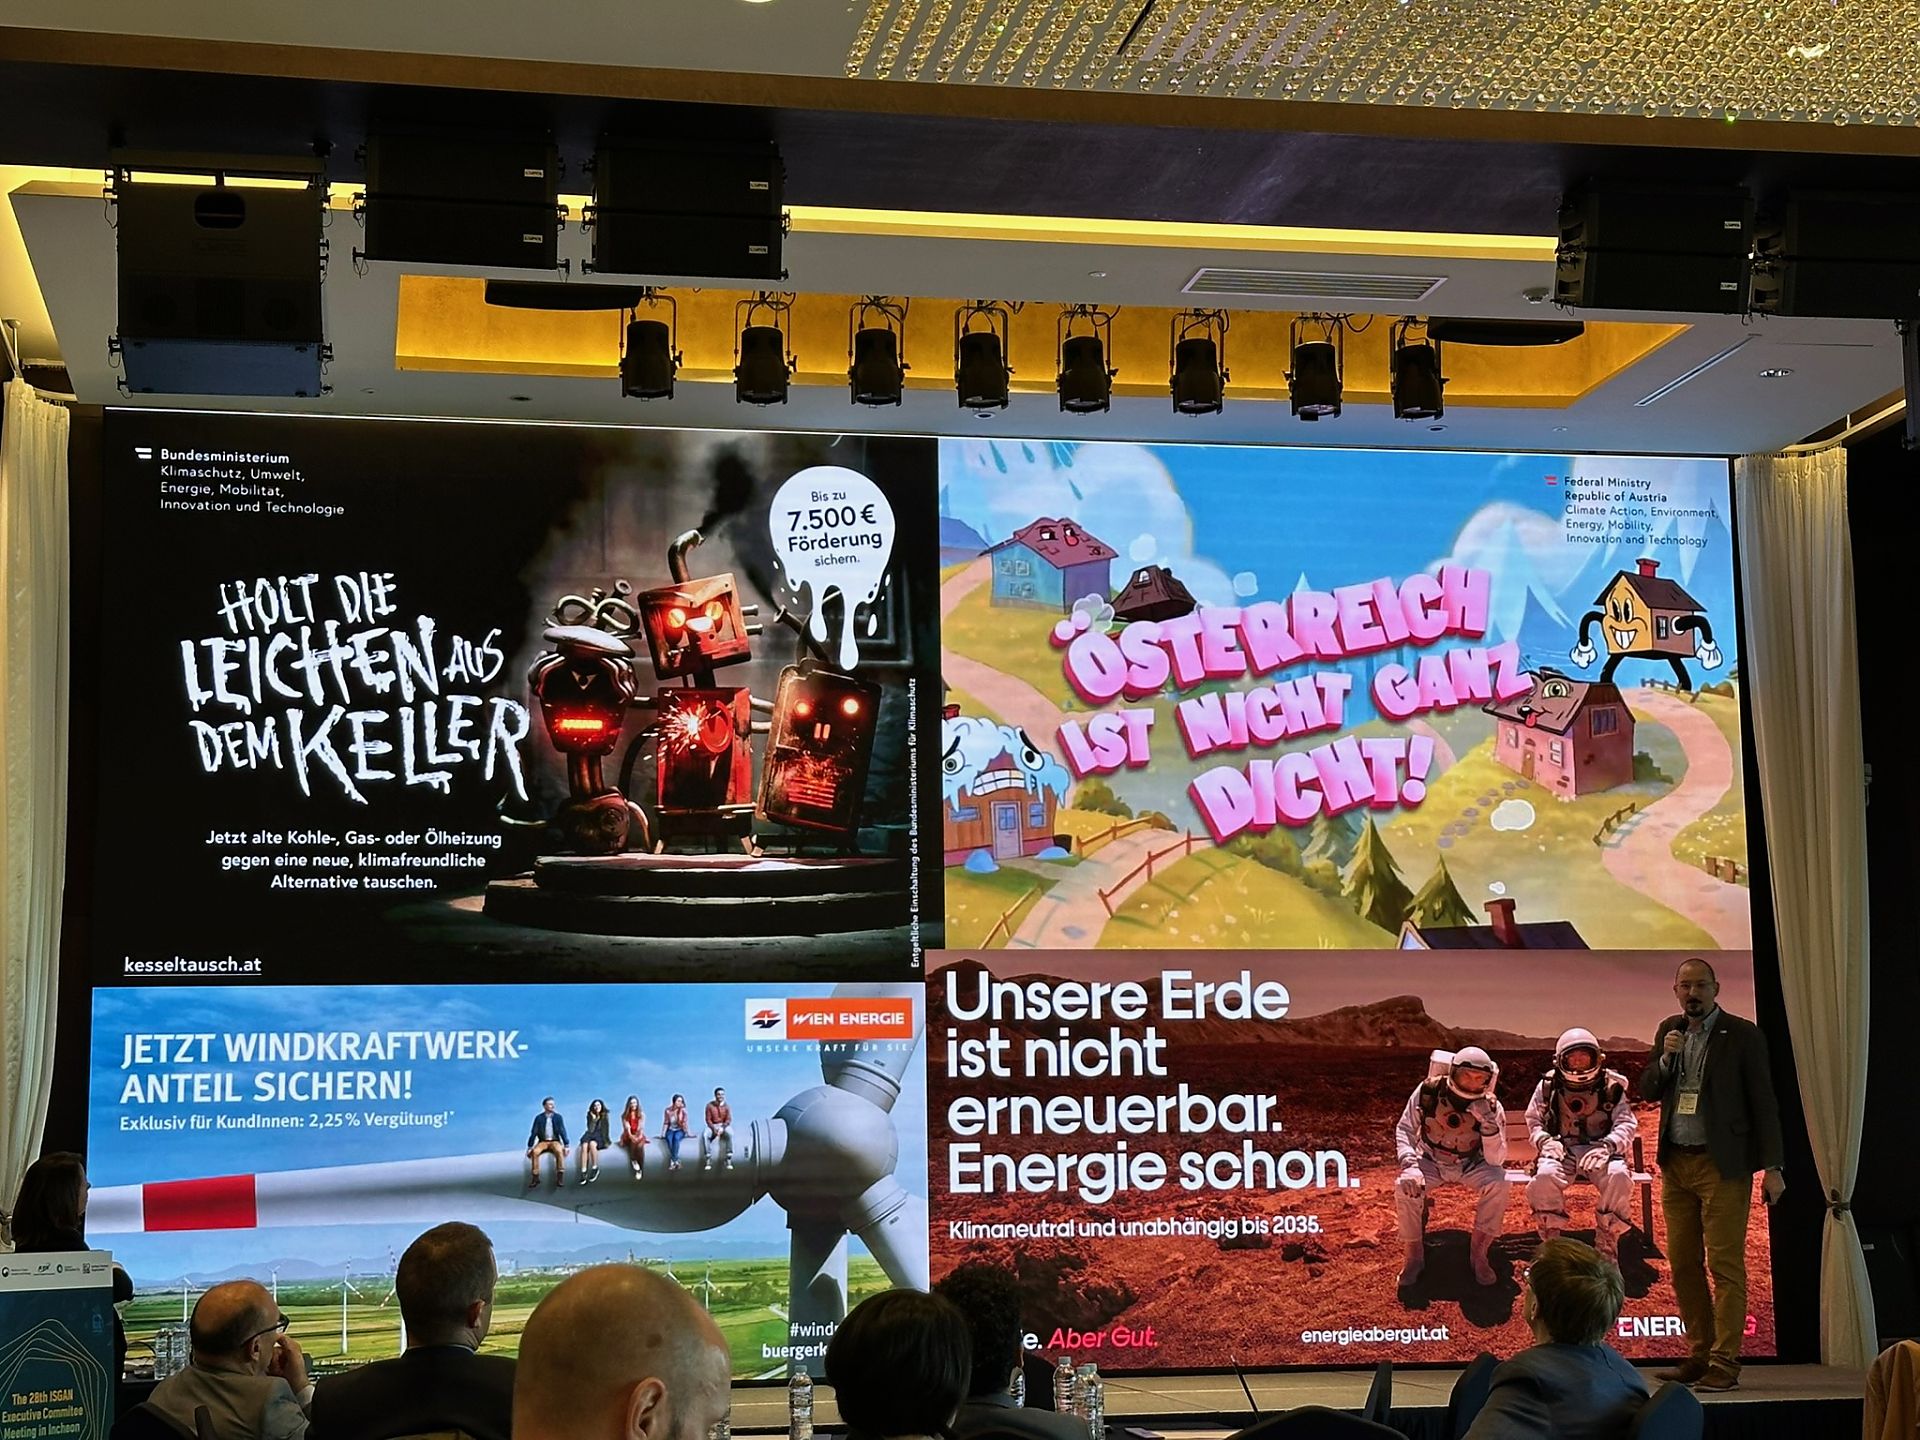
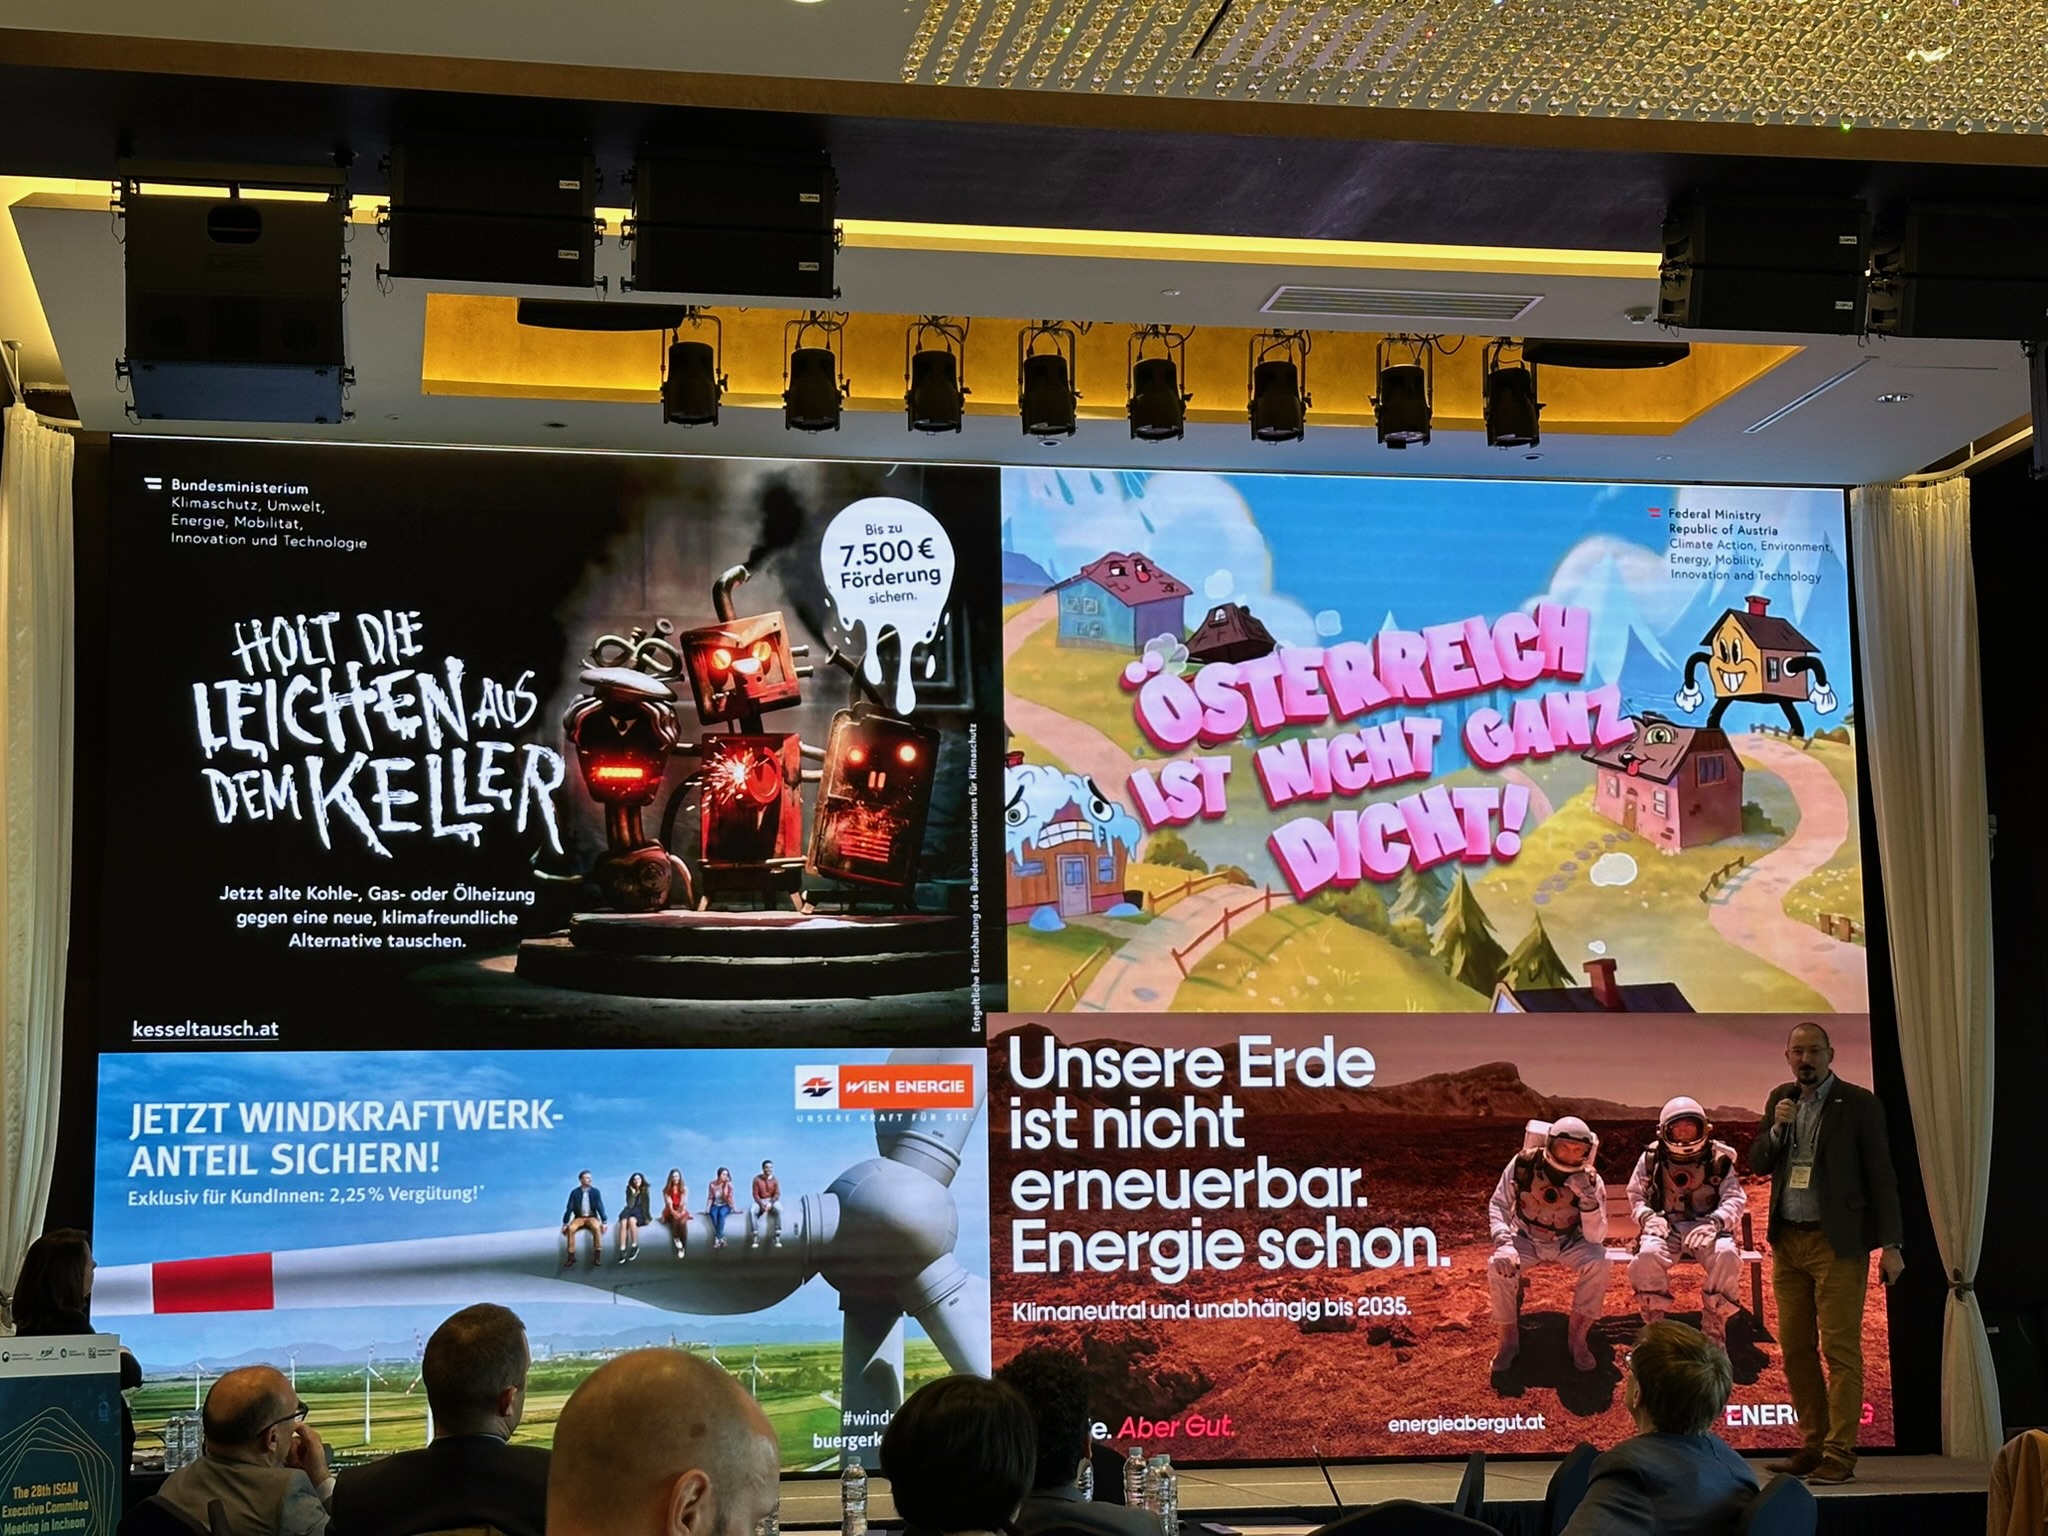
Presentation of approaches for public involvement in the energy sector in Austria
Explanation of approaches to public involvement based on campaigns by public and private actors
Copyright: ISGAN
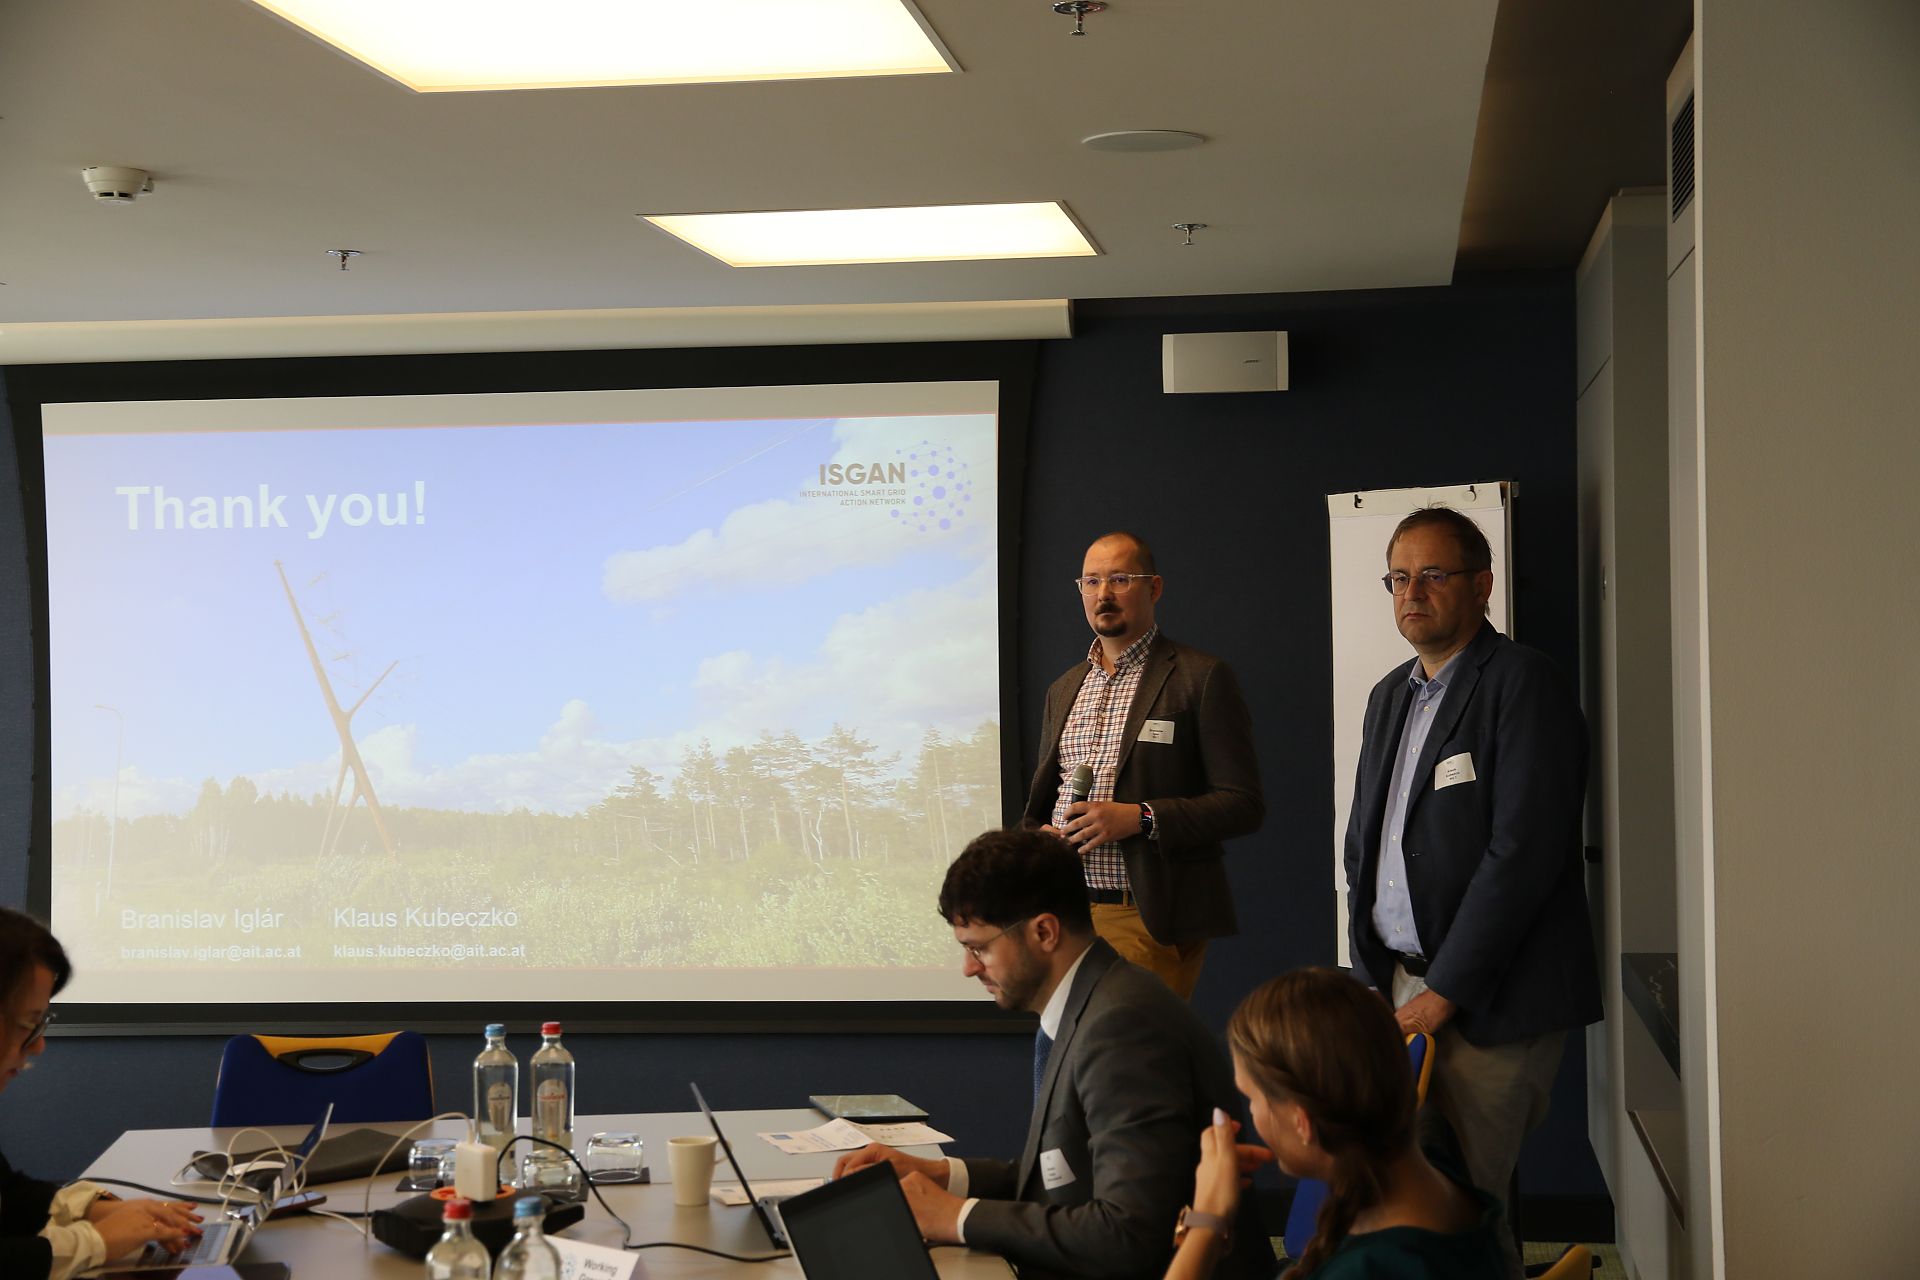
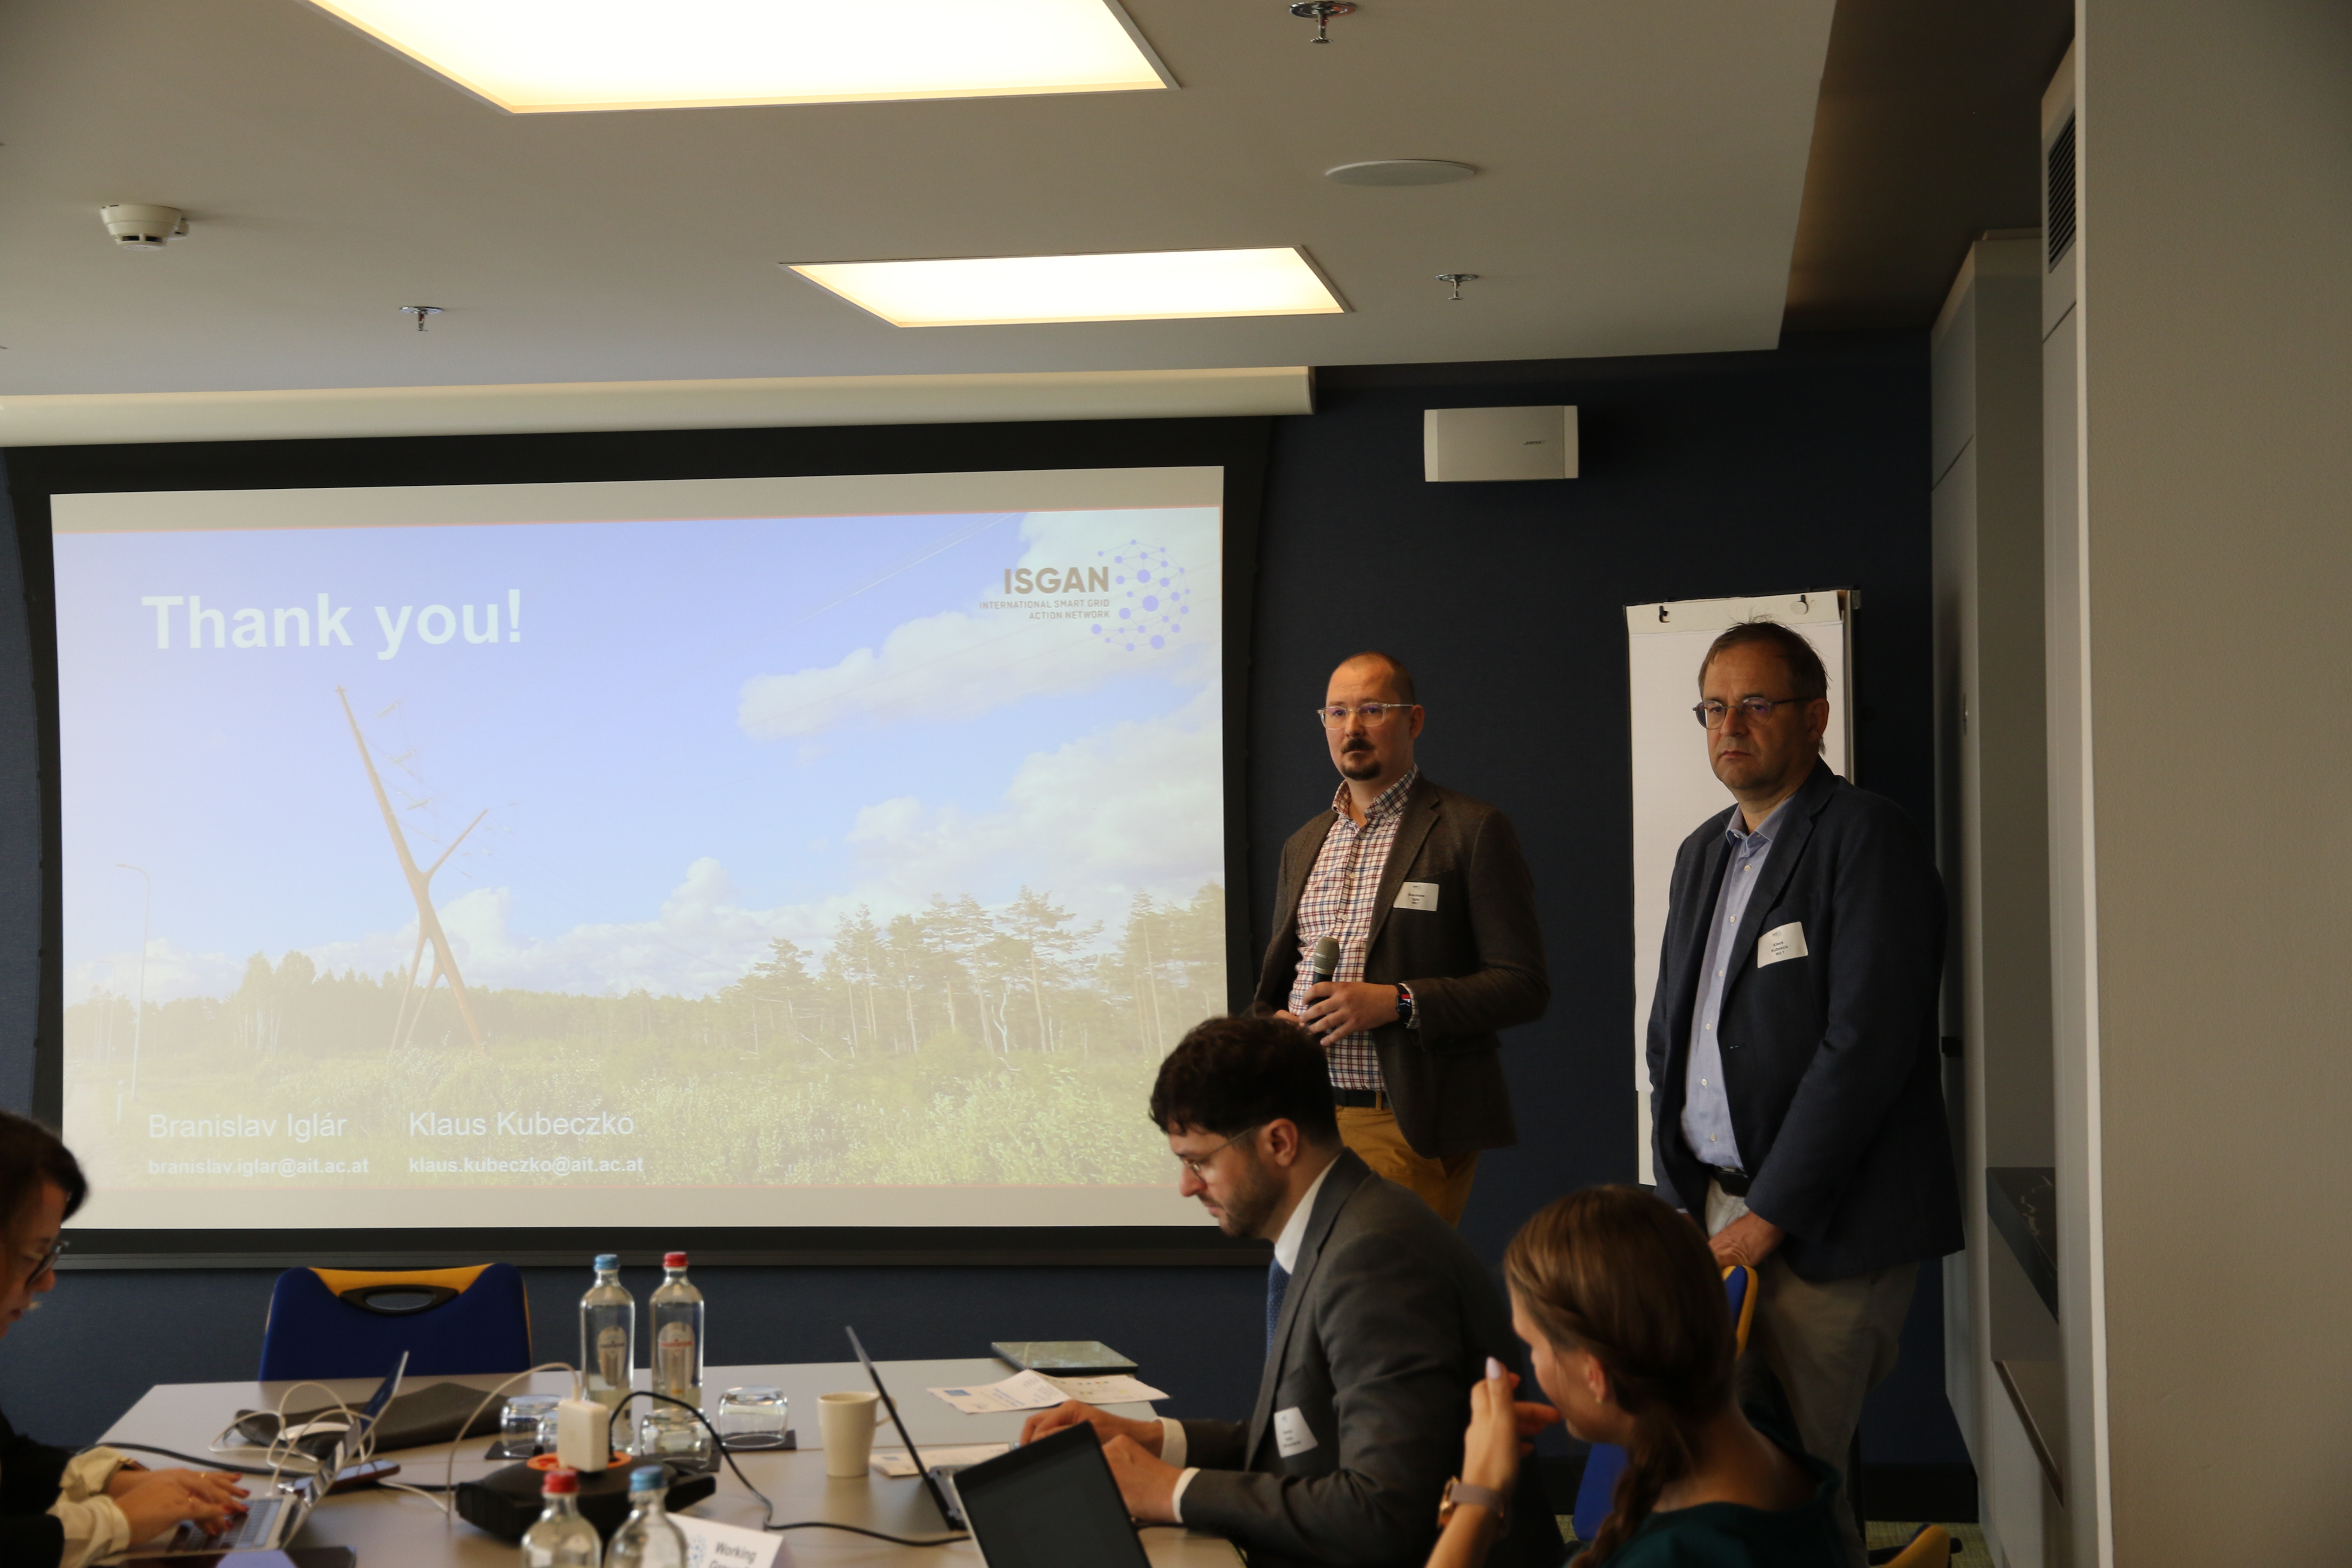
Branislav Iglár and Klaus Kubeczko during the presentation of the programme of work in Utrecht
Presentation of the Programme of Work for the Executive Committee of ISGAN
Copyright: ISGAN
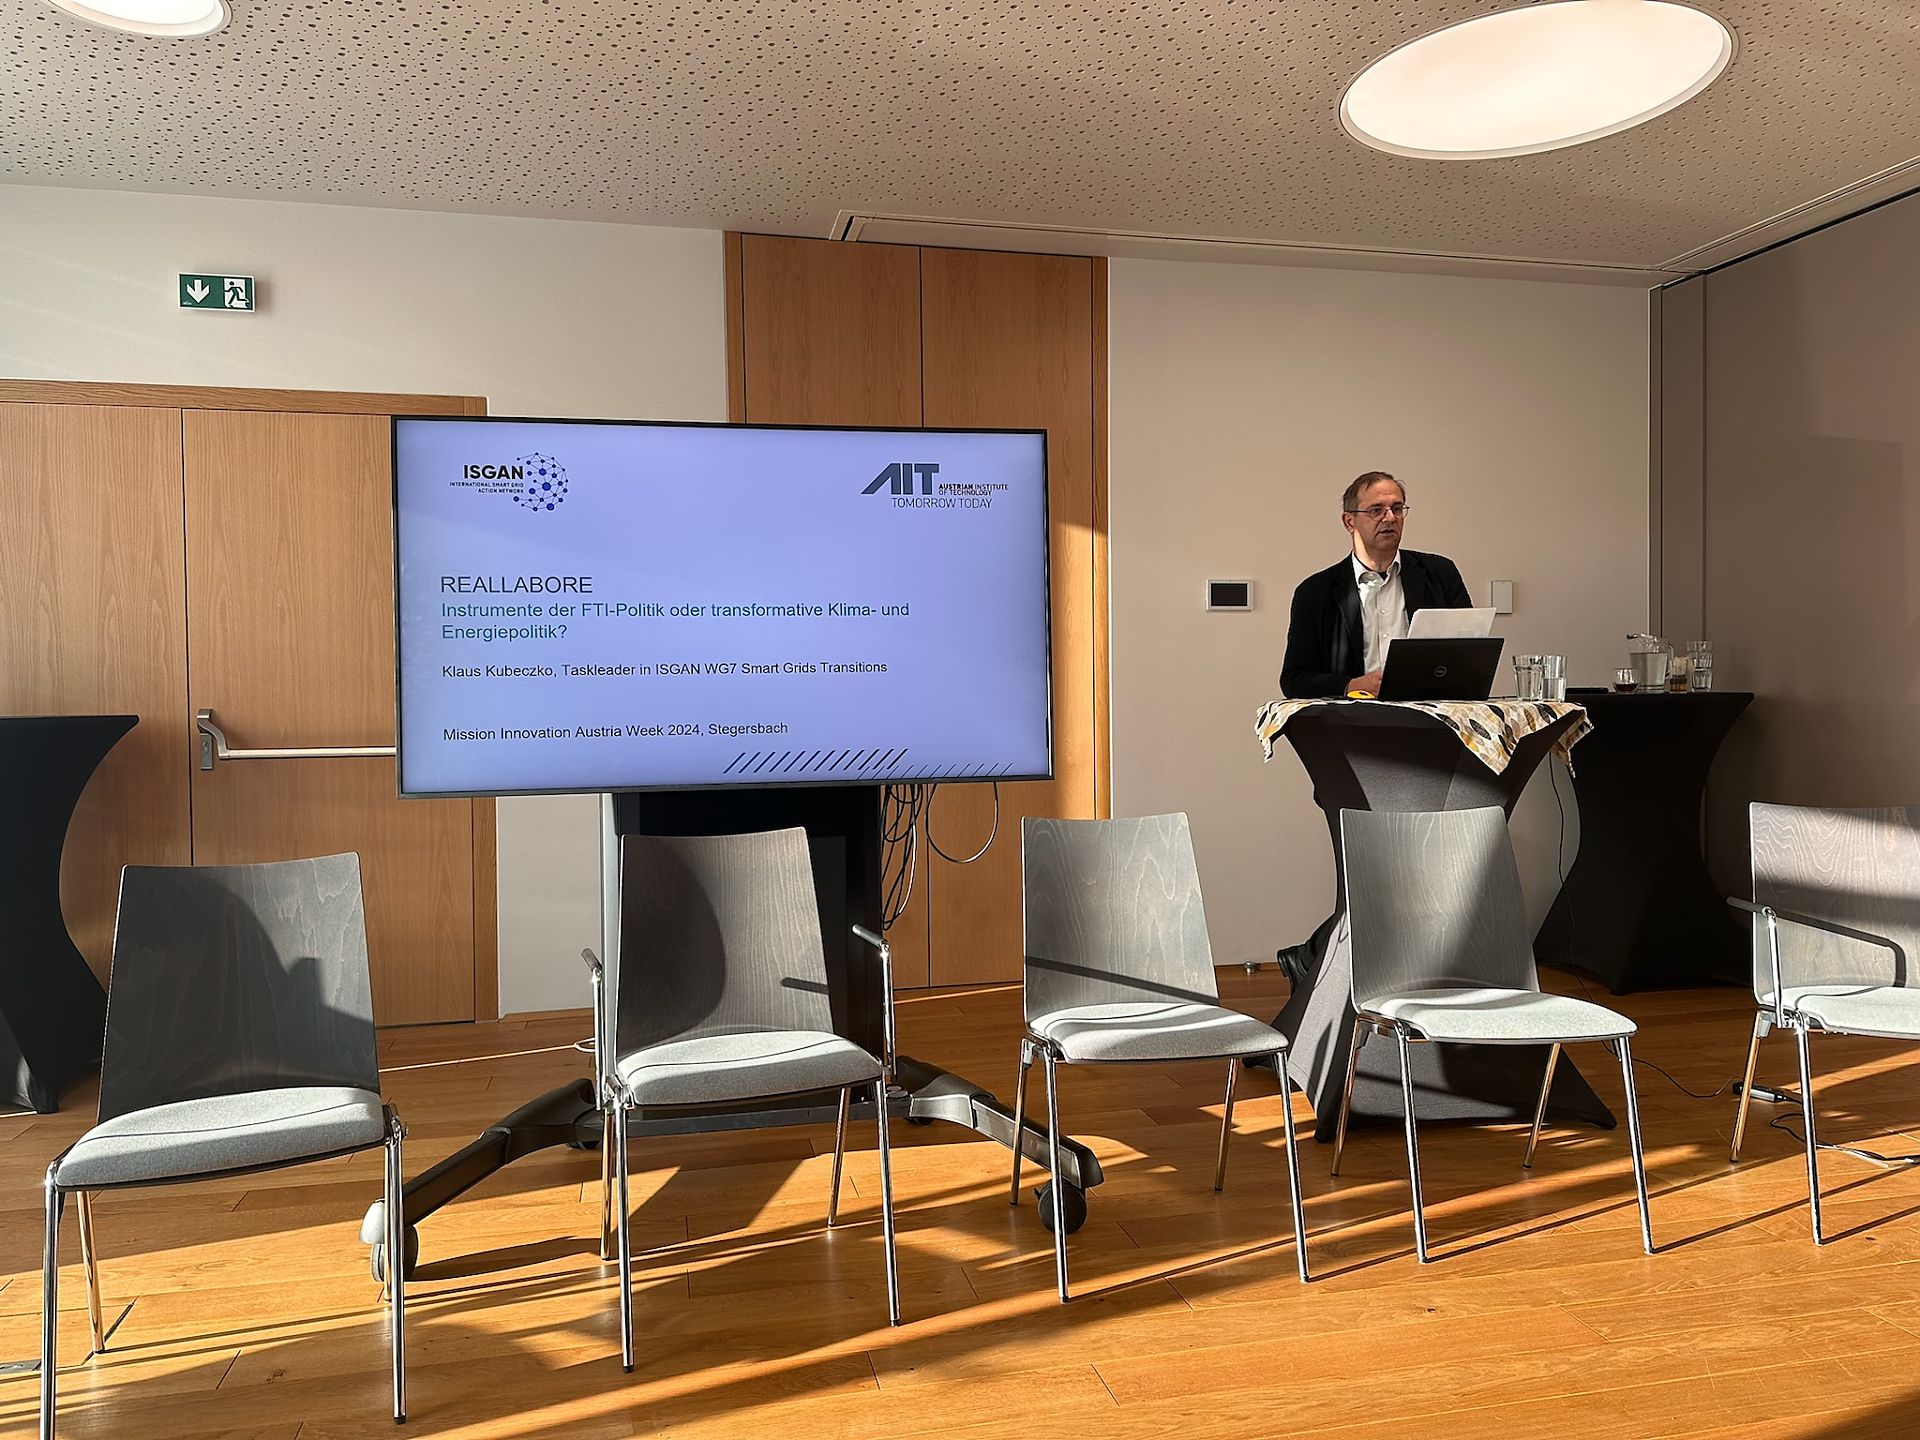
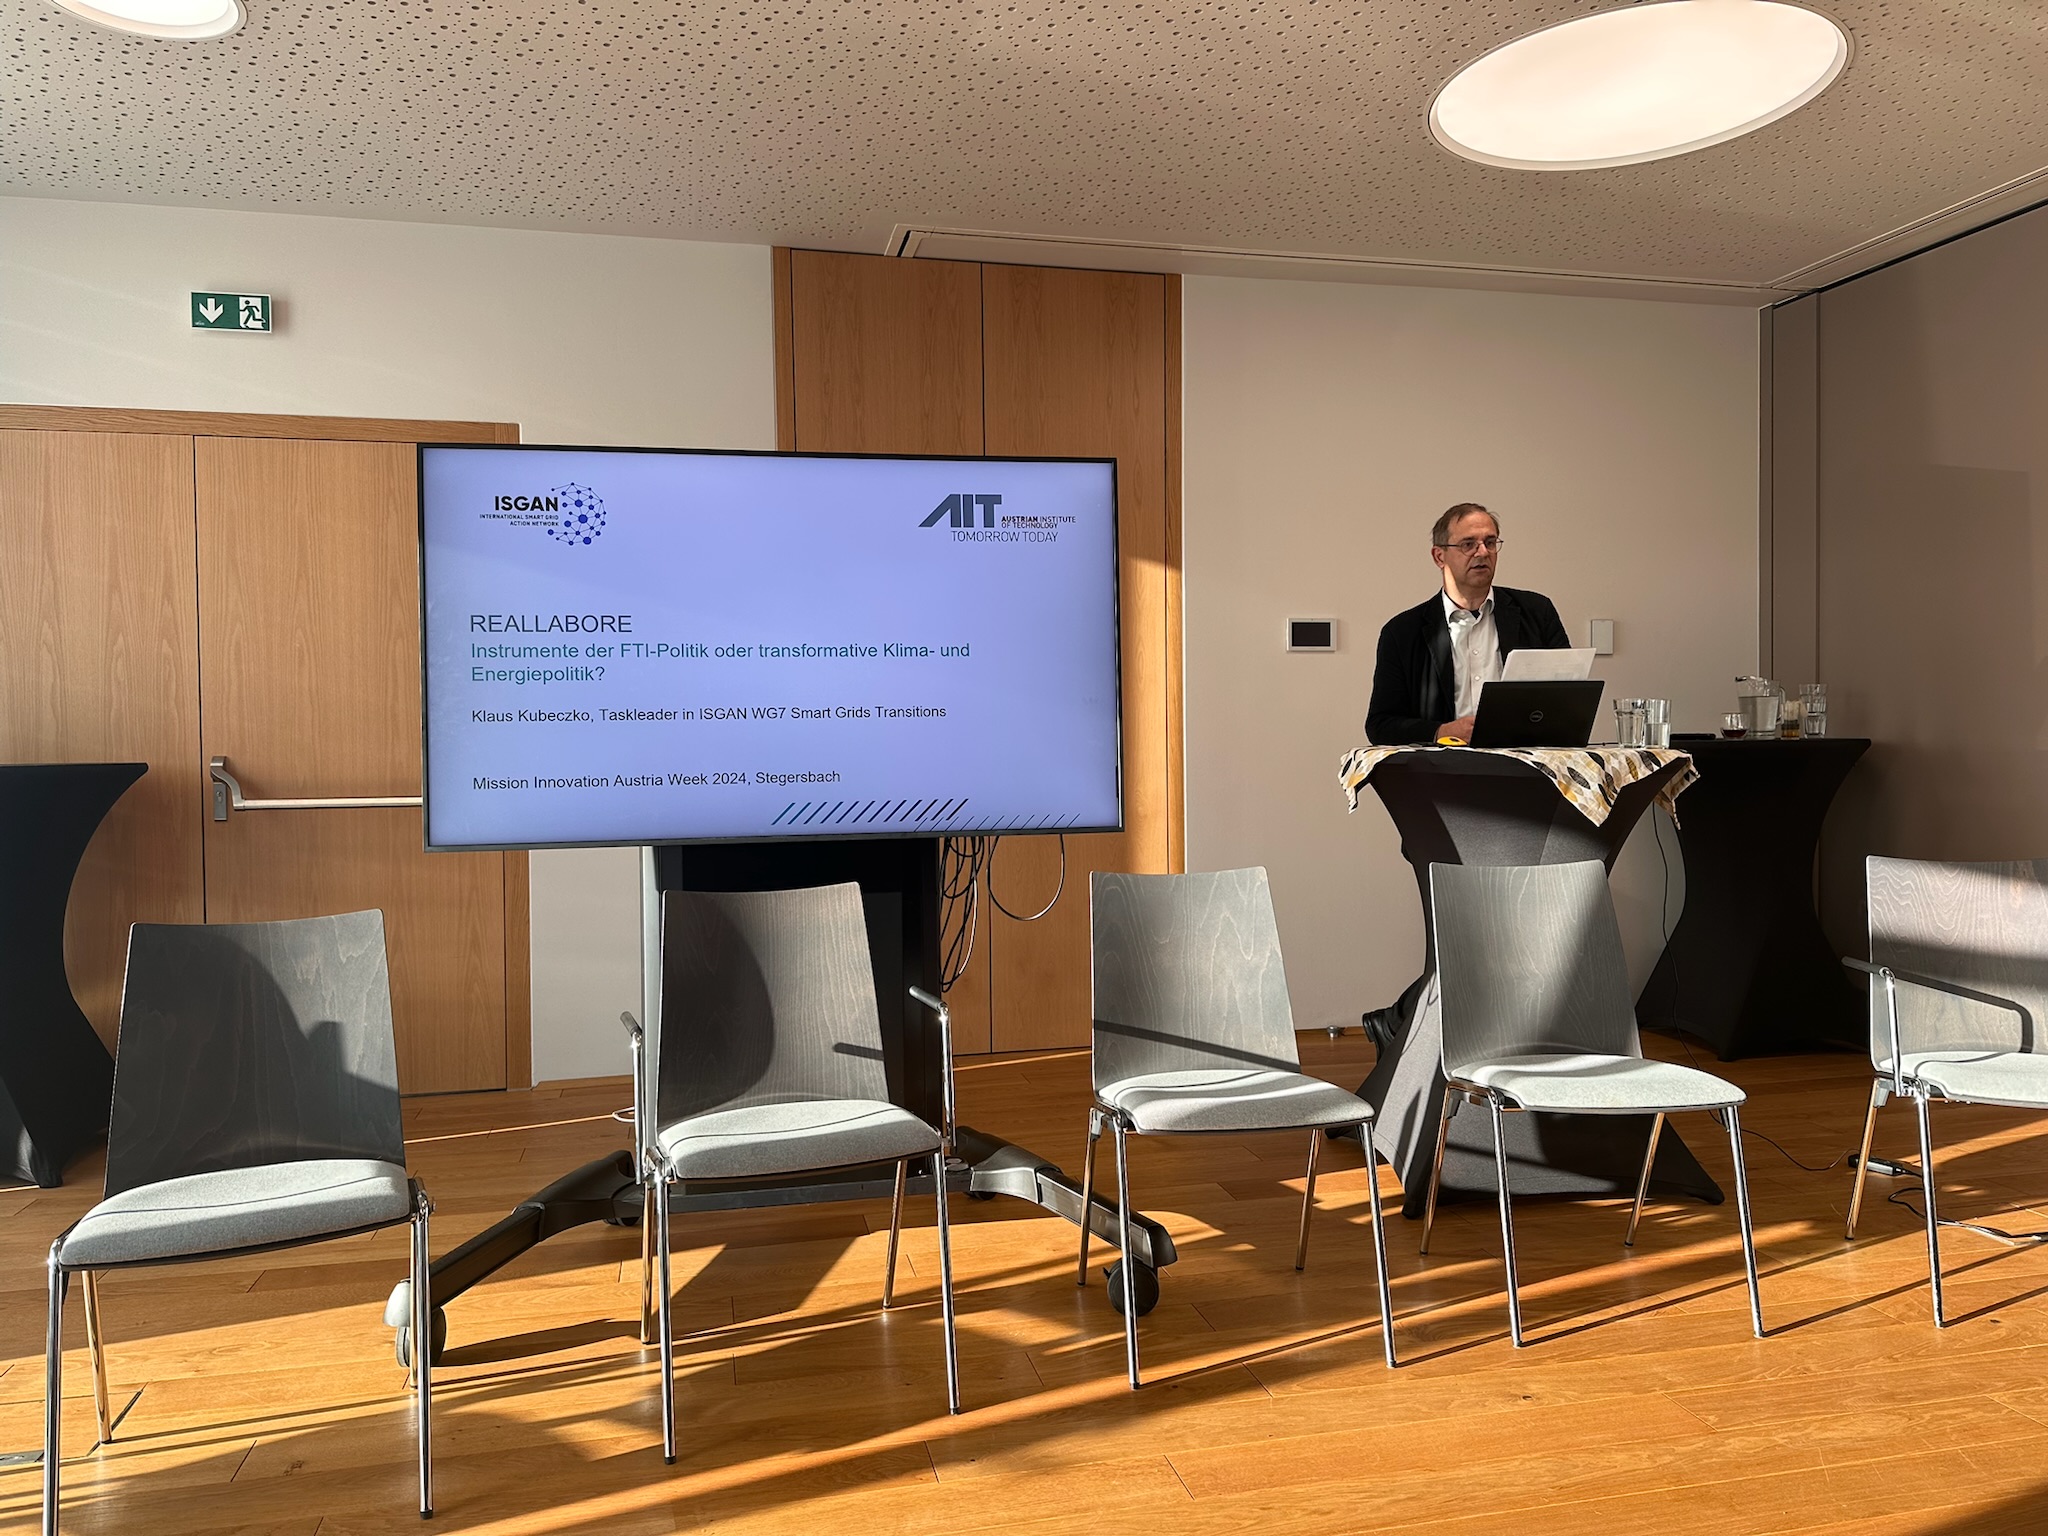
Klaus Kubeczko holding a keynote during a session of the Mission Innovation Austria 2024 conference
Presentation of the topic Living labs: Instruments of the RTD policy or transformative climate and energy policy
Copyright: Branislav Iglár
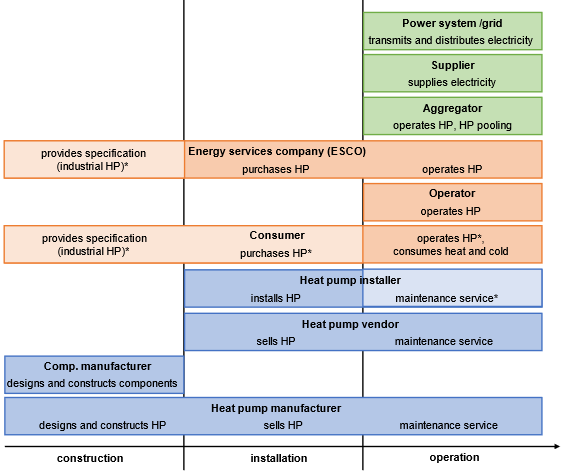
Stakeholders in the life cycle of IoT enabled heat pumps
Various examples of business models for IoT heat pumps were collected in IEA HPT Annex 56. The diagram shows the stakeholders involved in the life cycle of an IoT heat pump (blue = heat pump value chain, orange = operators and users, green = energy system). All reports are available at https://heatpumpingtechnologies.org/annex56/.
Copyright: AIT Austrian Institute of Technology GmbH
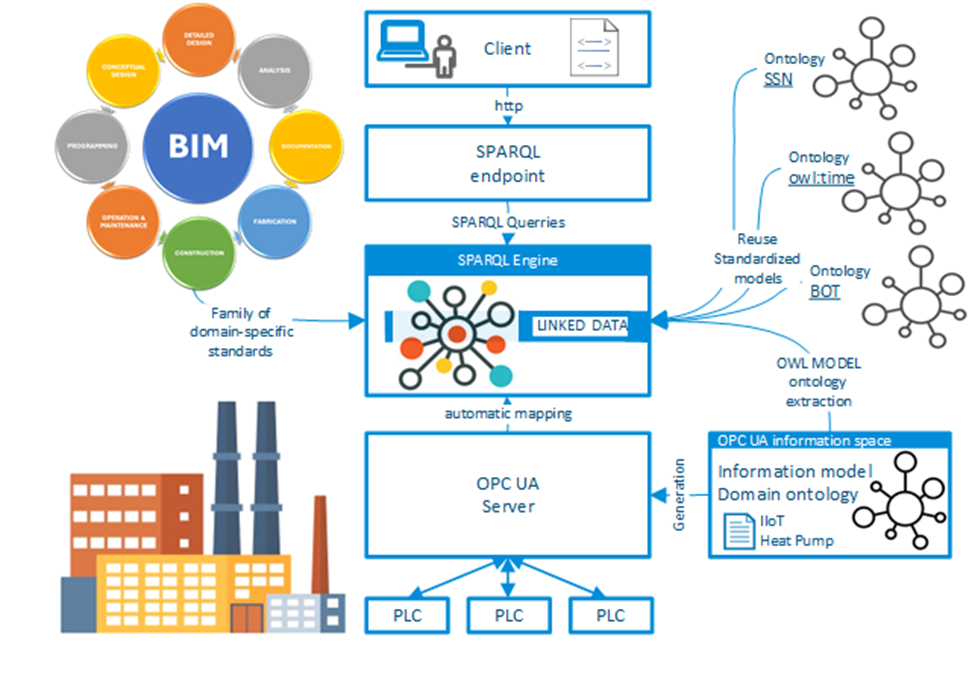
Use of runtime data in a knowledge base
The graphic shows how real-time data from the field level and building data are linked to the knowledge base.
Copyright: TU Wien
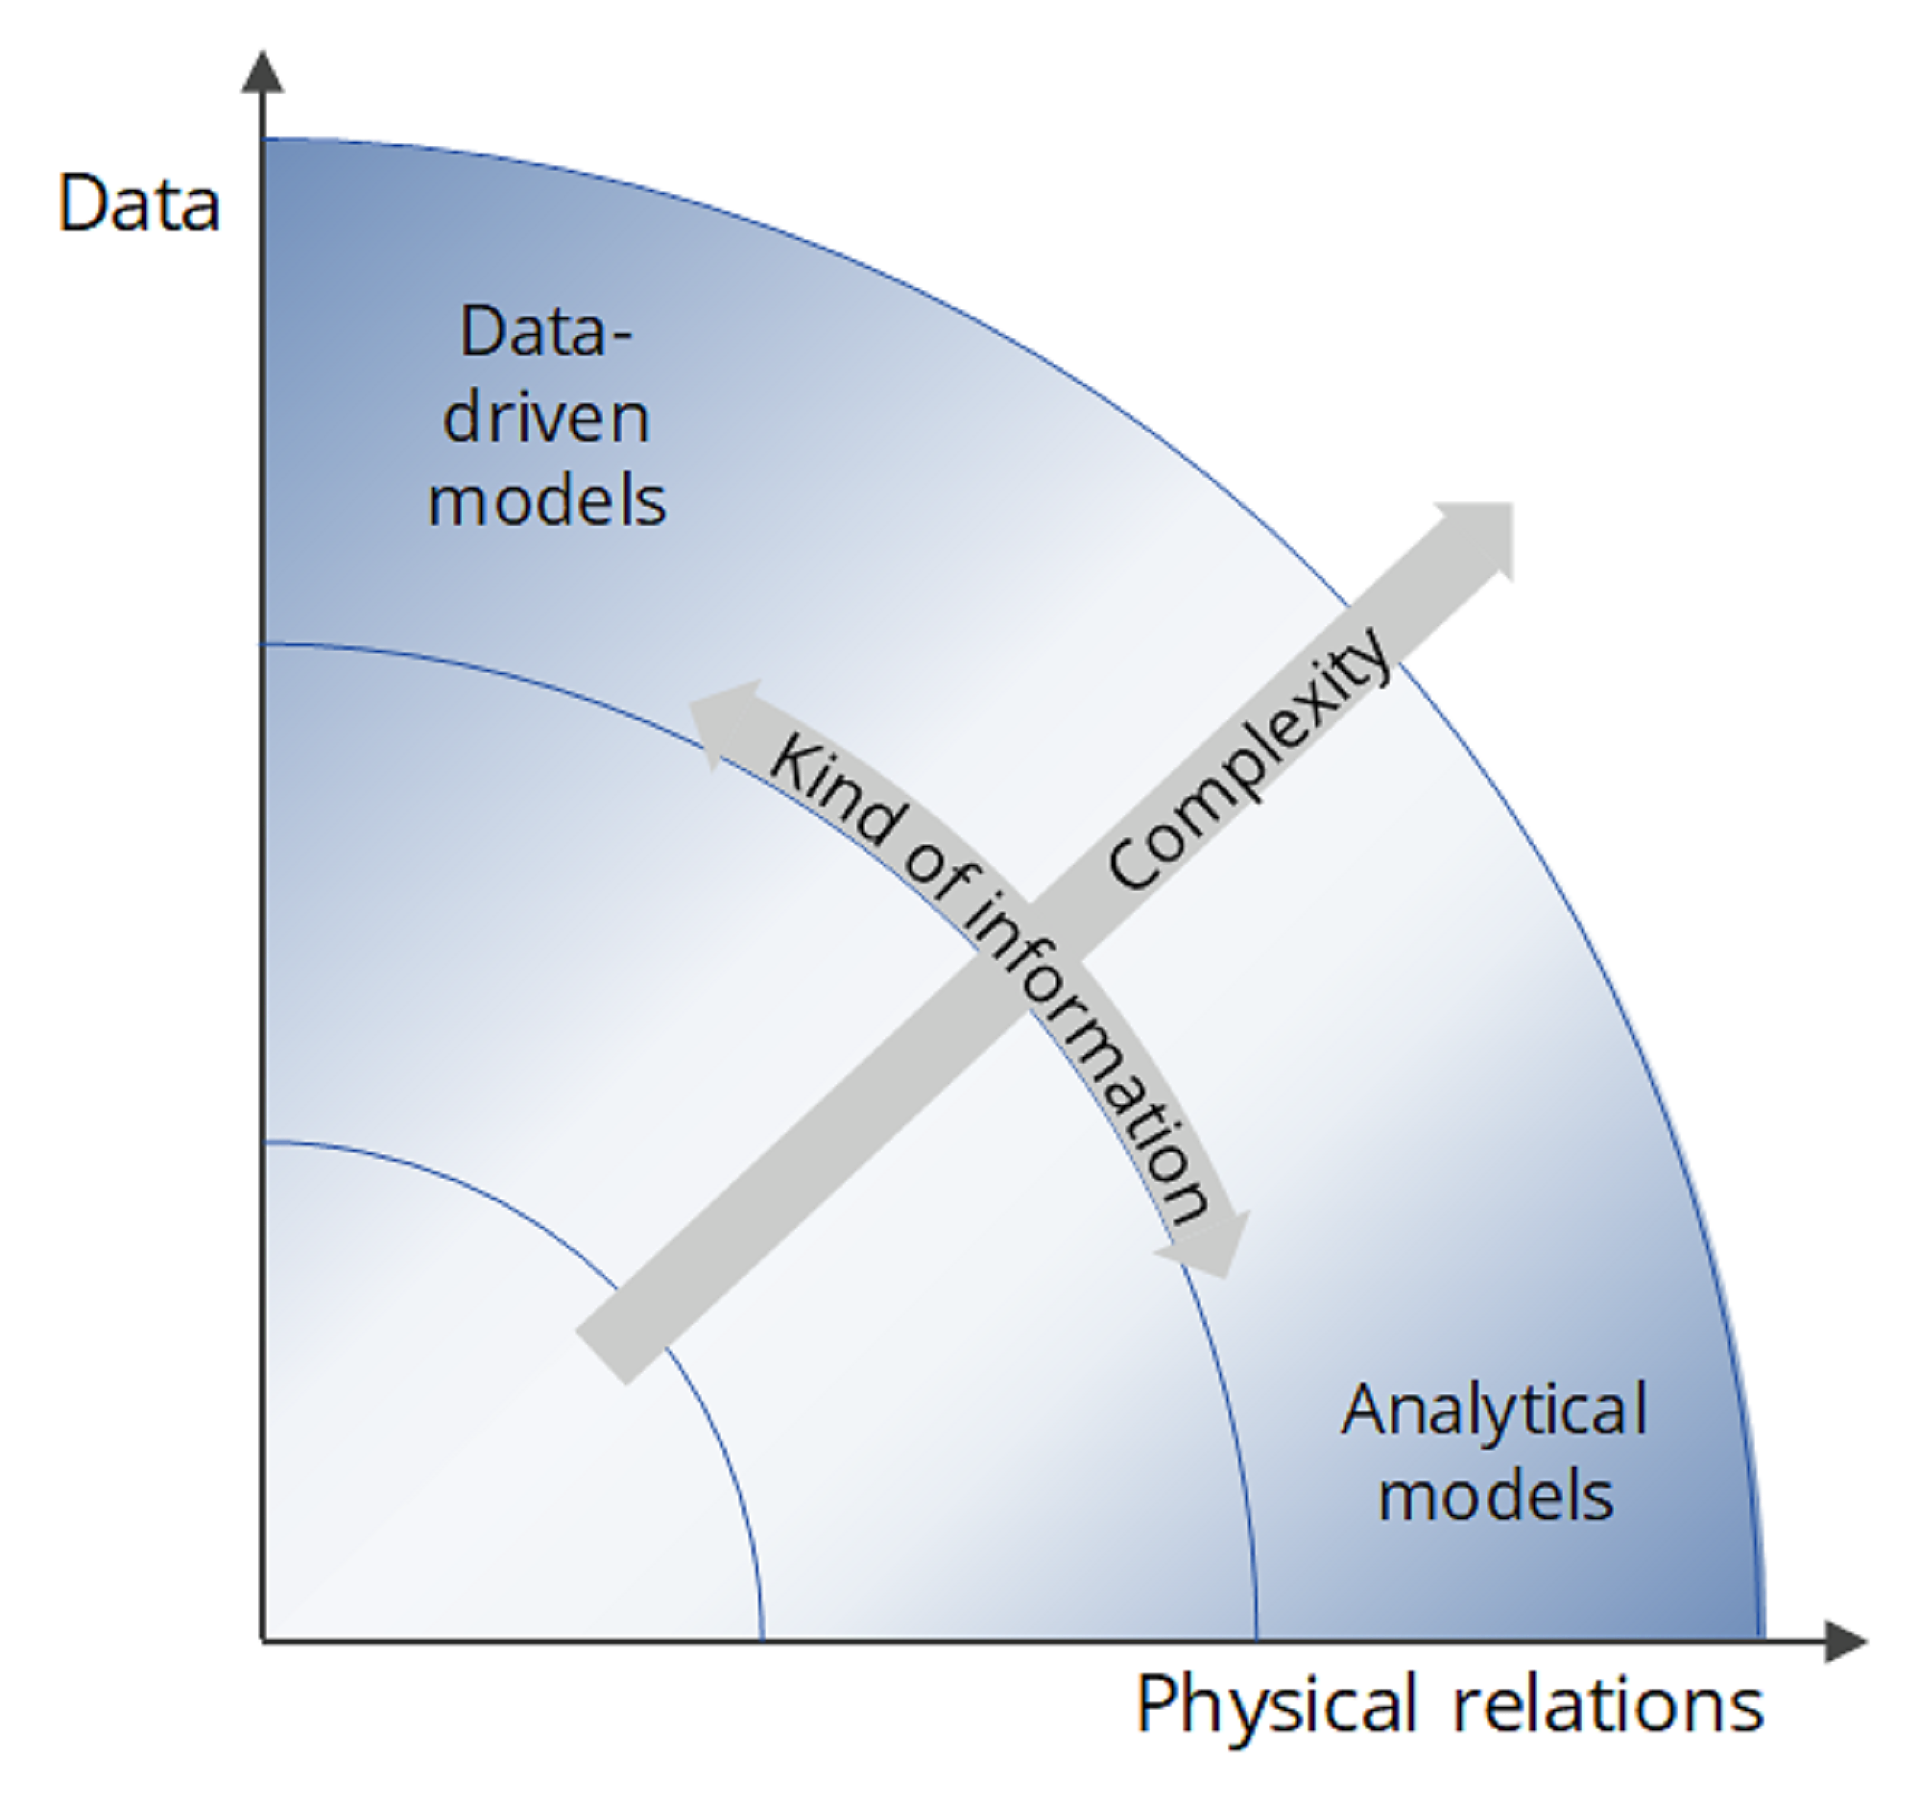
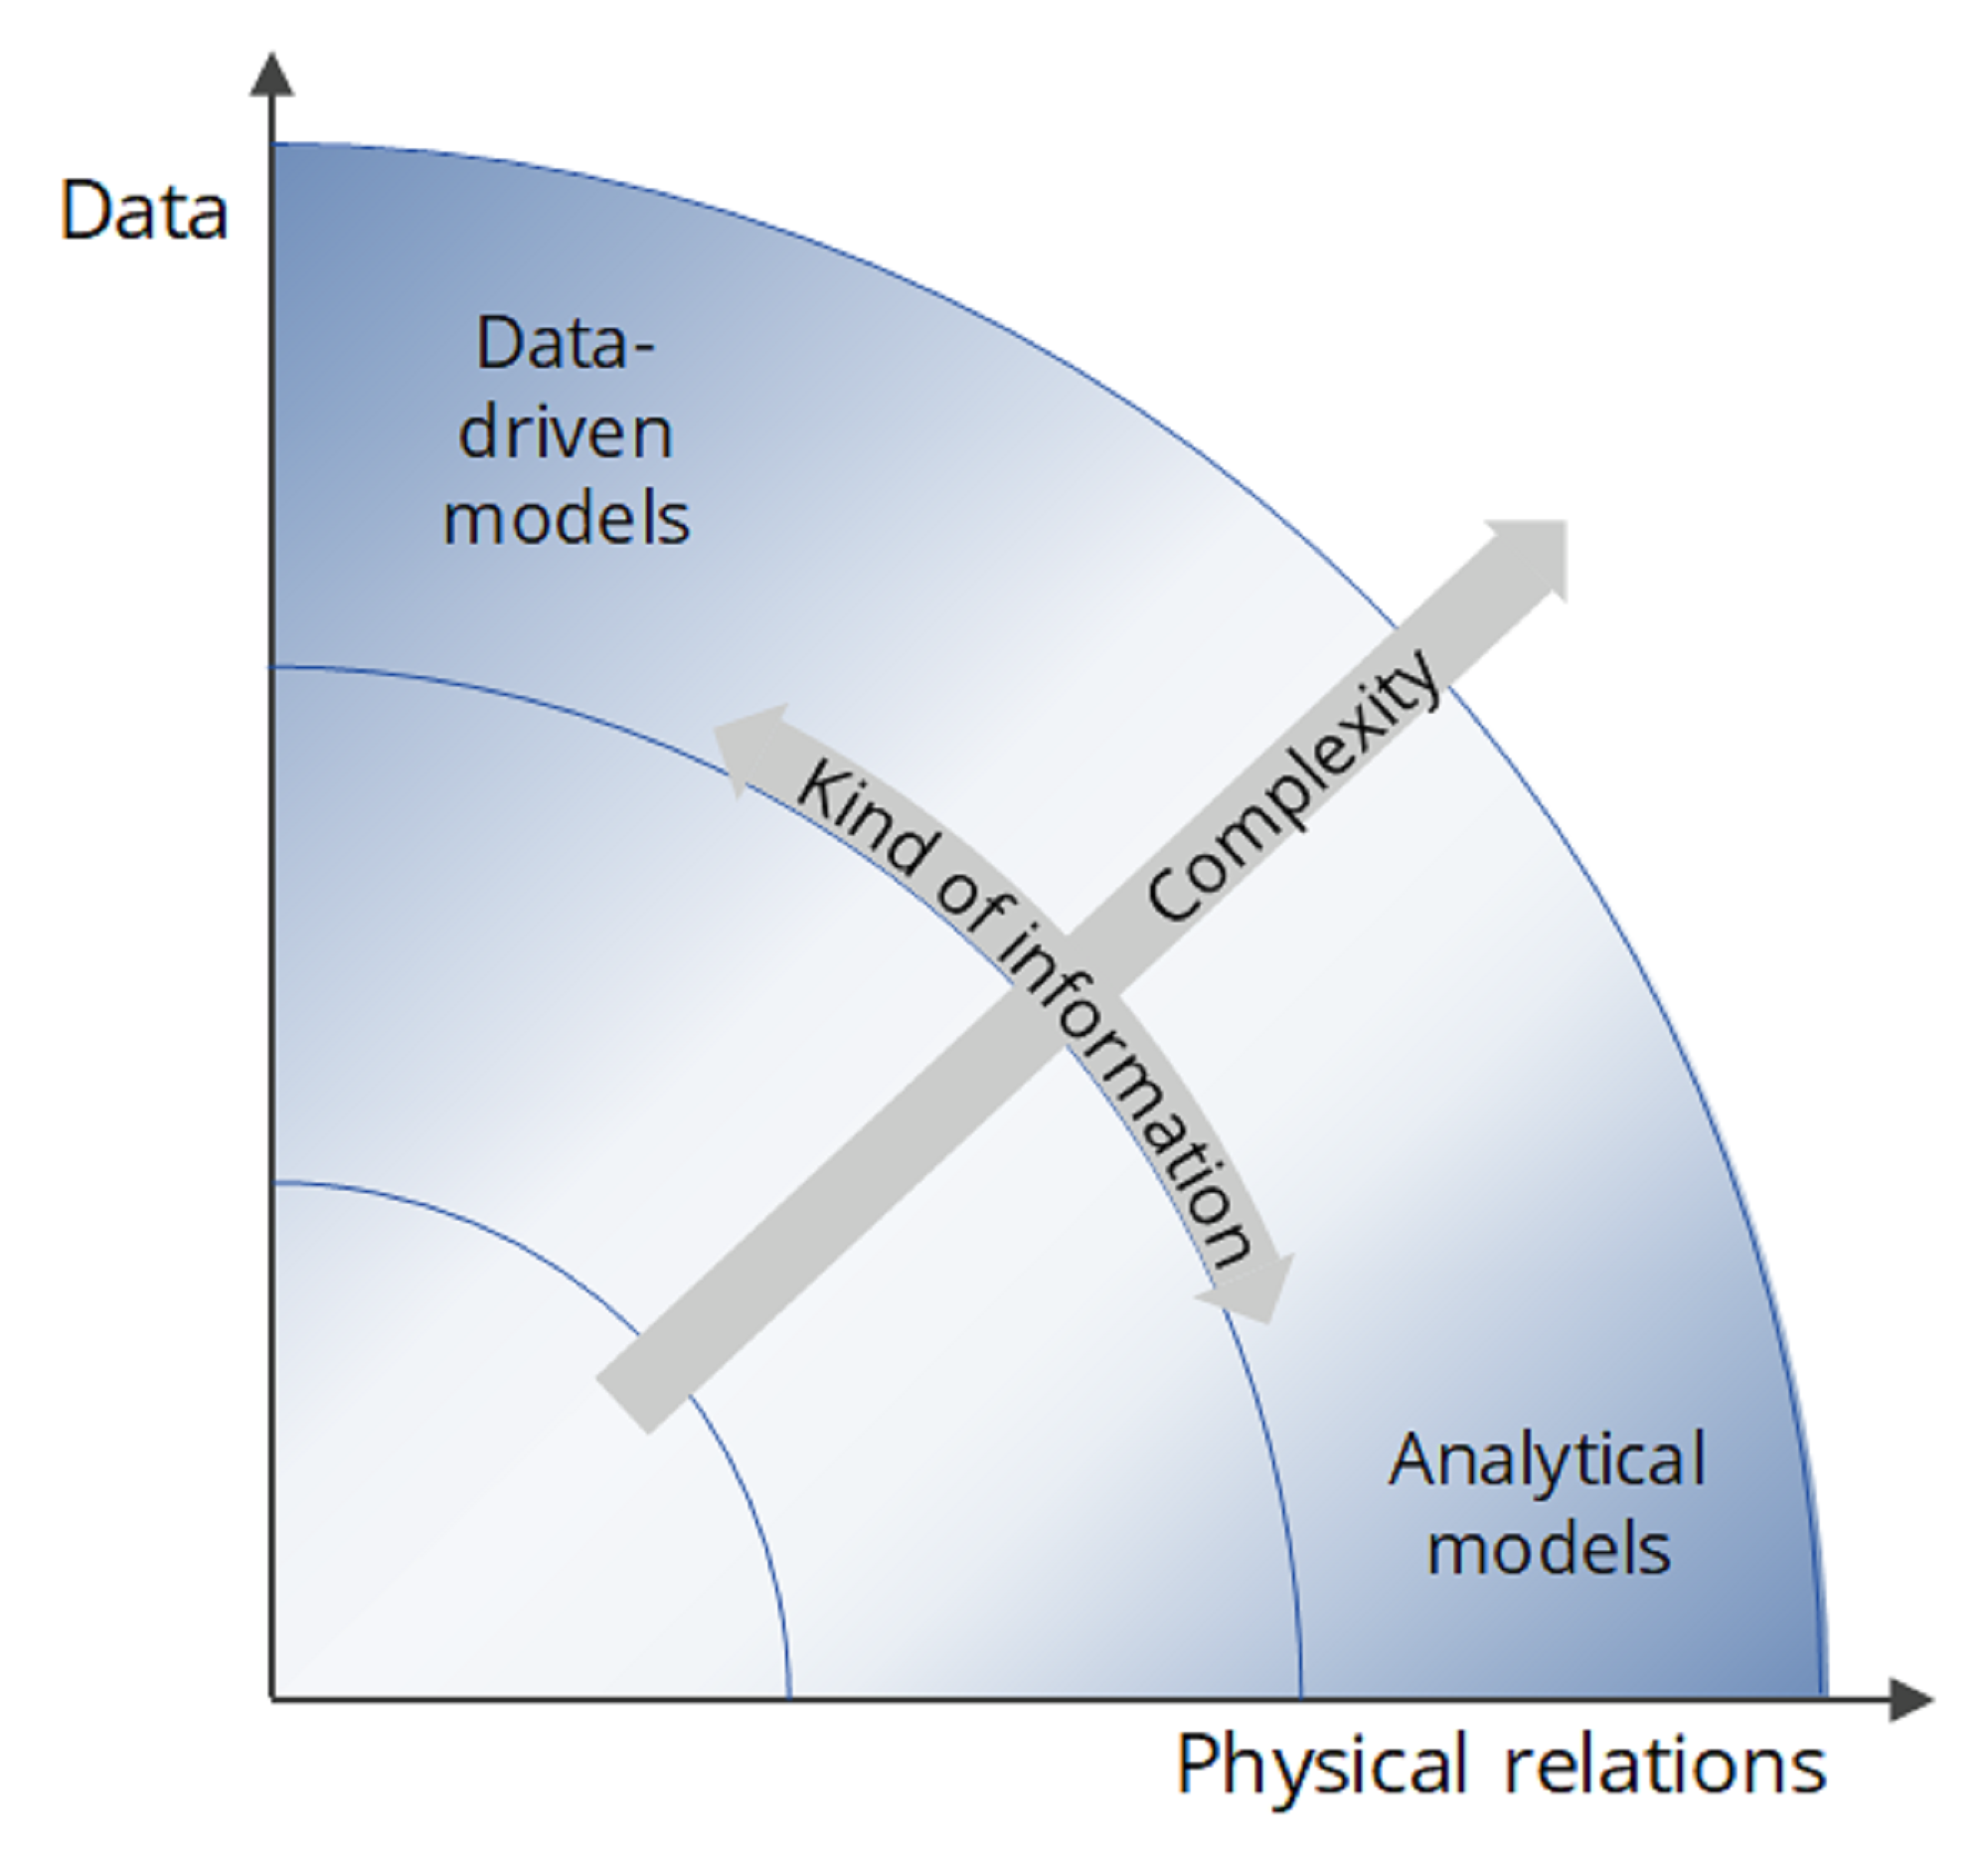
Models for IoT heat pumps
The graphic shows different types of models that are relevant for IoT heat pumps. Physical models are based on physical relationships, data-driven models are created using only data. Hybrid models are based on both data and physical relationships.
Copyright: Danish Technological Institute
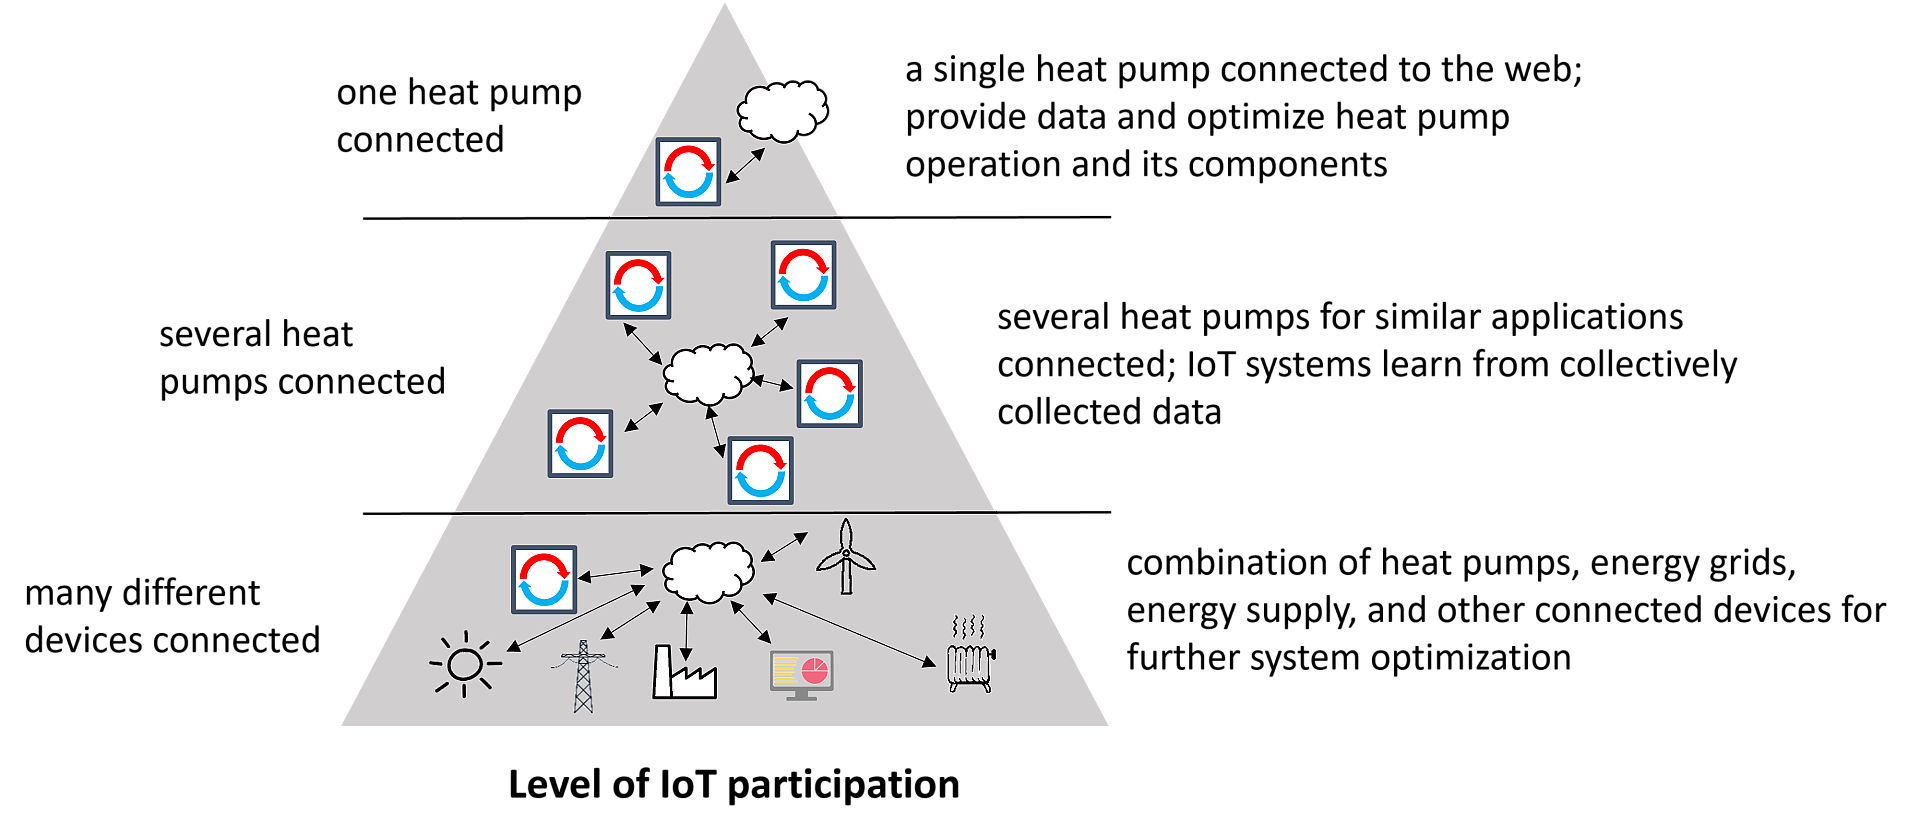
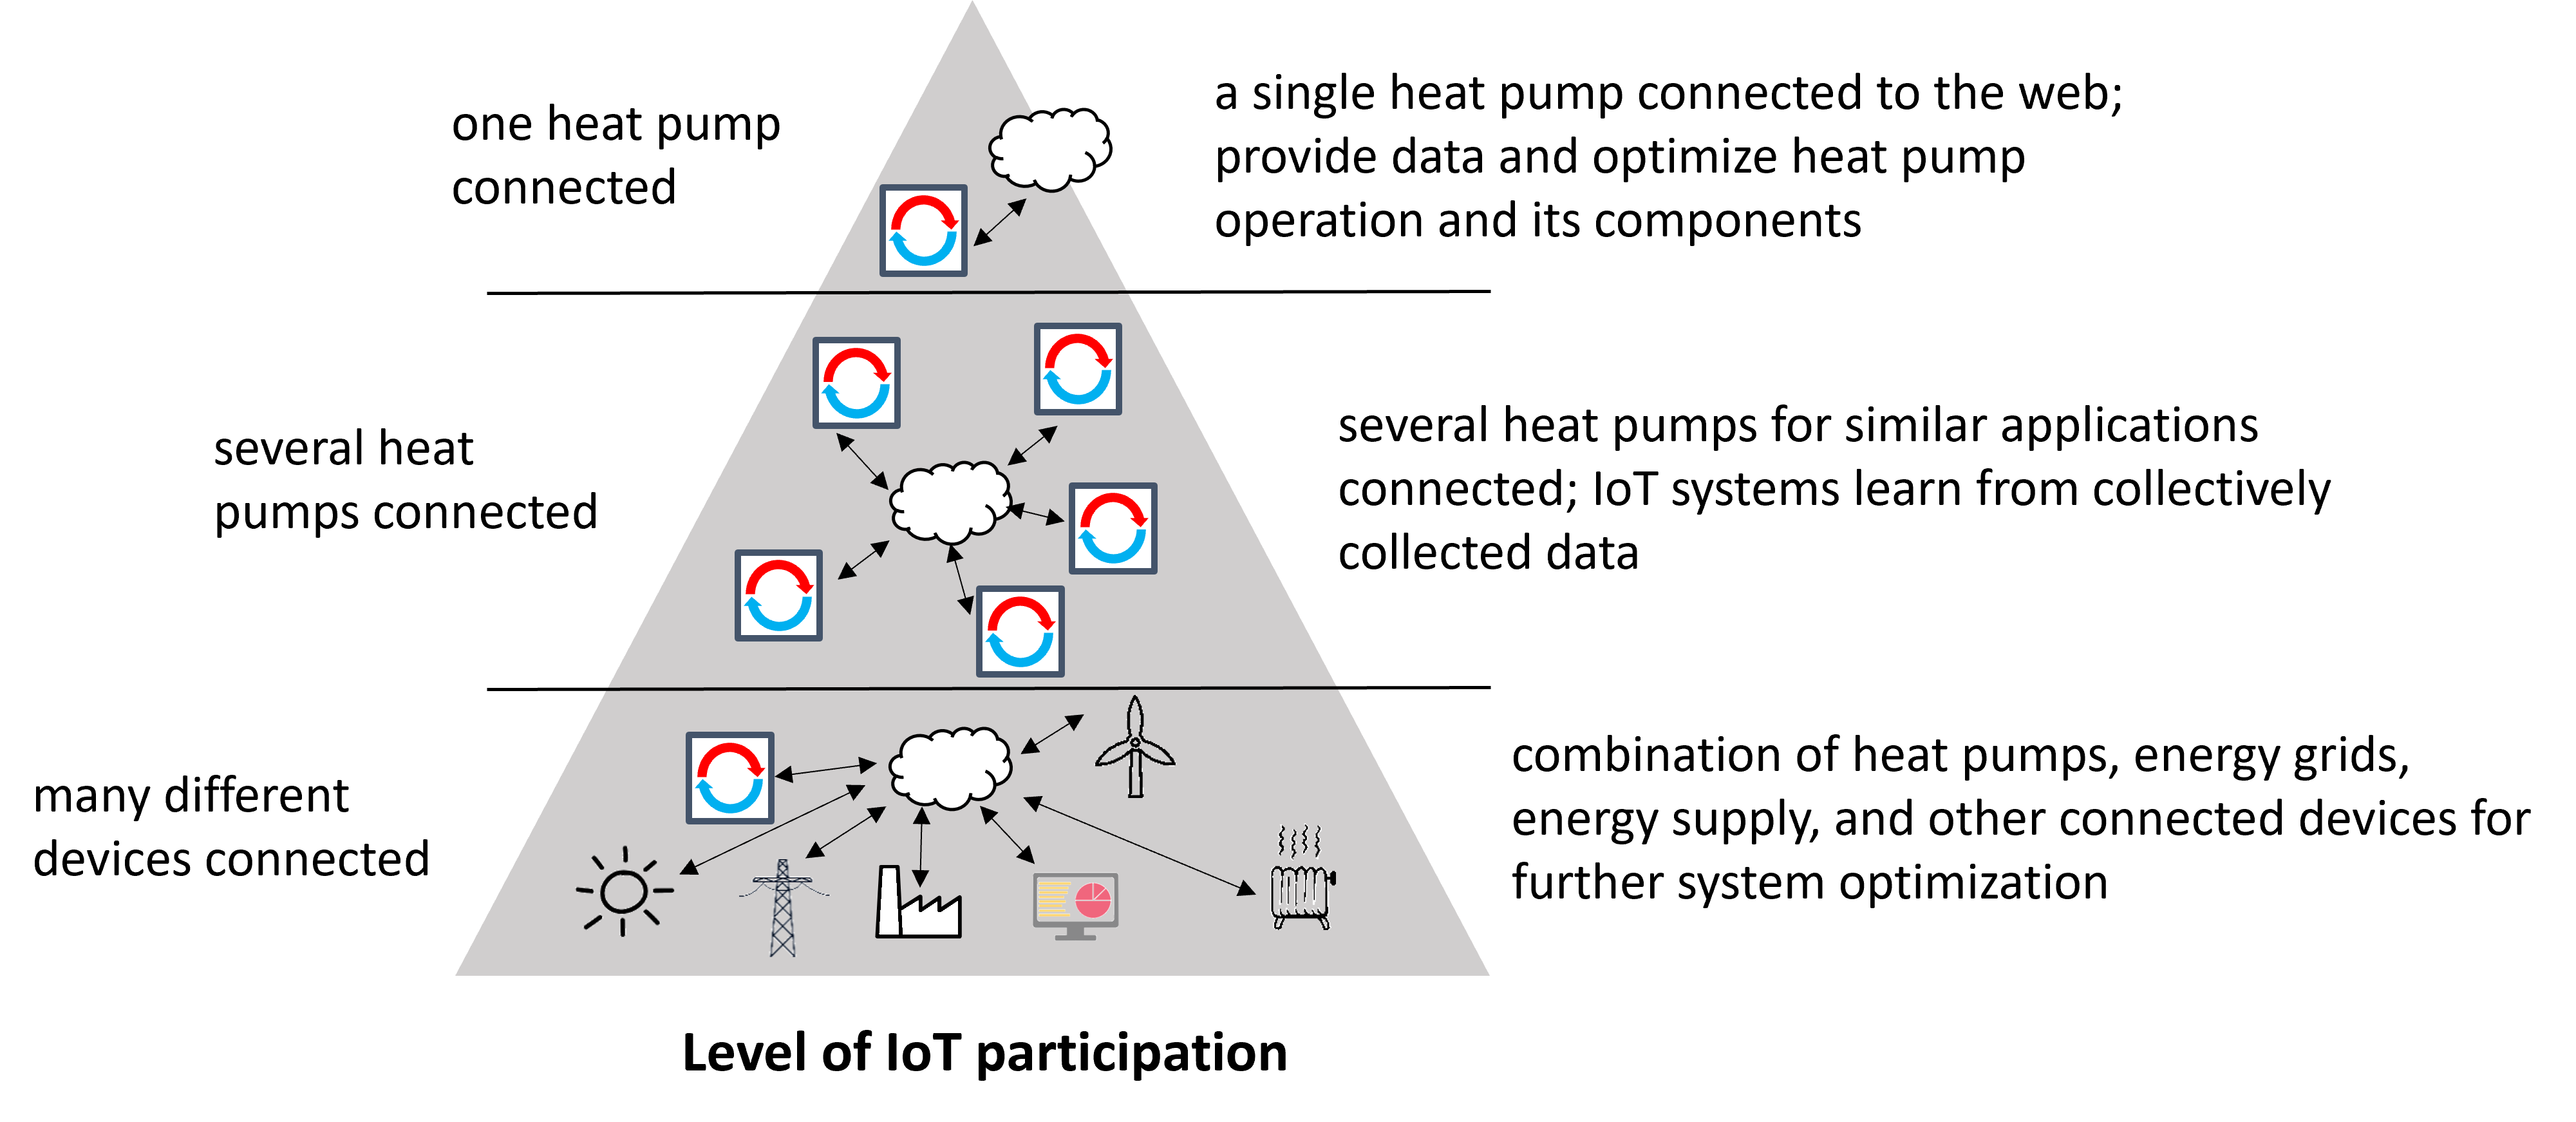
IoT participation of heat pumps
This graphic describes different types of interaction between connected heat pumps. They range from the cloud connection of an individual heat pump to a networked energy system. The IEA HPT Annex 56 reports provide a detailed overview of the state of the art, interfaces, data analysis and business models and are available at https://heatpumpingtechnologies.org/annex56/
Copyright: AIT Austrian Institute of Technology GmbH
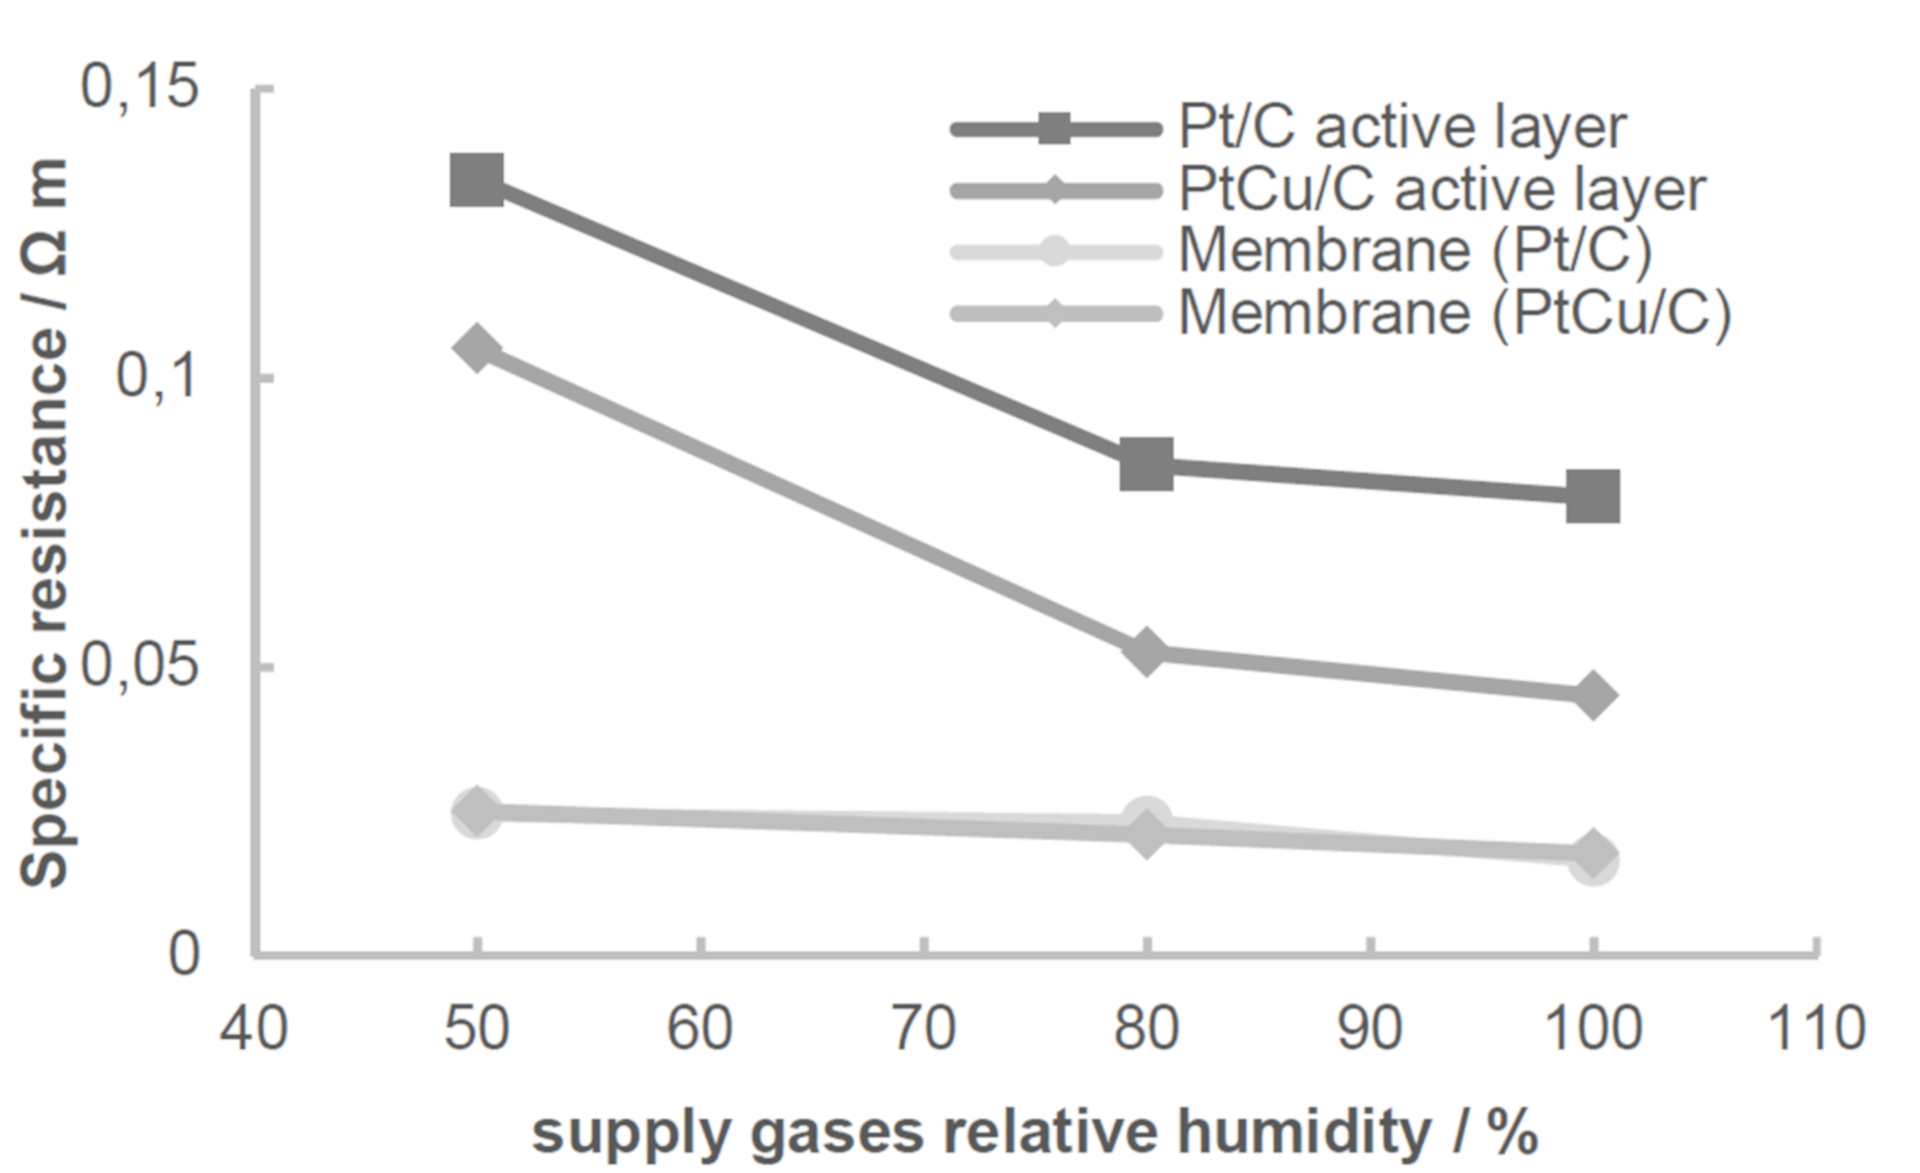
Specific resistance towards proton conduction of Pt based fuel cell components
Specific resistance towards proton conduction at various degrees of relative humidity of Pt based catalysts (Pt/C and PtCu/C) and the corresponding membrane materials.
Copyright: TU Graz
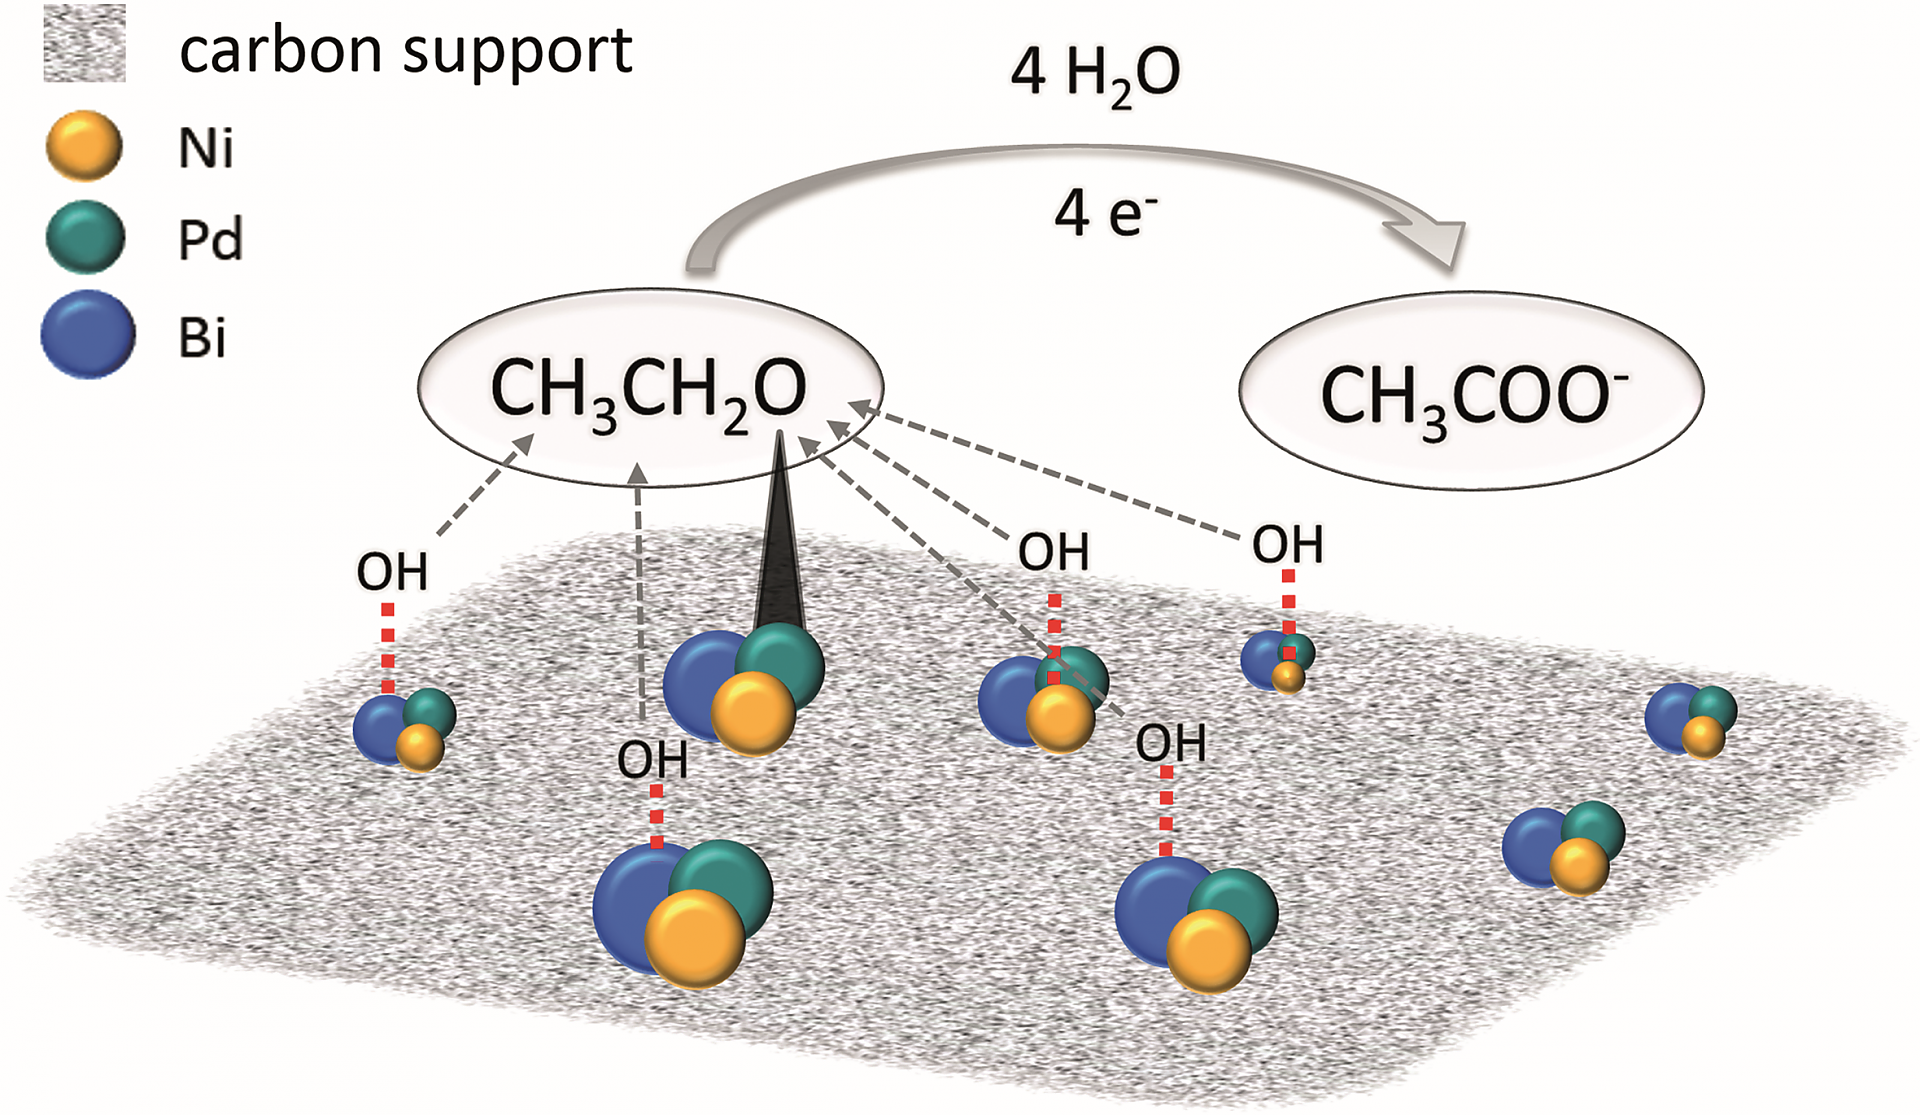
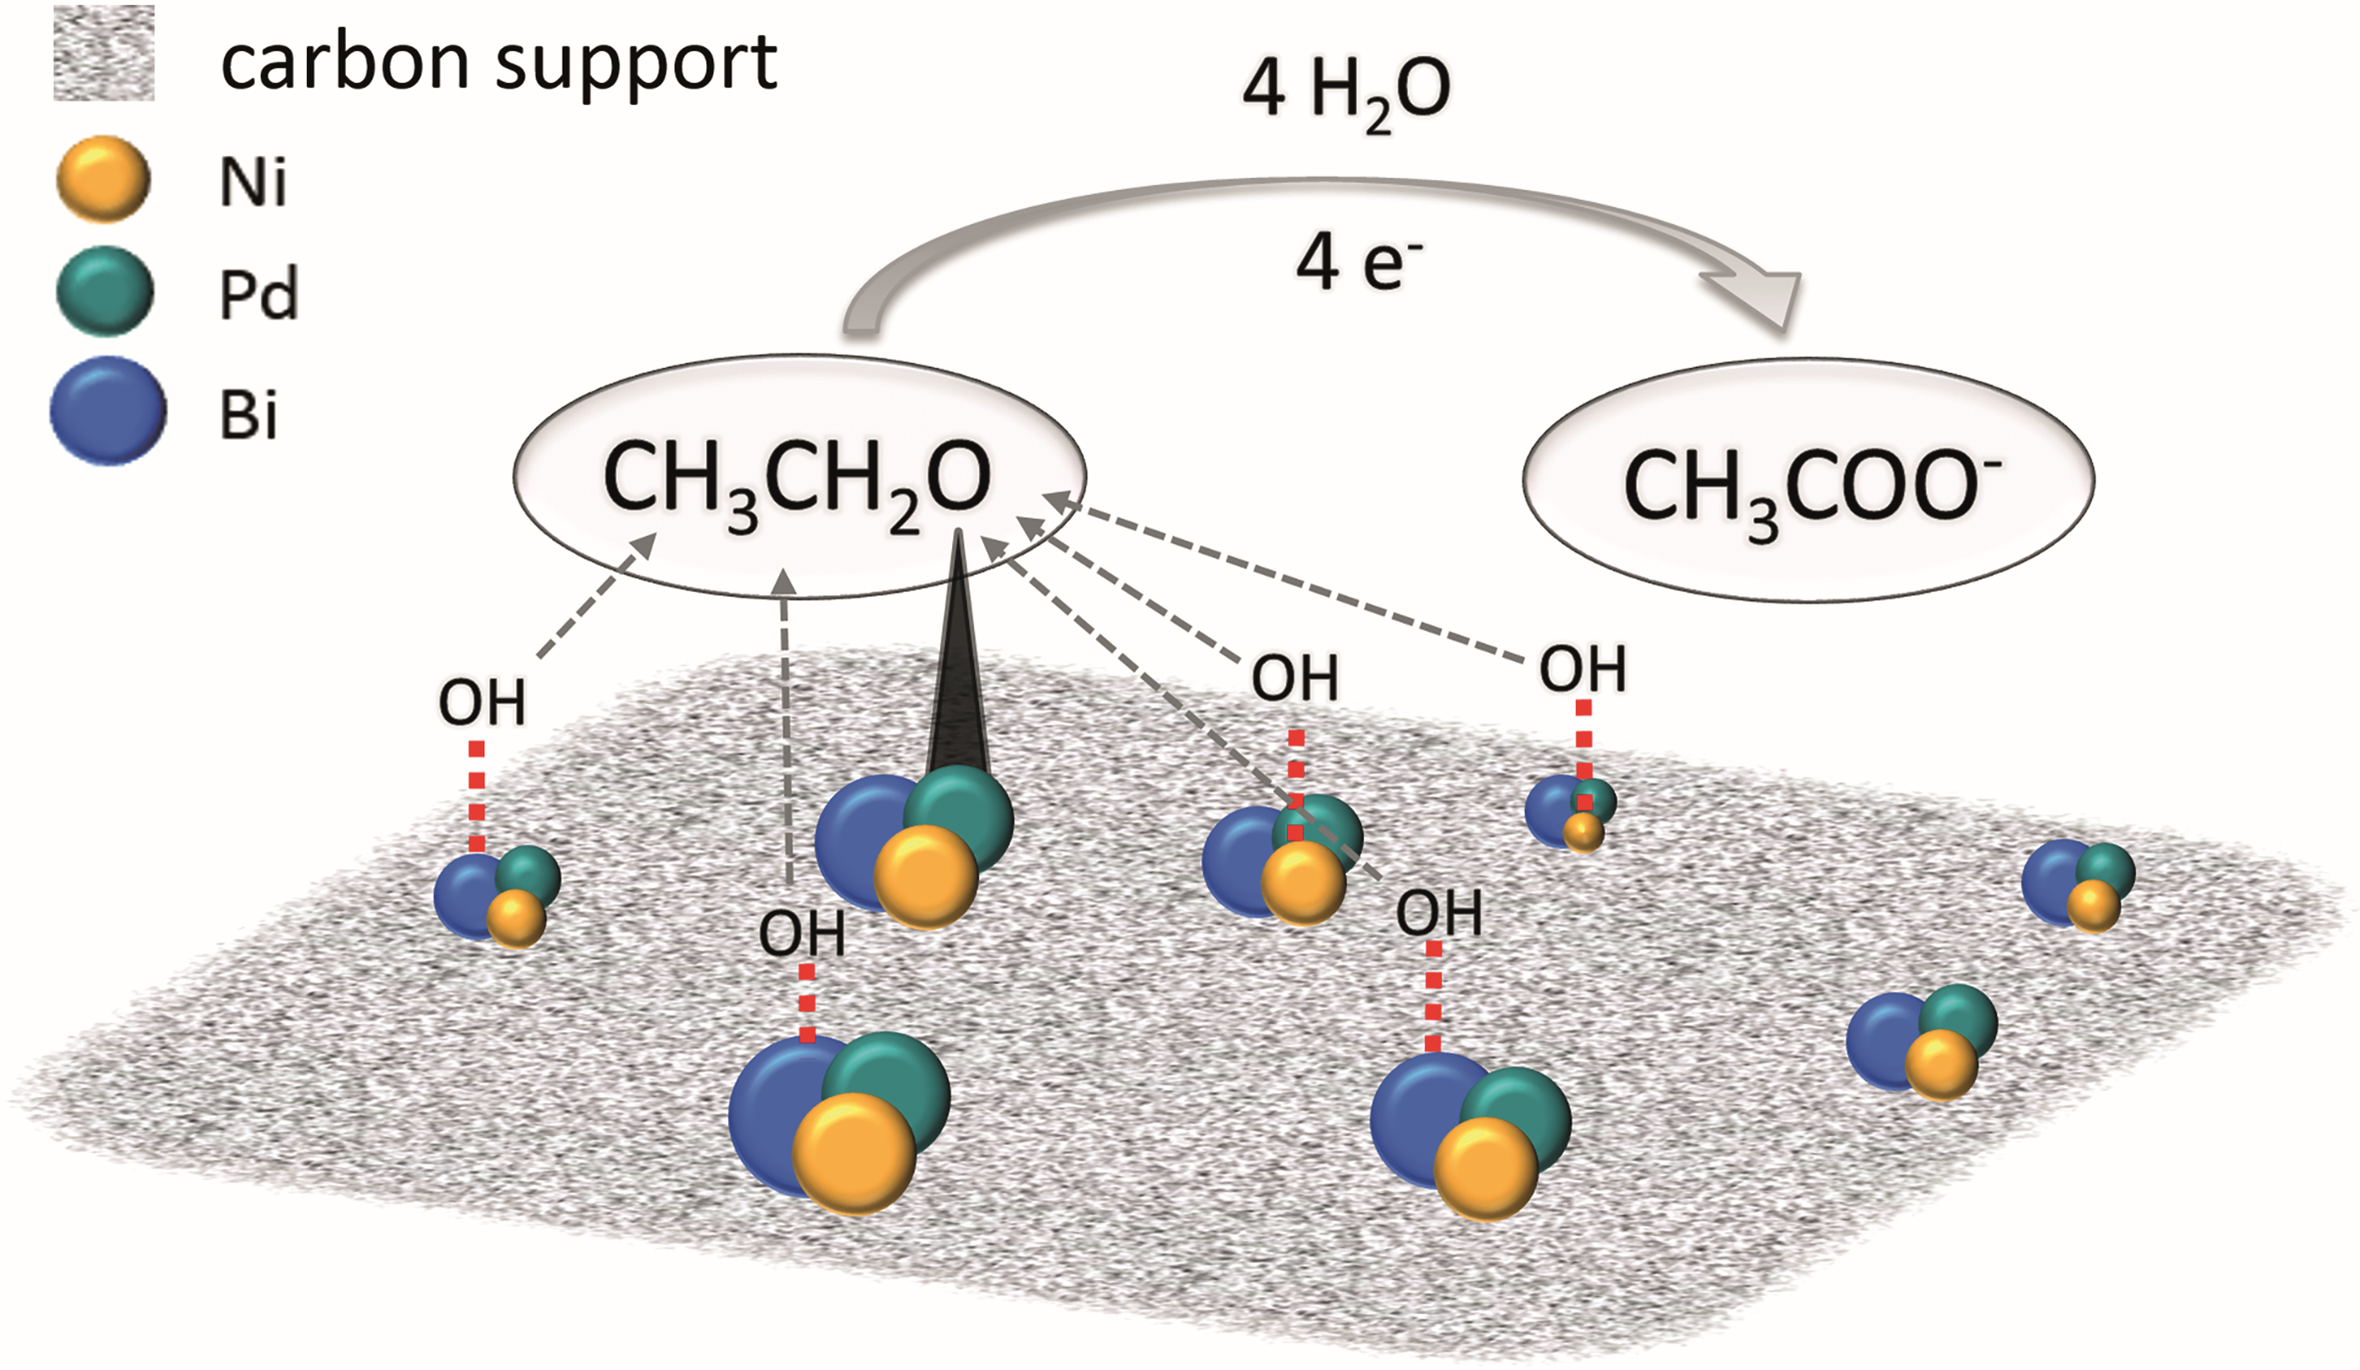
Carbon supported PdNiBi catalysts
Carbon supported PdNiBi catalysts for the alkaline ethanol oxidation reaction (EOR).
Copyright: TU Graz

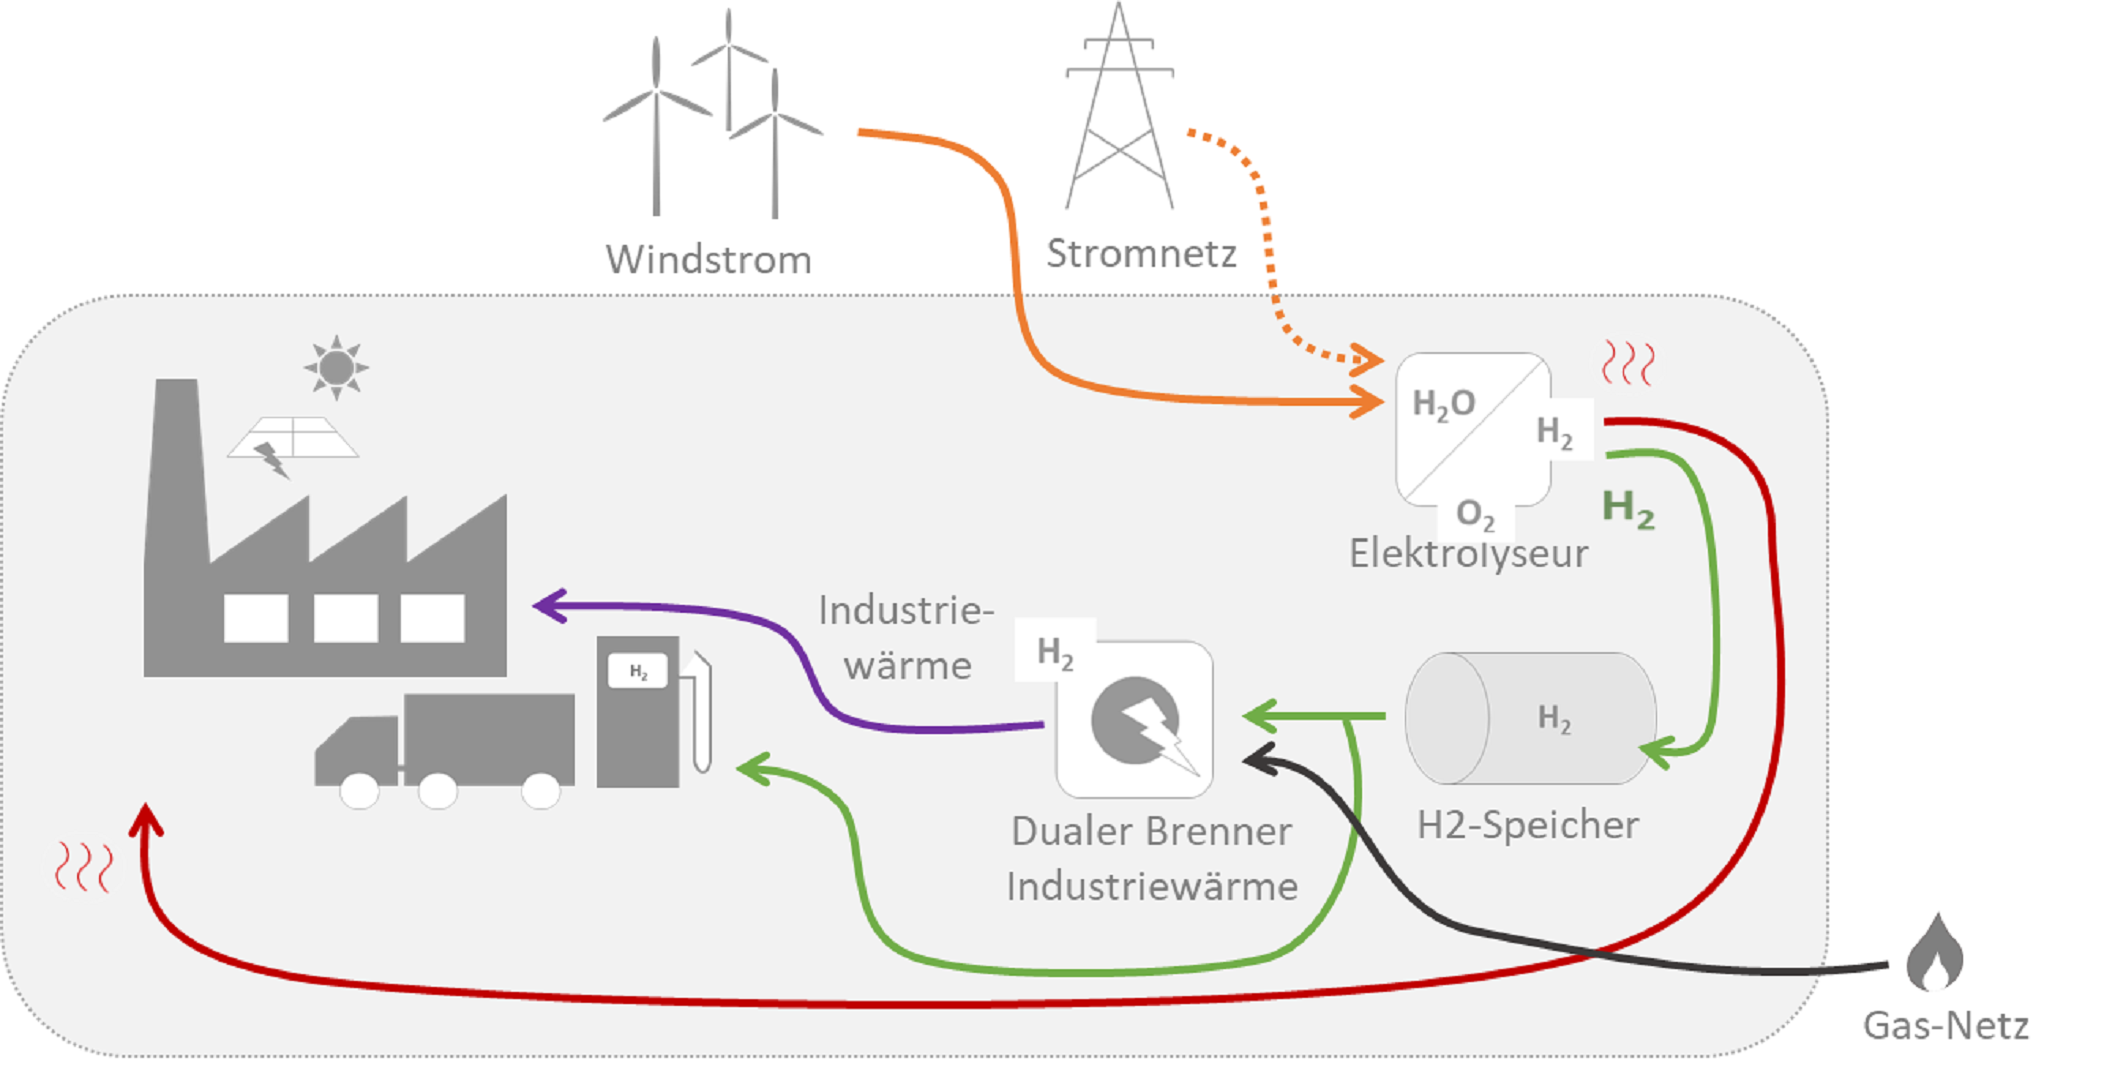
District type 3: Industrial area
The diagram shows the energy flows in distric type 3 (industrial area with the use of hydrogen technology).
Copyright: Österreichische Energieagentur
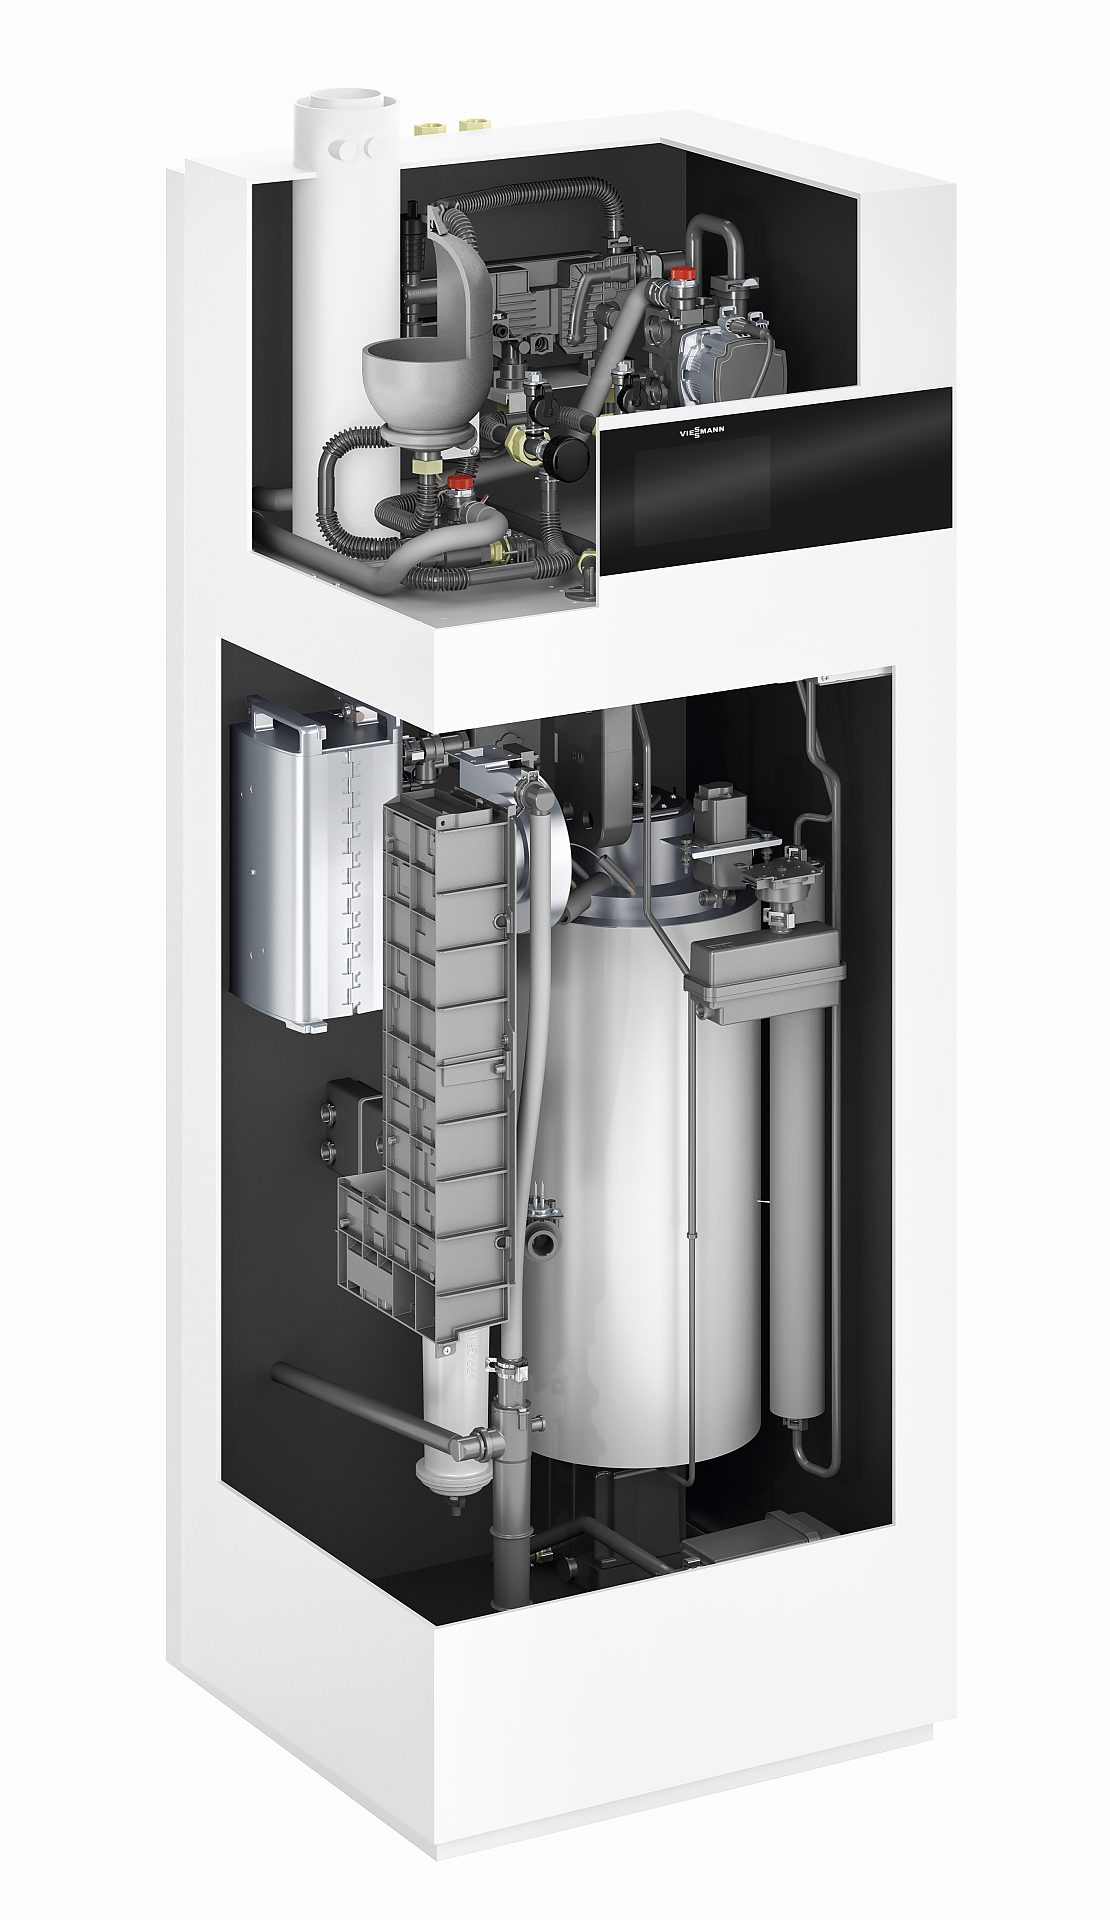
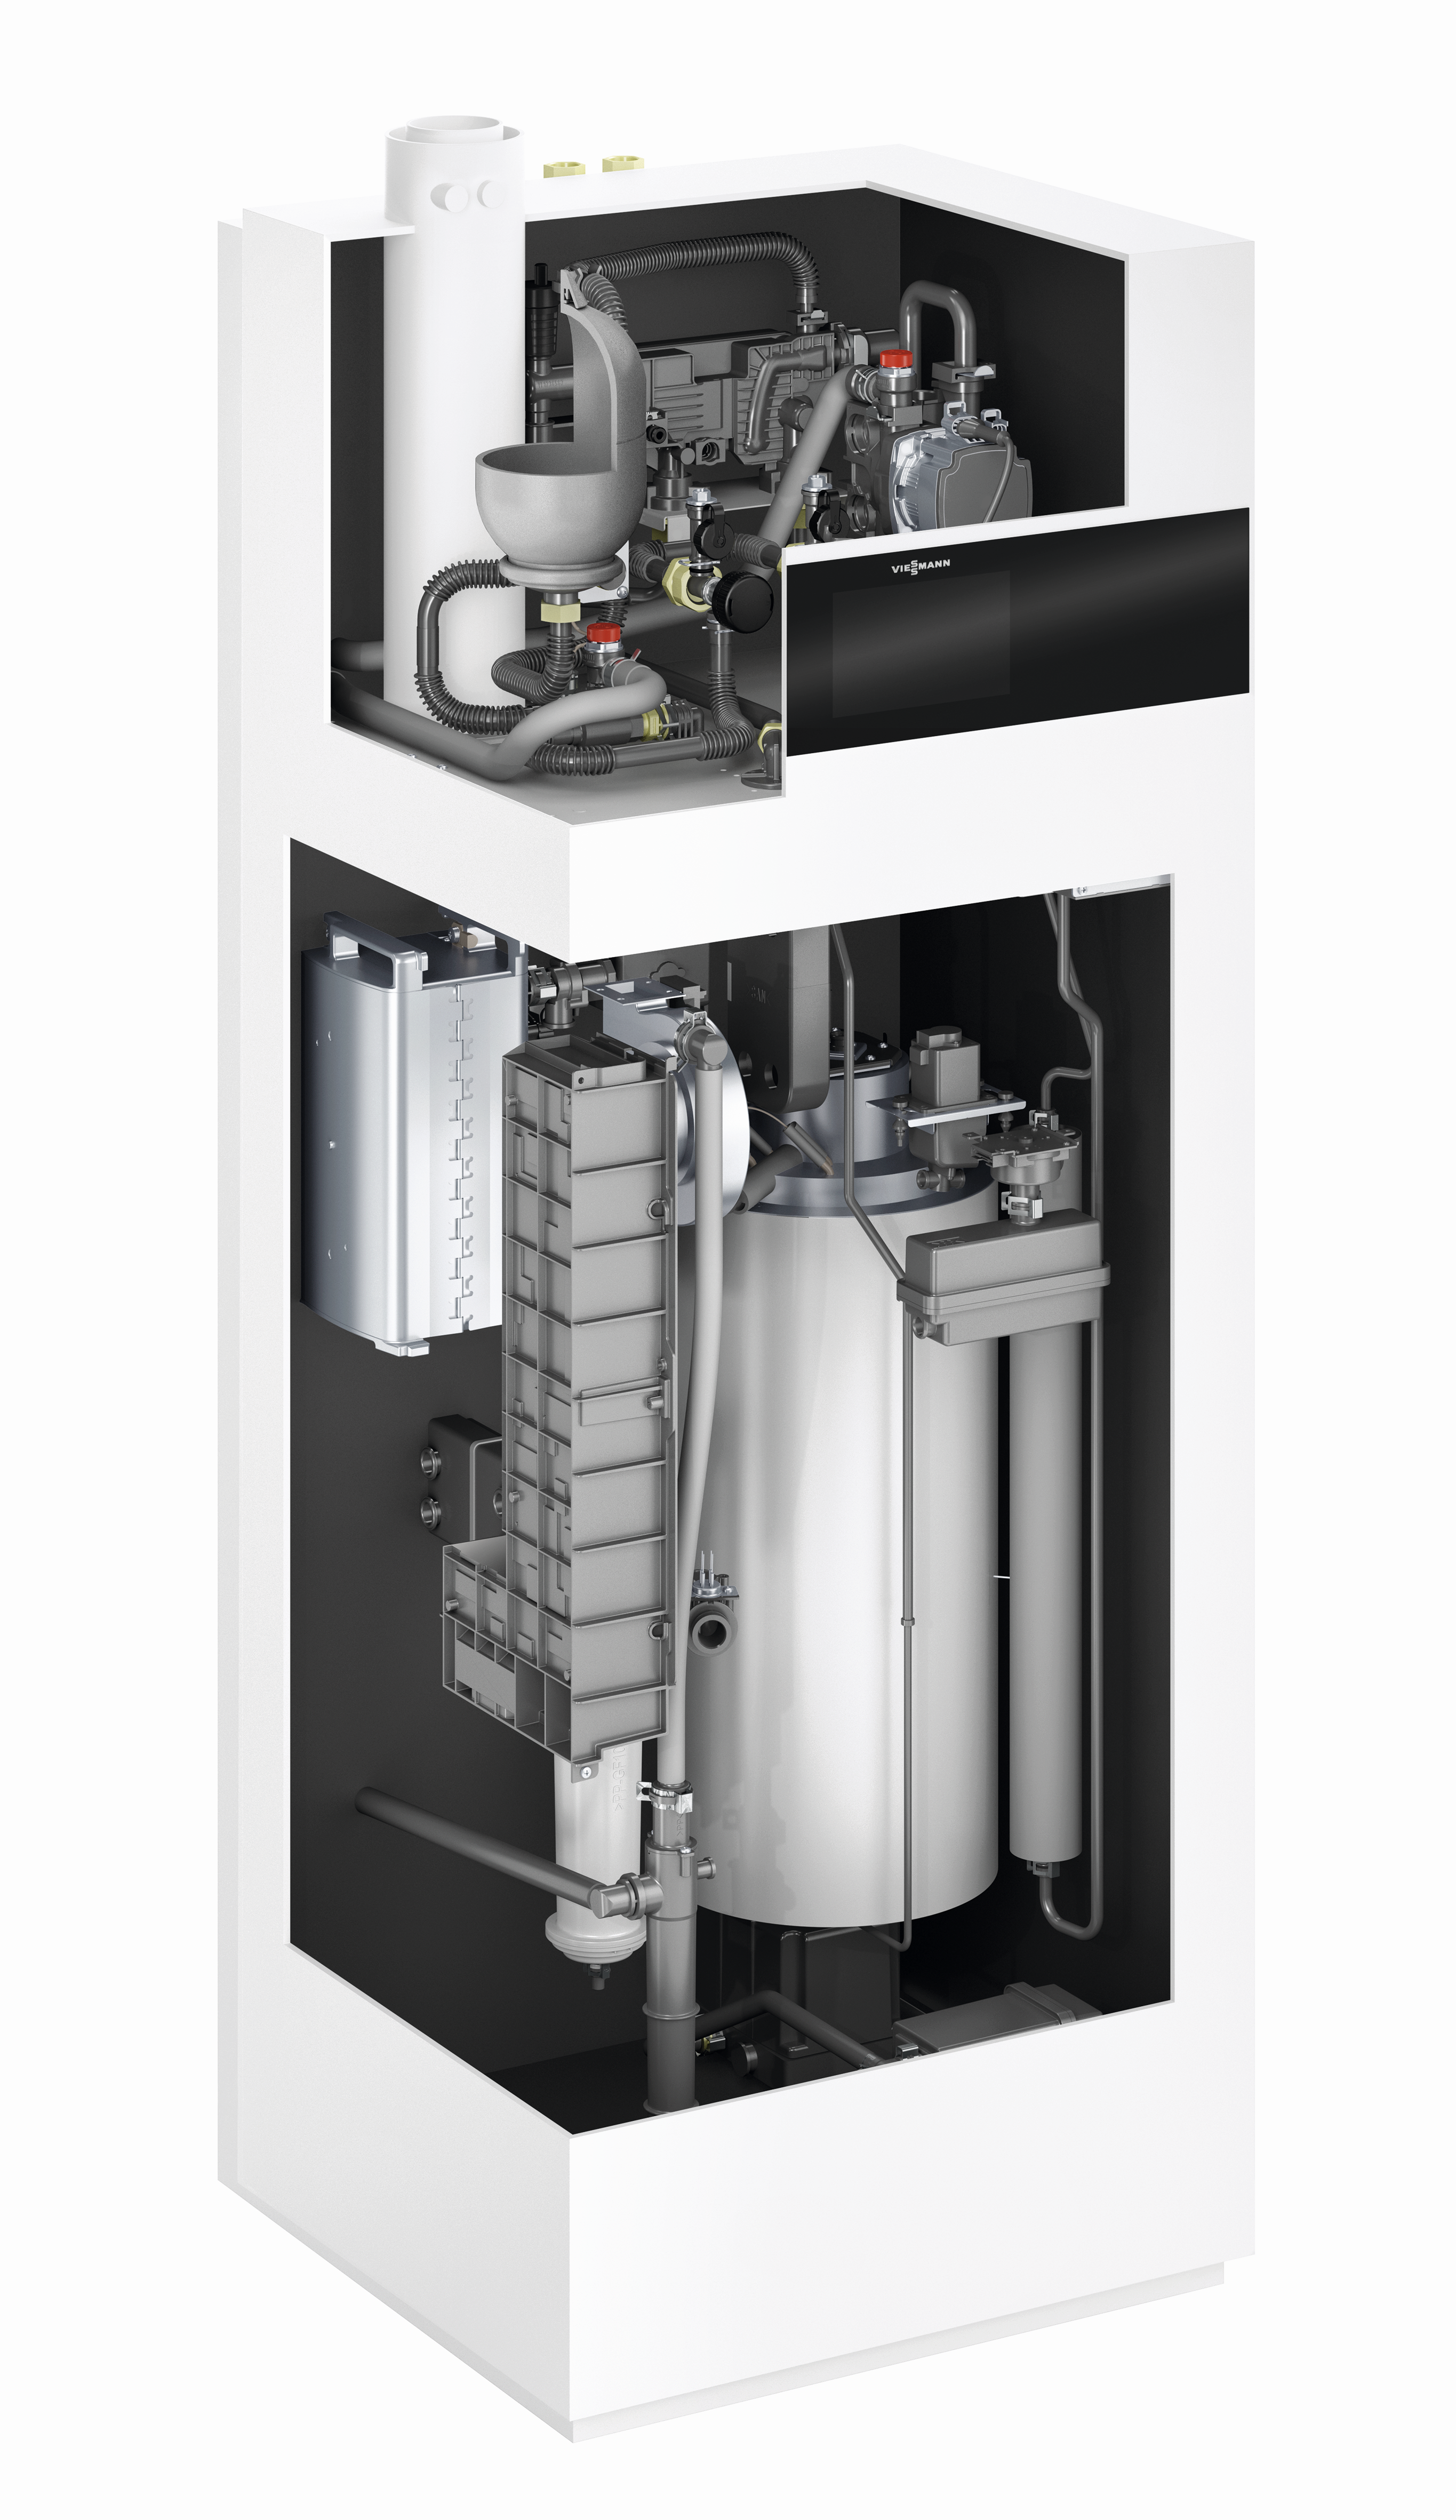
Inner structure of a fuel cell heating system
The illustrateion shows the inner structure and components of a fuel cell heating system.
Copyright: Viessmann Climate Solutions
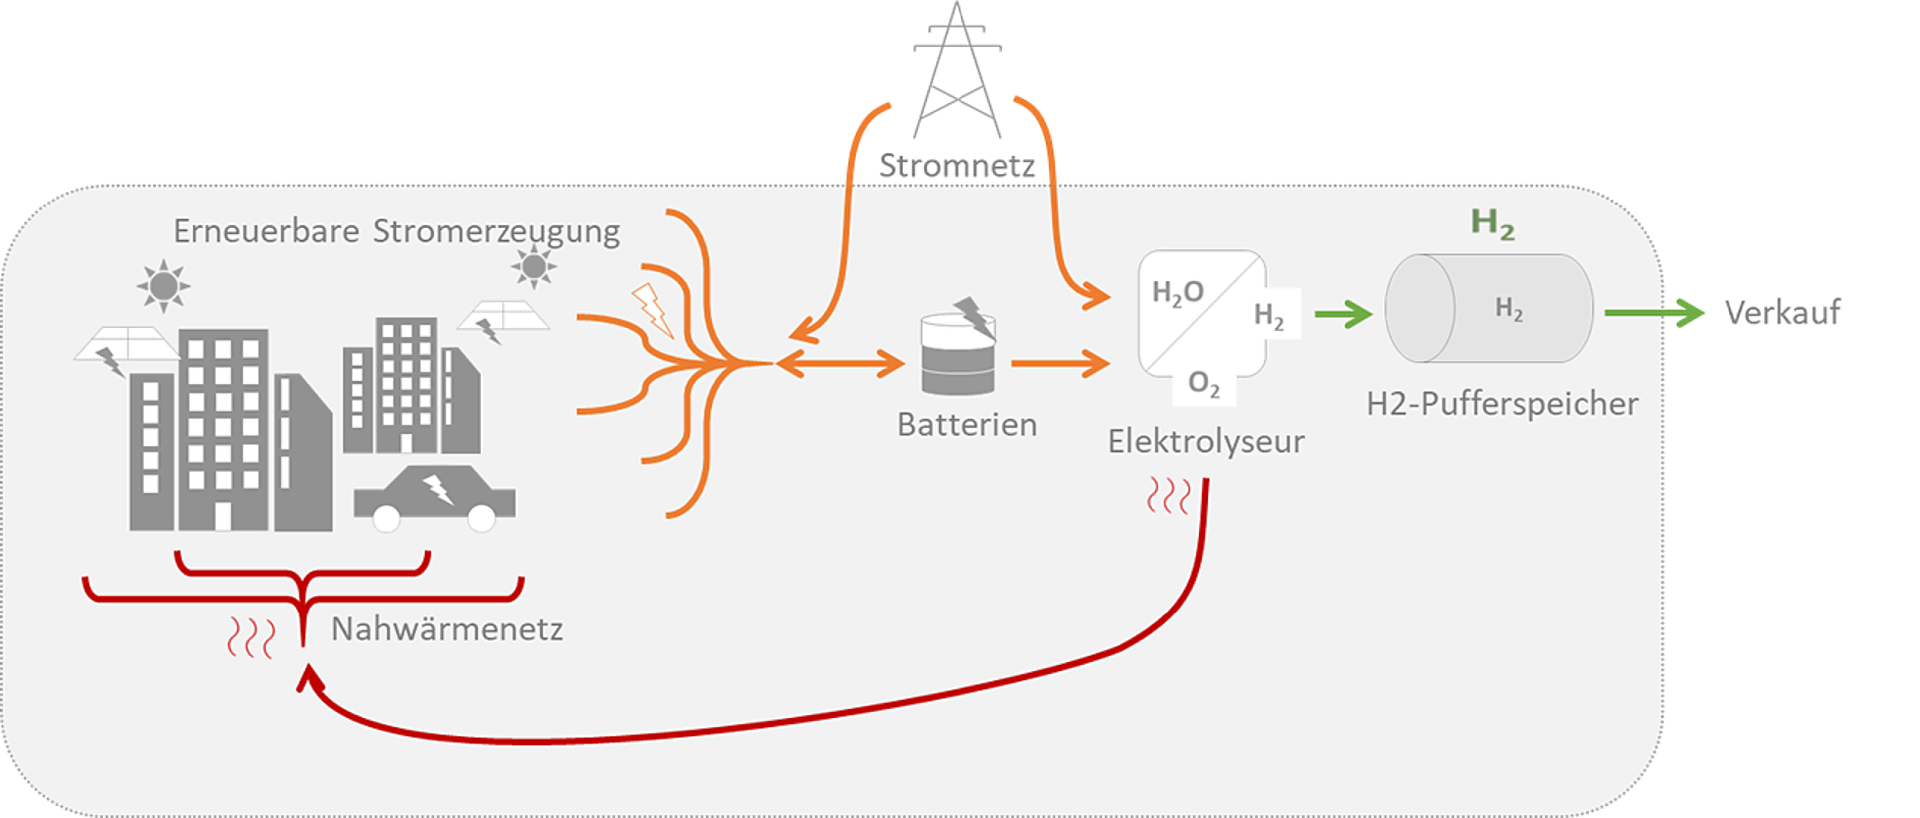
District type 1: Energie community in urban environment
The diagram shows the energy flows in distric type 1 (energy community in urban environment with the use of hydrogen technology).
Copyright: Österreichische Energieagentur
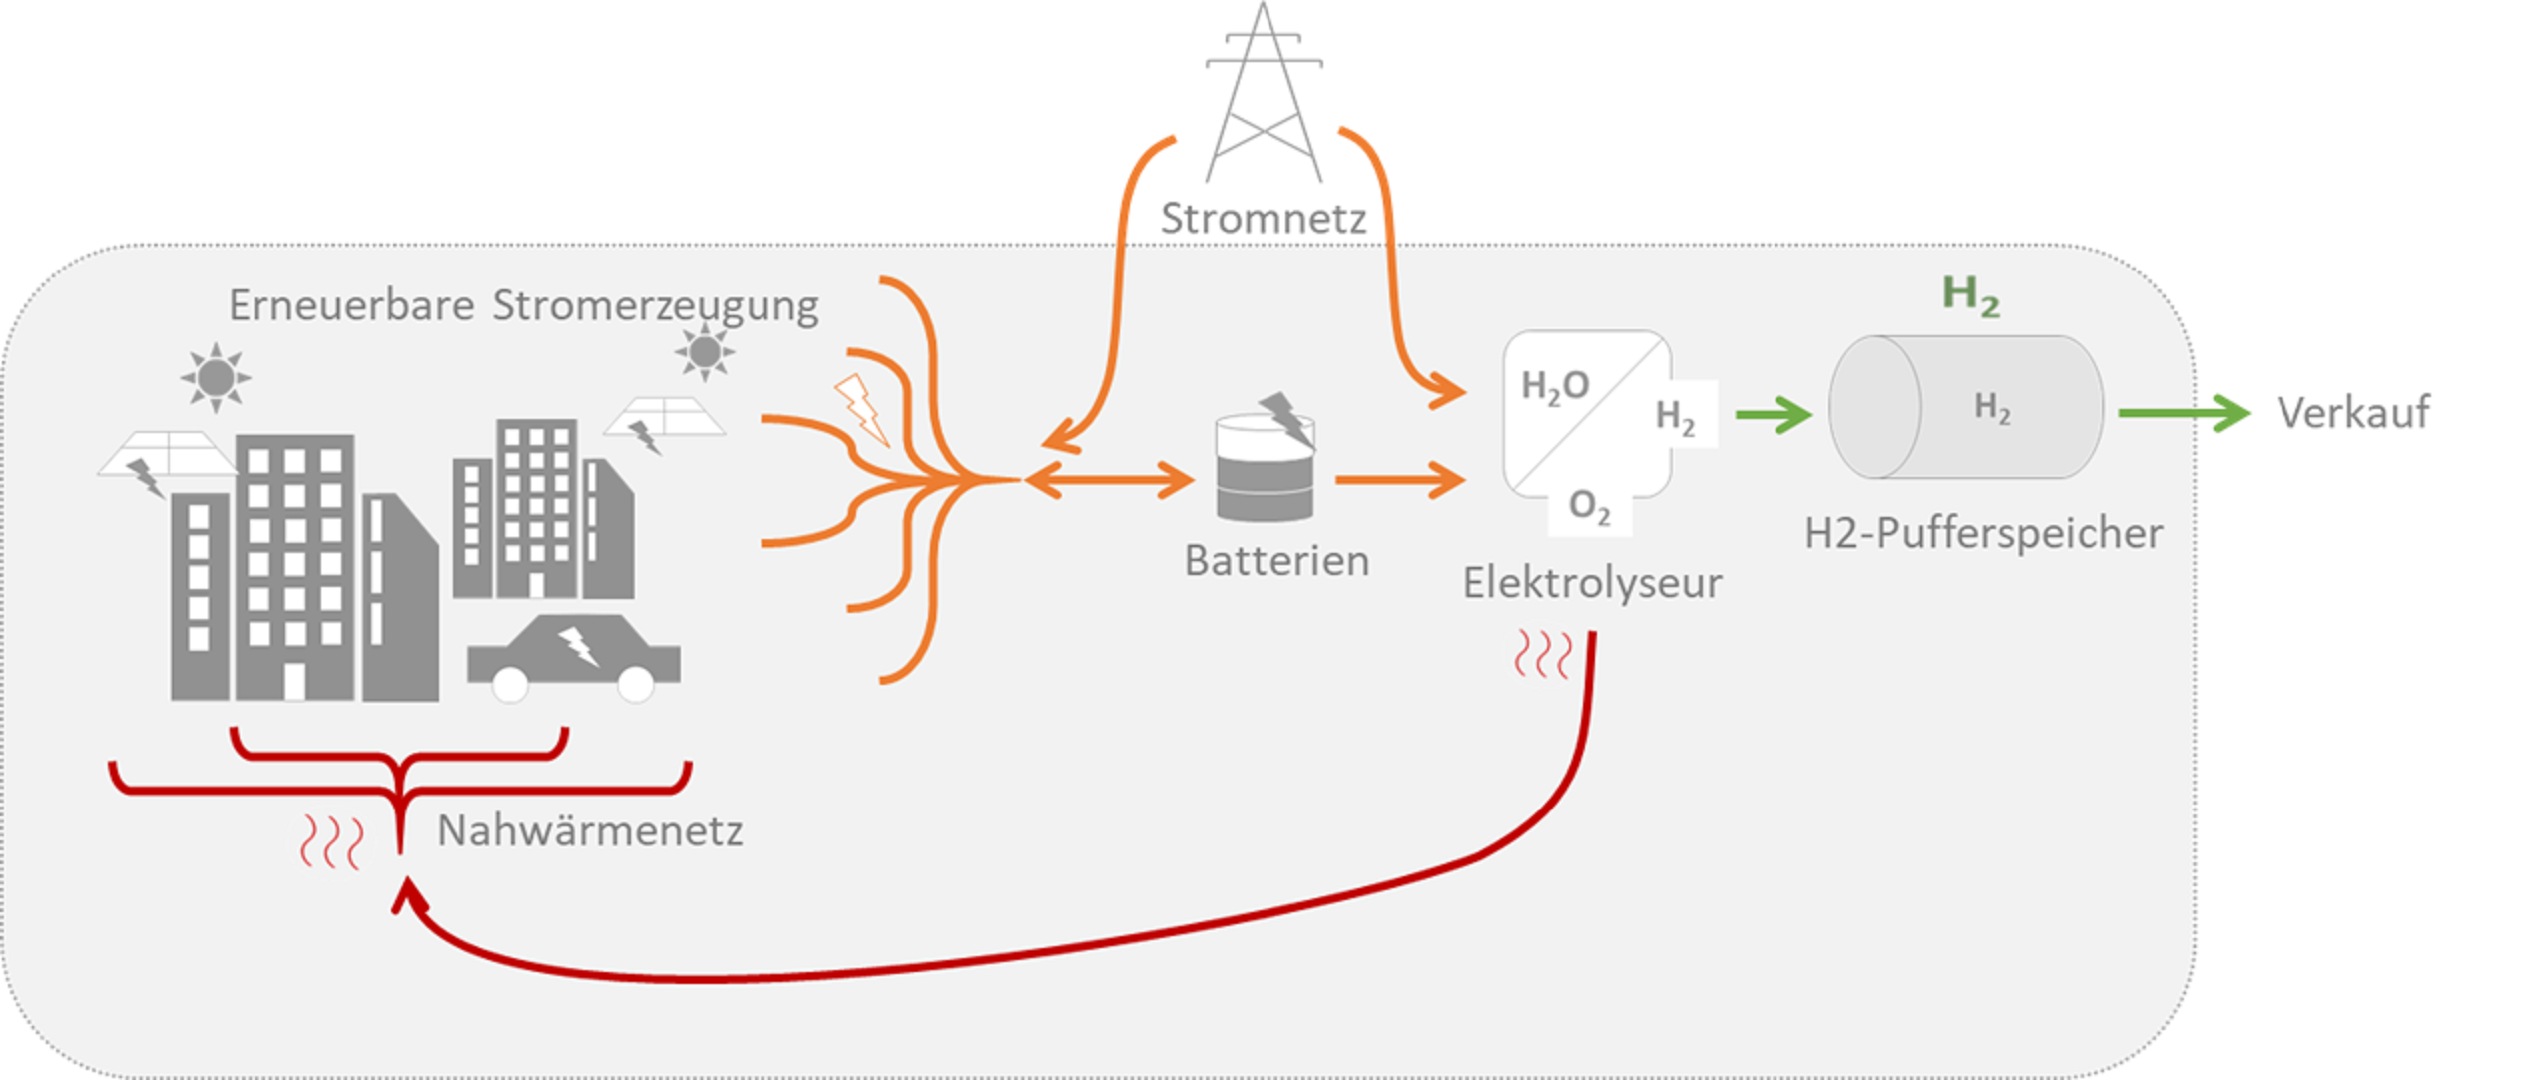

District type 2: Energie community in rural environment
The diagram shows the energy flows in distric type 2 (energy community in rural environment with the use of hydrogen technology).
Copyright: Österreichische Energieagentur

Fuel cell heating system Vitovalor from the company Viessmann
The illustration shows a fuel cell heating system from Viessmann company. This system is one of the best selling fuel cell systems in Germany.
Copyright: Viessmann Climate Solutions

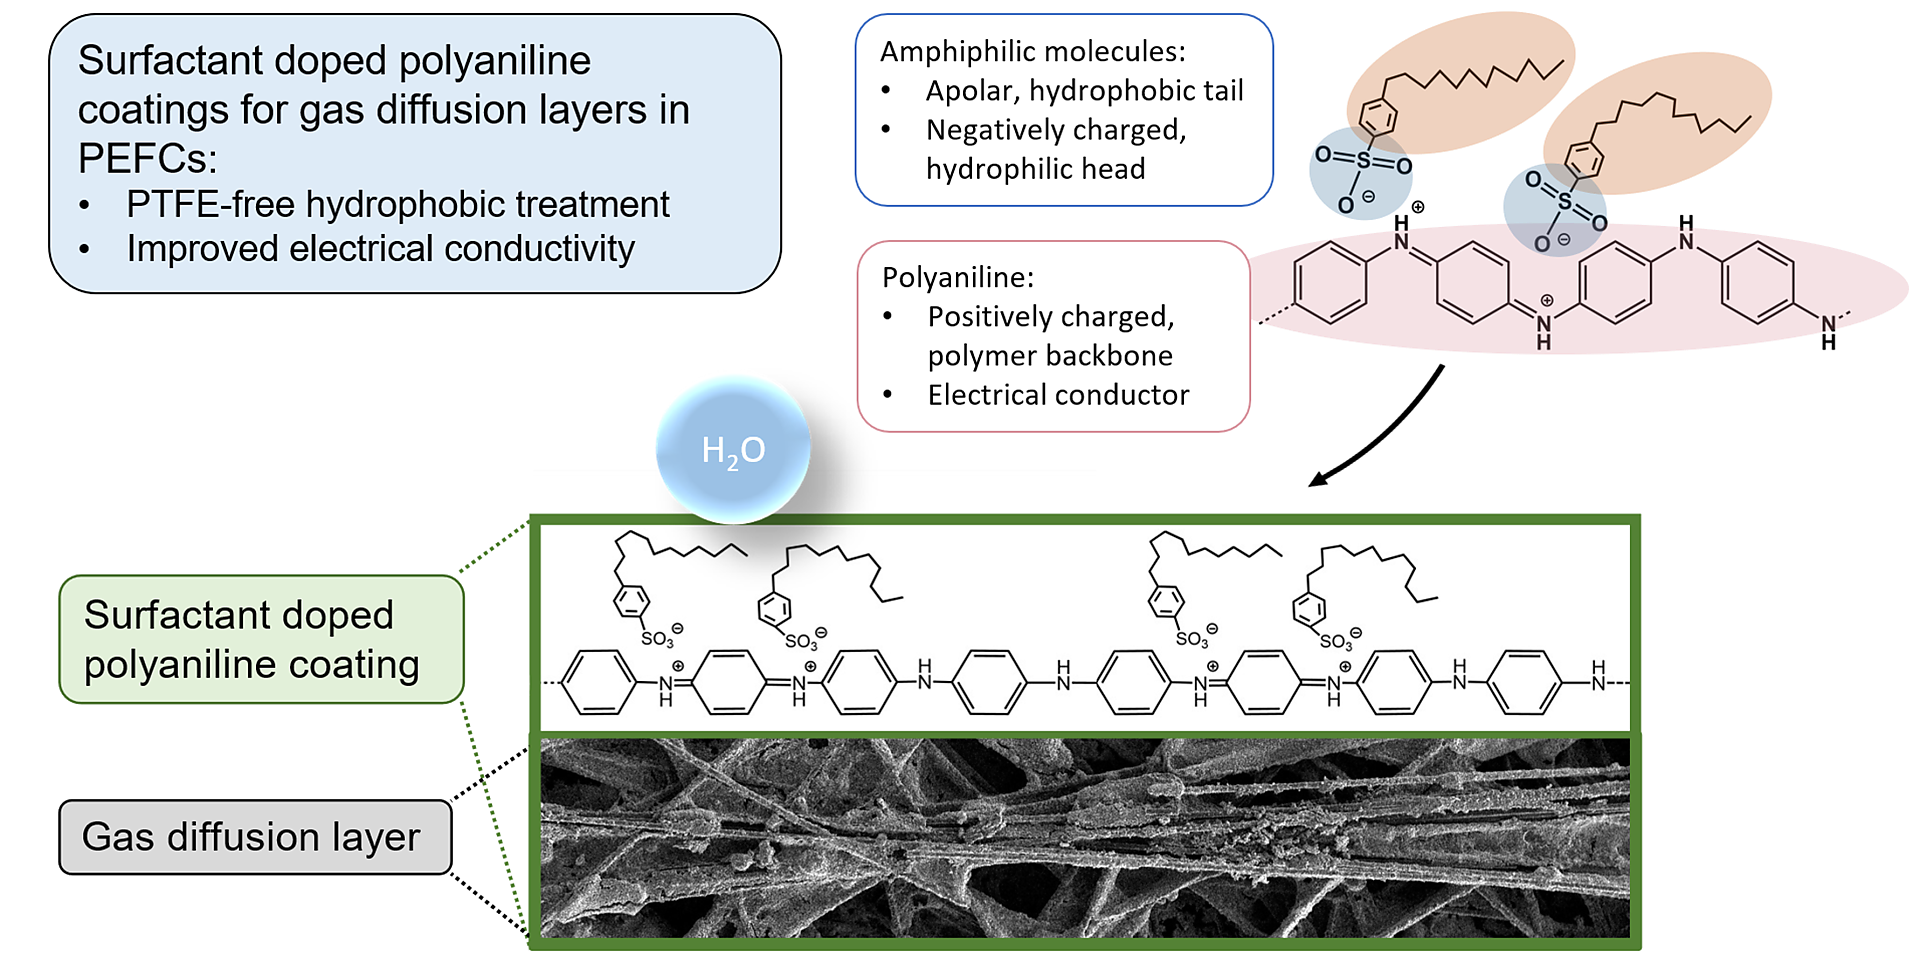
Concept of surfactant-doped polyaniline coating for gas diffusion layers
PTFE-free hydrophobisation and improved electrical conductivity: Surface-active species consisting of non-polar, negatively charged terminal groups and apolar residues attach themselves to the positively charged PANI framework, which ensures electrical conductivity.
Copyright: CEET/TU Graz

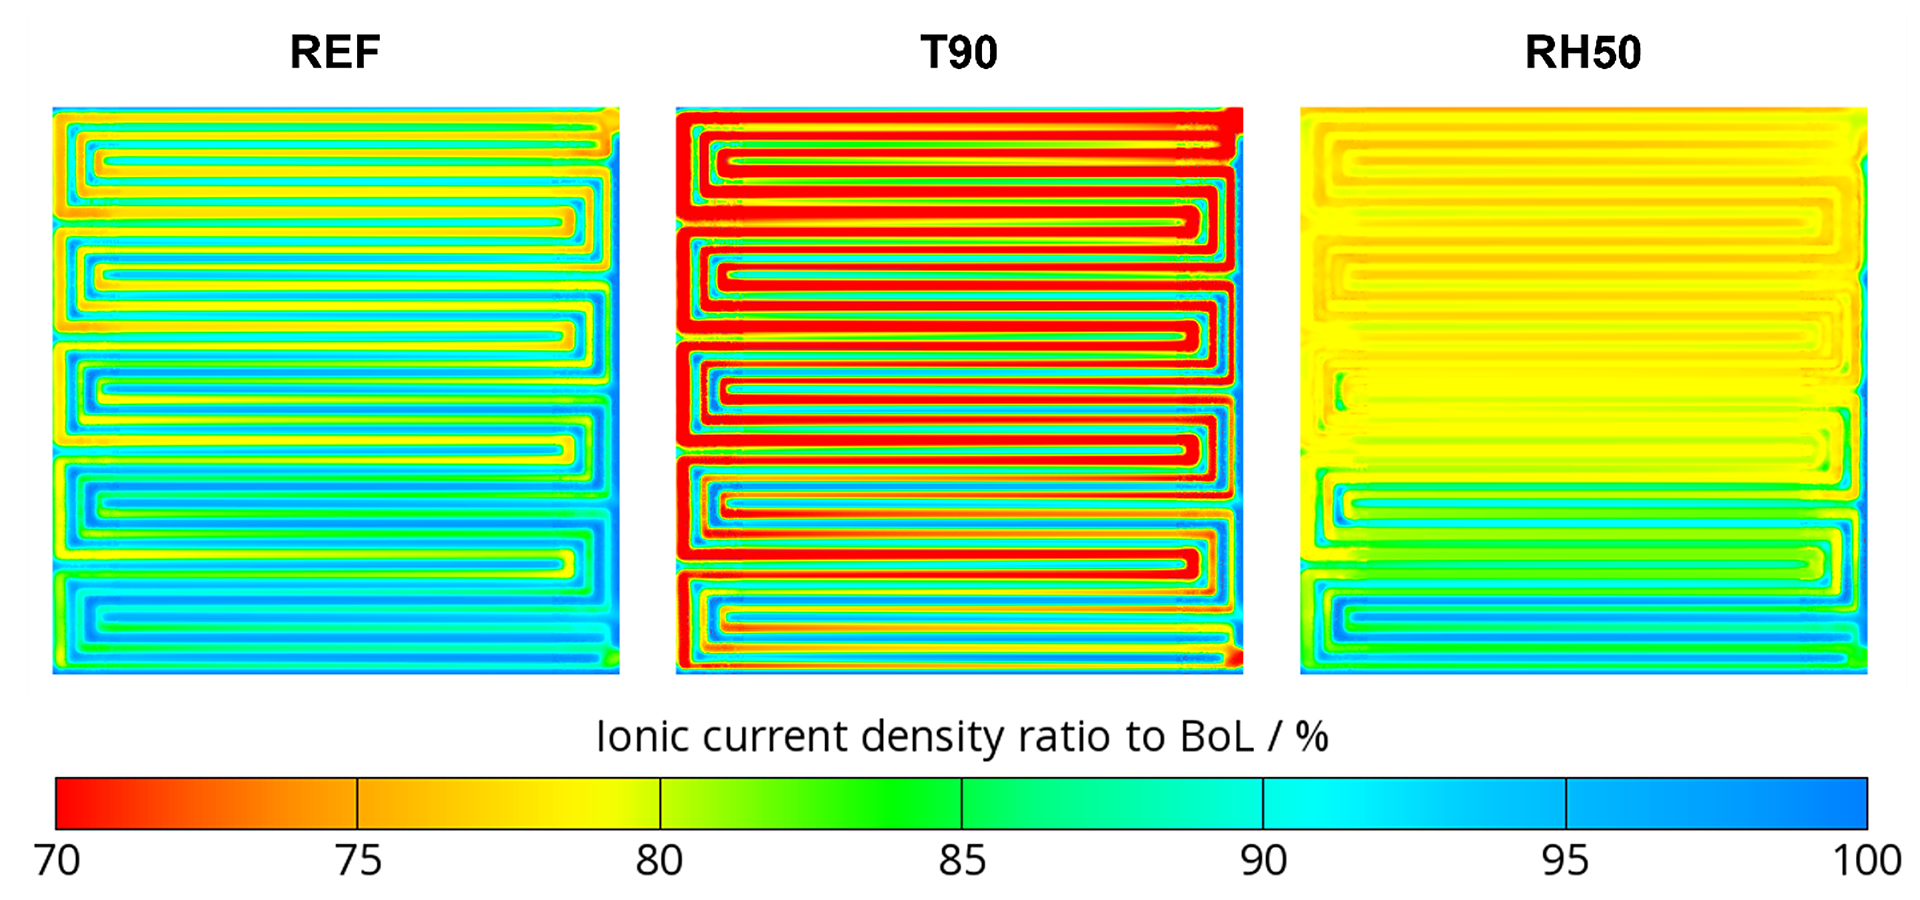
Distribution of the ion current density in the membrane of the aged cell, expressed as a percentage compared to the initial state. This provides a detailed insight into the current distribution within the cell.
False colour image of the ion current density across the flow field of the cell.
Copyright: CEET/TU Graz

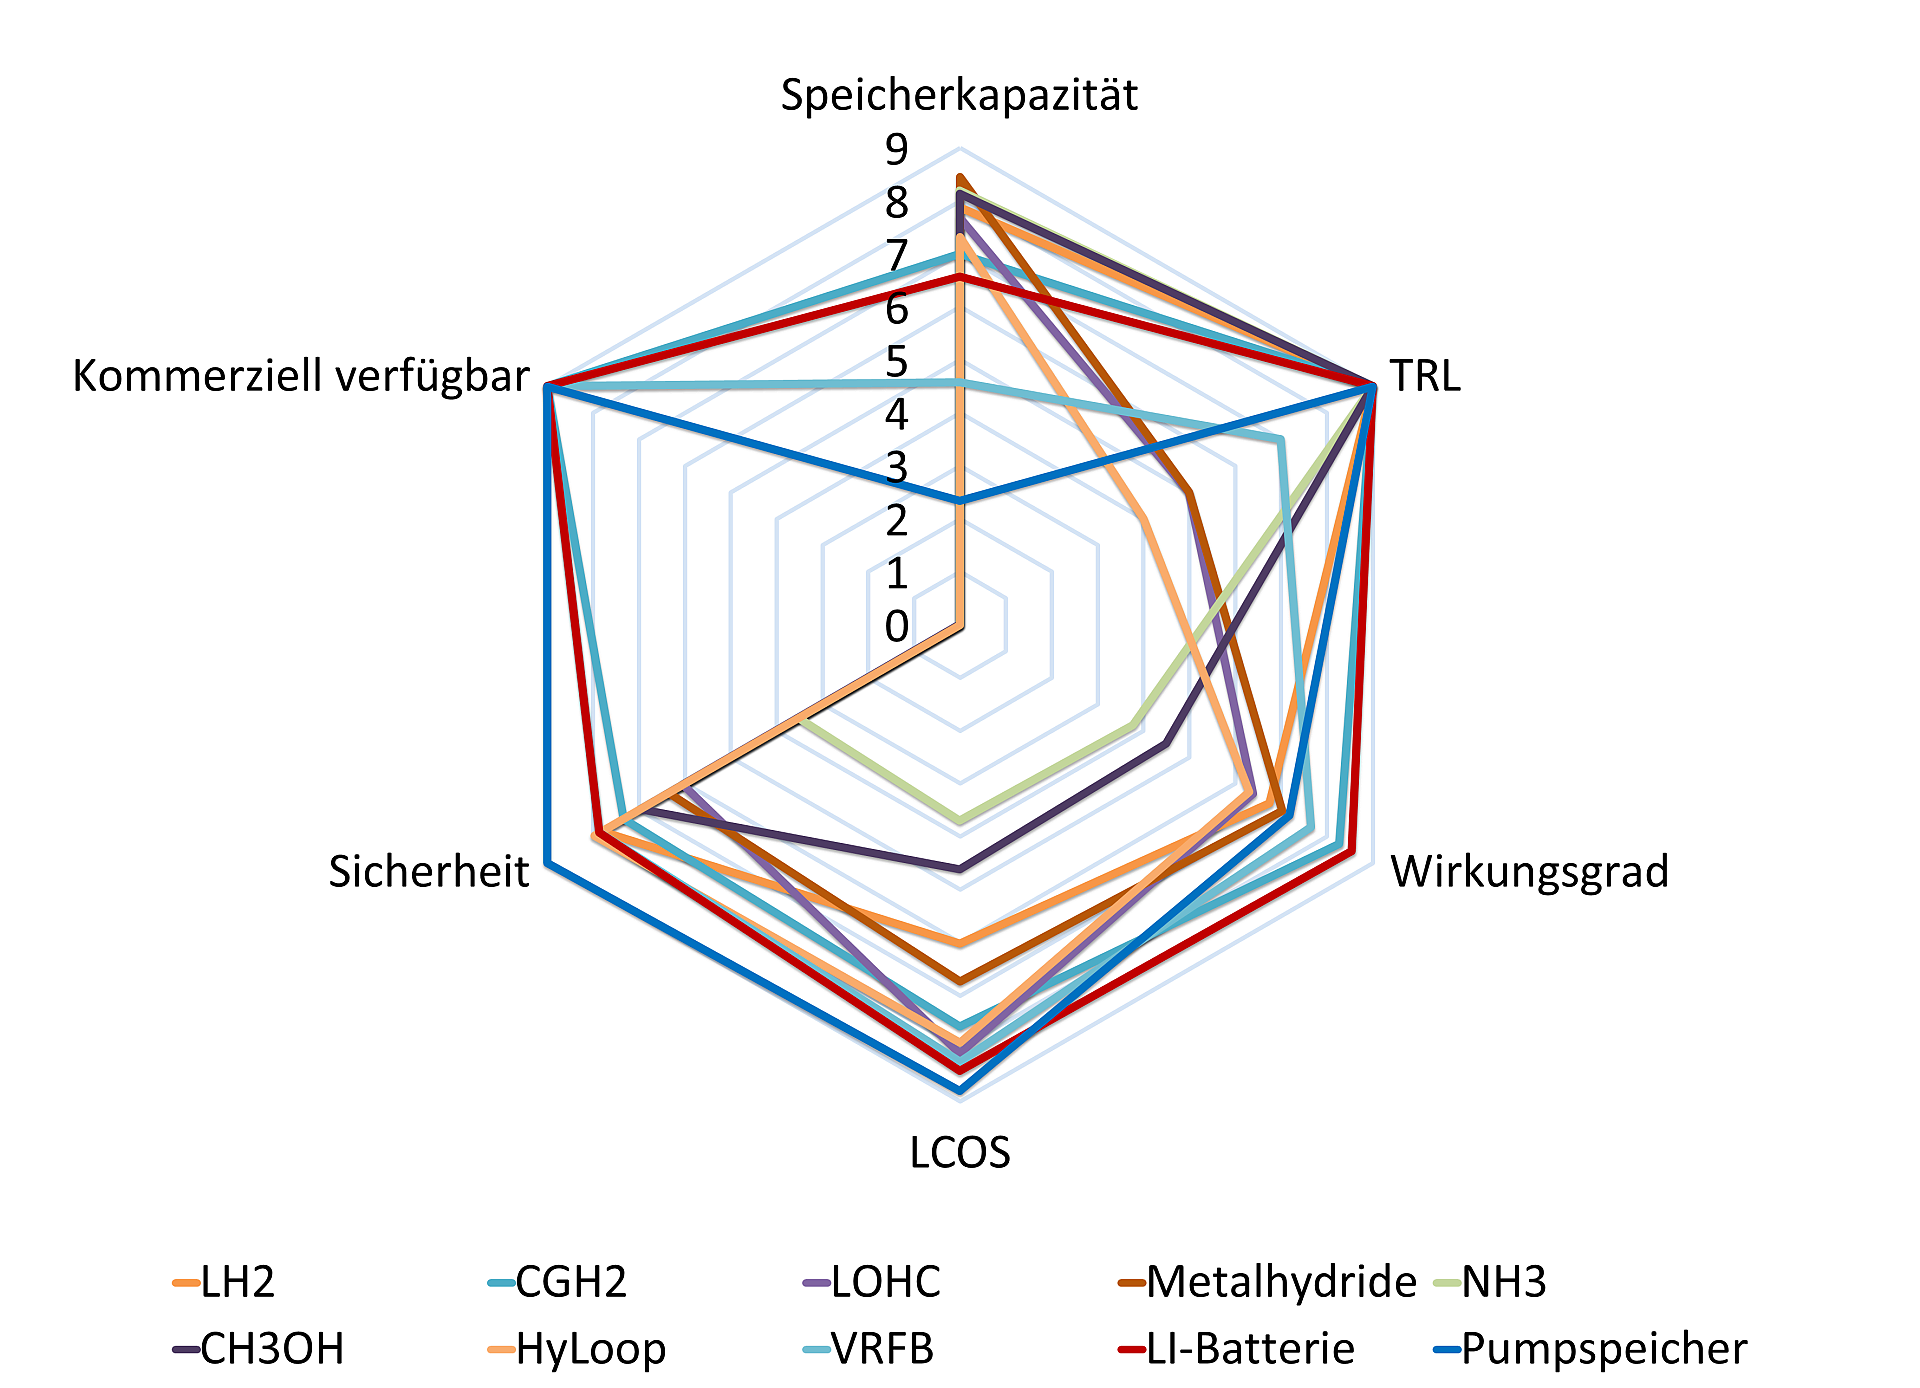
Graphical representation of the assessment across a range of different storage technologies
Comparison of various parameters (storage capacity, TRL, efficiency, cost, safety and commercial availability) for the storage technologies under consideration. These include liquid hydrogen, compressed hydrogen, organic hydrogen carriers, metal hydrides, ammonia, but also redox flow and lithium-based battery systems, pumped storage and chemical looping hydrogen (HyLoop).
Copyright: CEET/TU Graz

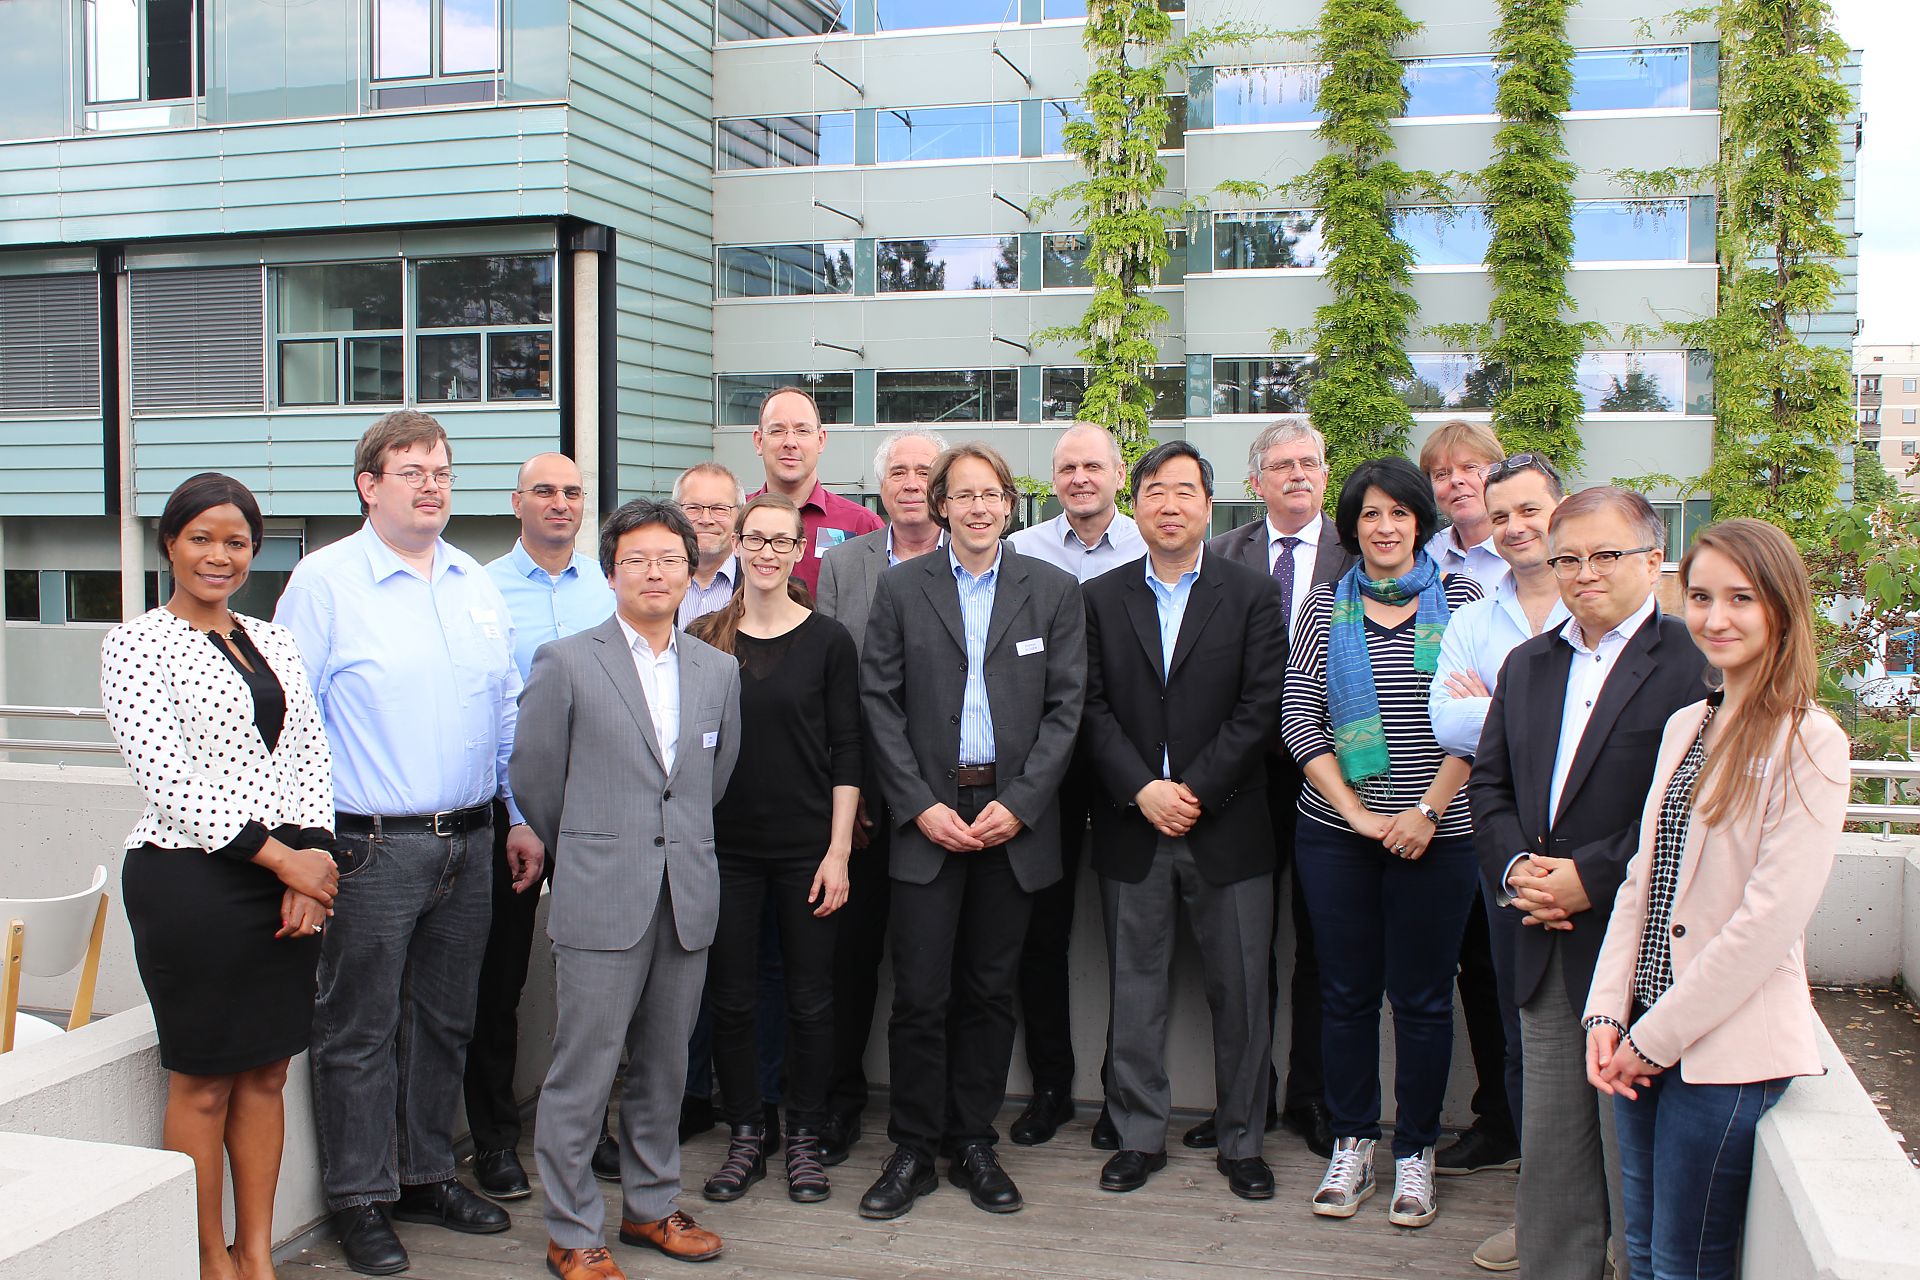
Participants of the Annex Meeting of 16 May 2017
The meeting on Annex 31 was held on 16 May in the rooms of the Institute of Chemical Engineering and Environmental Technology. Hideo Inoue, Alexander Dyck and Werner Lehnert gave technical presentations on the research activities at their respective facilities.
