Project Image Pool
There are 16 results.
Terms of use: The pictures on this site originate from the projects in the frame of the programmes City of Tomorrow, Building of Tomorrow and the IEA Research Cooperation. They may be used credited for non-commercial purposes under the Creative Commons License Attribution-NonCommercial (CC BY-NC).
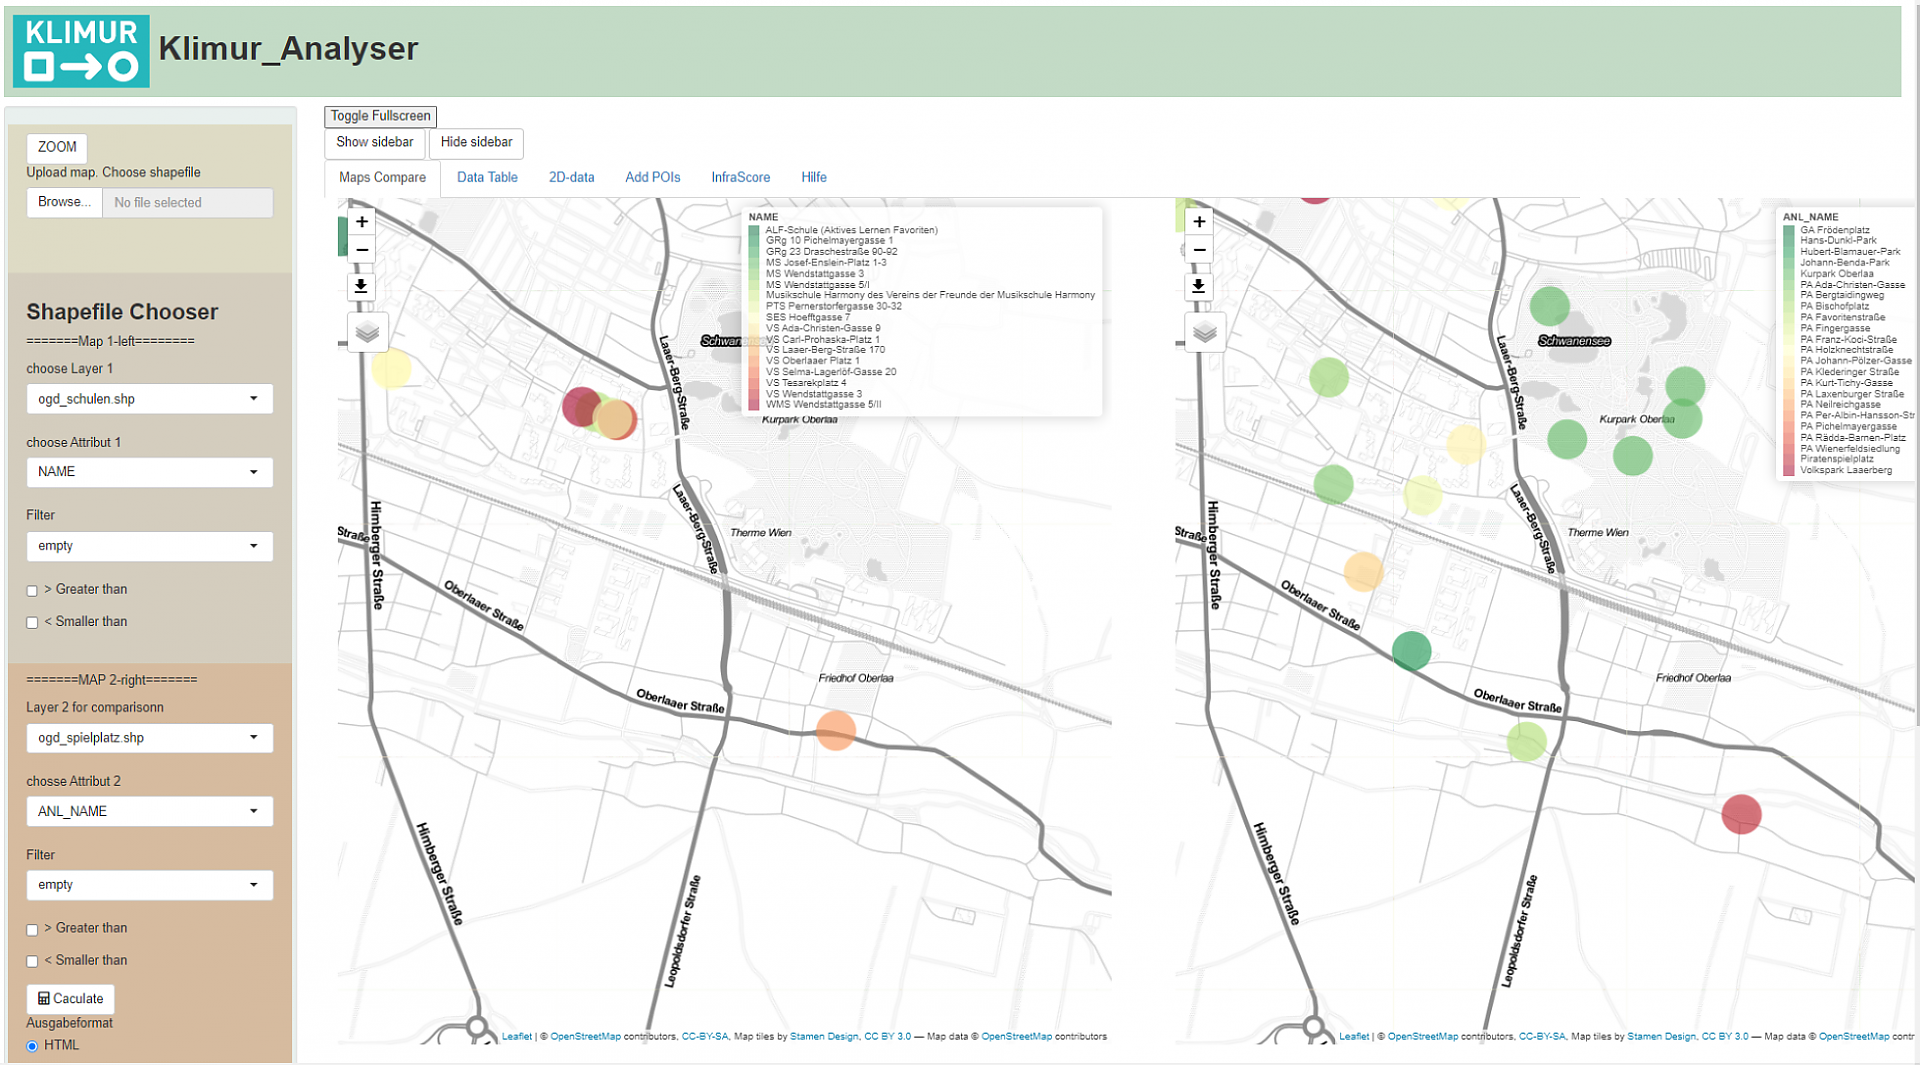
KLIMUR Analyzer: Screenshot of the map comparison
The figure shows the user interface of the KLIMUR-Analyzer on the right with different drop-down menus and buttons. Two maps are shown in comparison on the right with points of schools and on the left with points of playgrounds (OGD Vienna). This corresponds to only one feature of the KLIMUR-Analyzer. More features on analysis and participatory data collection and evaluation can be found in the project report.
Copyright: KLIMUR
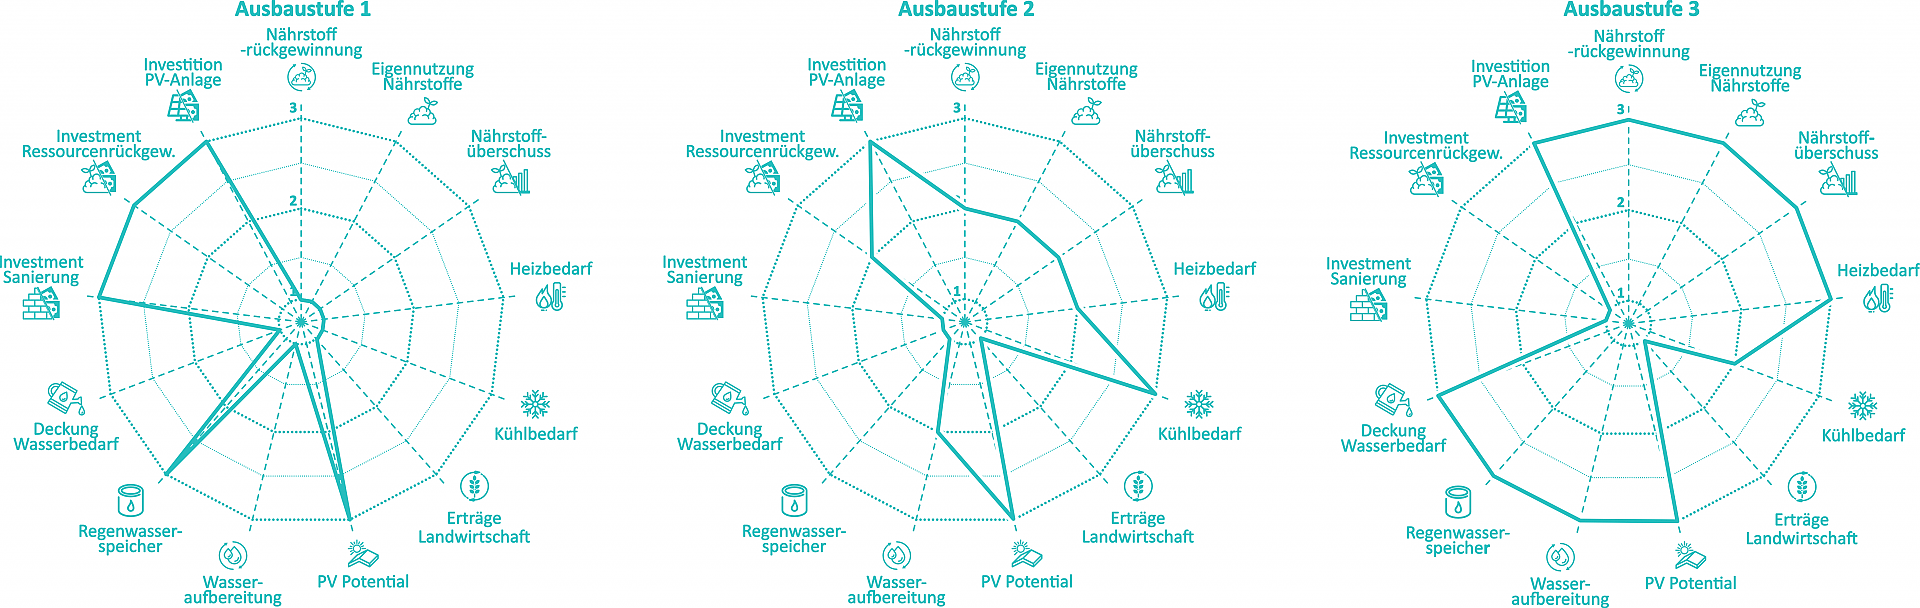
Integrative evaluation of different extension stage for the Zukunftshof
The figure shows the network diagrams of the integrative evaluation for the Zukunftshof. From an integrative point of view, expansion stage 1 is the worst overall, i.e. it has the smallest area. The best variant would be expansion stage 3, although this also has the highest investment costs (therefore only 1 evaluation point). However, a general evaluation based on the sum of the KPIs seems difficult. Either the individual KPIs must be weighted or the conflicting goals must be examined more closely.
Copyright: KLIMUR

Distributed prosumer approach to resource management (energy, water, nutrients)
The figure shows schematically the transformation of a linear producer-consumer relationship to a feedback relationship between producers and consumers who become distributed prosumers.
Copyright: KLIMUR

Schematic representation of the workflow or tools for the creation and evaluation of the scenarios for Rothneusiedl
The figure shows a schematic representation of the workflow and the tools and interfaces used to create and evaluate the scenarios for Rothneusiedl.
Copyright: KLIMUR
Load shifting potential with EMS
Continuous lines for the first quarter (heating demand) with component activation. With EMS (right), higher outputs are in principle demanded less frequently. Since all power above the maximum power of the heat pump has to be provided by the more expensive district heating, costs can be reduced. The blue area above the heating demand curve represents waste heat from the heat pump, since cooling demand also occurs in the first quarter, which must be provided by the heat pump / chiller.
Copyright: BEST - Bioenergy and Sustainable Technologies GmbH
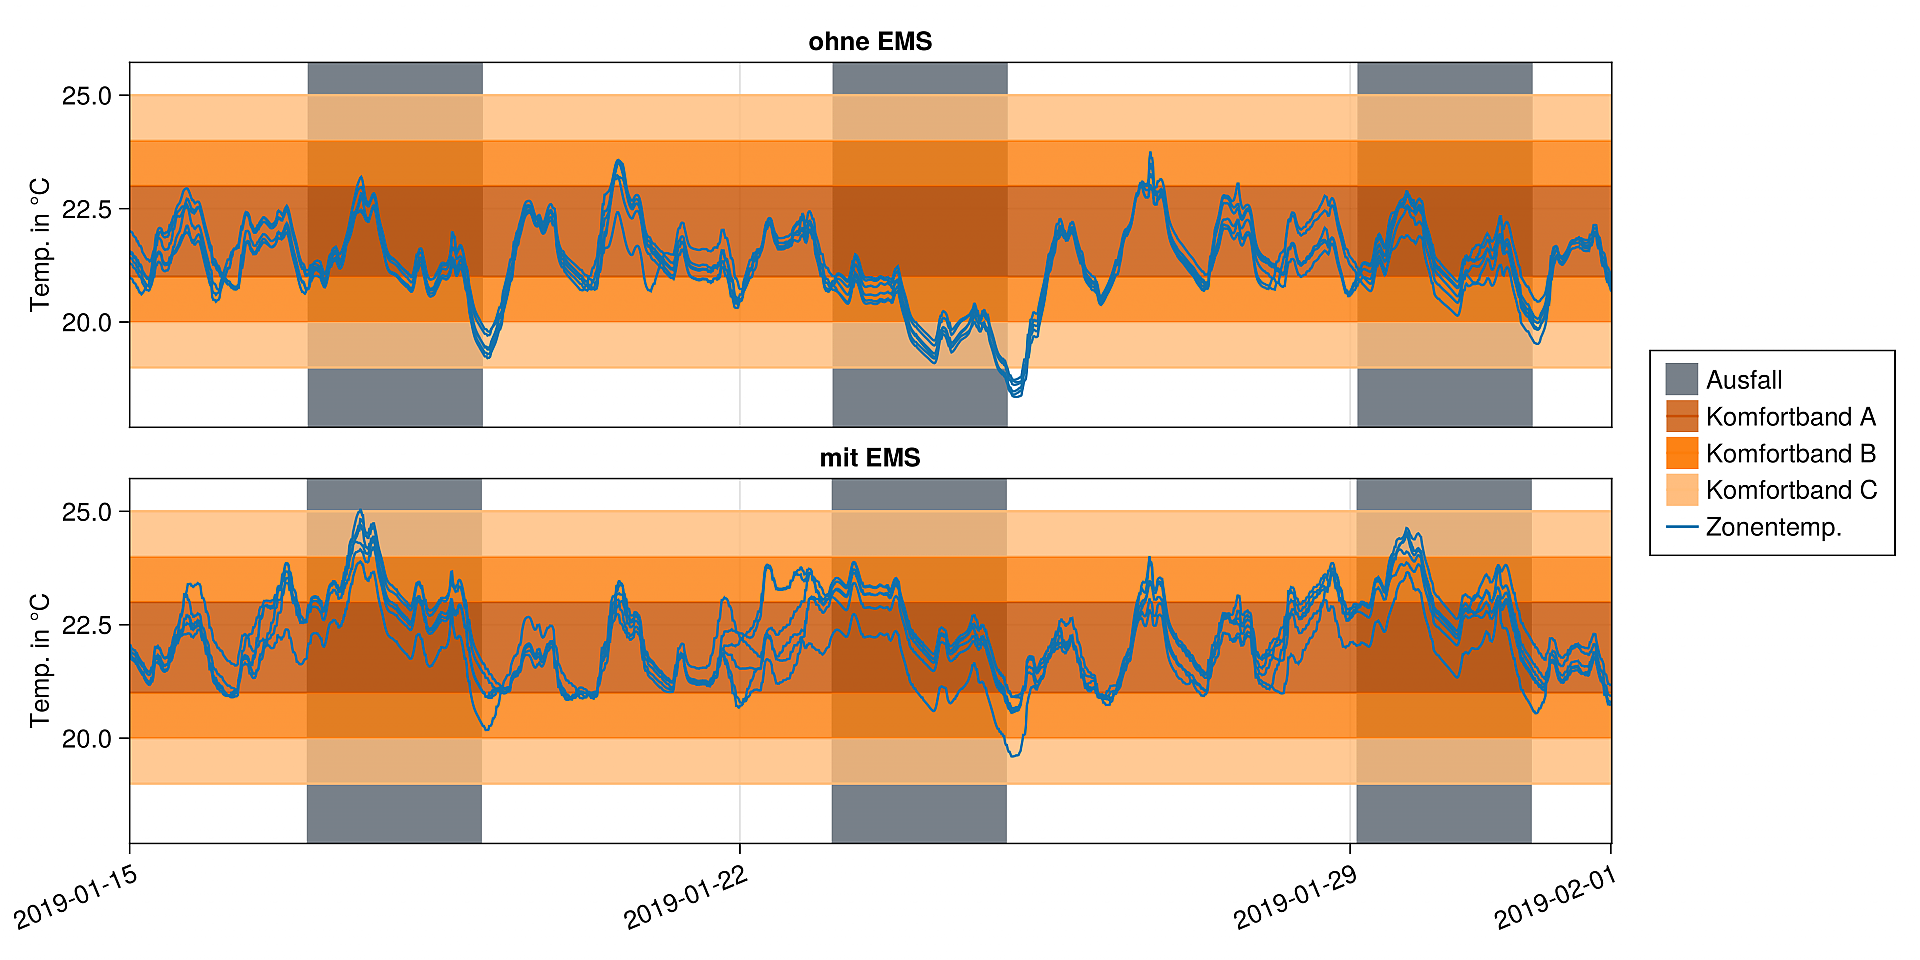
Simulation: failure of the heating circuit pump
Comparison of a standard control and an EMS that is informed of an impending failure of the heating circuit pump. The EMS preheats accordingly to prevent undercooling. Conversely, however, the comfort limits are sometimes exceeded in the other direction, i.e. a slight overheating, because the time constants are correspondingly long.
Copyright: BEST - Bioenergy and Sustainable Technologies GmbH
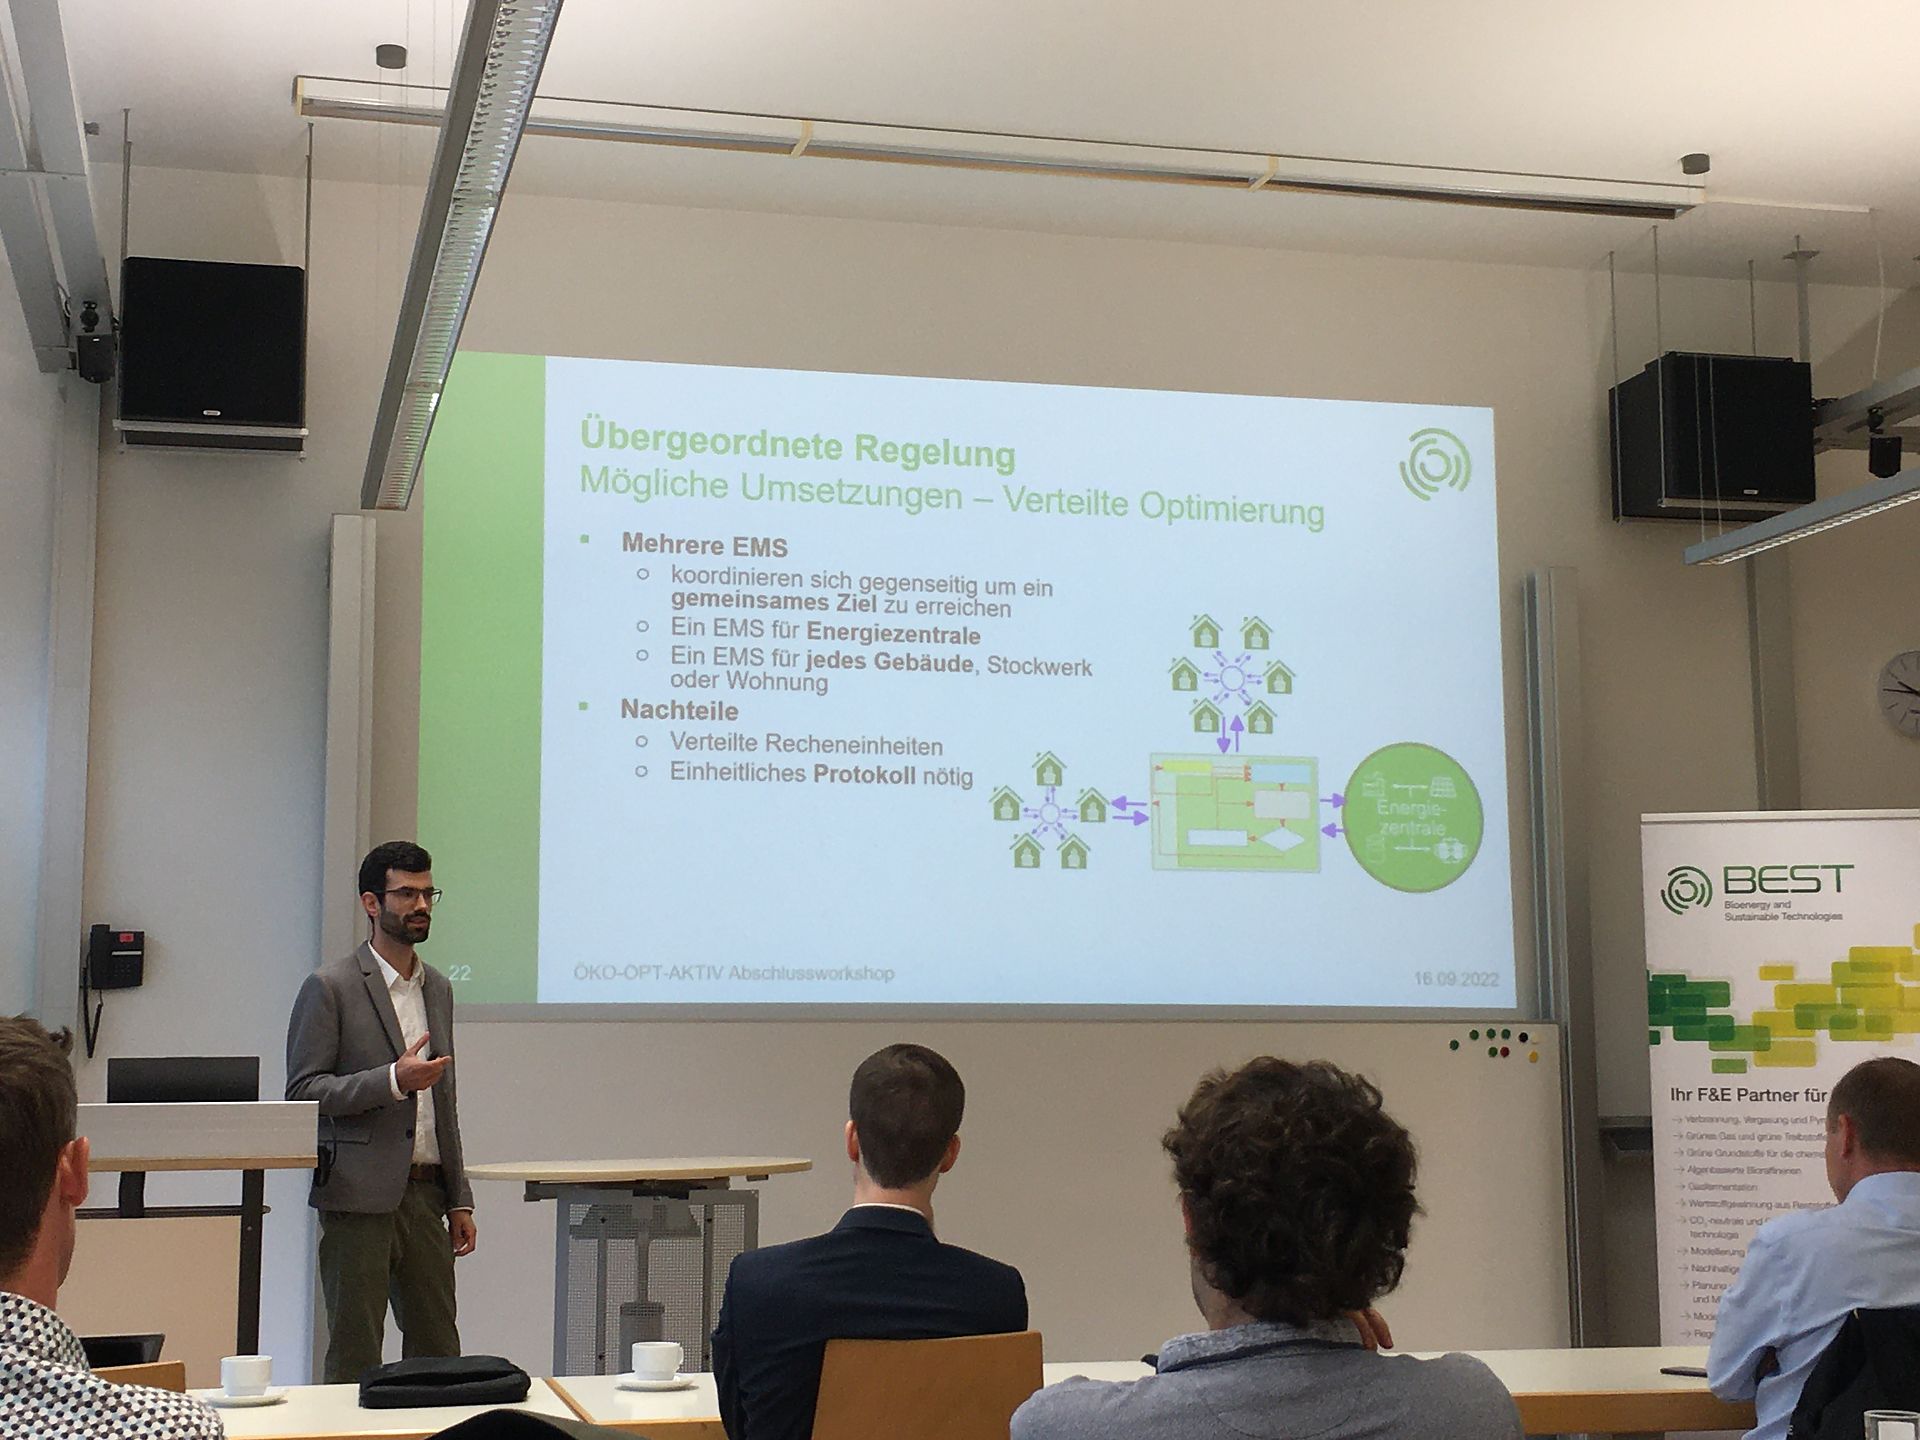
Final workshop ÖKO-OPT-AKTIV
Presentation of Valentin Kaisermayer about the results of the project ÖKO-OPT-AKTIV
Copyright: BEST - Bioenergy and Sustainable Technologies GmbH
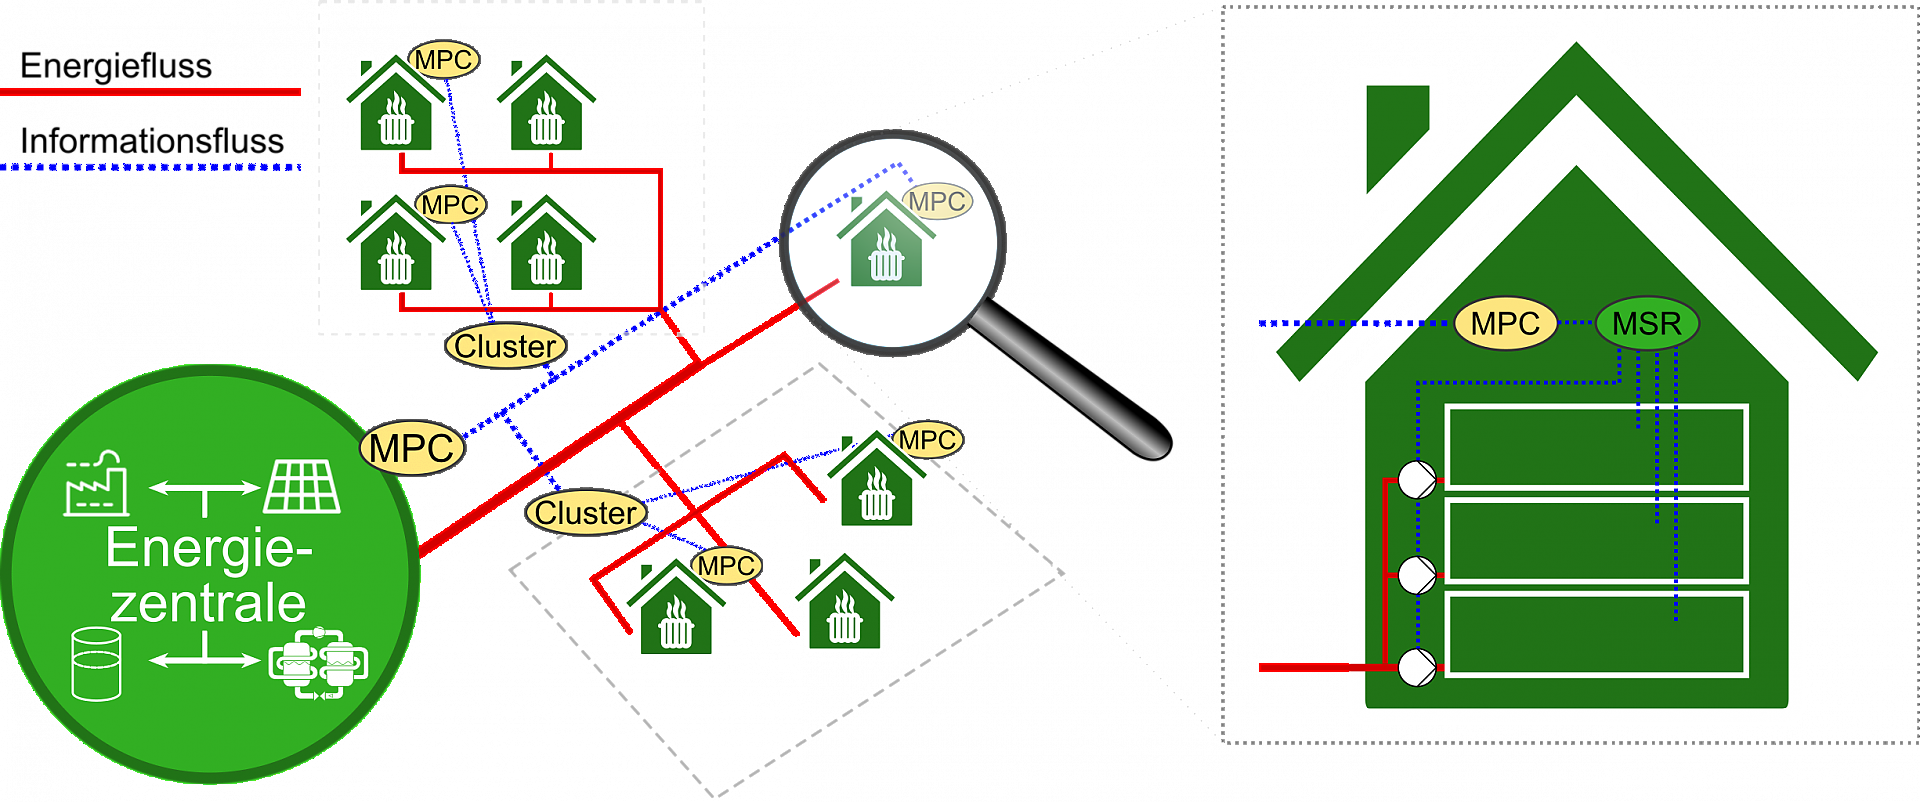
Superordinate structure of the energy hub
Proposed structure of the interaction between individual building control units and the controller of the energy hub. The controllers used are predictive, optimizing controllers (e.g. model predictive controllers, MPC).
Copyright: BEST - Bioenergy and Sustainable Technologies GmbH
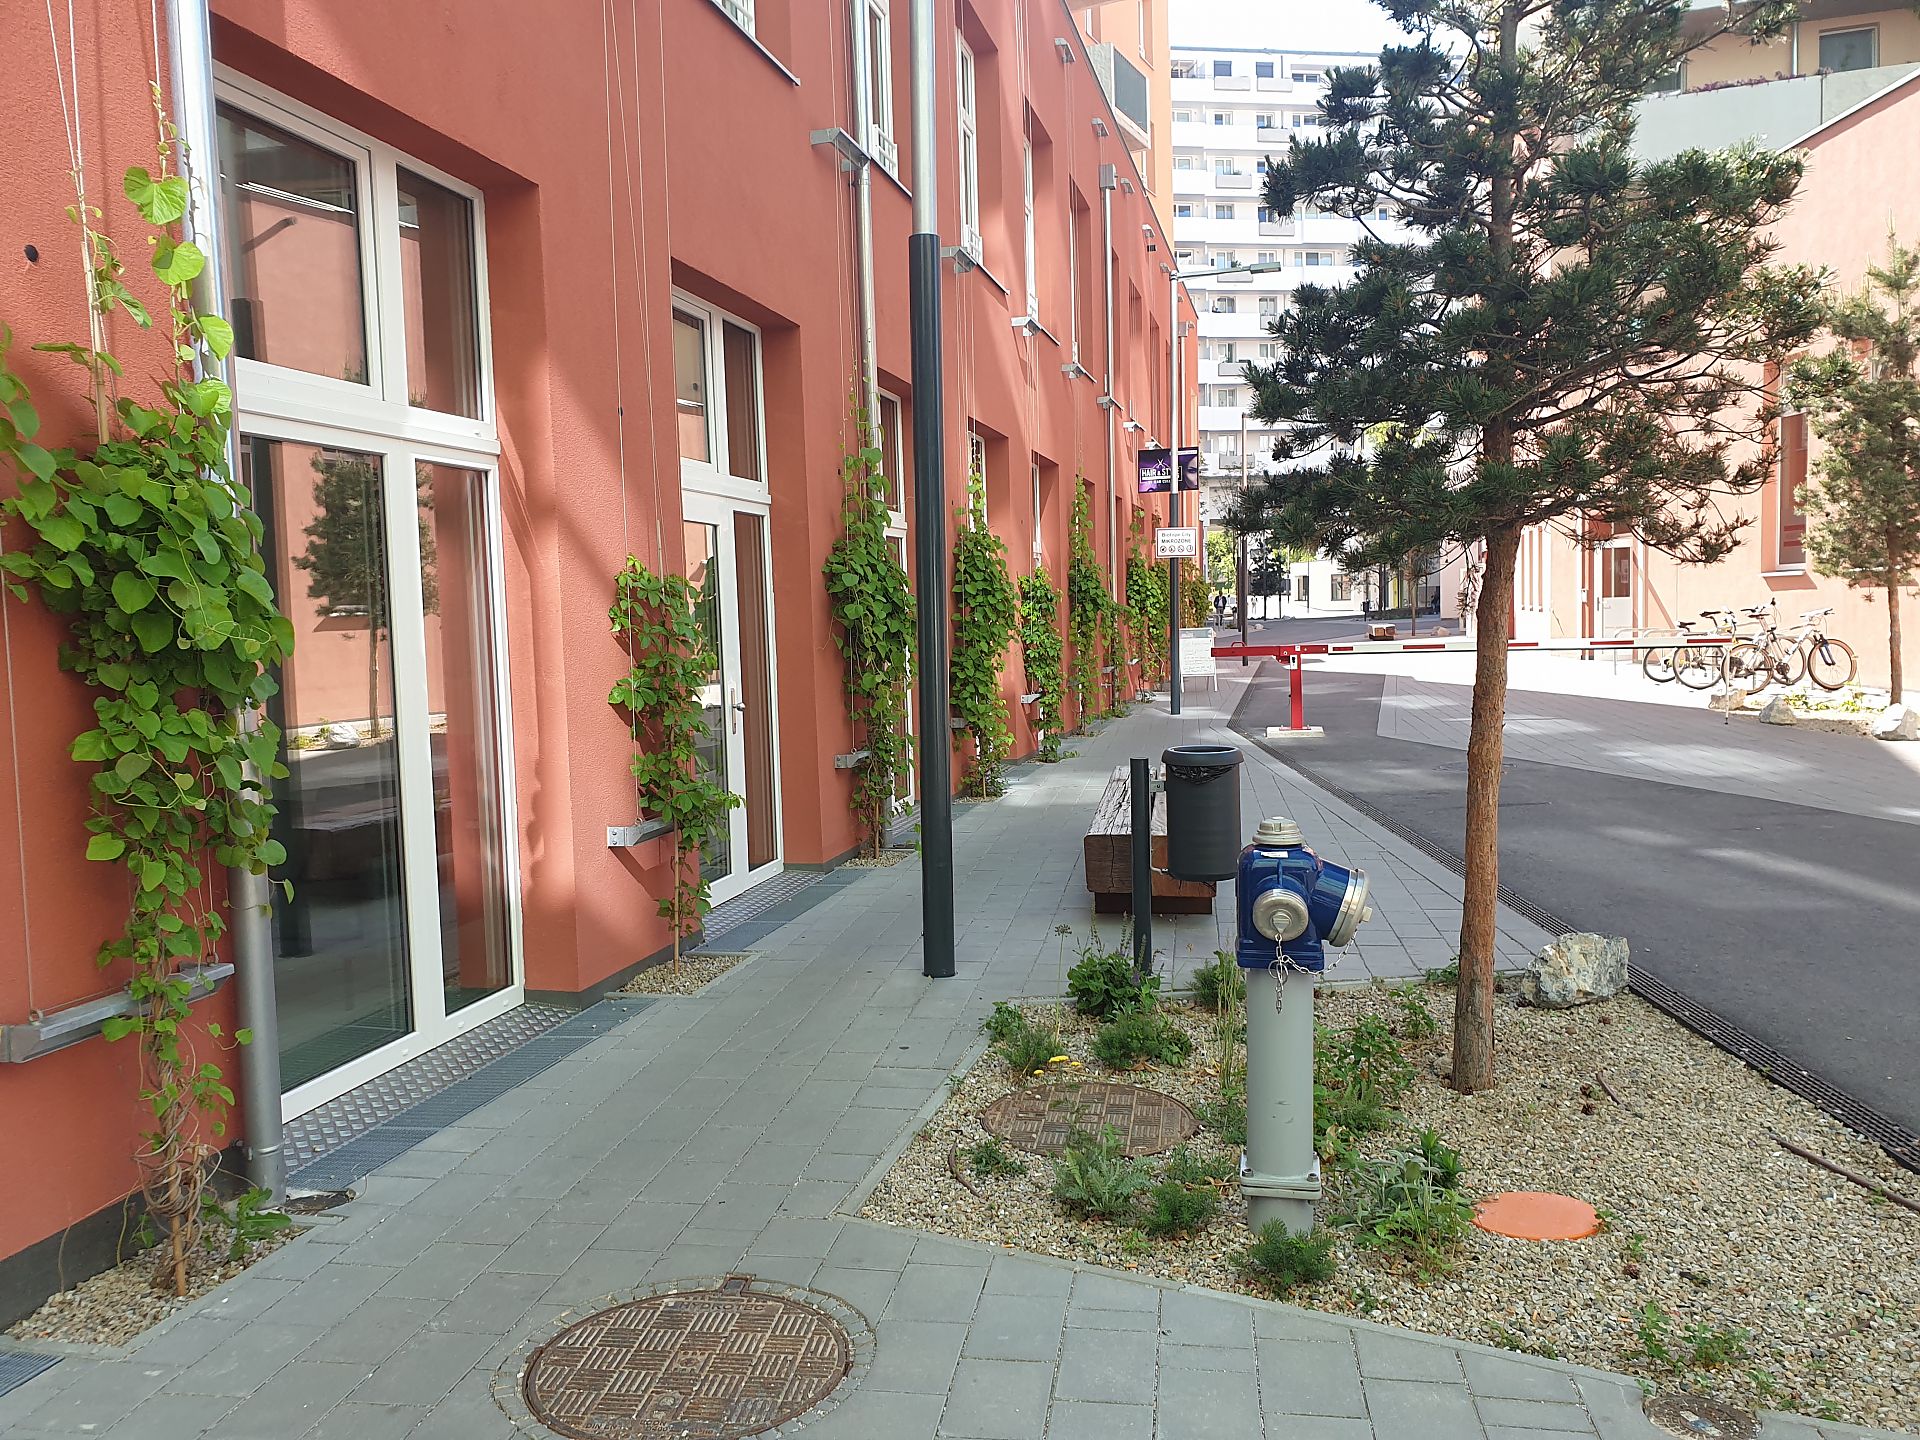
Biotope City Wienerberg Image 3
Gödelgasse as a central public space in the Biotope City Wienerberg with green facades and rainwater management measures to make water available to plants.
Copyright: BOKU ILAP
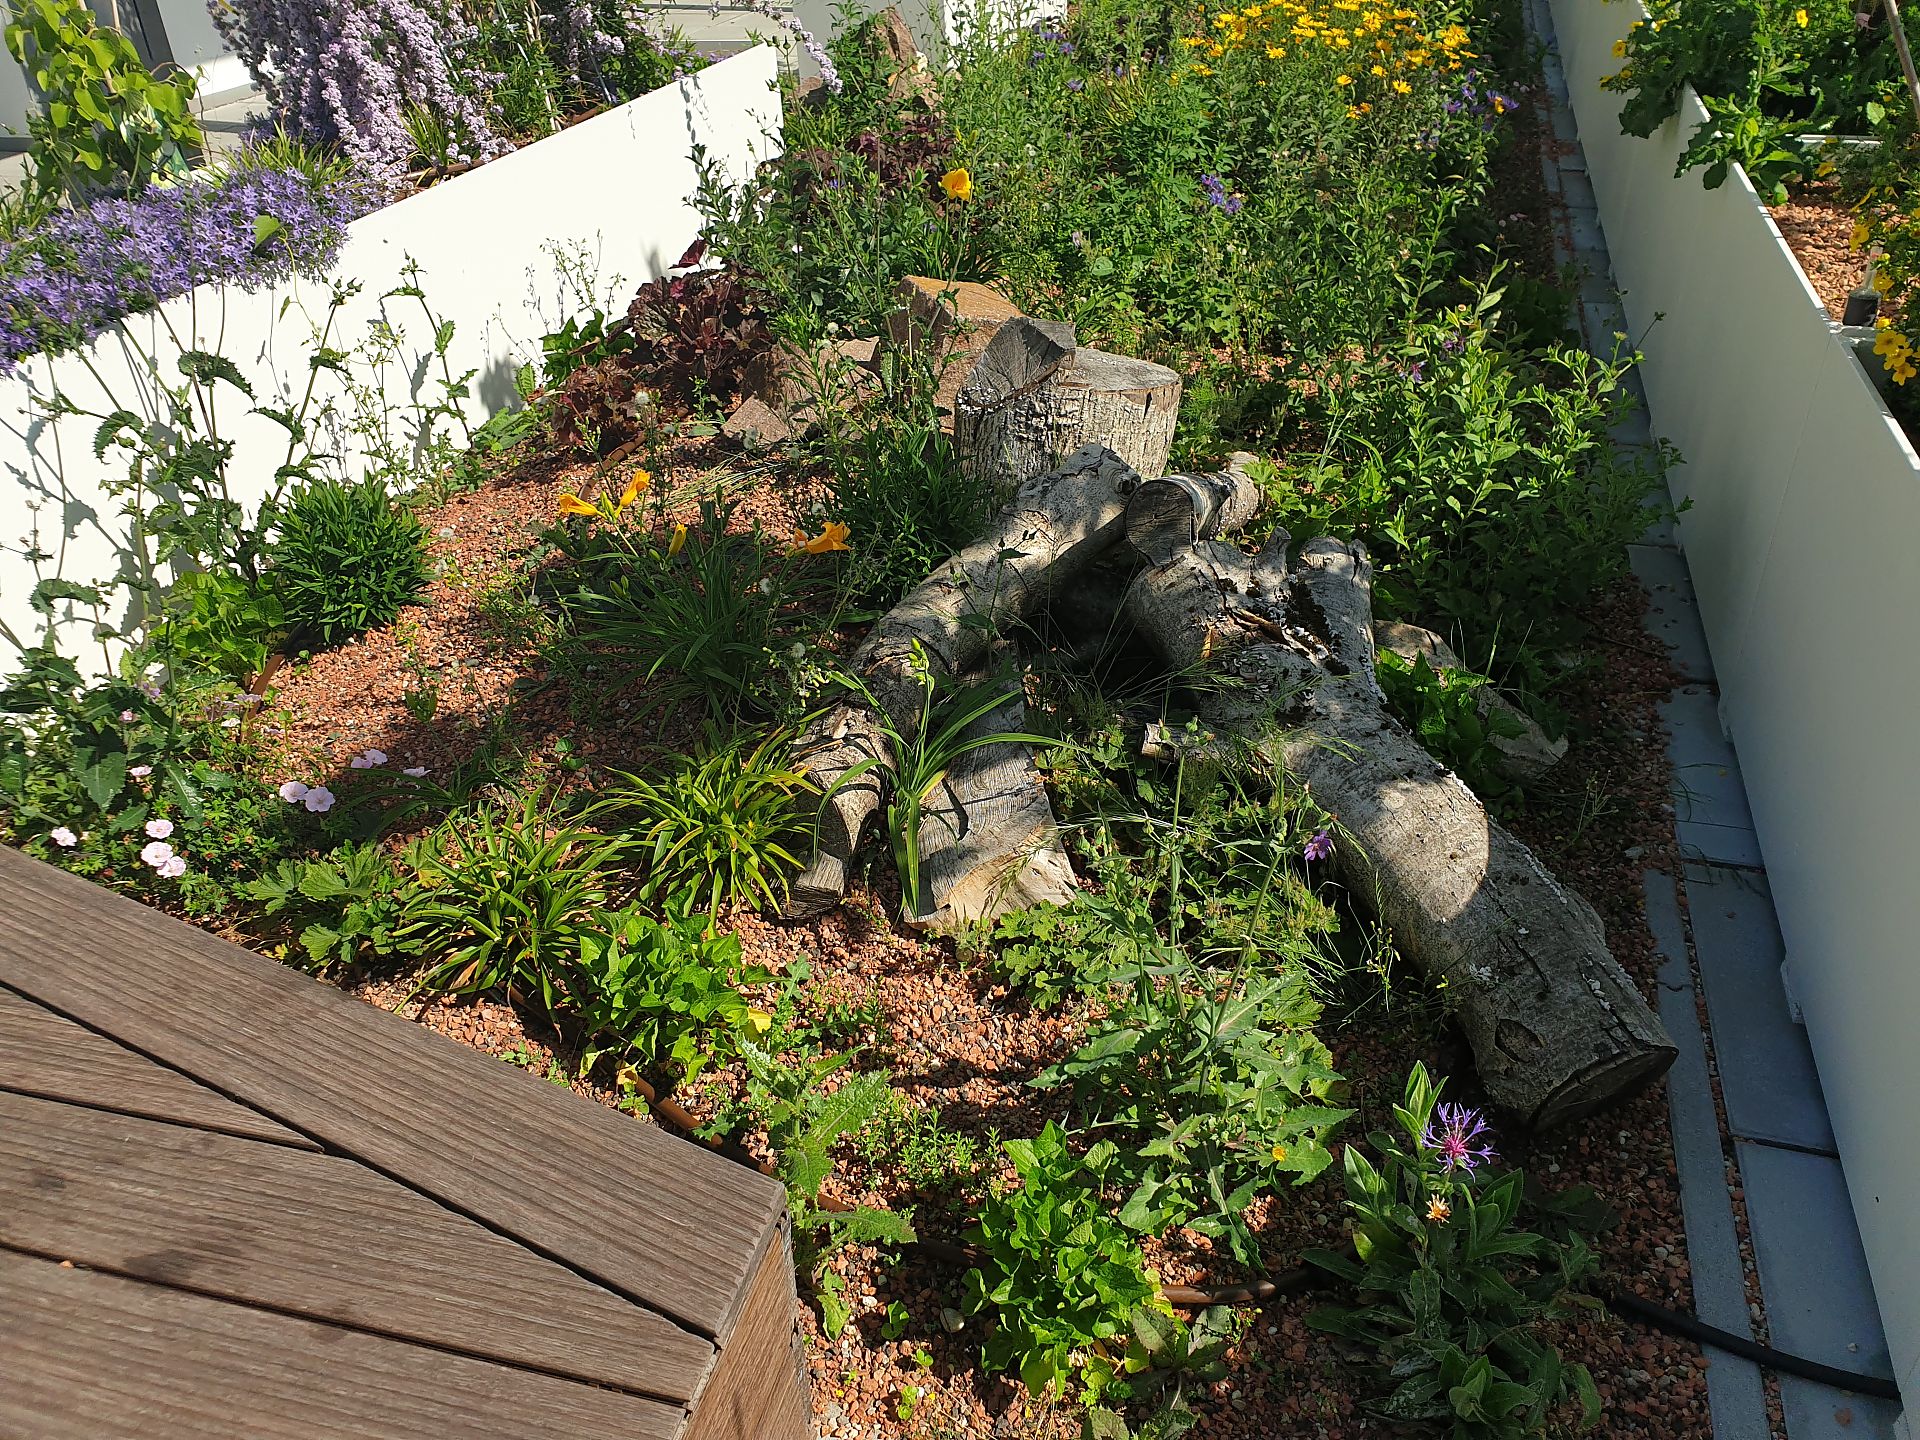
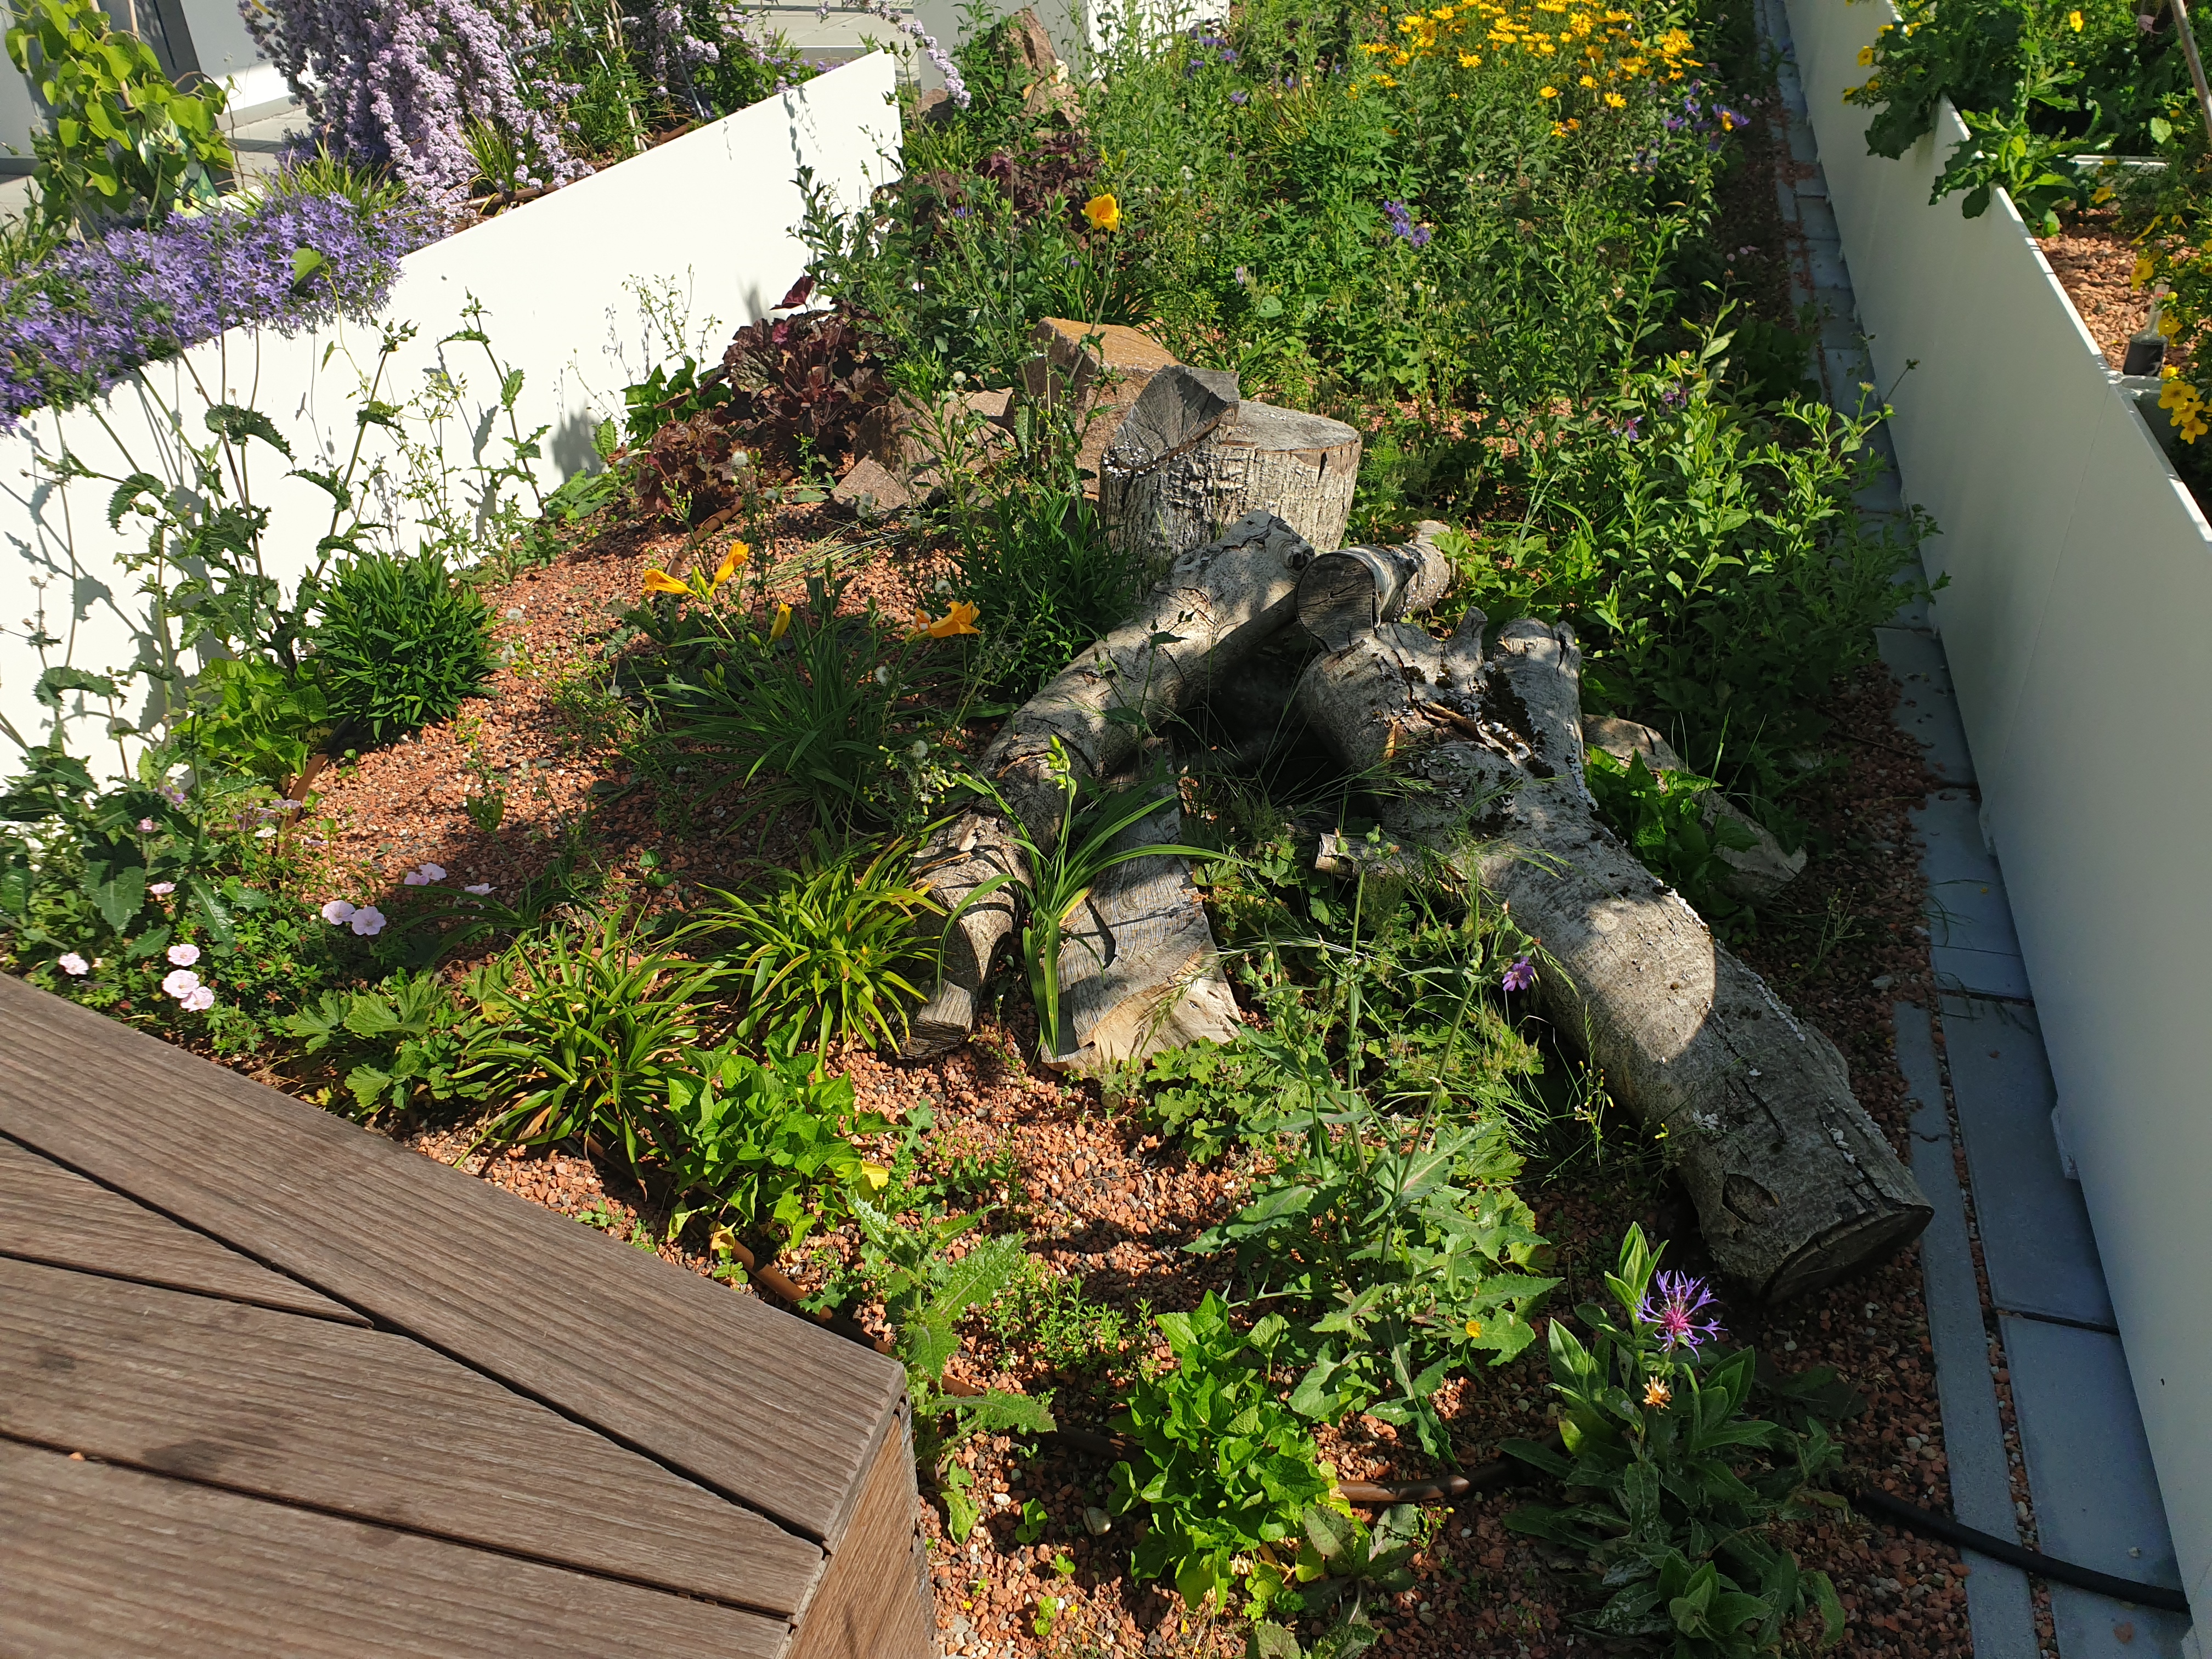
Biotope City Wienerberg Image 4
Creation of diverse habitats for animals through deadwood and rock piles
Copyright: BOKU ILAP
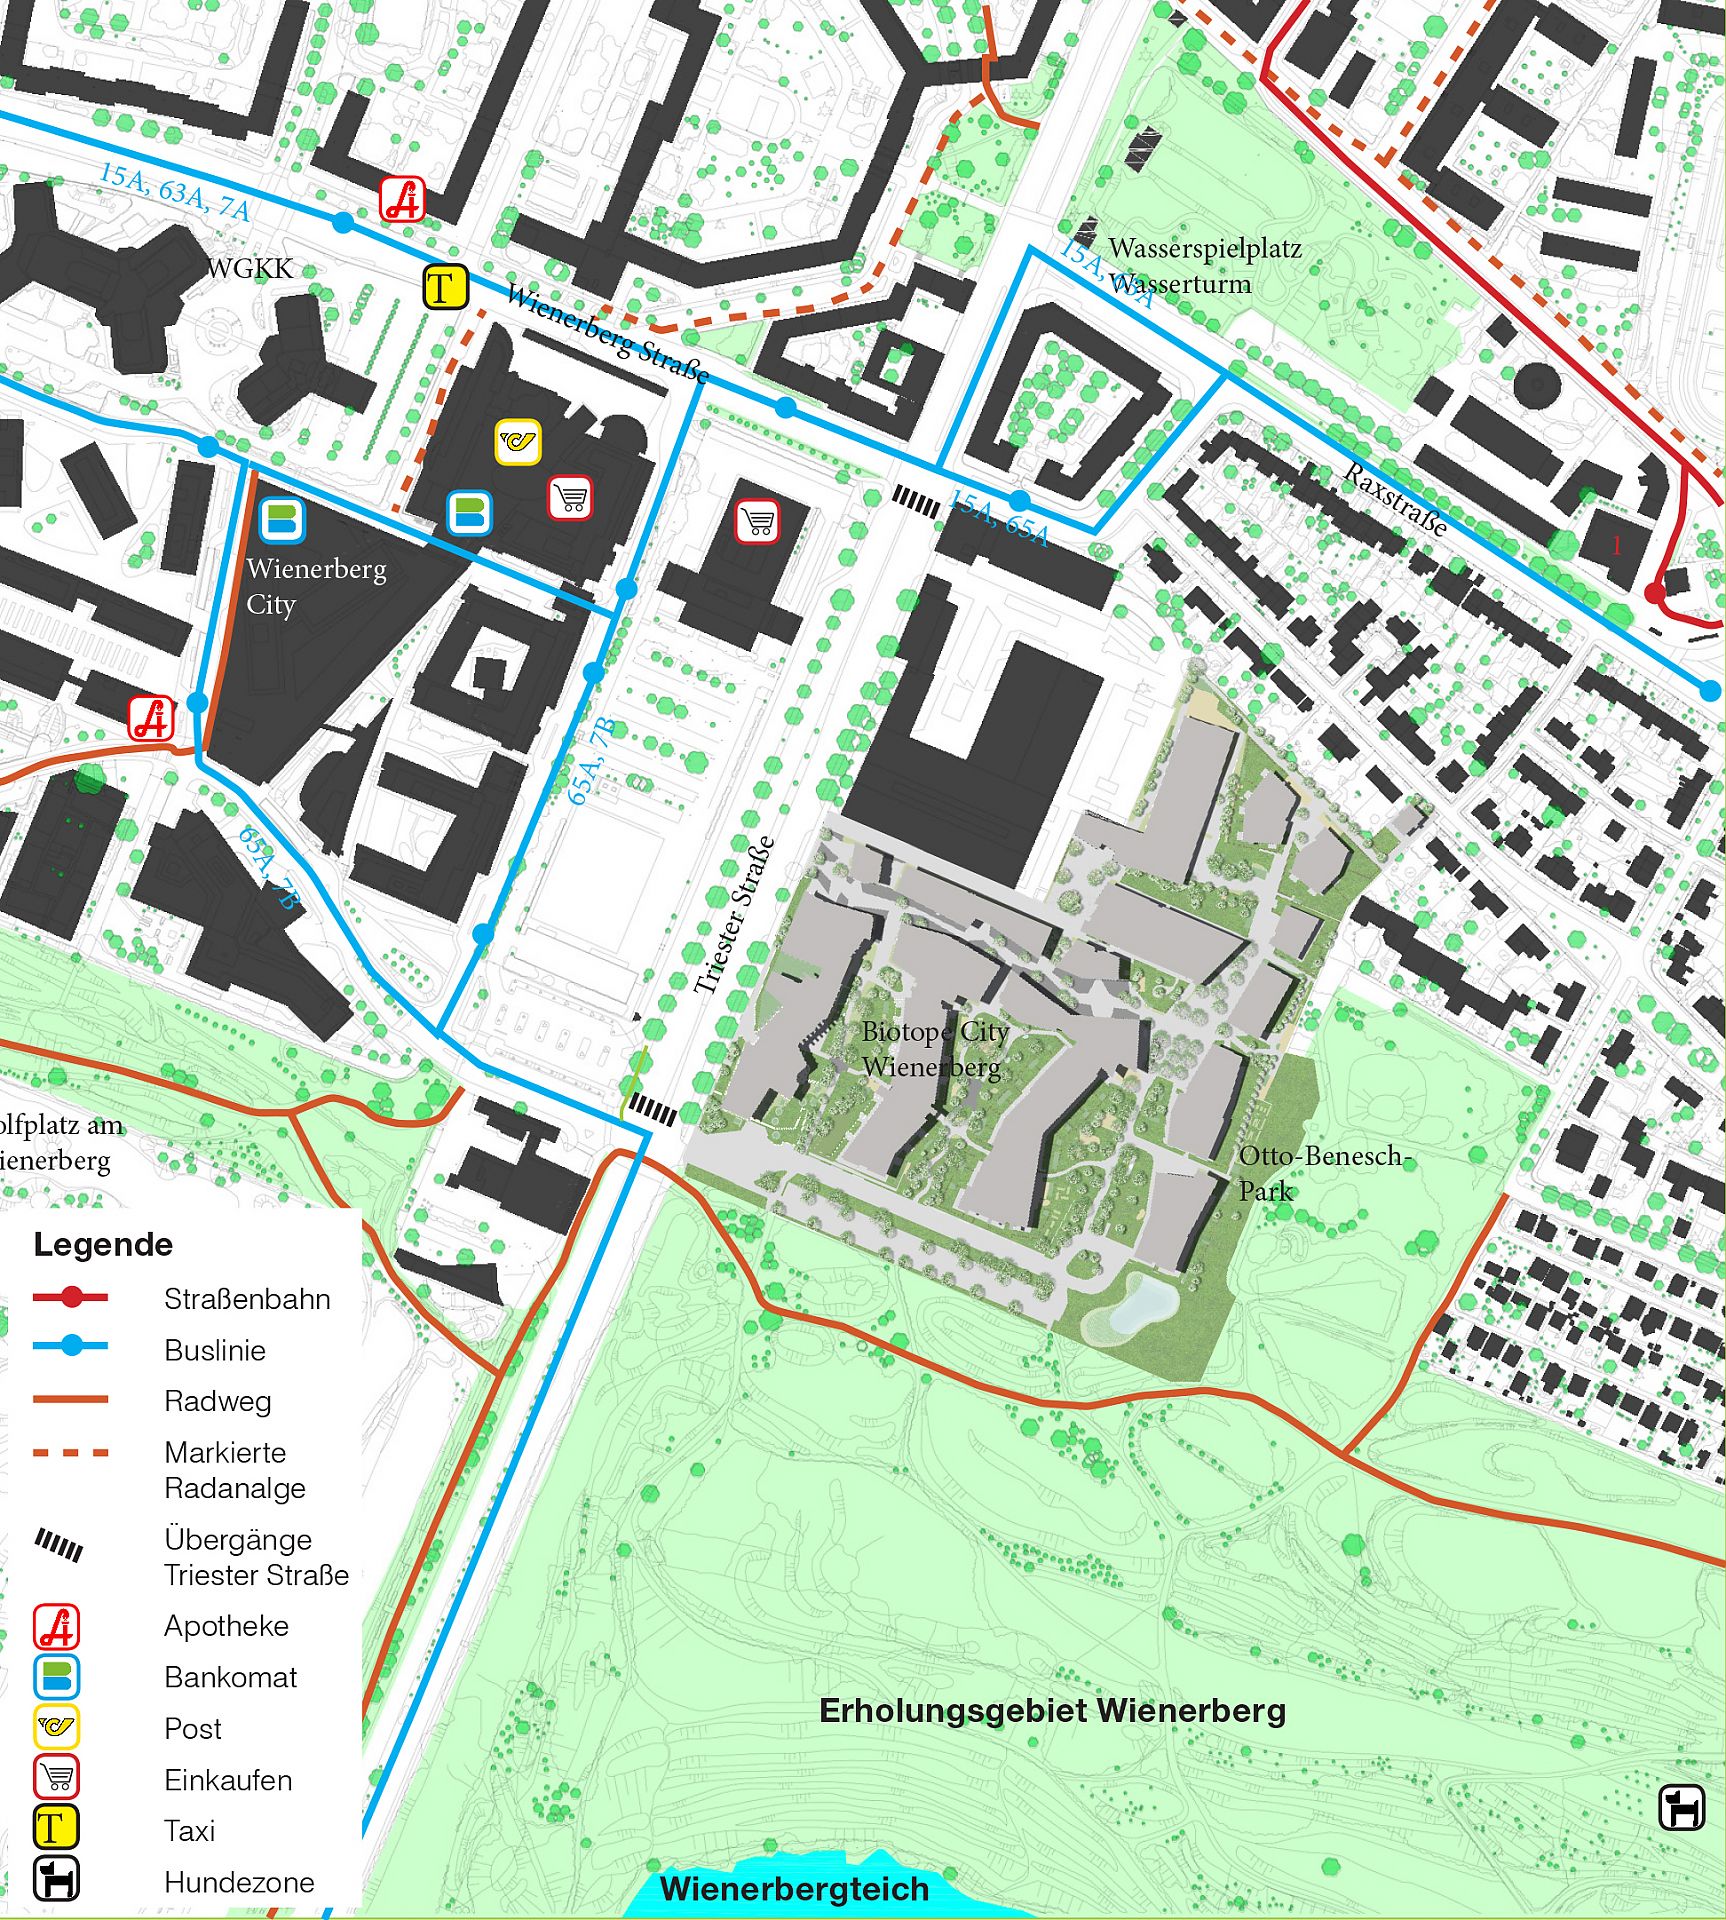
Biotope City Wienerberg Image 5
Overview and urban planning situation of the Biotope City Wienerberg
Copyright: Plangrundlage: Stadt Wien – https://data.wien.gv.at; https://creativecommons.org/licenses/ by/4.0/deed.de; Plangrundlage: Knollconsult Umweltplanung; Masterplan: AUBÖCK + KÁRÁSZ LANDSCAPE ARCHITECTS, Eigene Bearbeitung, BOKU ILAP
Biotope City Wienerberg Image 1
Gardens in the Biotope City Wienerberg
Copyright: BOKU ILAP
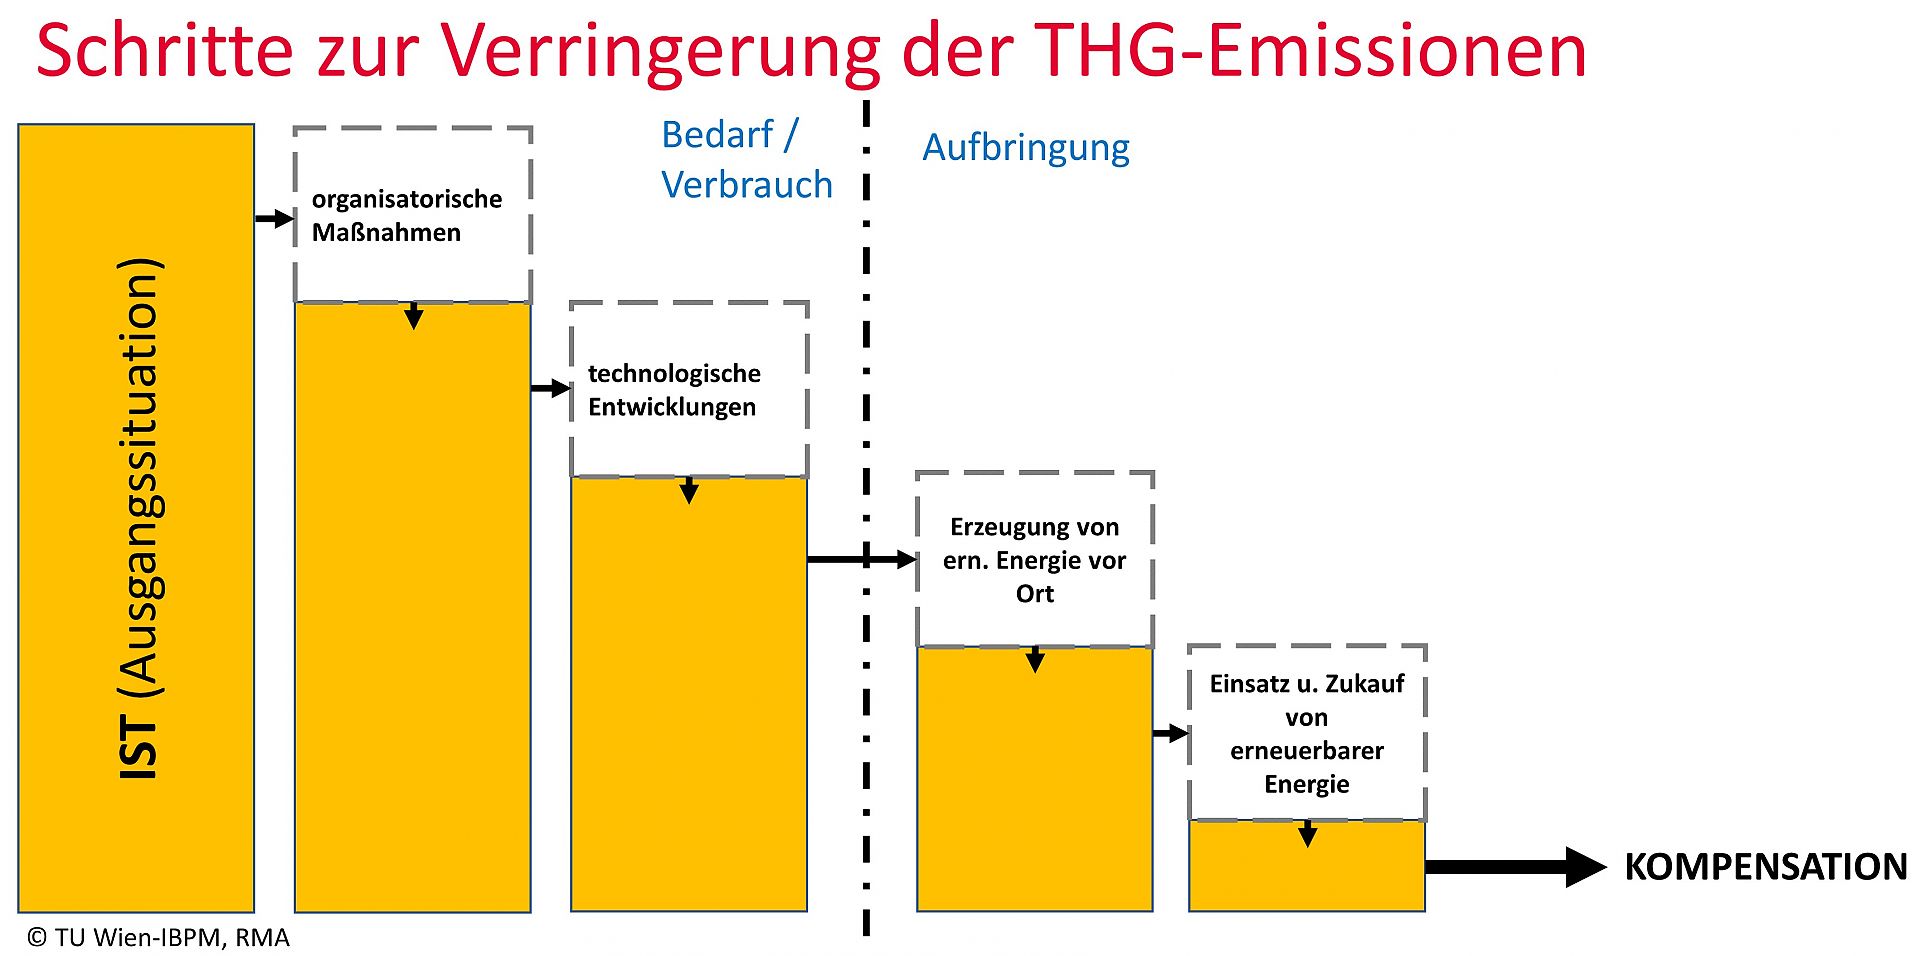
Steps to reduce GHG emissions on construction sites
A number of steps are needed to achieve substantial GHG emission reductions on construction sites. The term "reduction" is used when GHG emissions are reduced by avoiding (energy) demand and consumption on the one hand and by shifting (energy) input from non-renewable energy to renewable energy on the other. The steps to reduce GHG emissions on construction sites are defined in a step-by-step plan. Energy consumption is reduced in the first steps through organisational measures and technological developments. The shift in energy generation can be achieved by generating renewable energy directly on the construction site or by purchasing it. The final step to achieve the goal CO2 neutral construction sites is the CO2-Compenstion. Translated with www.DeepL.com/Translator (free version)
Copyright: TU Wien-IBPM, RMA
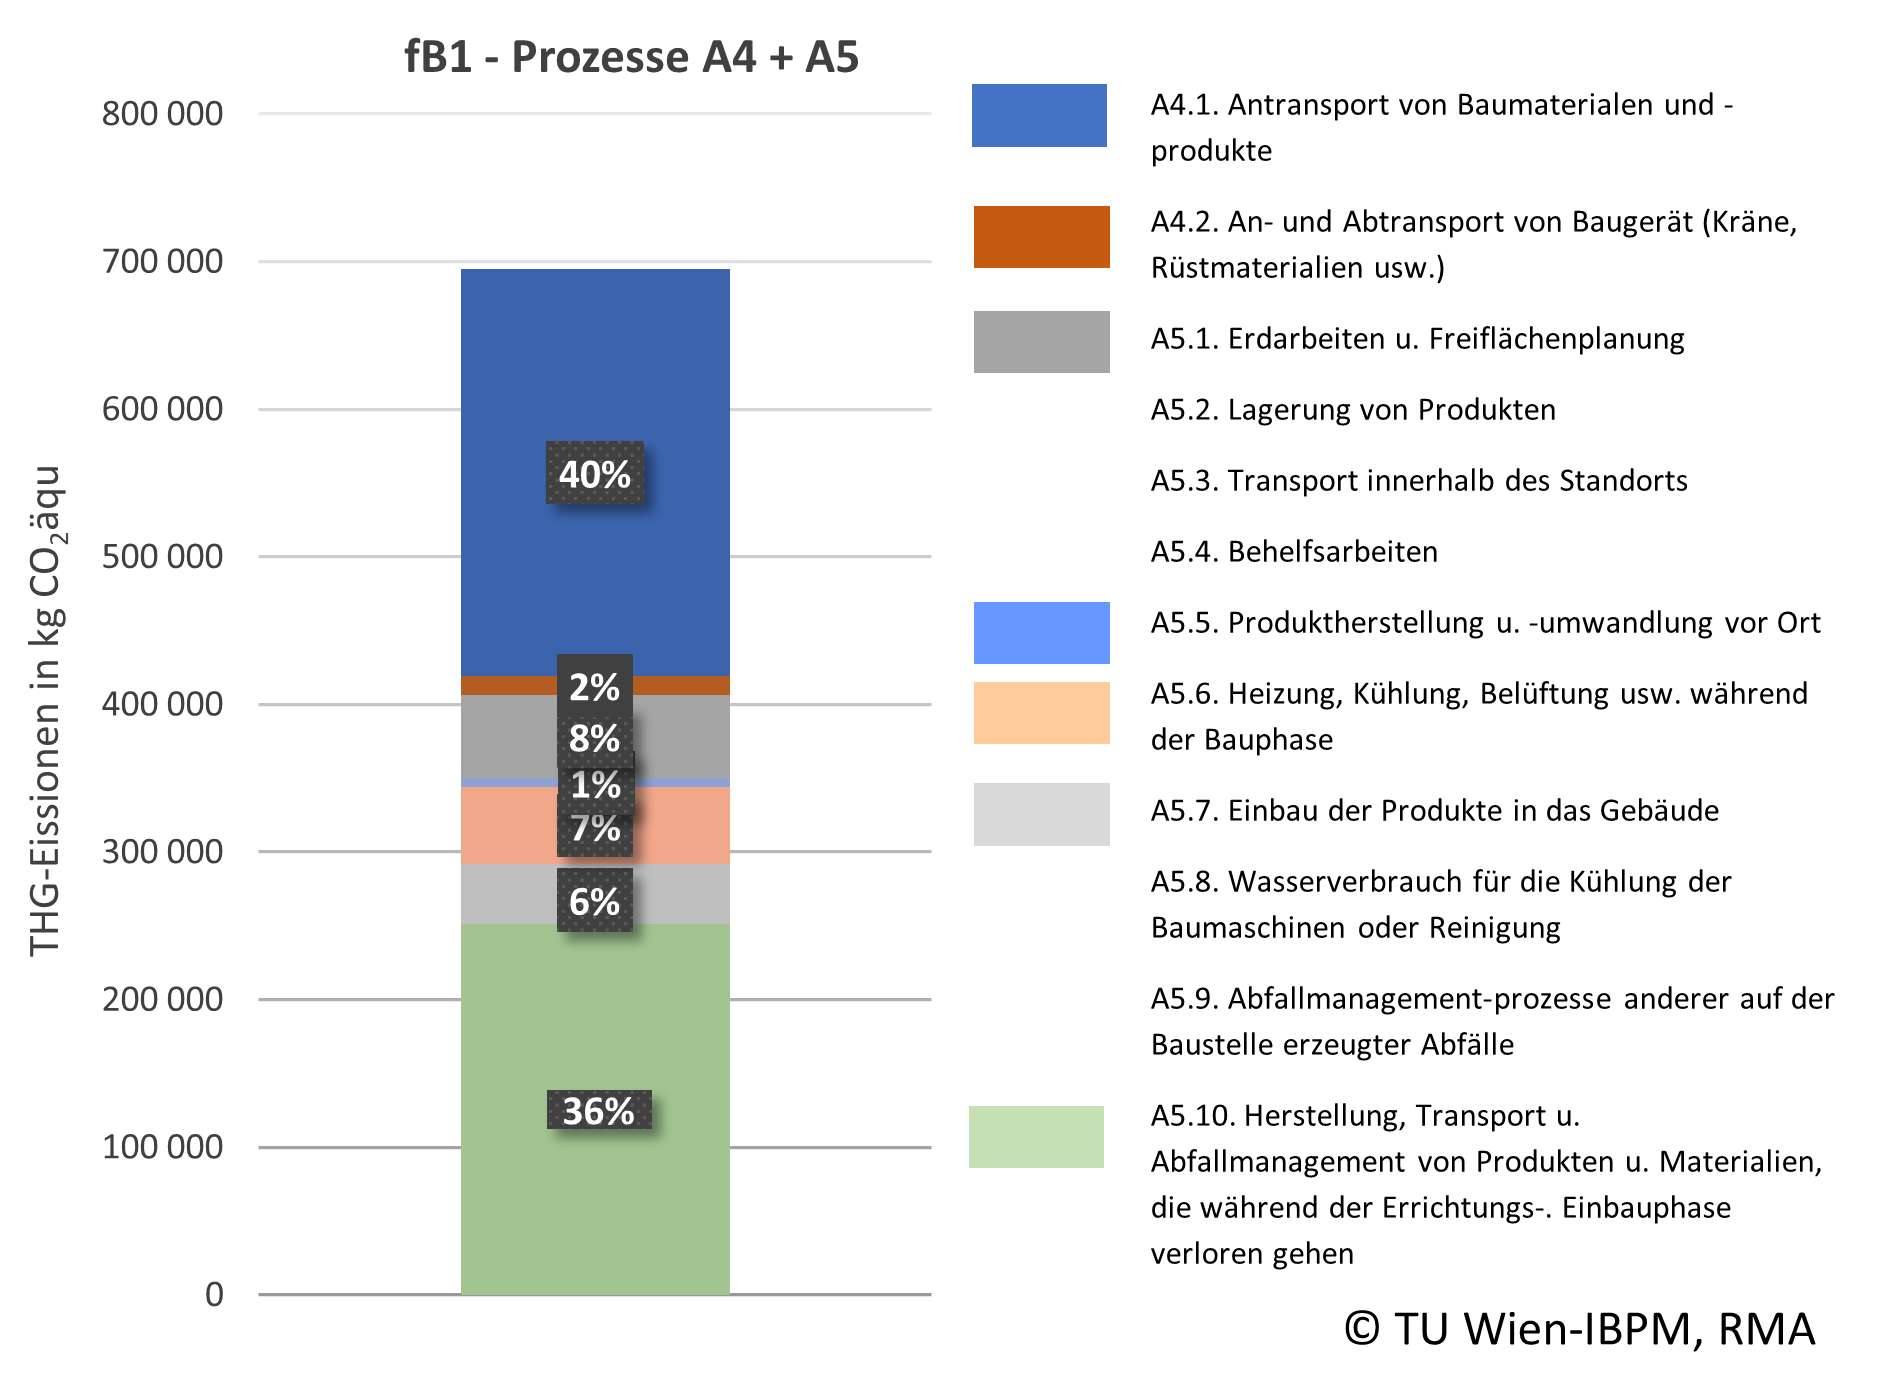
GHG emissions of a Viennese residential building broken down by processes
The GHG emissions of a construction site are illustrated using a fictitious construction site of a Viennese residential building with almost 200 apartments and a gross floor area of 17,000 m². These amount to almost 700,000 kg CO2-eq, of which about 300,000 kg CO2-eq (42 %) are attributable to module A4 "Transportation" and around 400,000 kg CO2-eq (58 %) to module A5 "On-site processes". The allocation of GHG emissions to the individual processes can be seen in the figure. In total, around 77 % of the GHG emissions are transport activities. The calculation values are to be understood as project-specific potentials and have no general validity. Translated with www.DeepL.com/Translator (free version)
Copyright: TU Wien-IBPM, RMA
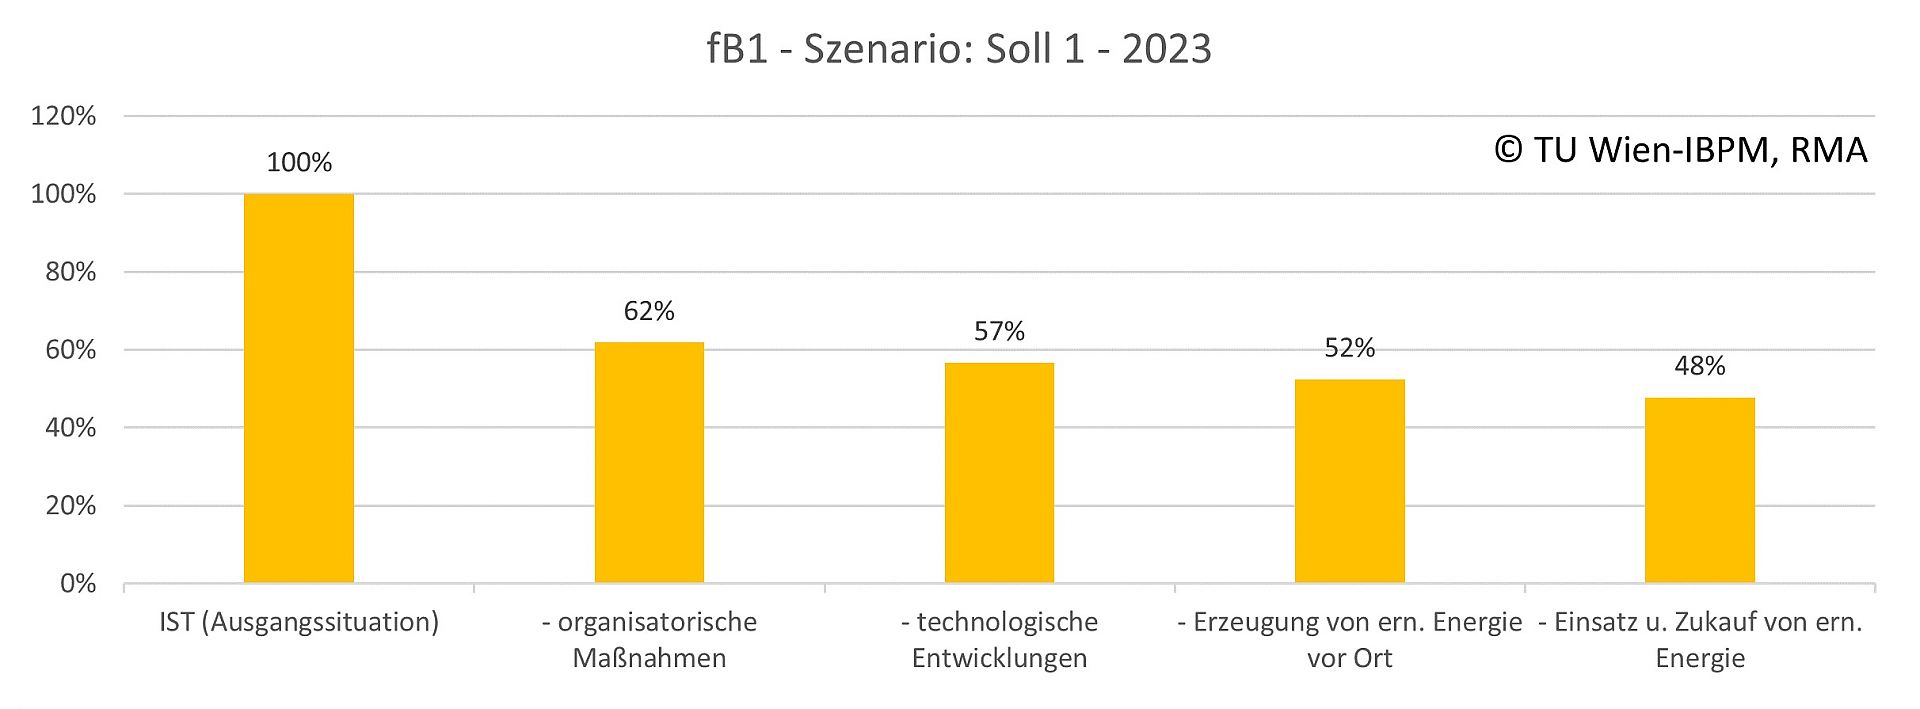
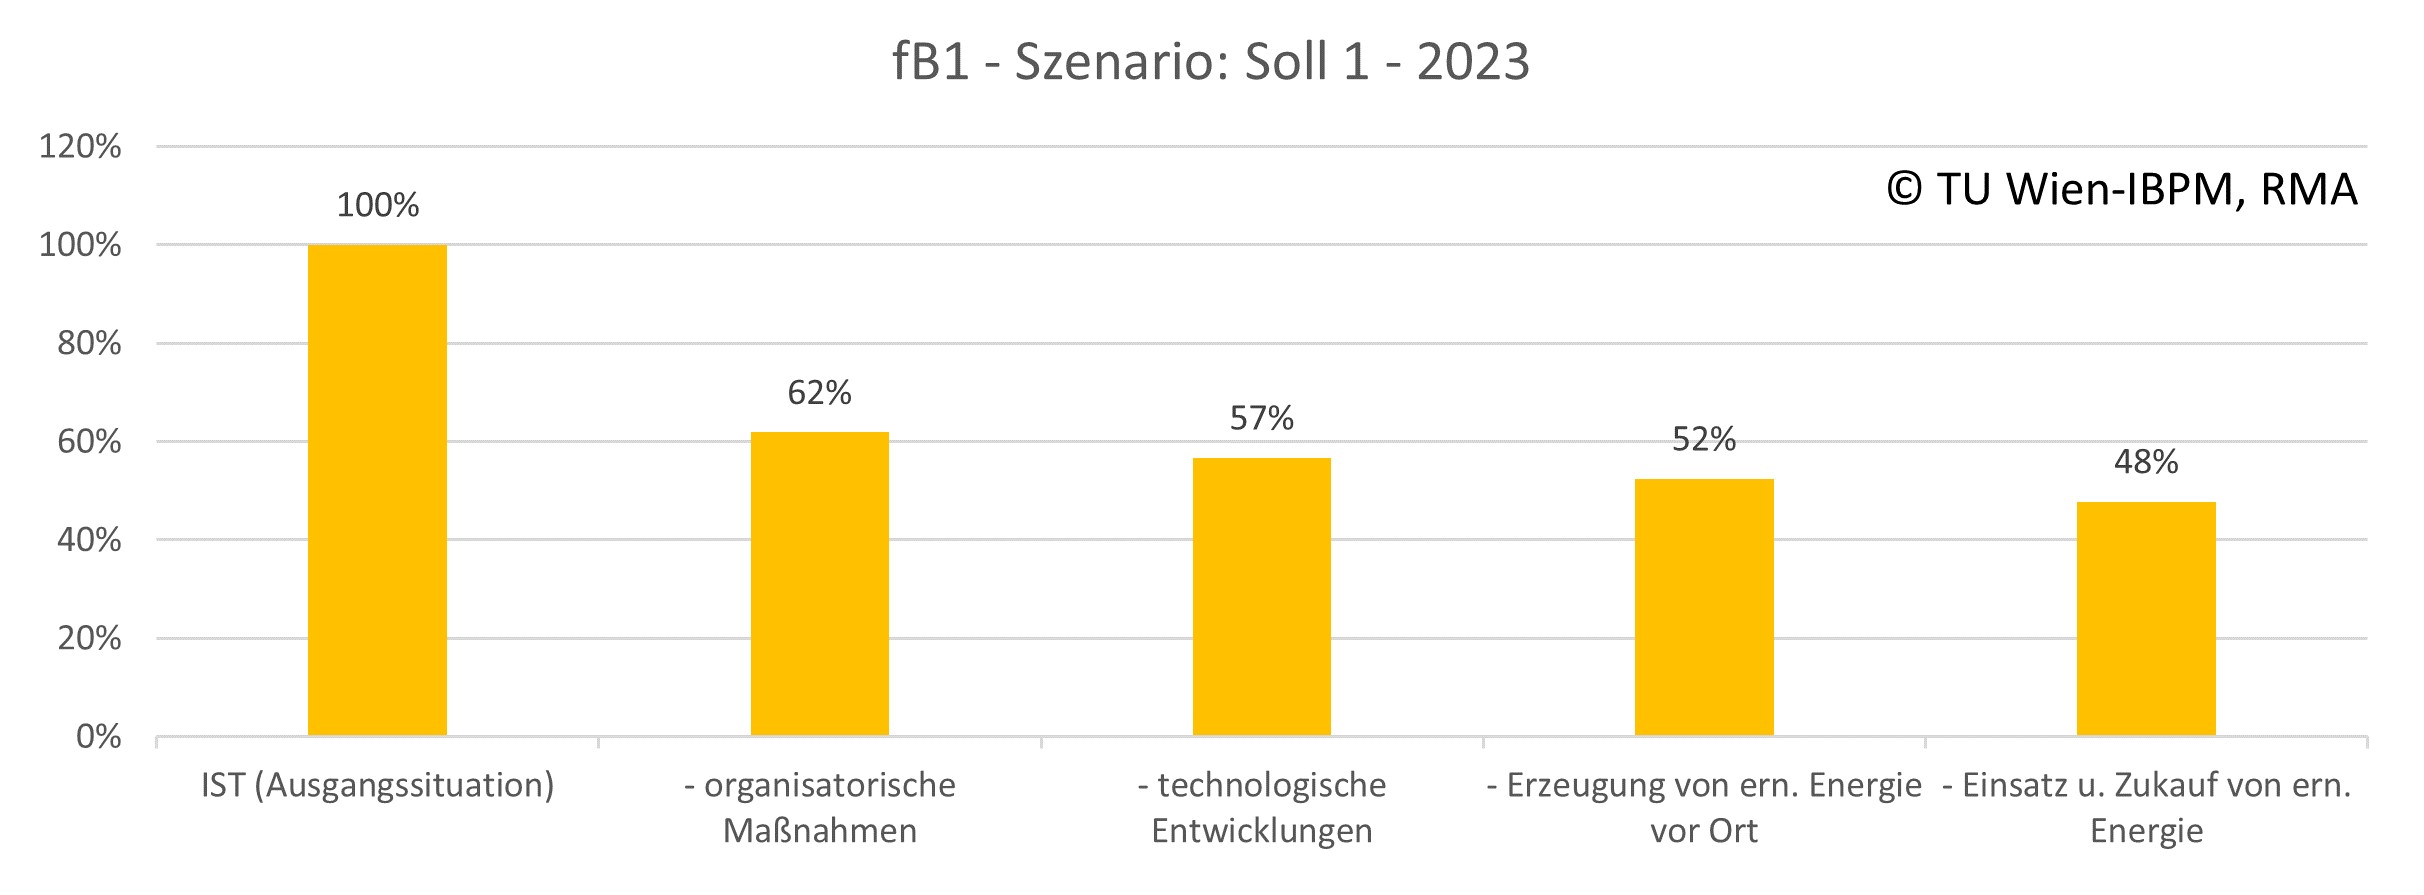
Scenario 2023 for the reduction of GHG emissions for the sample housing construction site in Vienna.
The figure shows the evaluation of a realistic scenario 2023 of the fictitious residential construction site according to the steps to reduce GHG emissions. GHG emissions are reduced by 38 % in the first step "organizational measures". These consist of 36 % points reduction in transport distances and 2 % points savings in processes on the construction site. A further around 5% is saved in the "technological developments" step. GHG emissions are reduced by an additional 5% through "on-site renewable energy (electricity) generation." The remaining electricity demand is covered by UZ46 "Green" electricity. In total, these action steps add up to 48% of the original (ACTUAL) emissions. For these remaining approximately 333 t CO2-eq, at a price of 25 EUR / t CO2-eq, approximately 8,325 EUR would have to be paid in compensation in order to achieve the goal of the "CO2 neutral construction site". The calculation values are to be understood as project-specific potentials and have no general validity. Translated with www.DeepL.com/Translator (free version)
Copyright: TU Wien-IBPM, RMA
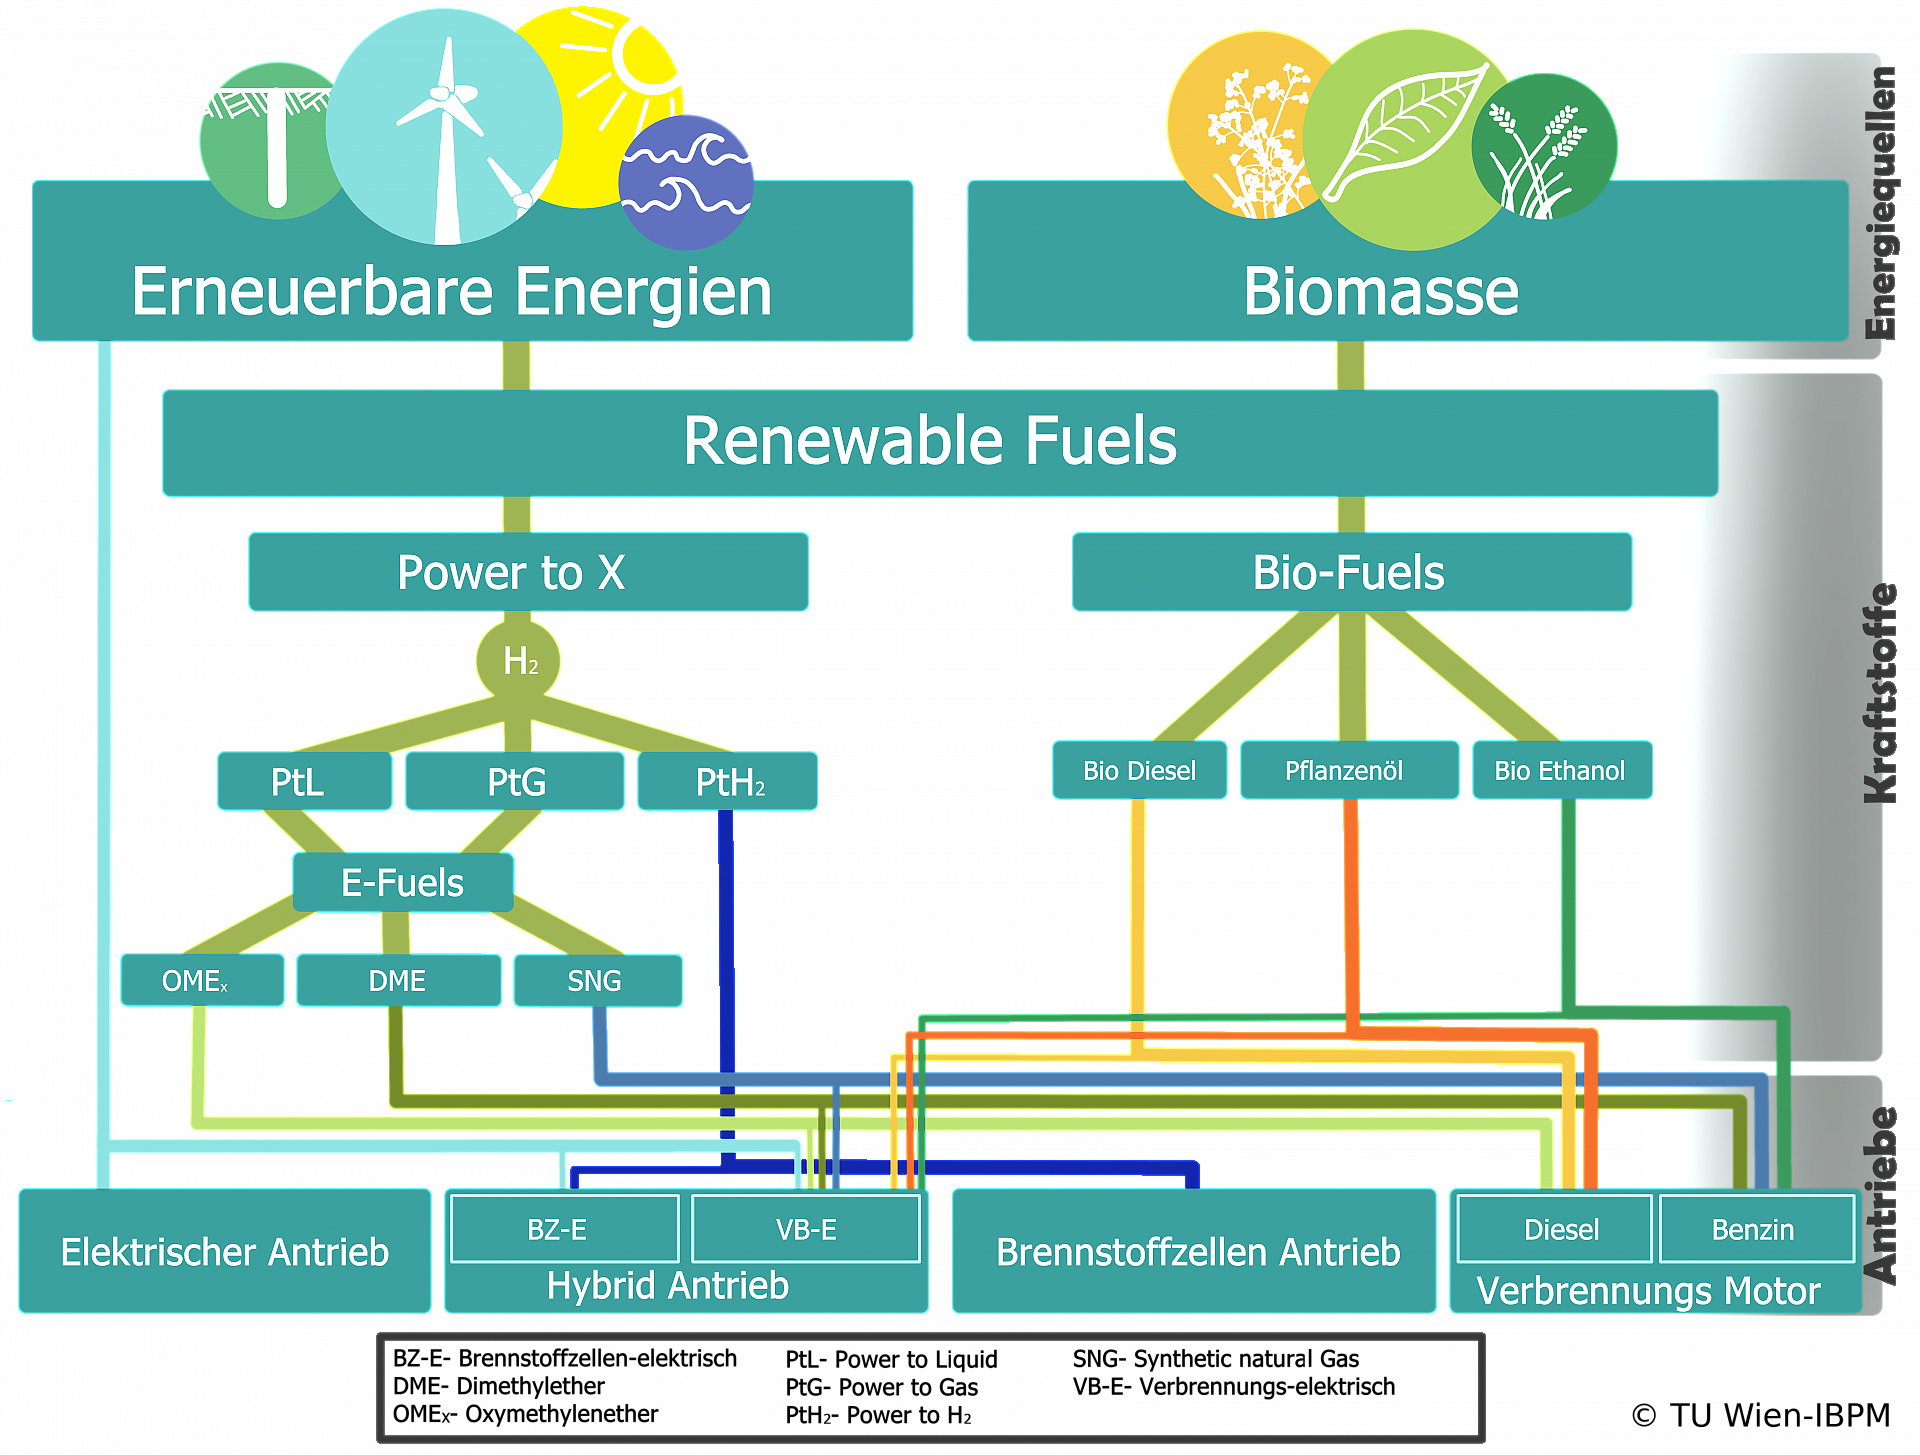
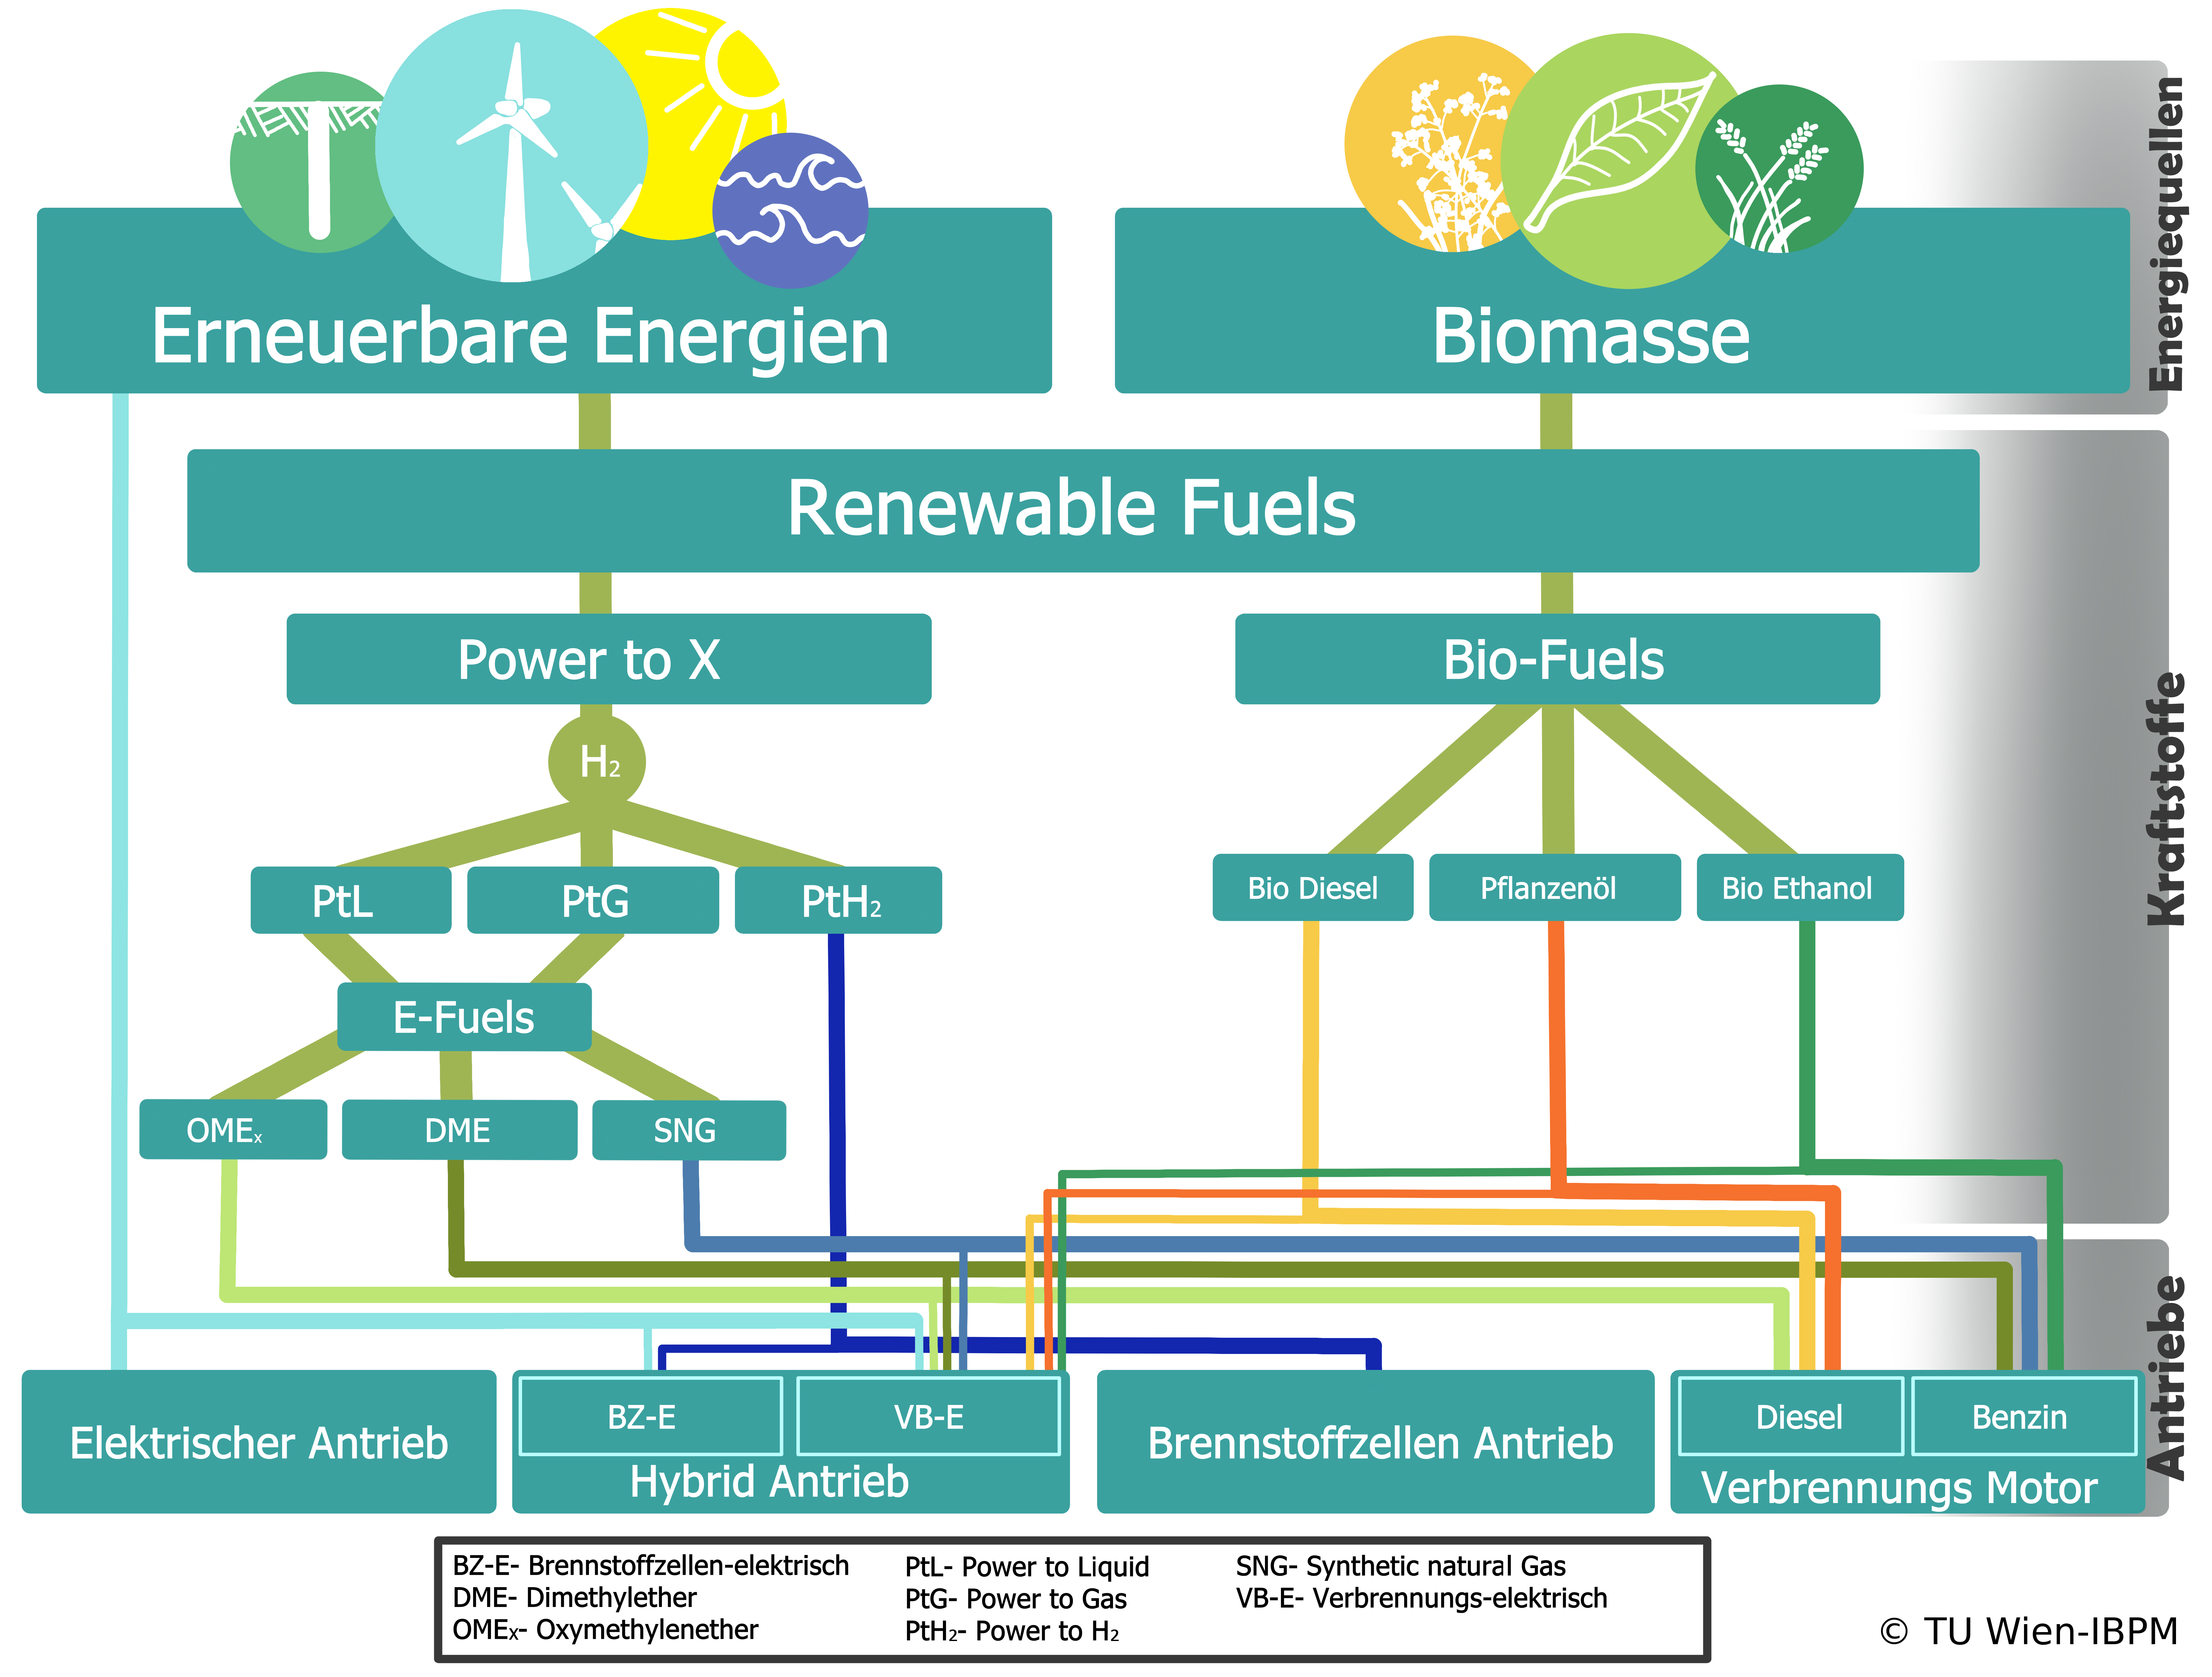
Overview of drive forms for light equipment
Overview of drive forms for light equipment Emissions caused by building machines can be reduced by CO2-neutral drive systems or renewable fuels. The energy source for obtaining or producing renewable fuels can come from (natural) renewable energy sources, for example by generating electricity from wind, solar radiation or hydropower, or can be obtained directly from biomass. These biomass-derived bio-fuels power internal combustion engines. Some of them can be used directly in conventional combustion engines - in this case, diesel engines. Others, for example ethanol, require a dedicated or modified engine. The CO2 savings for bio-fuels range from 80 to 90% in the literature. Sustainably generated electricity can be used to power vehicles or machines with electric drives, either directly via cables or with rechargeable batteries. The other renewable fuel option is hydrocarbons or hydrogen (H2) produced with electrical energy. These processes are grouped under "Power to X". Translated with www.DeepL.com/Translator (free version)