Project Image Pool
There are 23 results.
Terms of use: The pictures on this site originate from the projects in the frame of the programmes City of Tomorrow, Building of Tomorrow and the IEA Research Cooperation. They may be used credited for non-commercial purposes under the Creative Commons License Attribution-NonCommercial (CC BY-NC).
Gruppenfoto IETS Task 21 Consortium Meeting in Graz
On April 9, 2024, a full-day meeting of IETS Task 21 took place in Graz. The meeting provided a valuable platform for exchanging insights and planning further steps for the successful implementation of the tasks within Task 21.
Copyright: Gahleitner
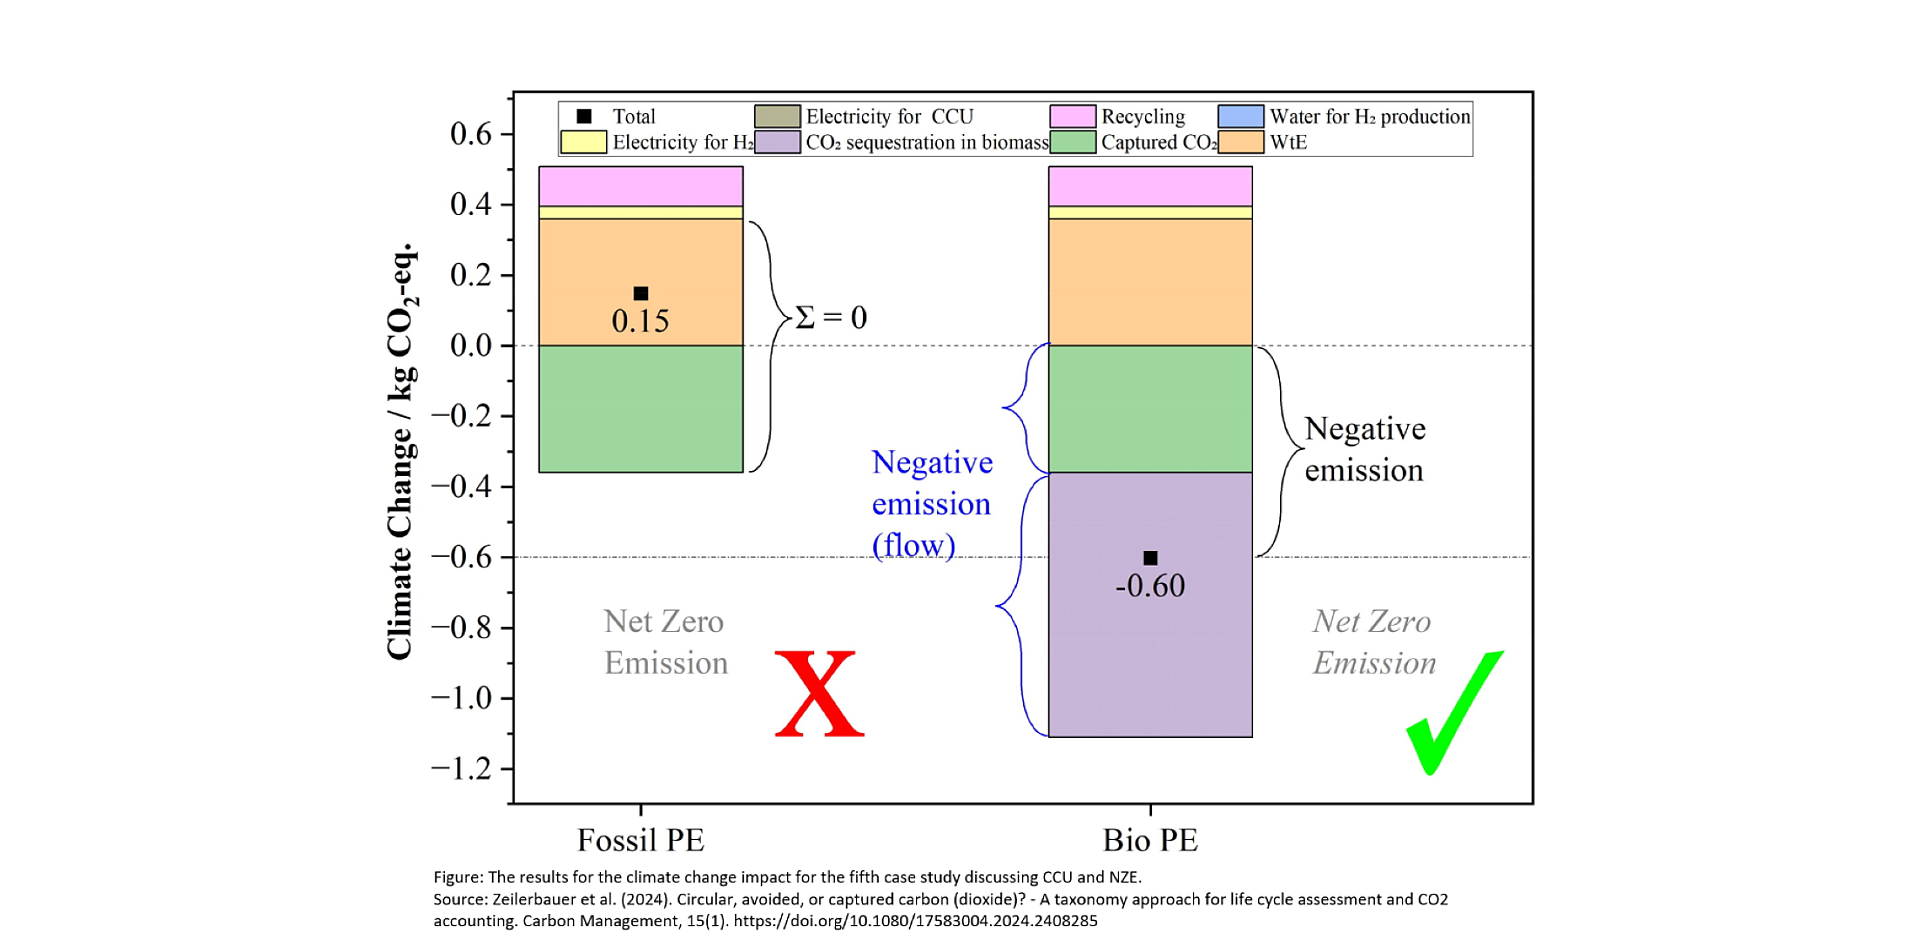
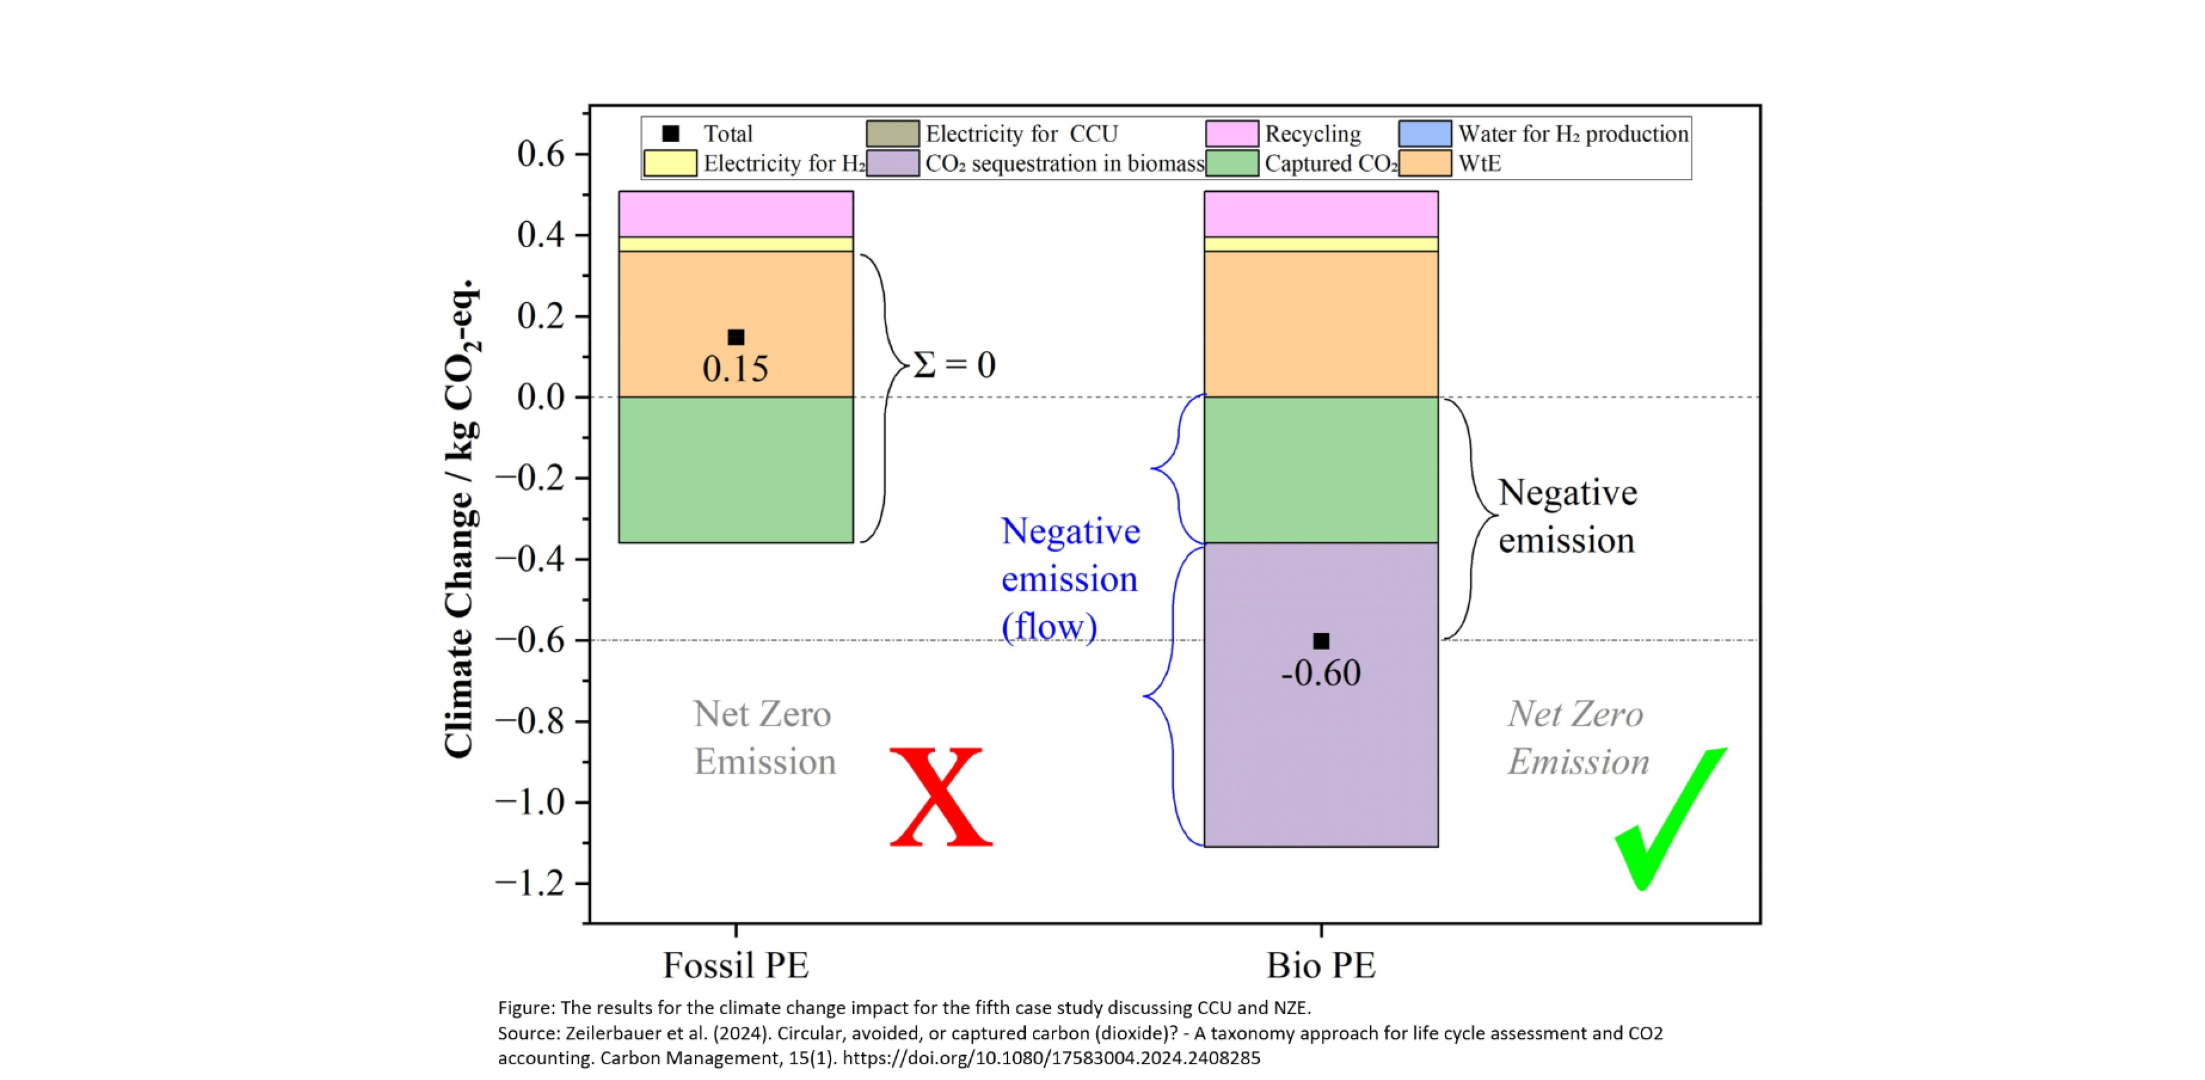
Graphic illustration of different terms from Zeilerbauer et al. (2024)
Figure from Zeilerbauer et al. (2024) (https://doi.org/10.1080/17583004.2024.2408285), which uses a use case to discuss different terms from the area of Circular Carbon.
Copyright: Zeilerbauer et al. (2024)
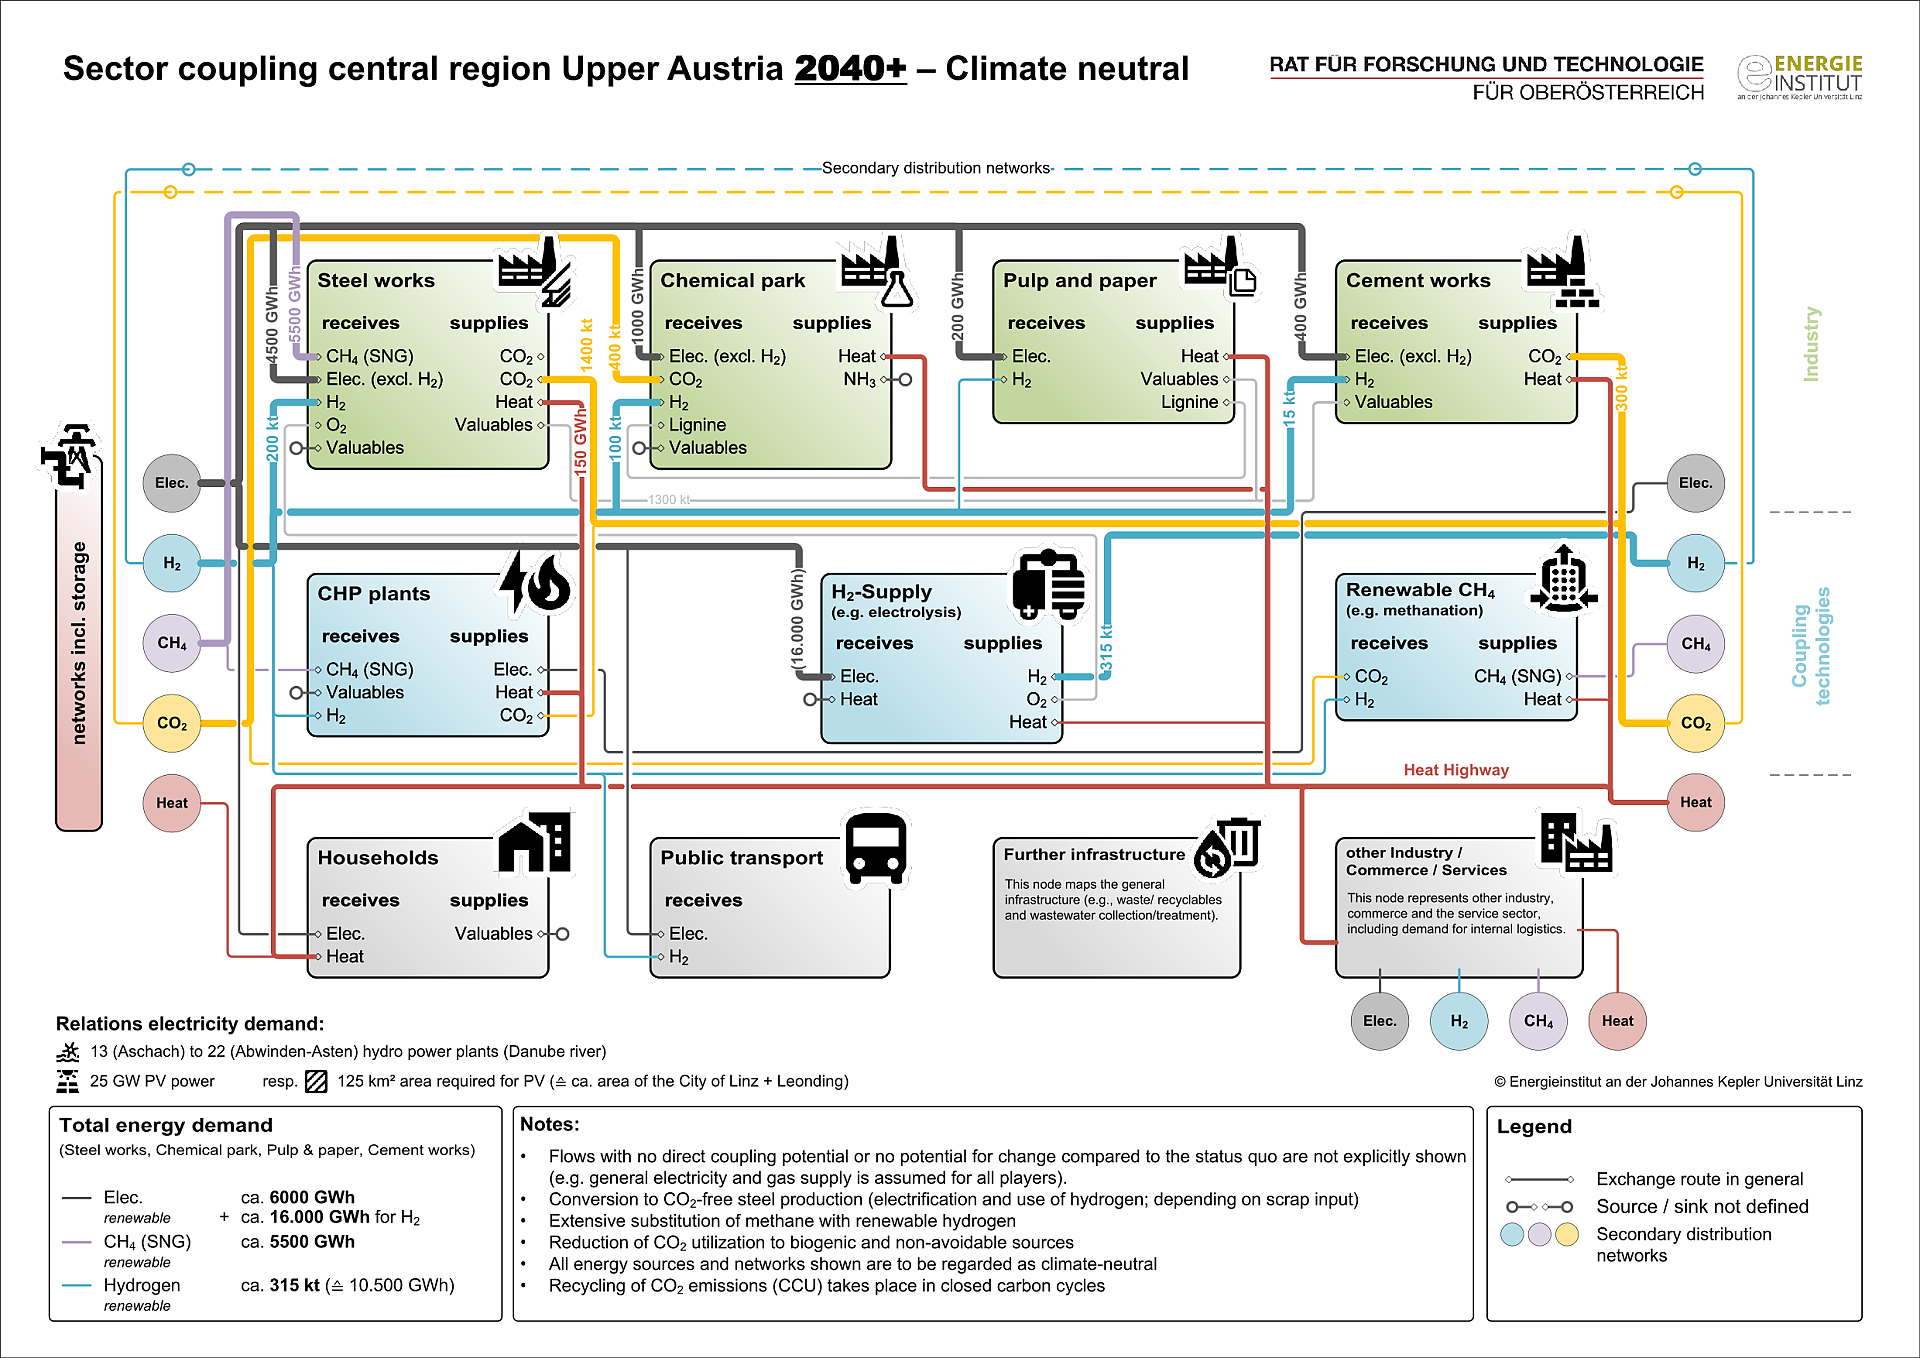
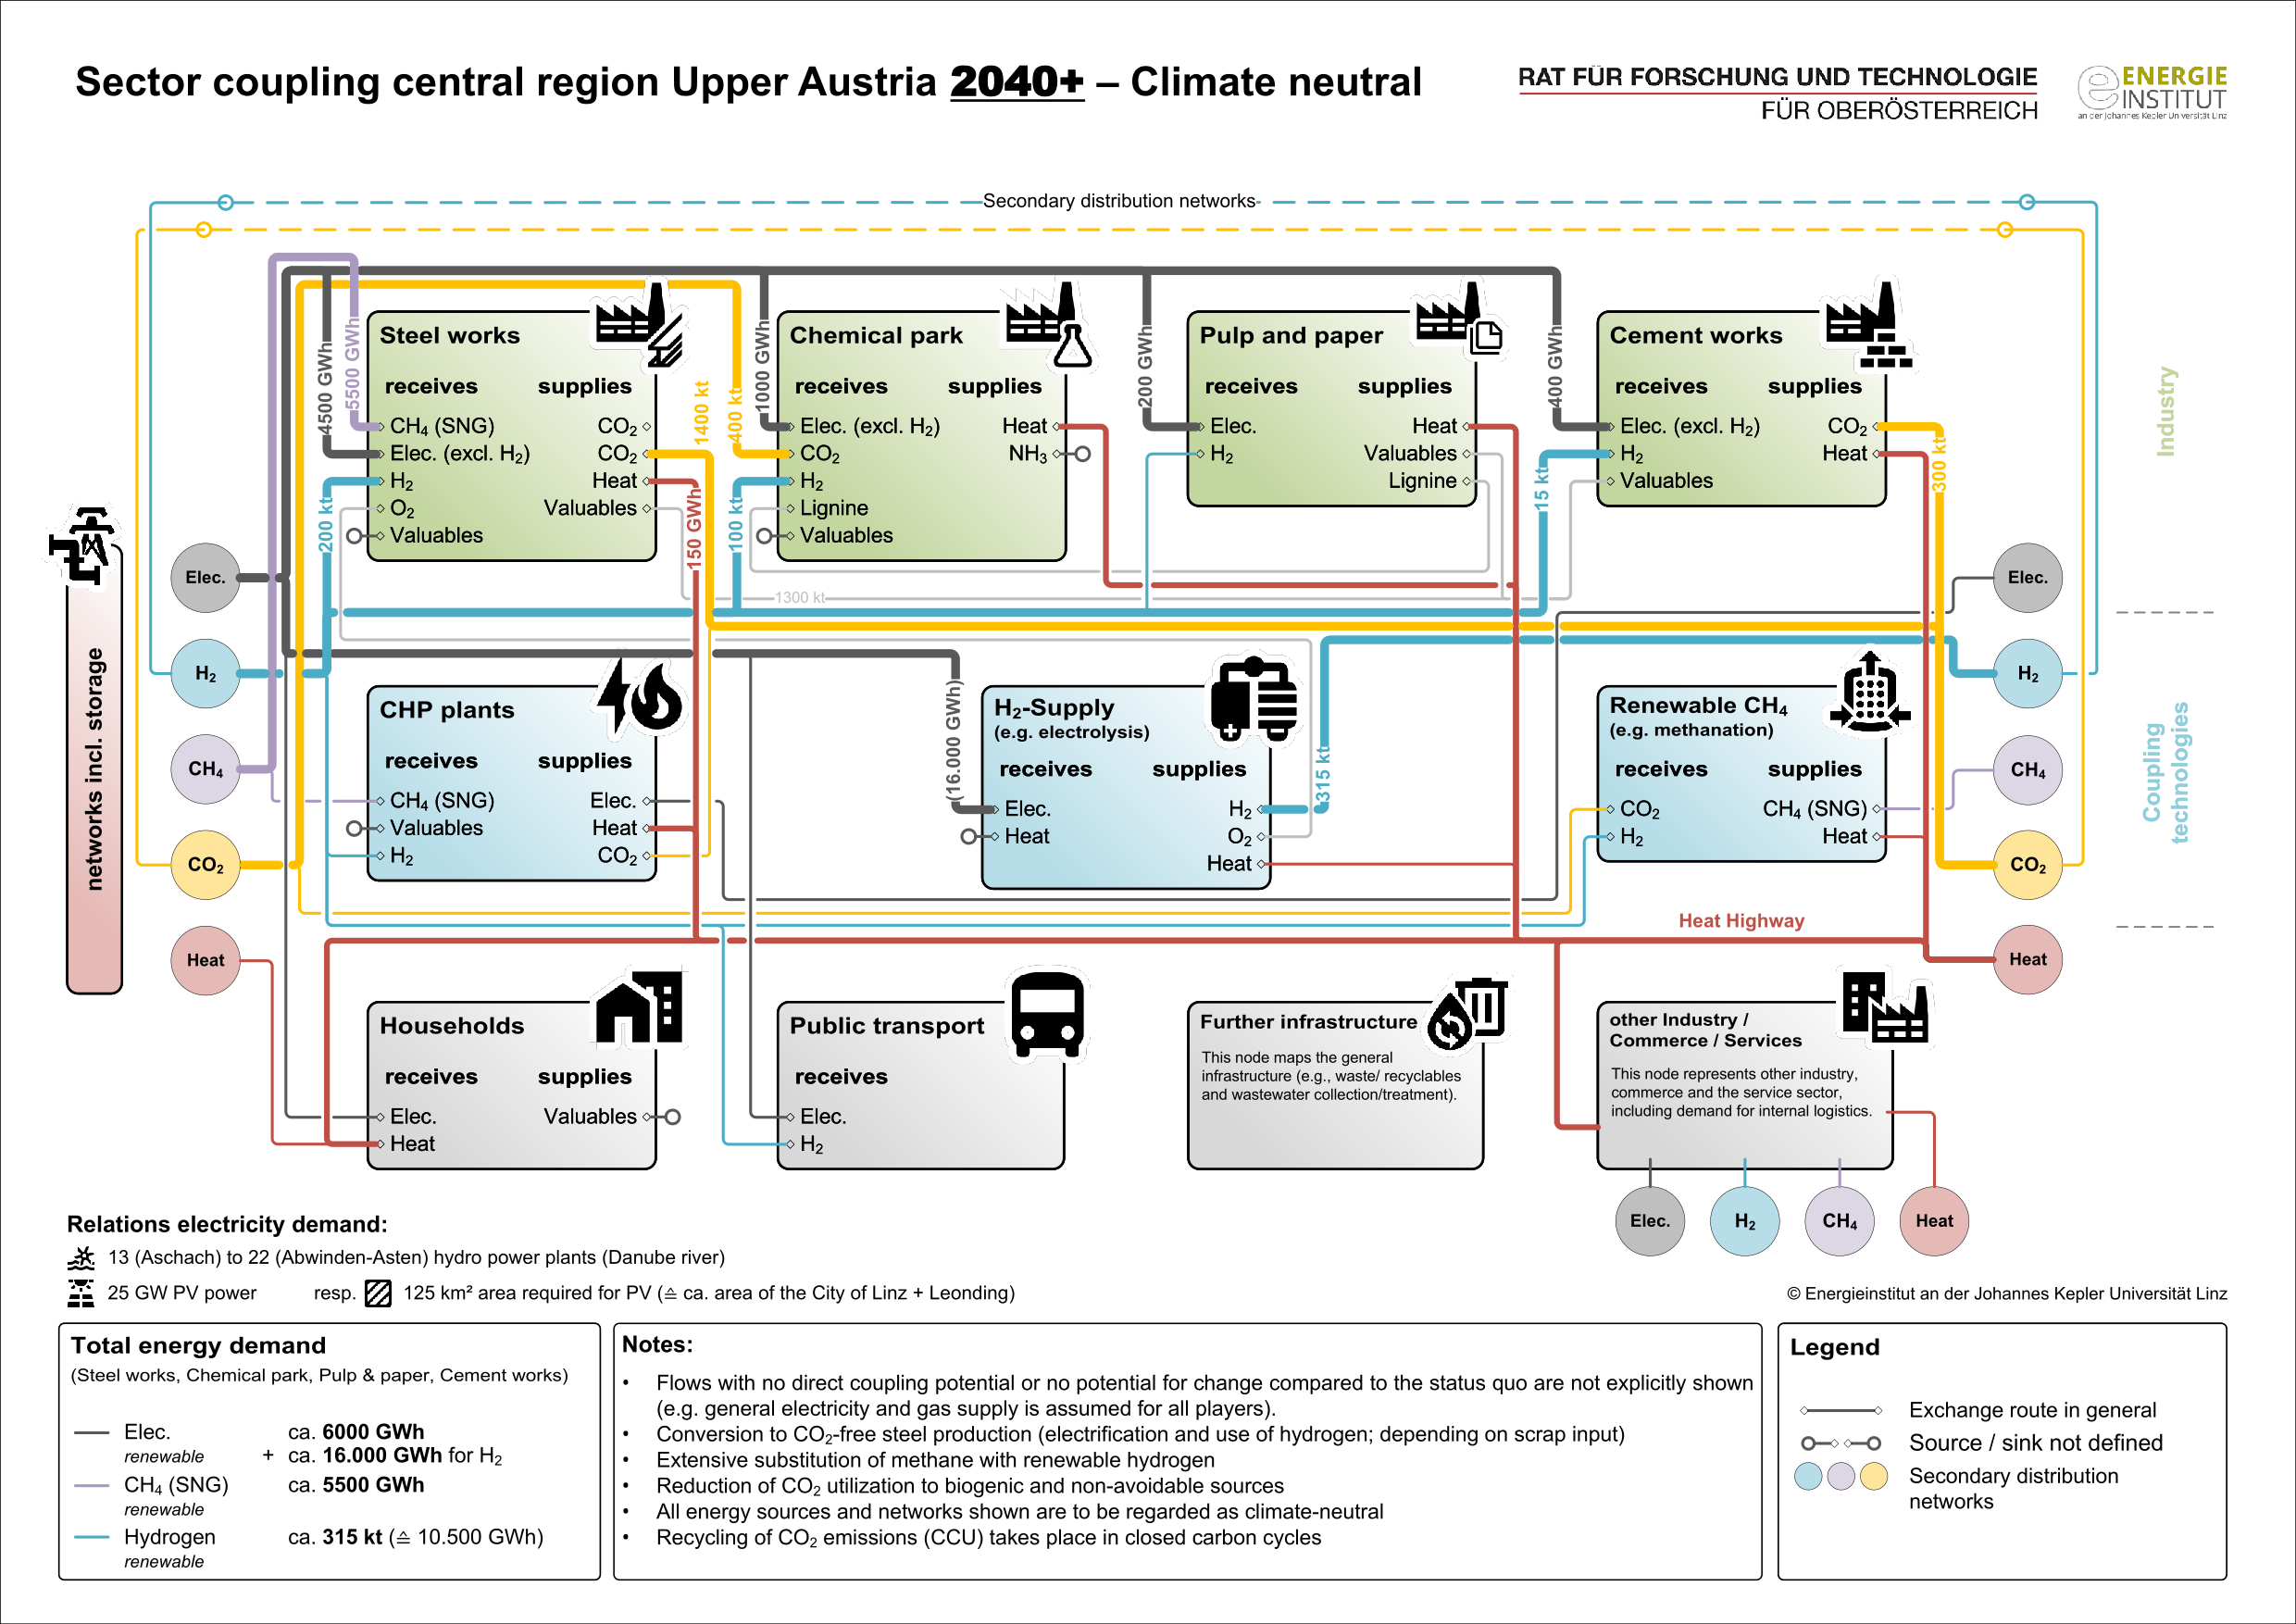
Vision of the Energy/Carbon Future of Upper Austria 2040
The figure shows the visualized vision developed by the Energy Institute at the JKU in coordination with the stakeholders, which represents possible energy and resource exchanges in 2040 in annual quantities.
Copyright: Energieinstitut an der Johannes Kepler Universität Linz

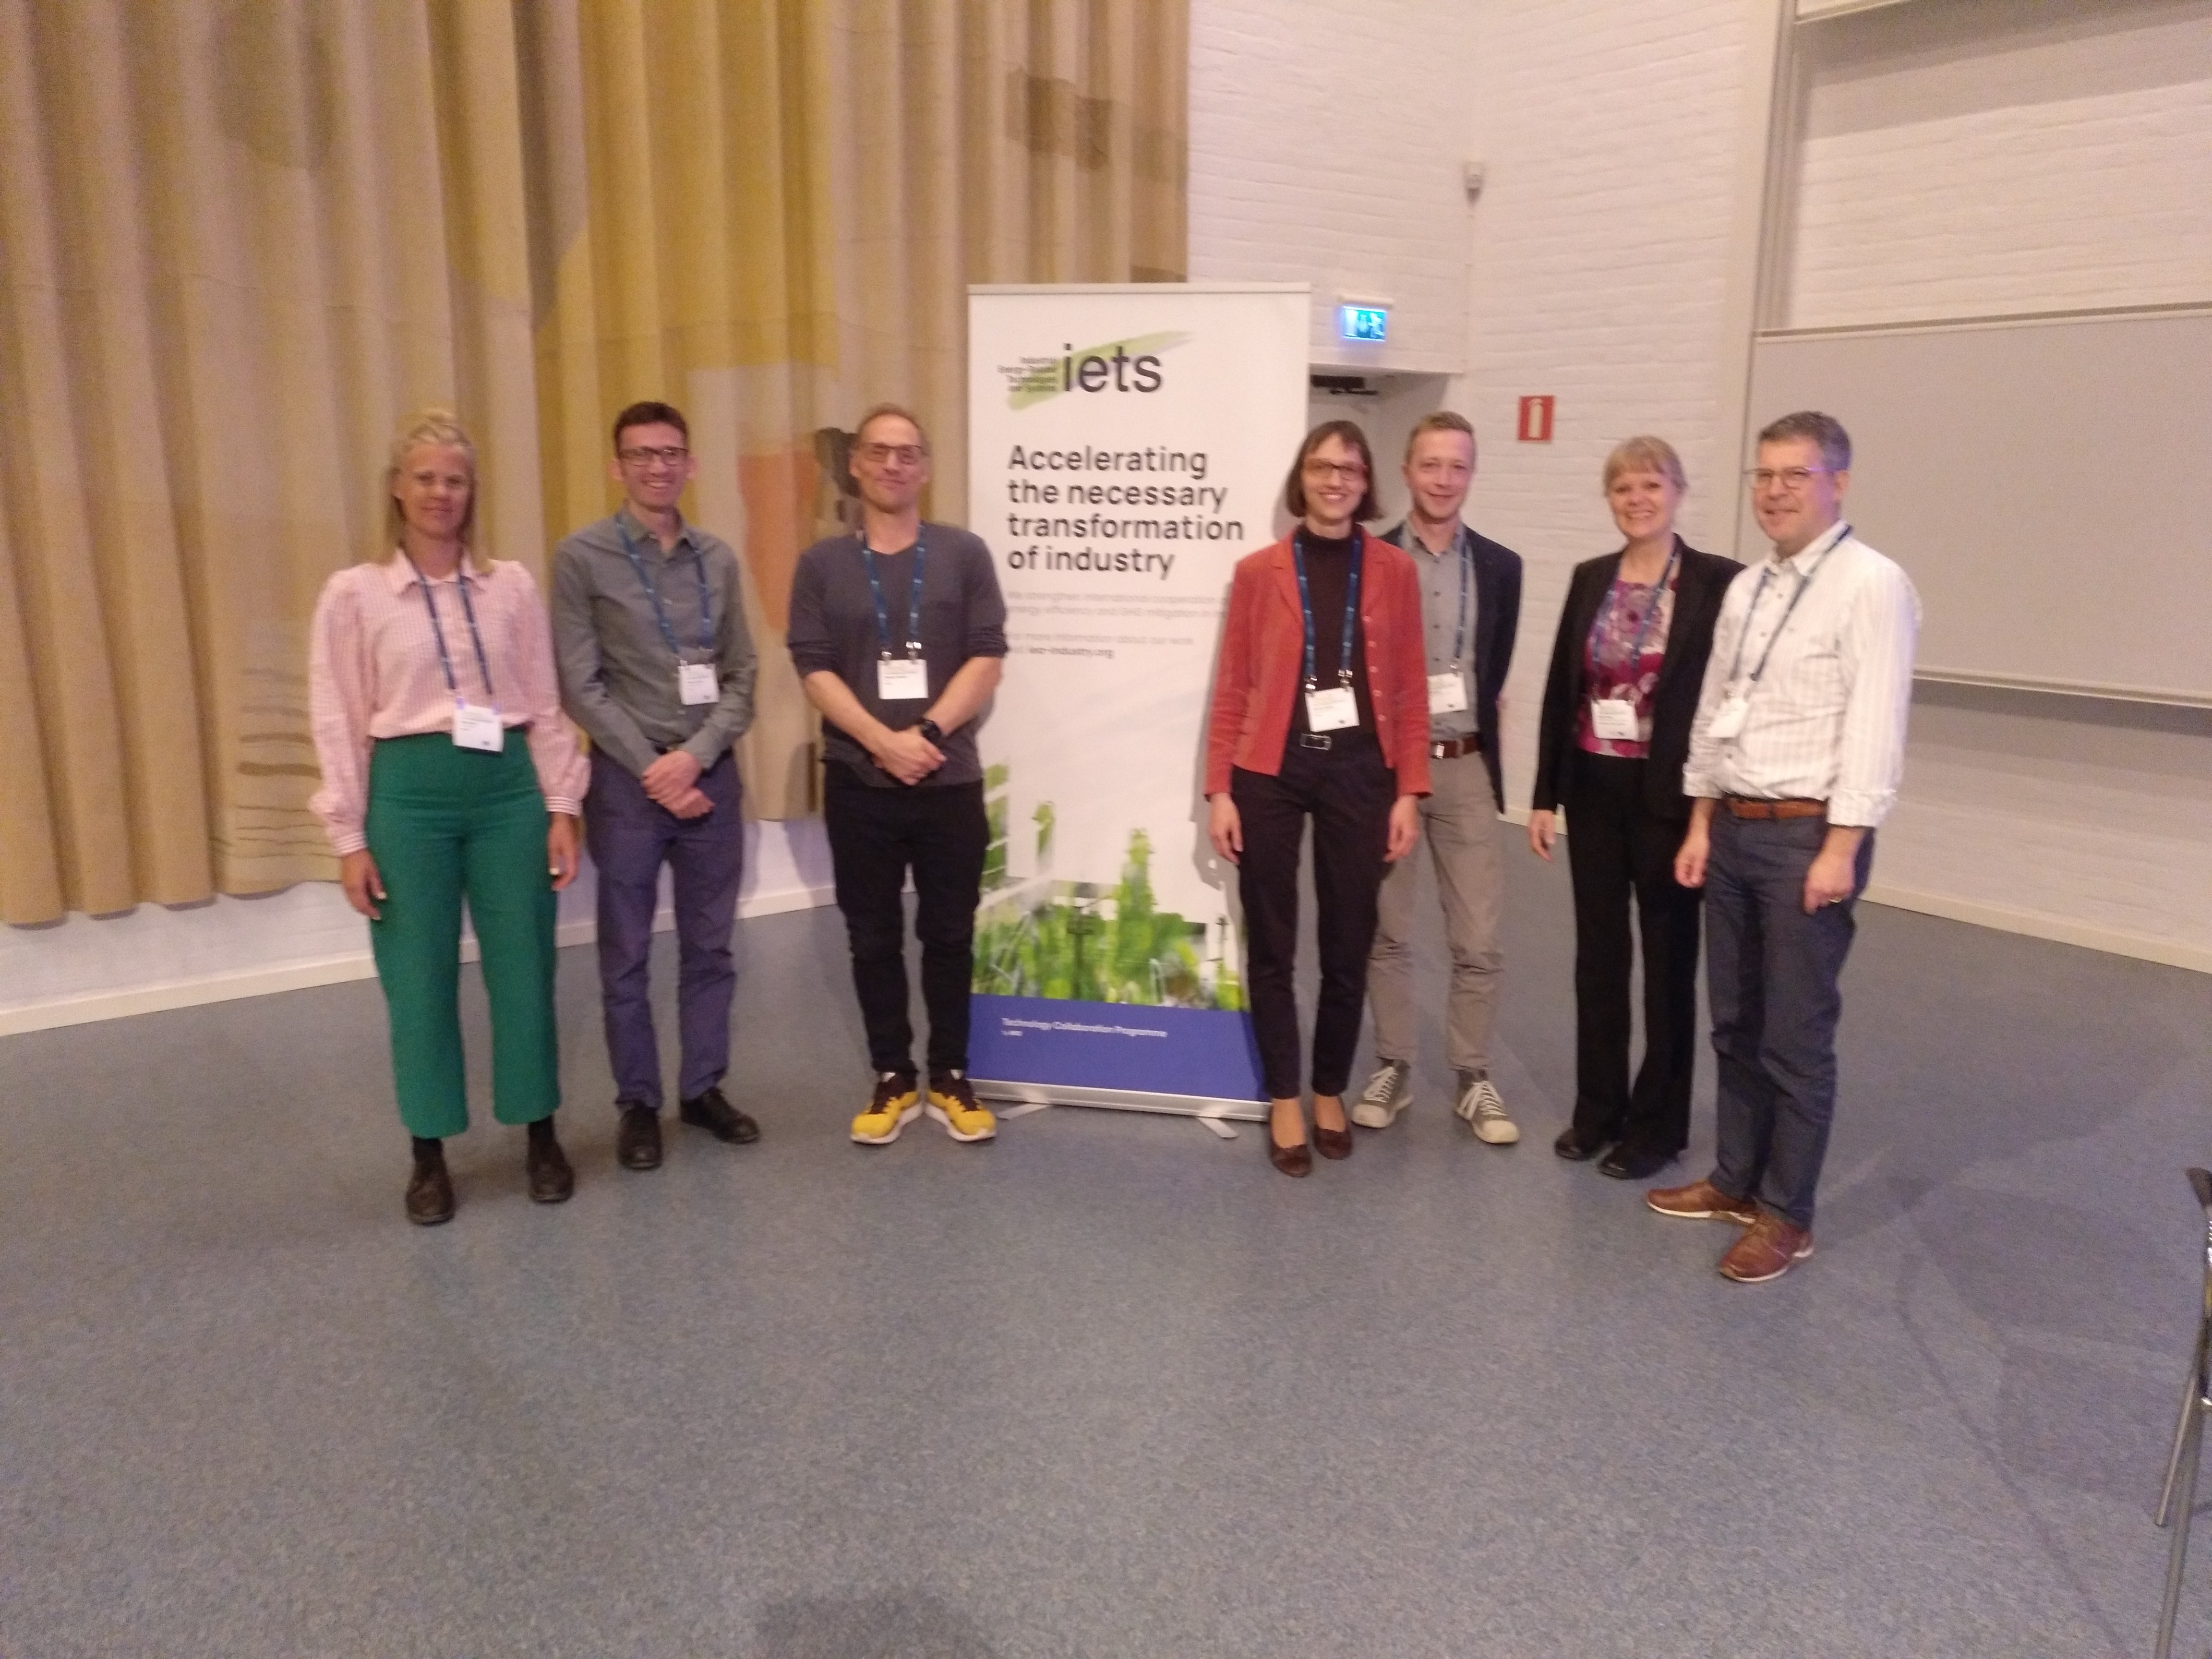
Group picture of IETS Task 21 at the IETS Conference 2023
At the IETS conference from May 9-11, 2023 in Gothenburg, the subtasks and activities of IETS Task 21 were presented, and two key note presentations and two elevator pitches on the task were given.
Copyright: Rodin

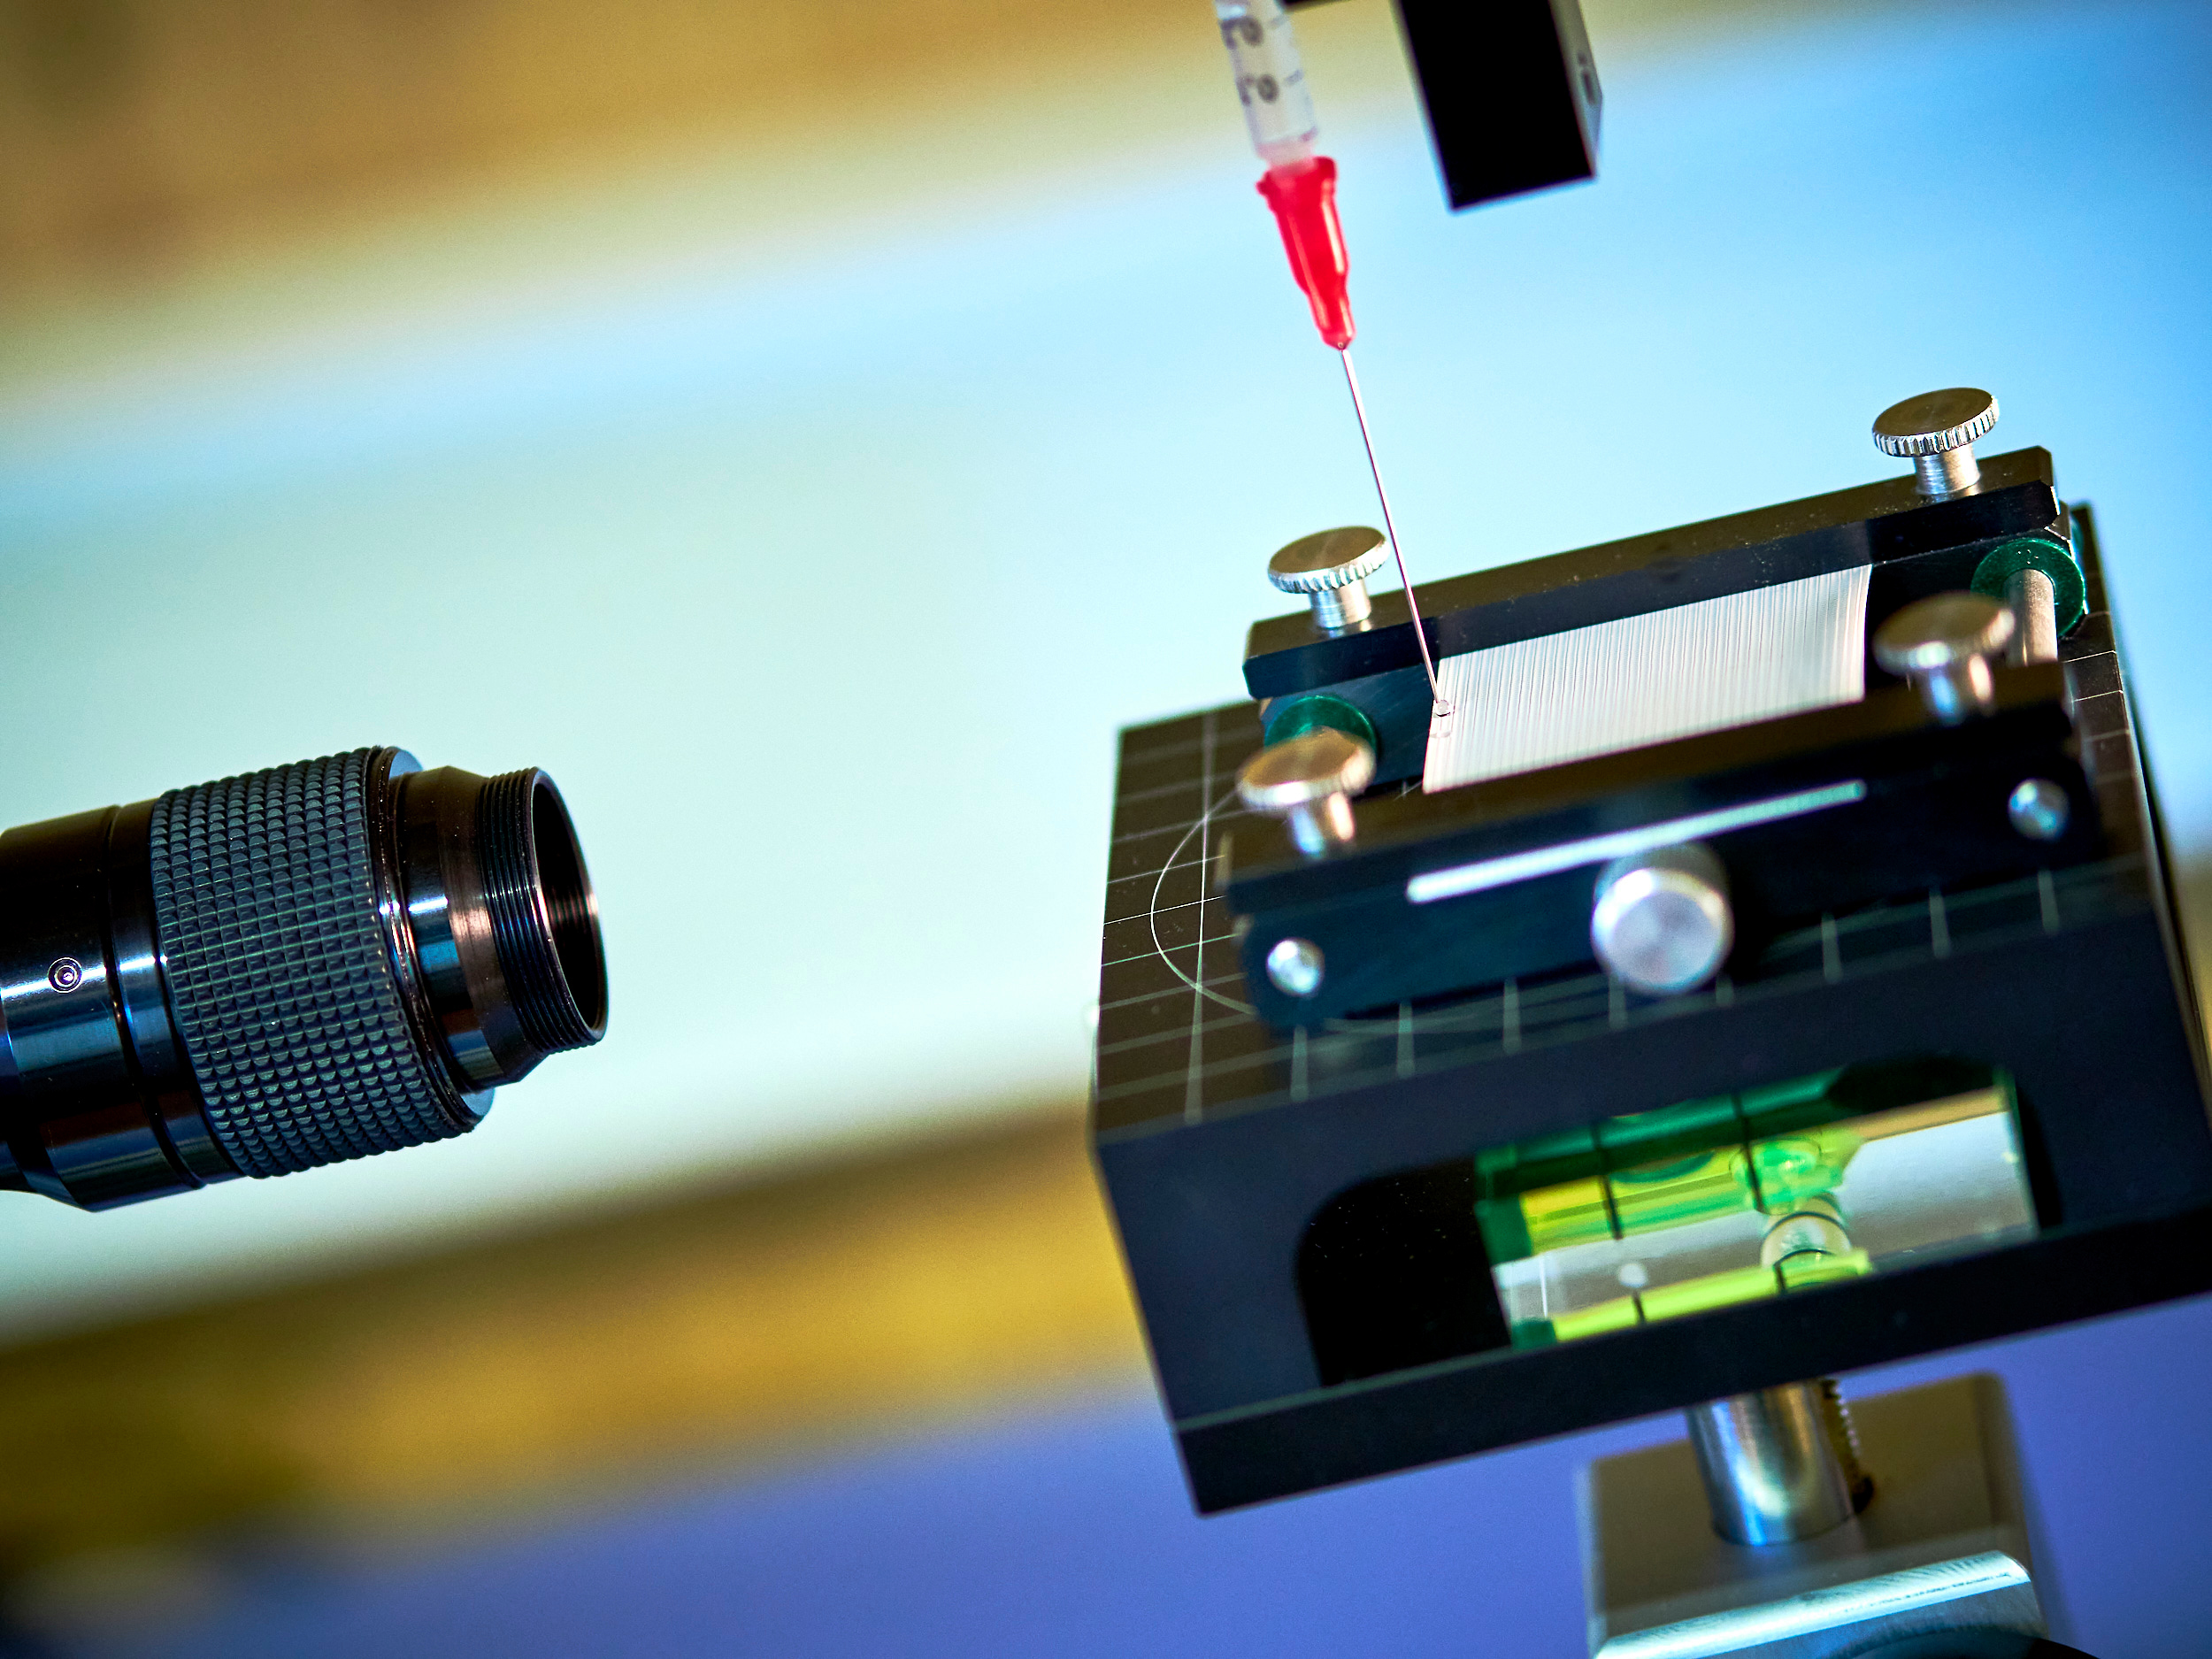
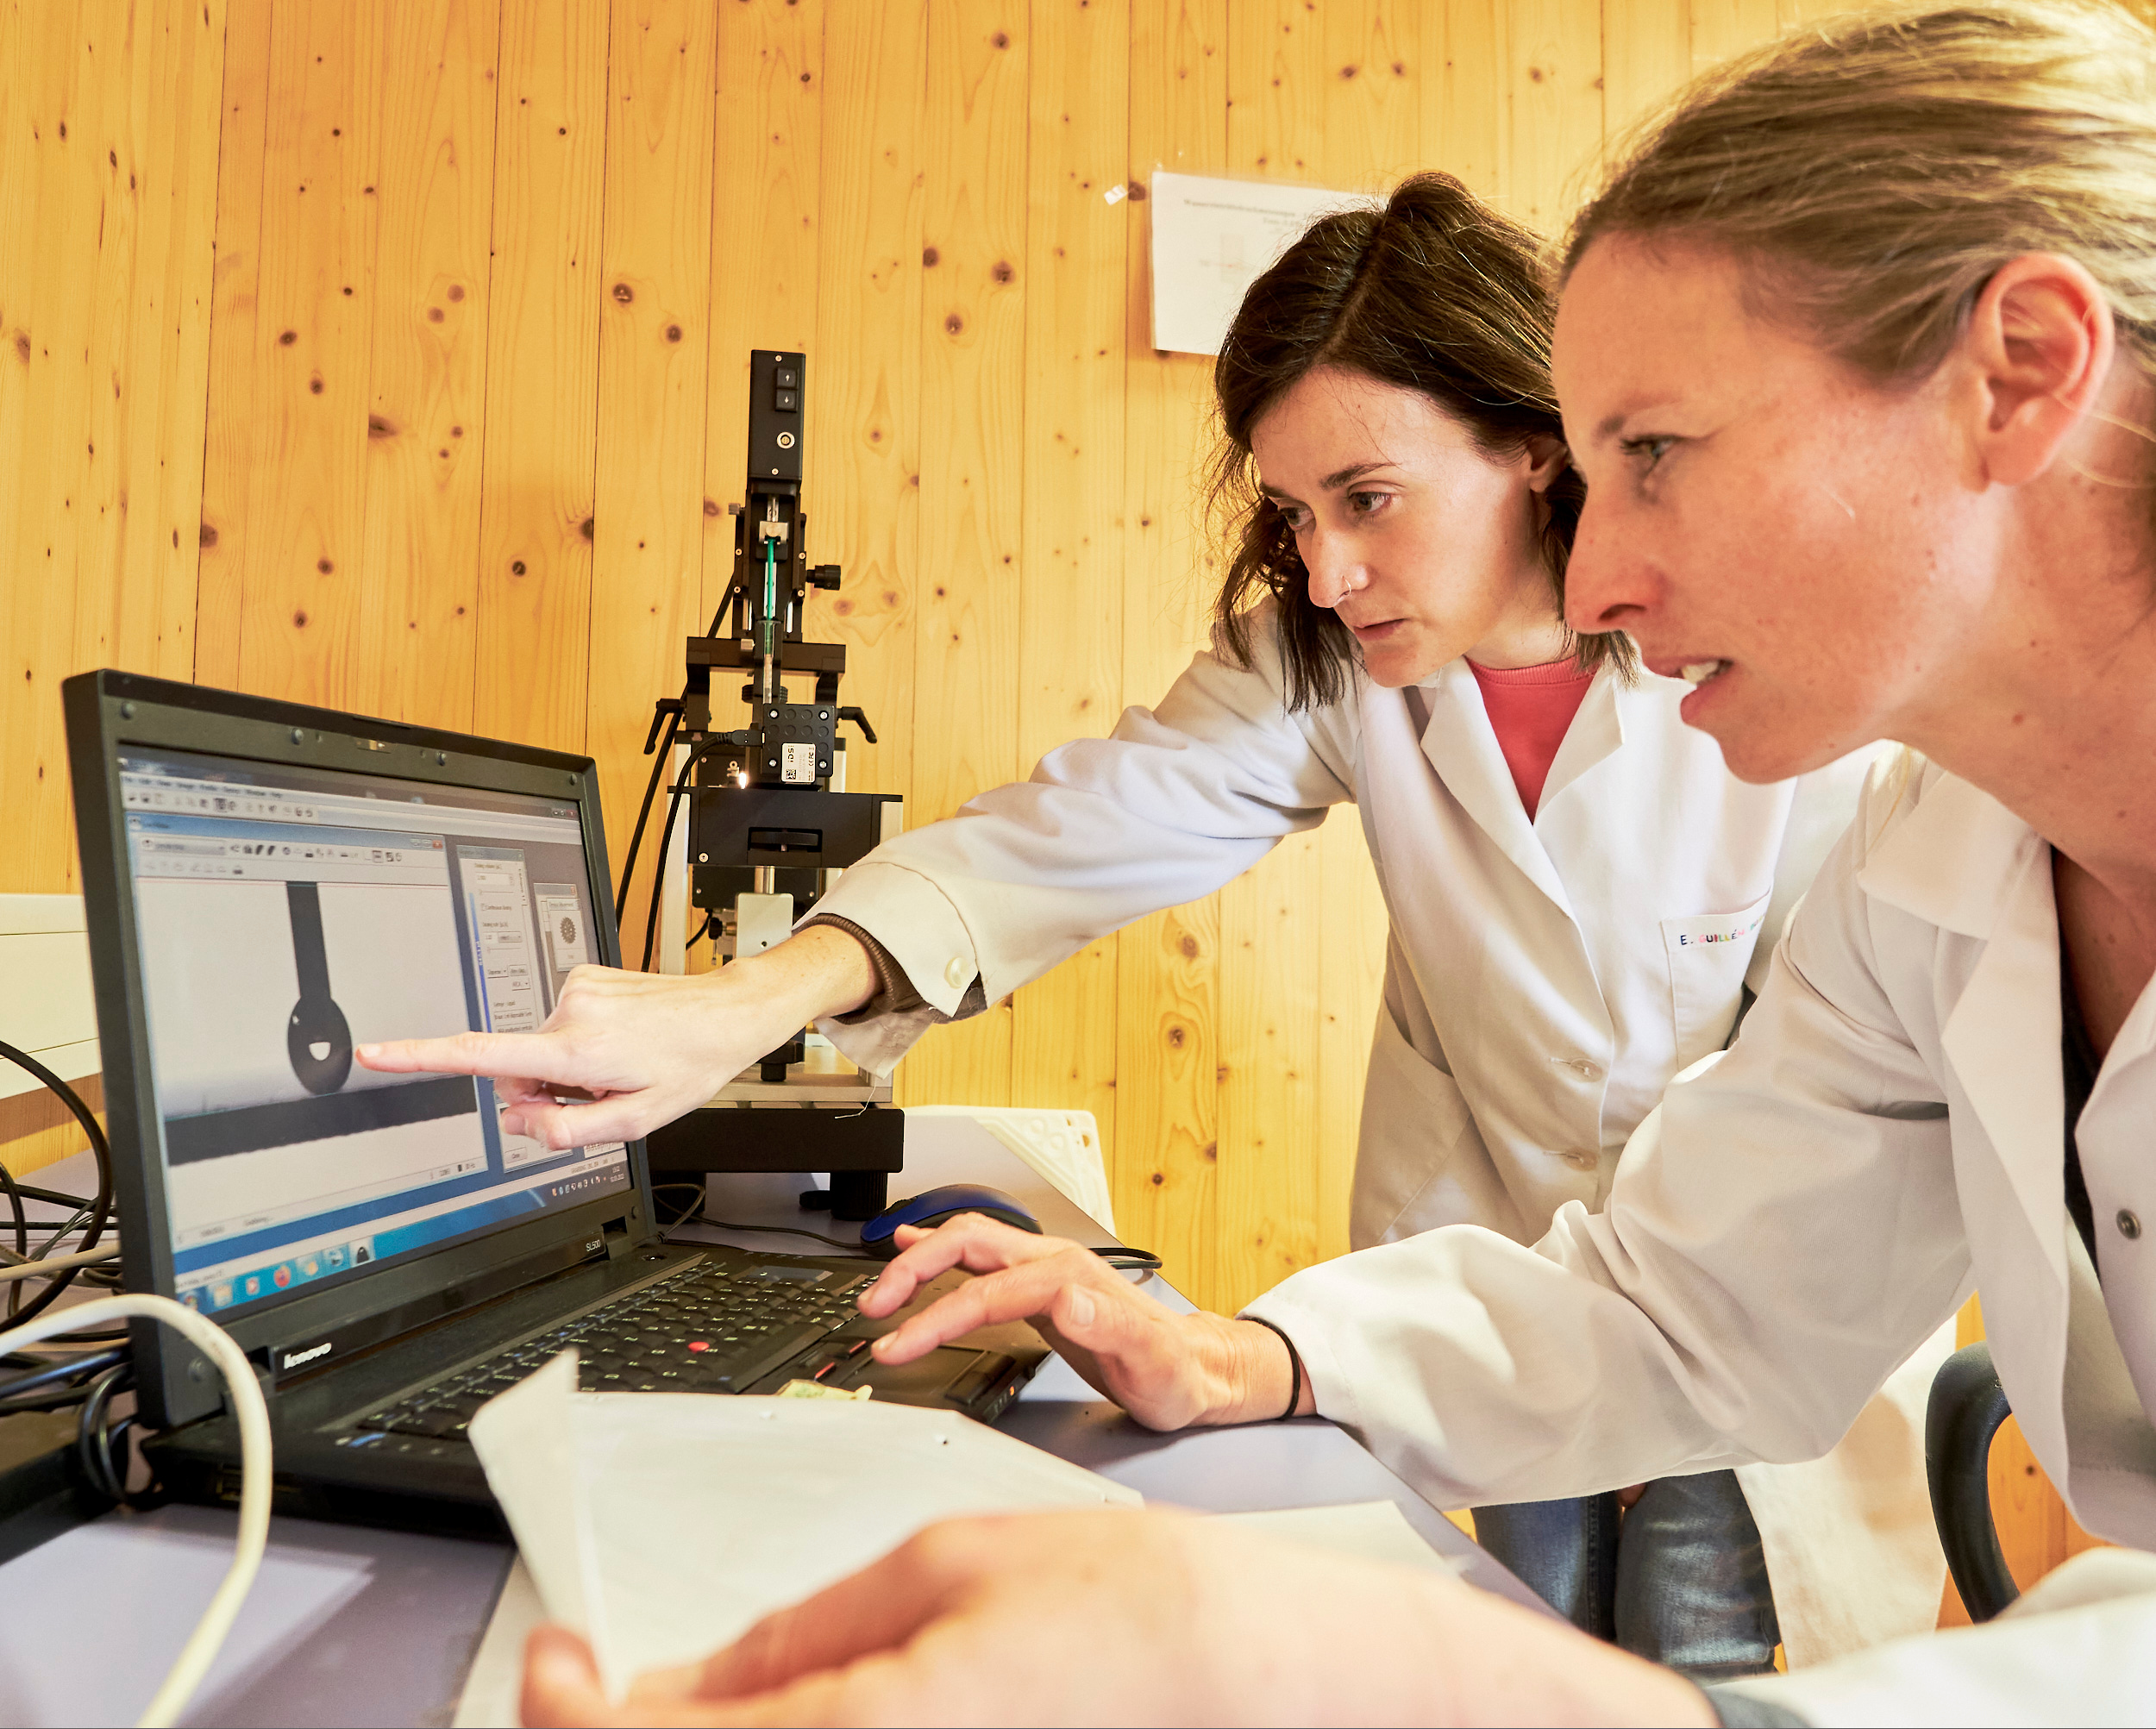
Contact angle measurement for membrane properties assessment
Depositing a drop of test liquid on the membrane.
Copyright: ACR/schewig-fotodesign
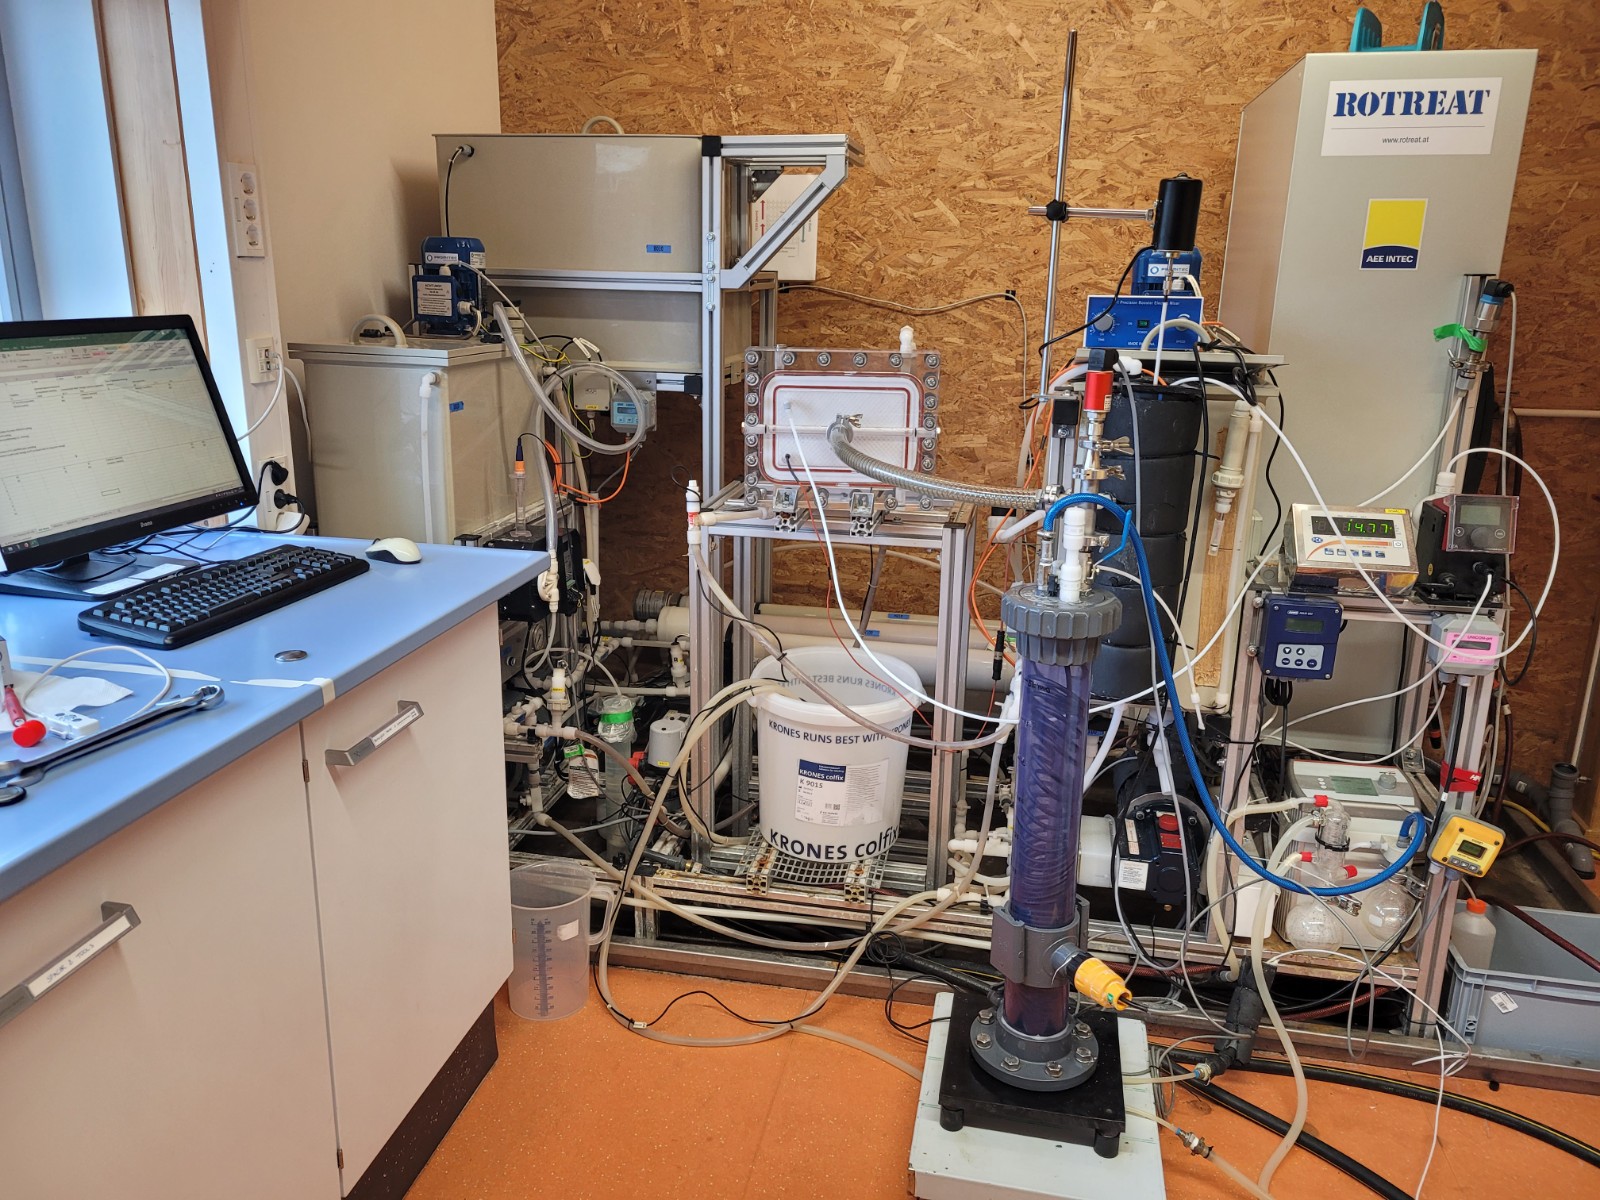
Membrane distillation (MD) laboratory plant at AEE INTEC in Gleisdorf
The MD laboratory system offers the option of connecting different module types and sizes, shown here with a connected test cell. The system can also be operated in different configurations, such as in direct contact mode or with vacuum.
Copyright: AEE INTEC
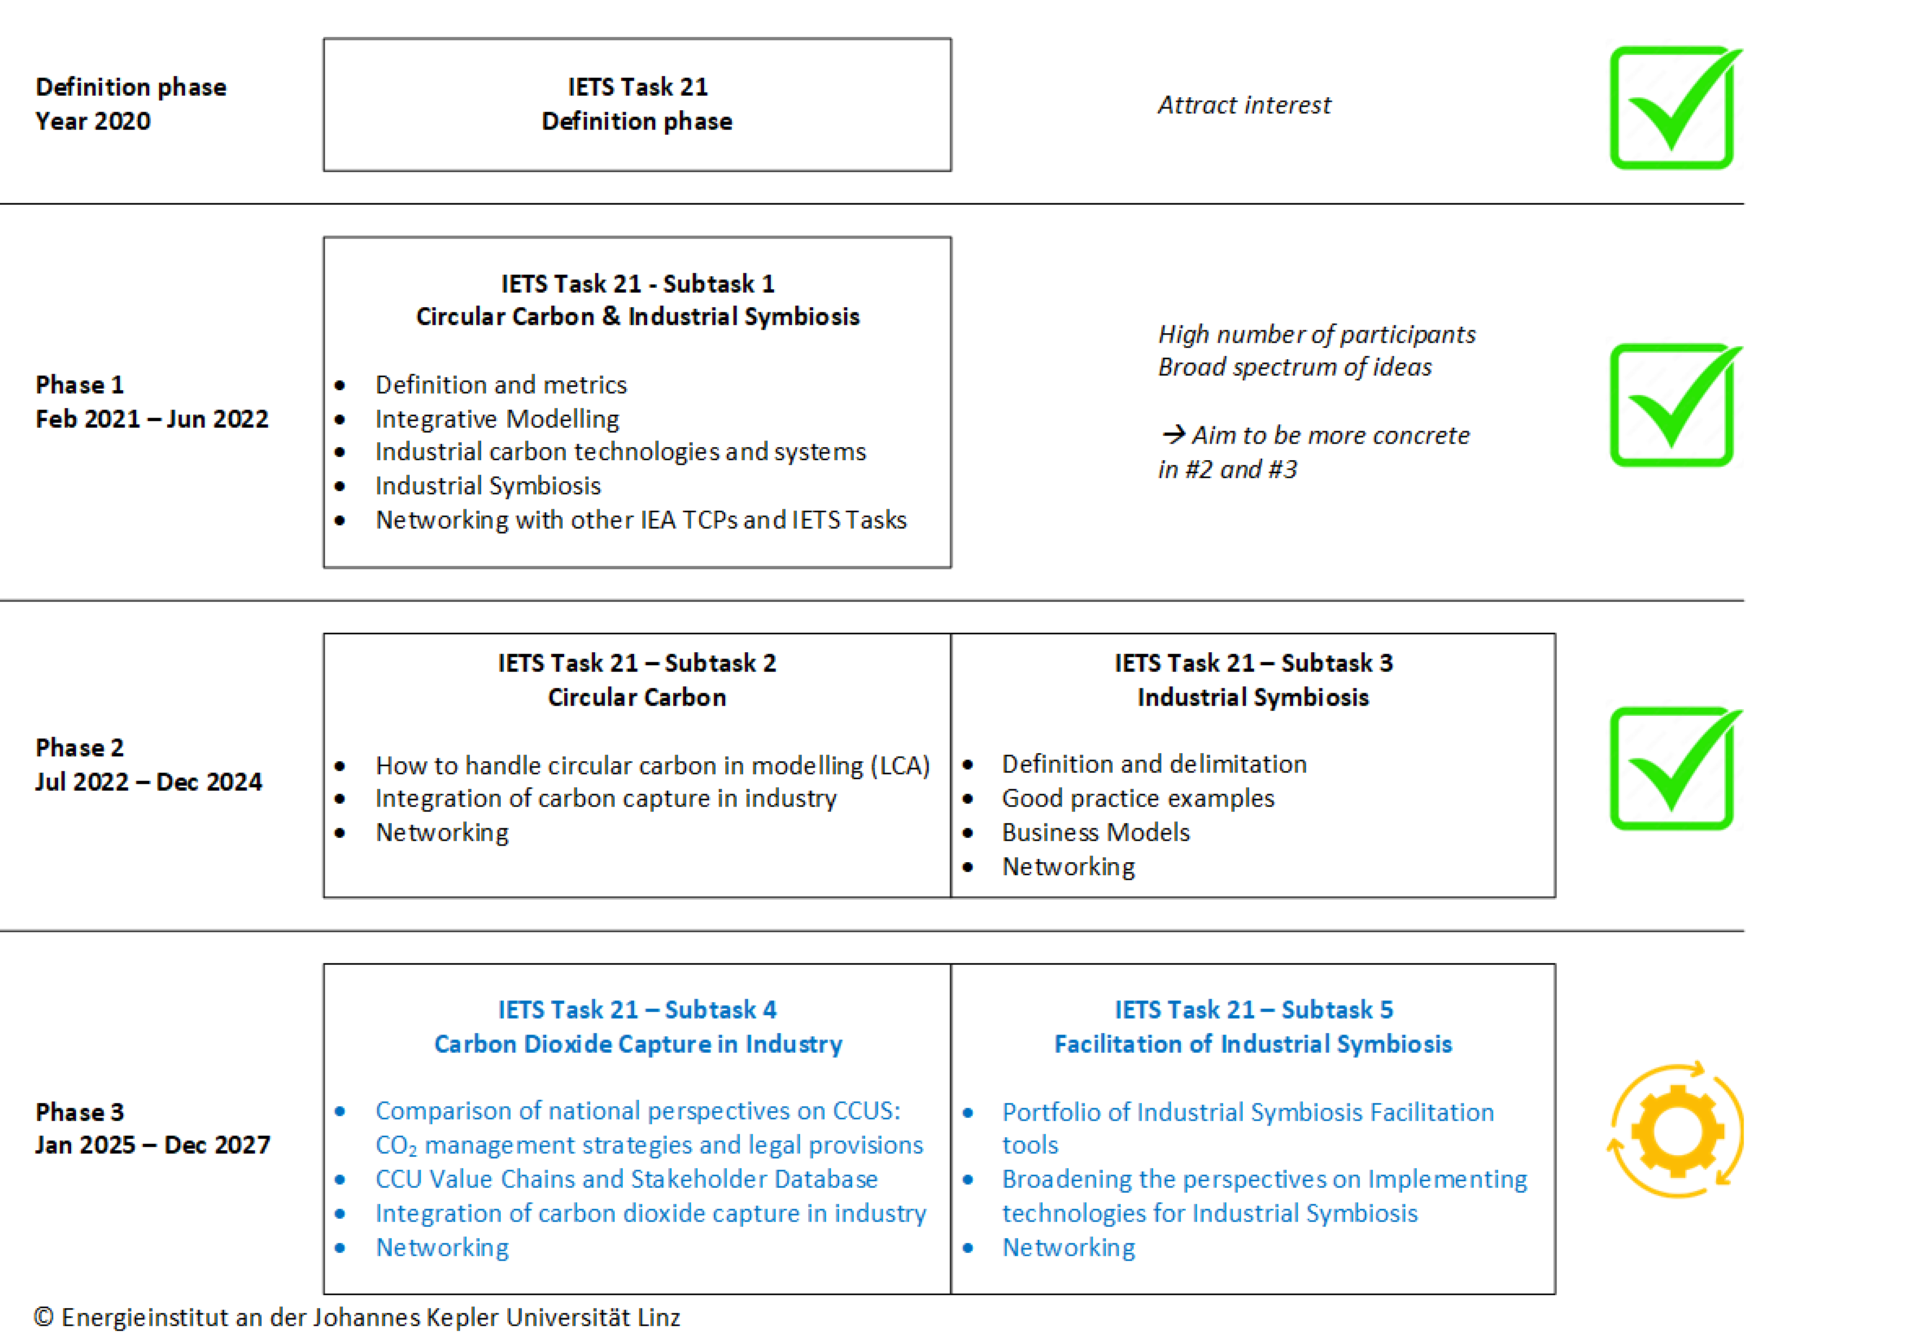
Overview IETS Task 21 Phase 3
The IETS Task 21 at a glance: A clear presentation of its development from its initiation in 2020 to Phase 3, including the activities of Subtasks 1 to 5.
Copyright: Eigene Darstellung: Moser, Energieinstitut an der JKU
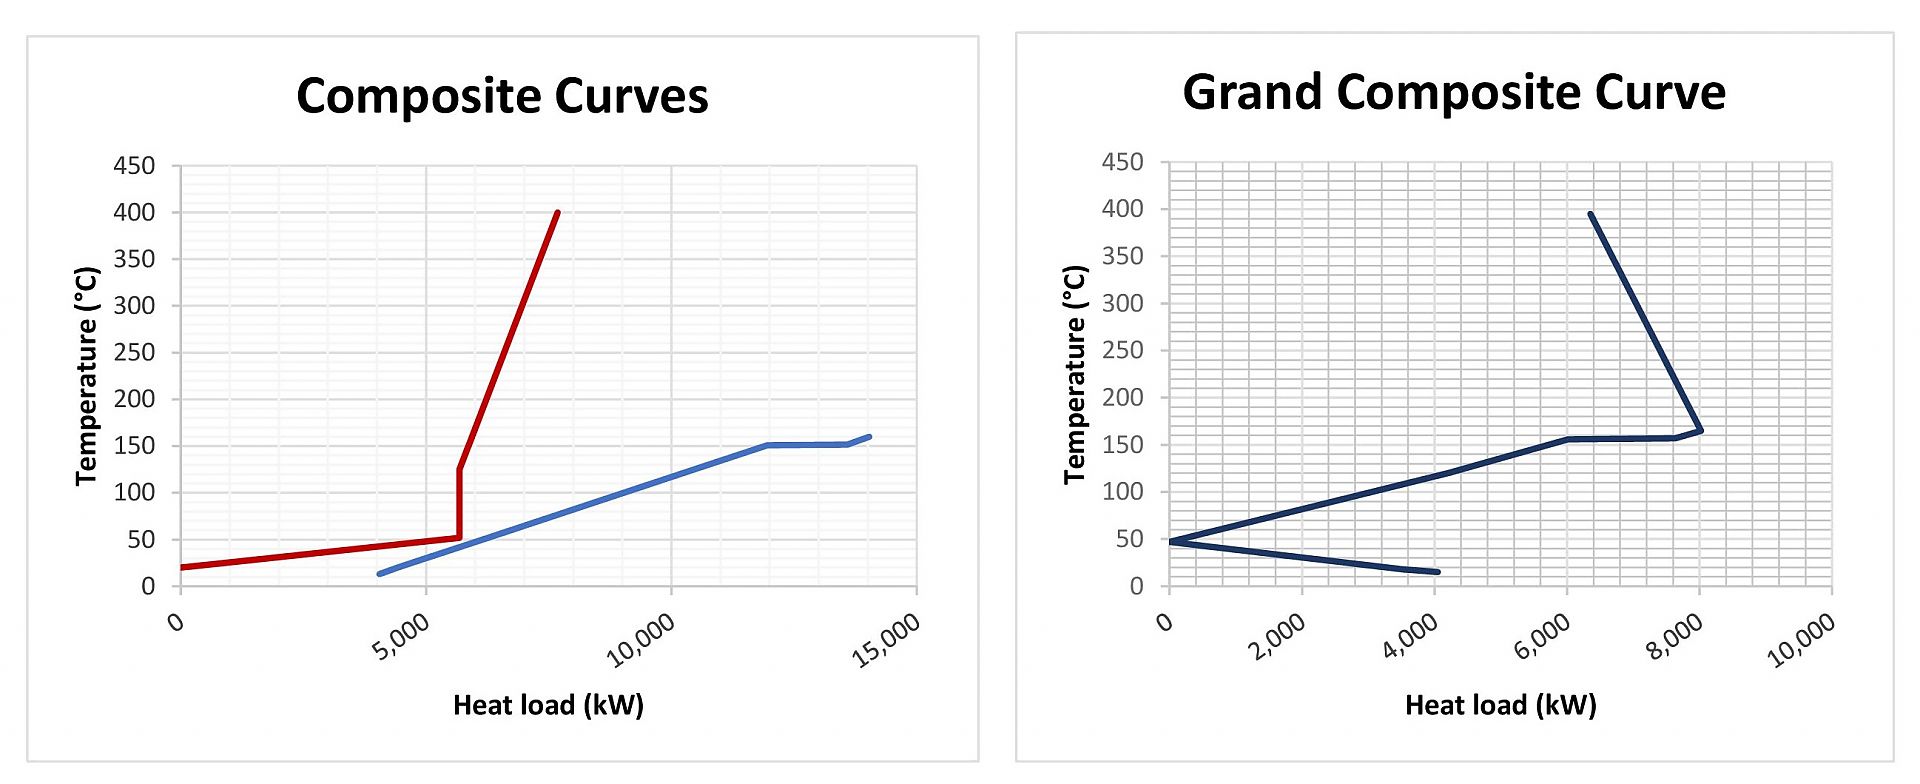
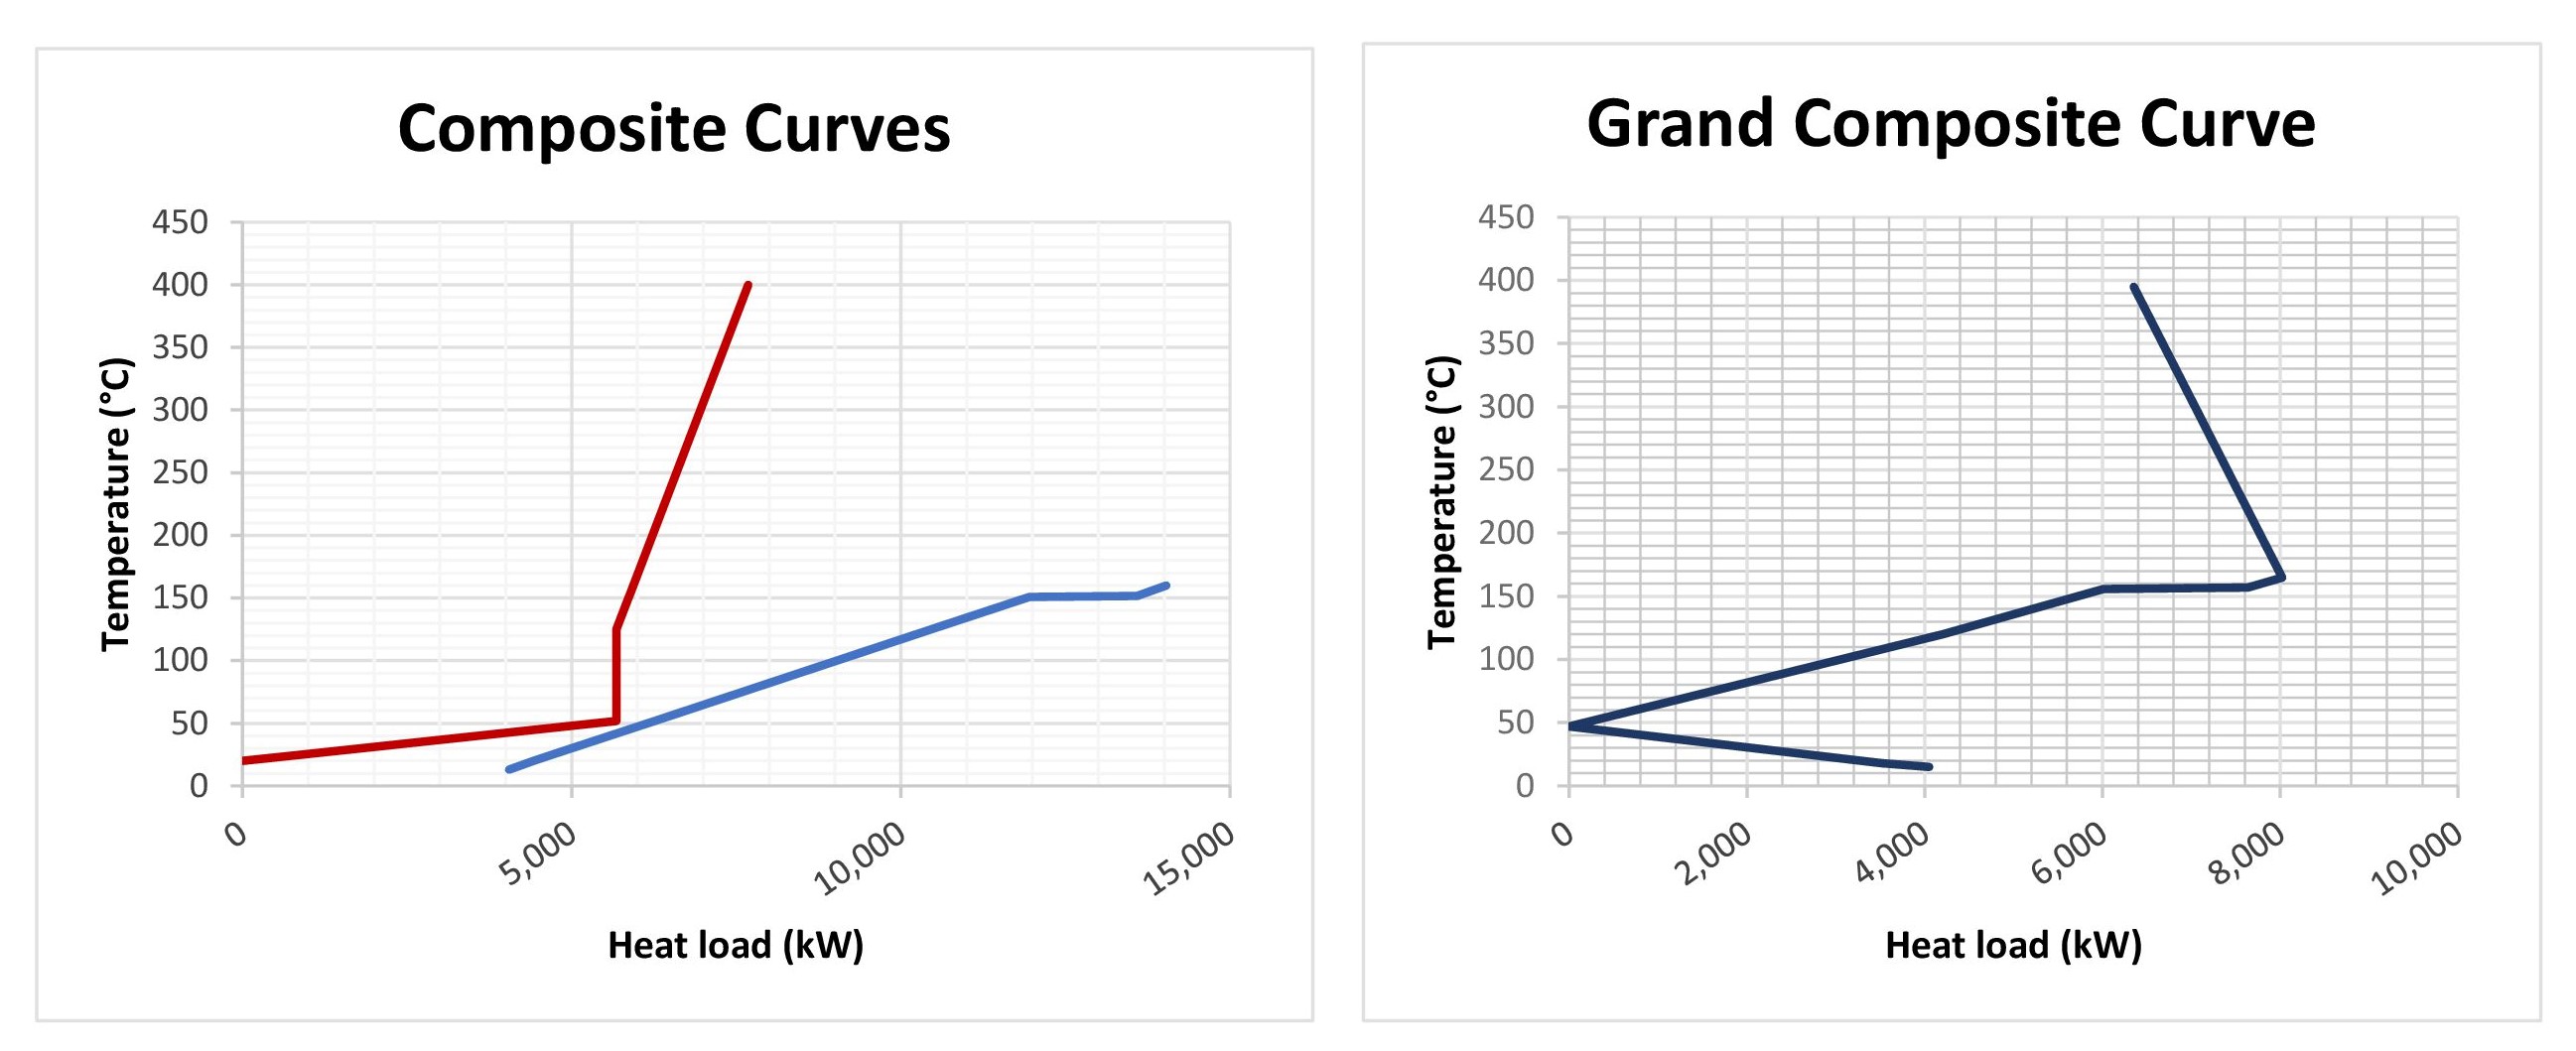
Composite Curves for an Example Case
The figure shows Composite Curves from Pinch Analysis for an Example Case that was evaluated within the project.
Copyright: Austrian Institute of Technology GmbH
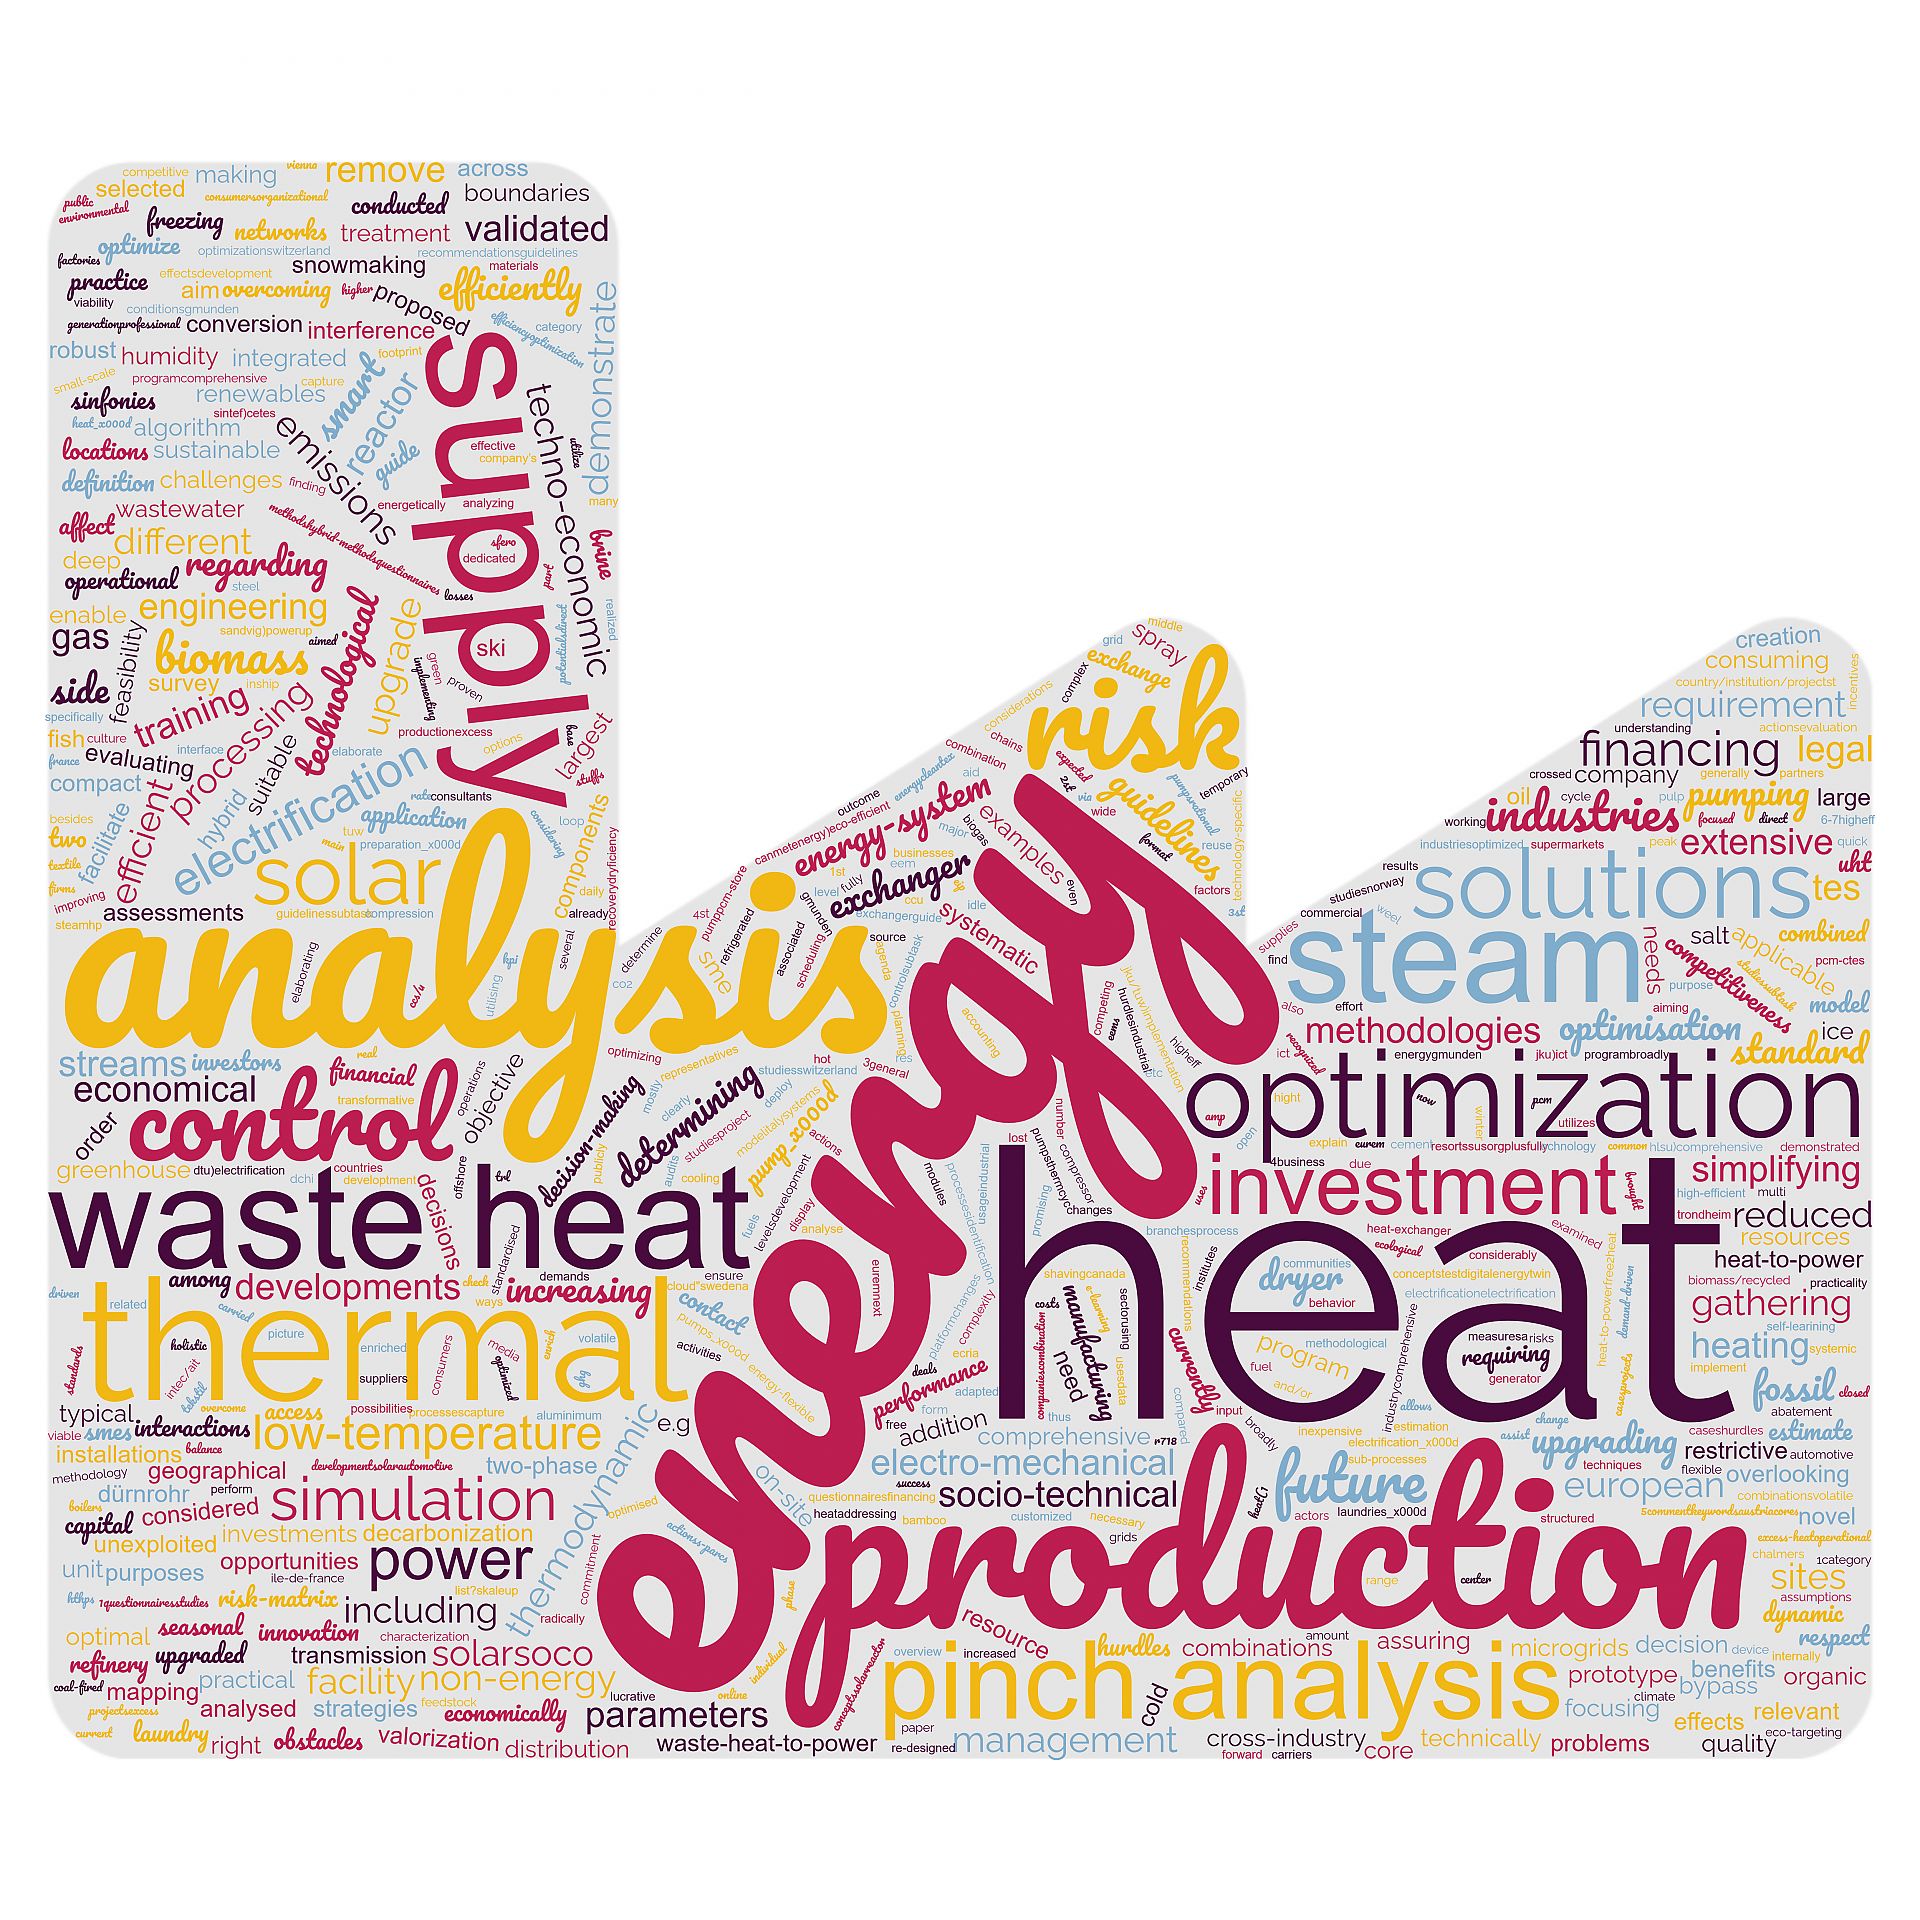
Word cloud Annex 15 Projects
The figure shows a word cloud with the most common words occuring in the project descriptions of Annex 15 partners.
Copyright: Austrian Institute of Technology GmbH
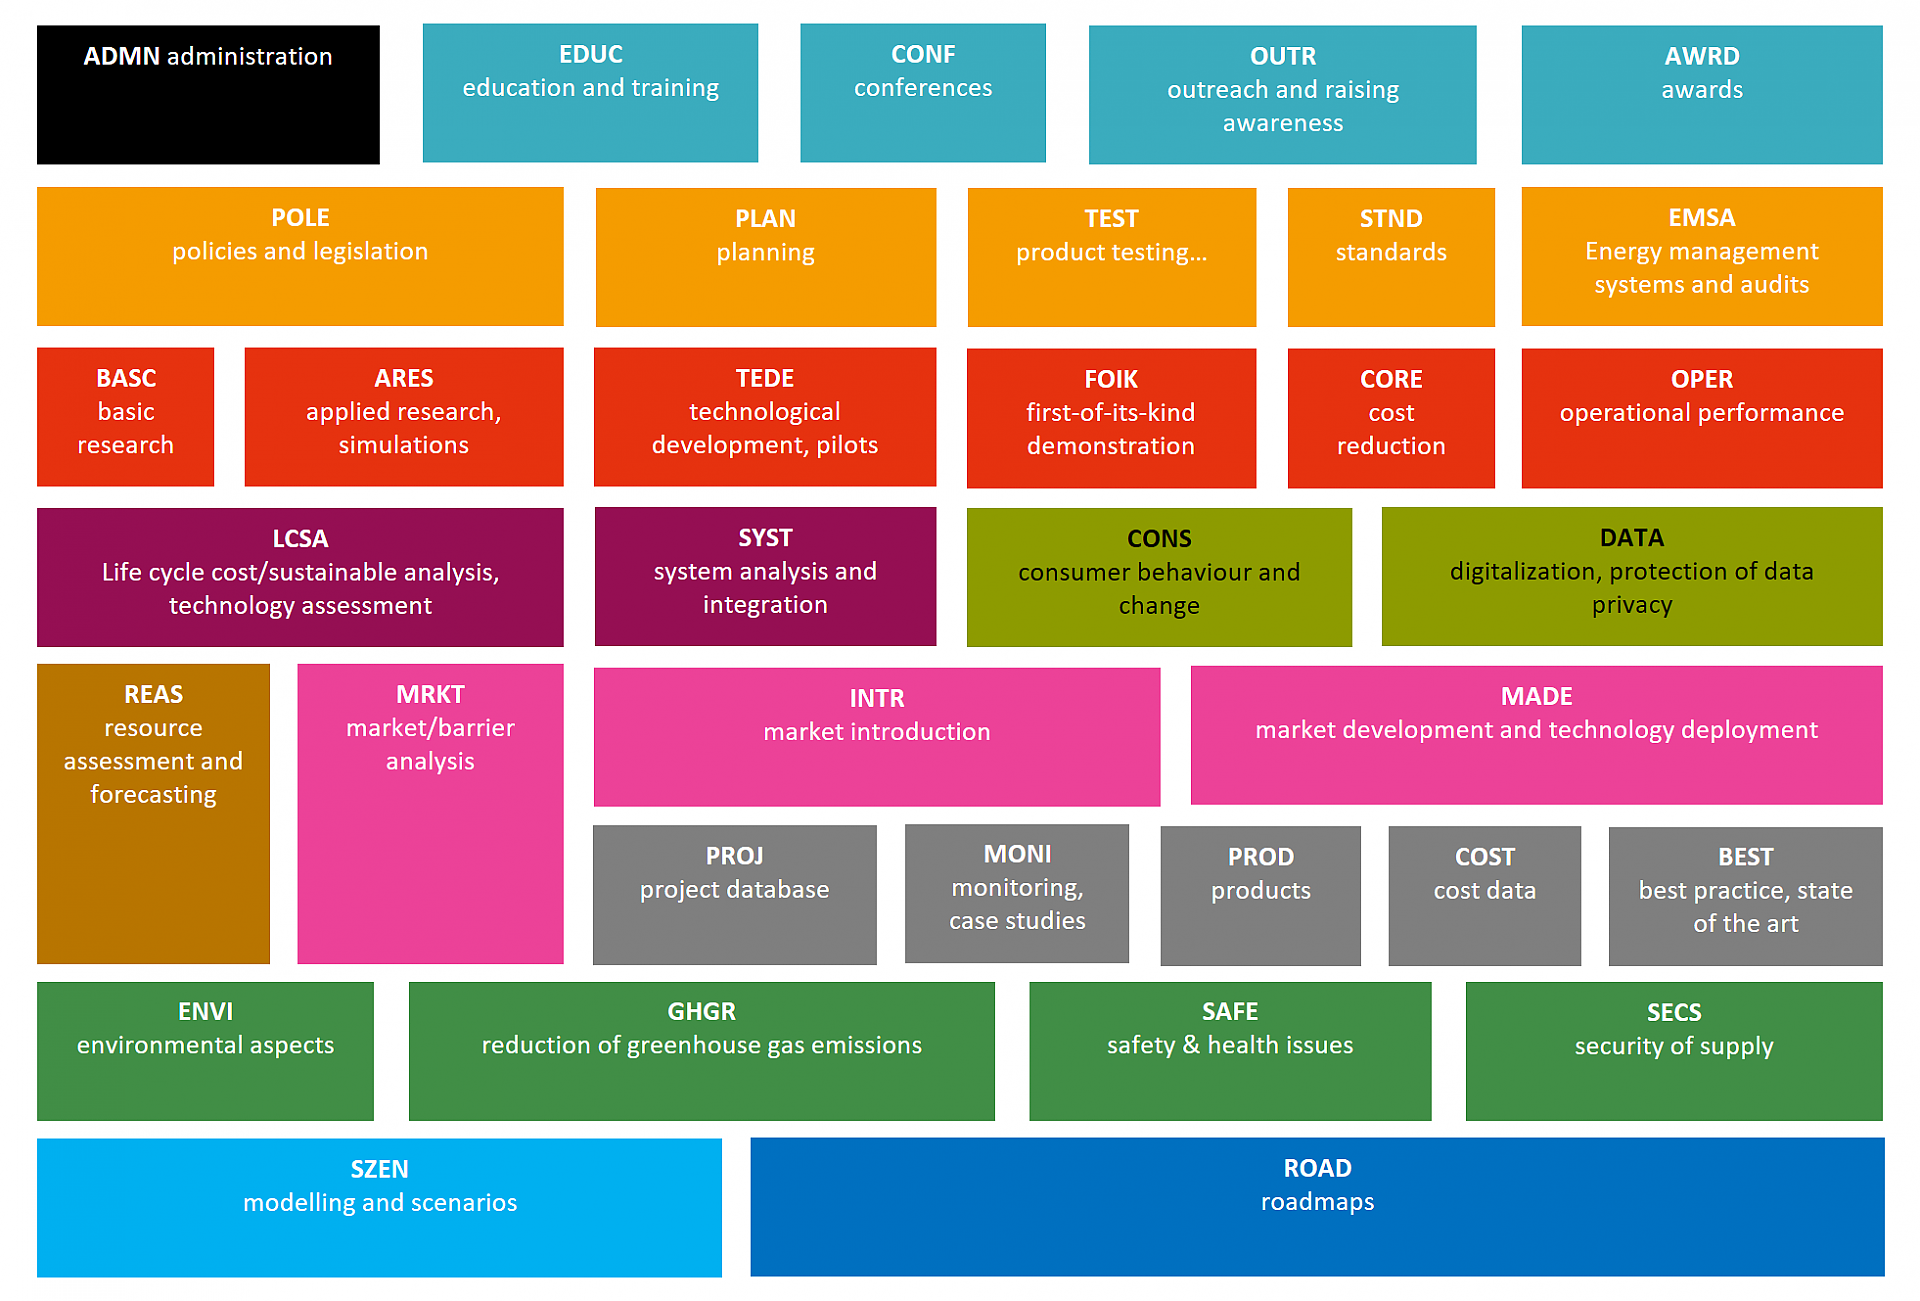
Methods
Set of methods to classify the type of activity of TCP Tasks and Annexes.
Copyright: Austrian Energy Agency
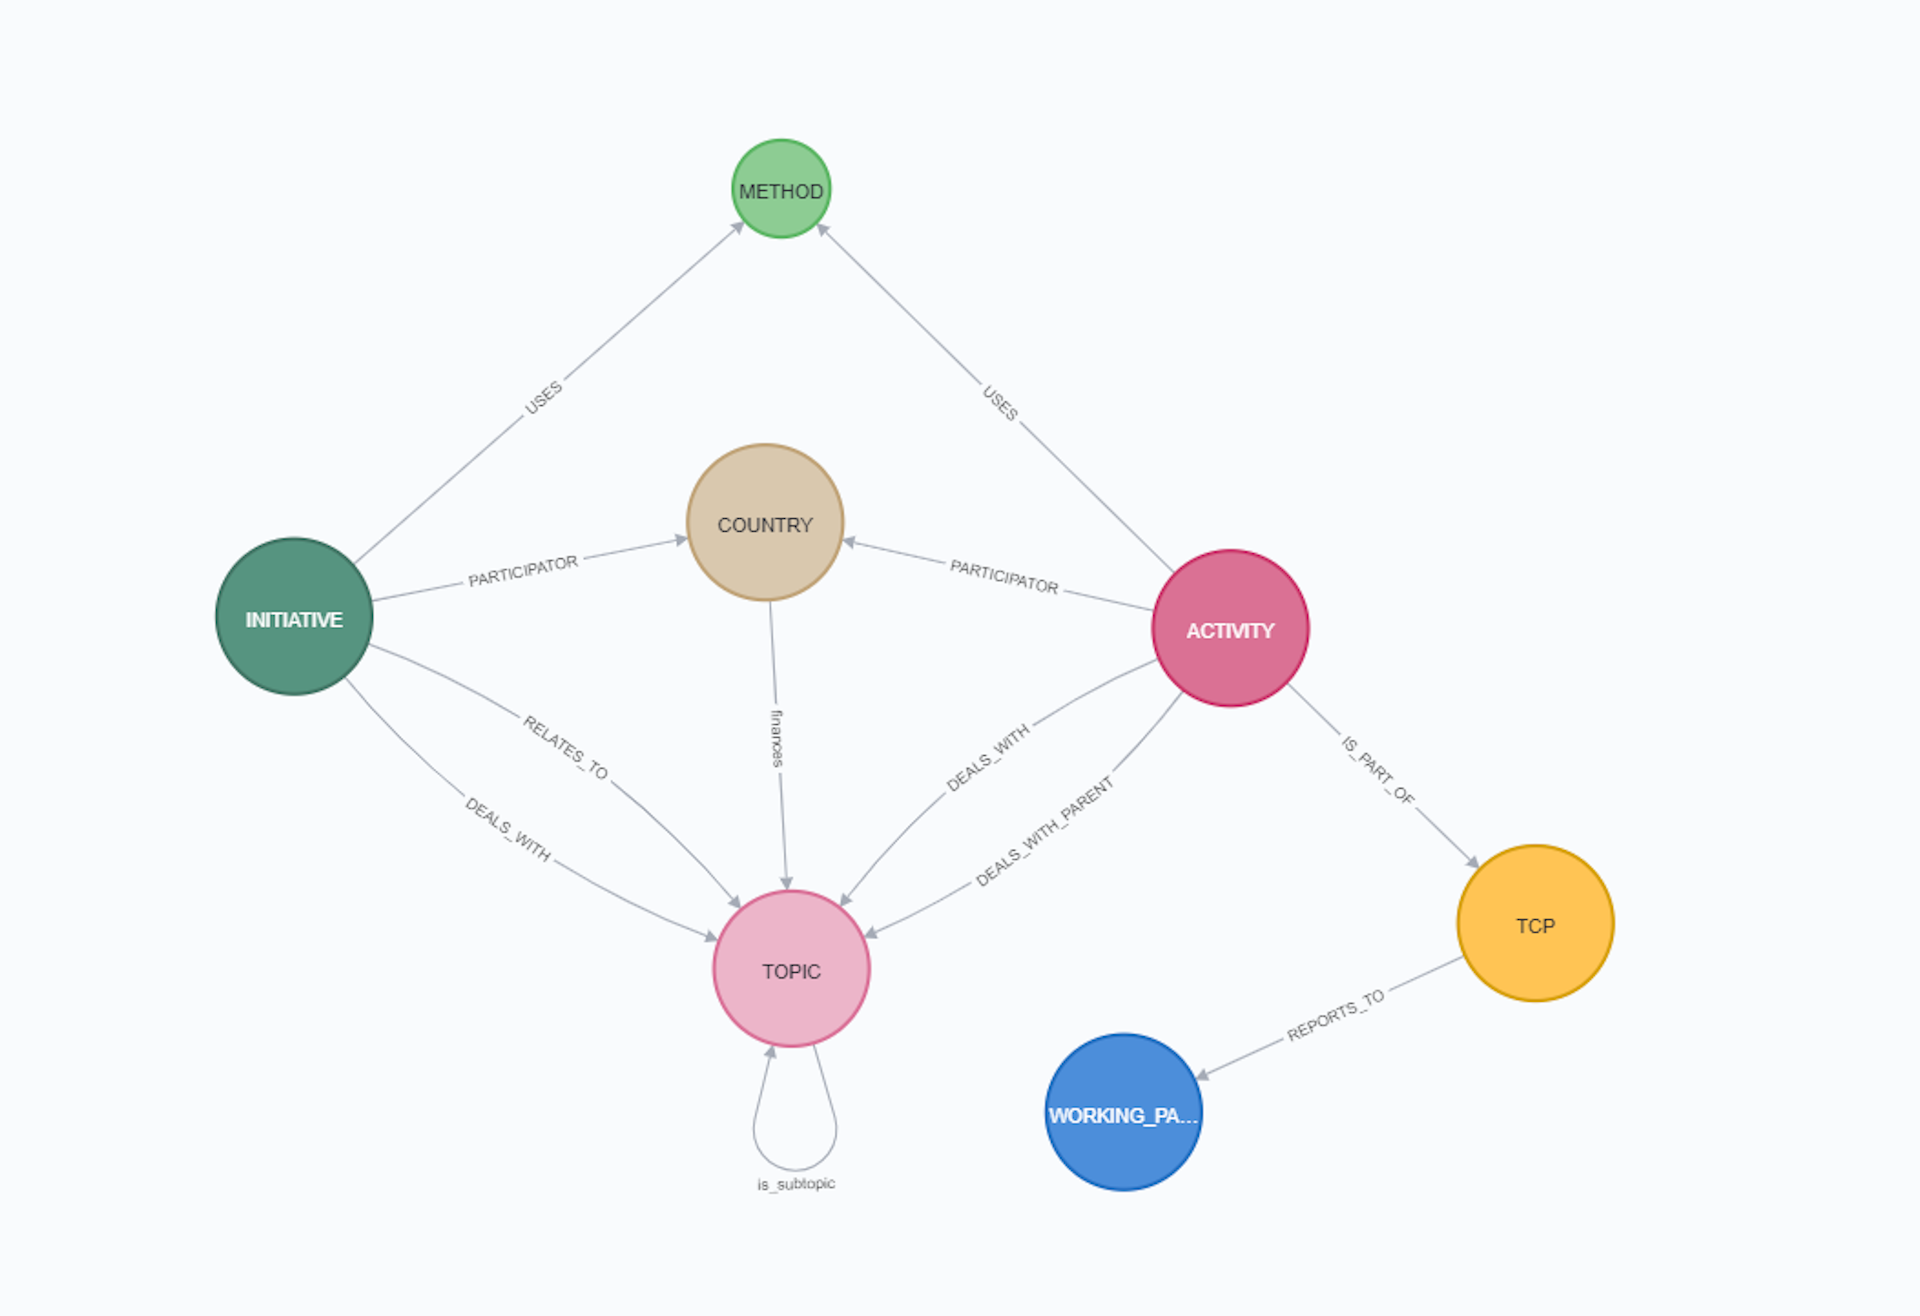
Graph Datastructure
Graphbased datastructure of the open access IEA-TCP dataset.
Copyright: Austrian Energy Agency
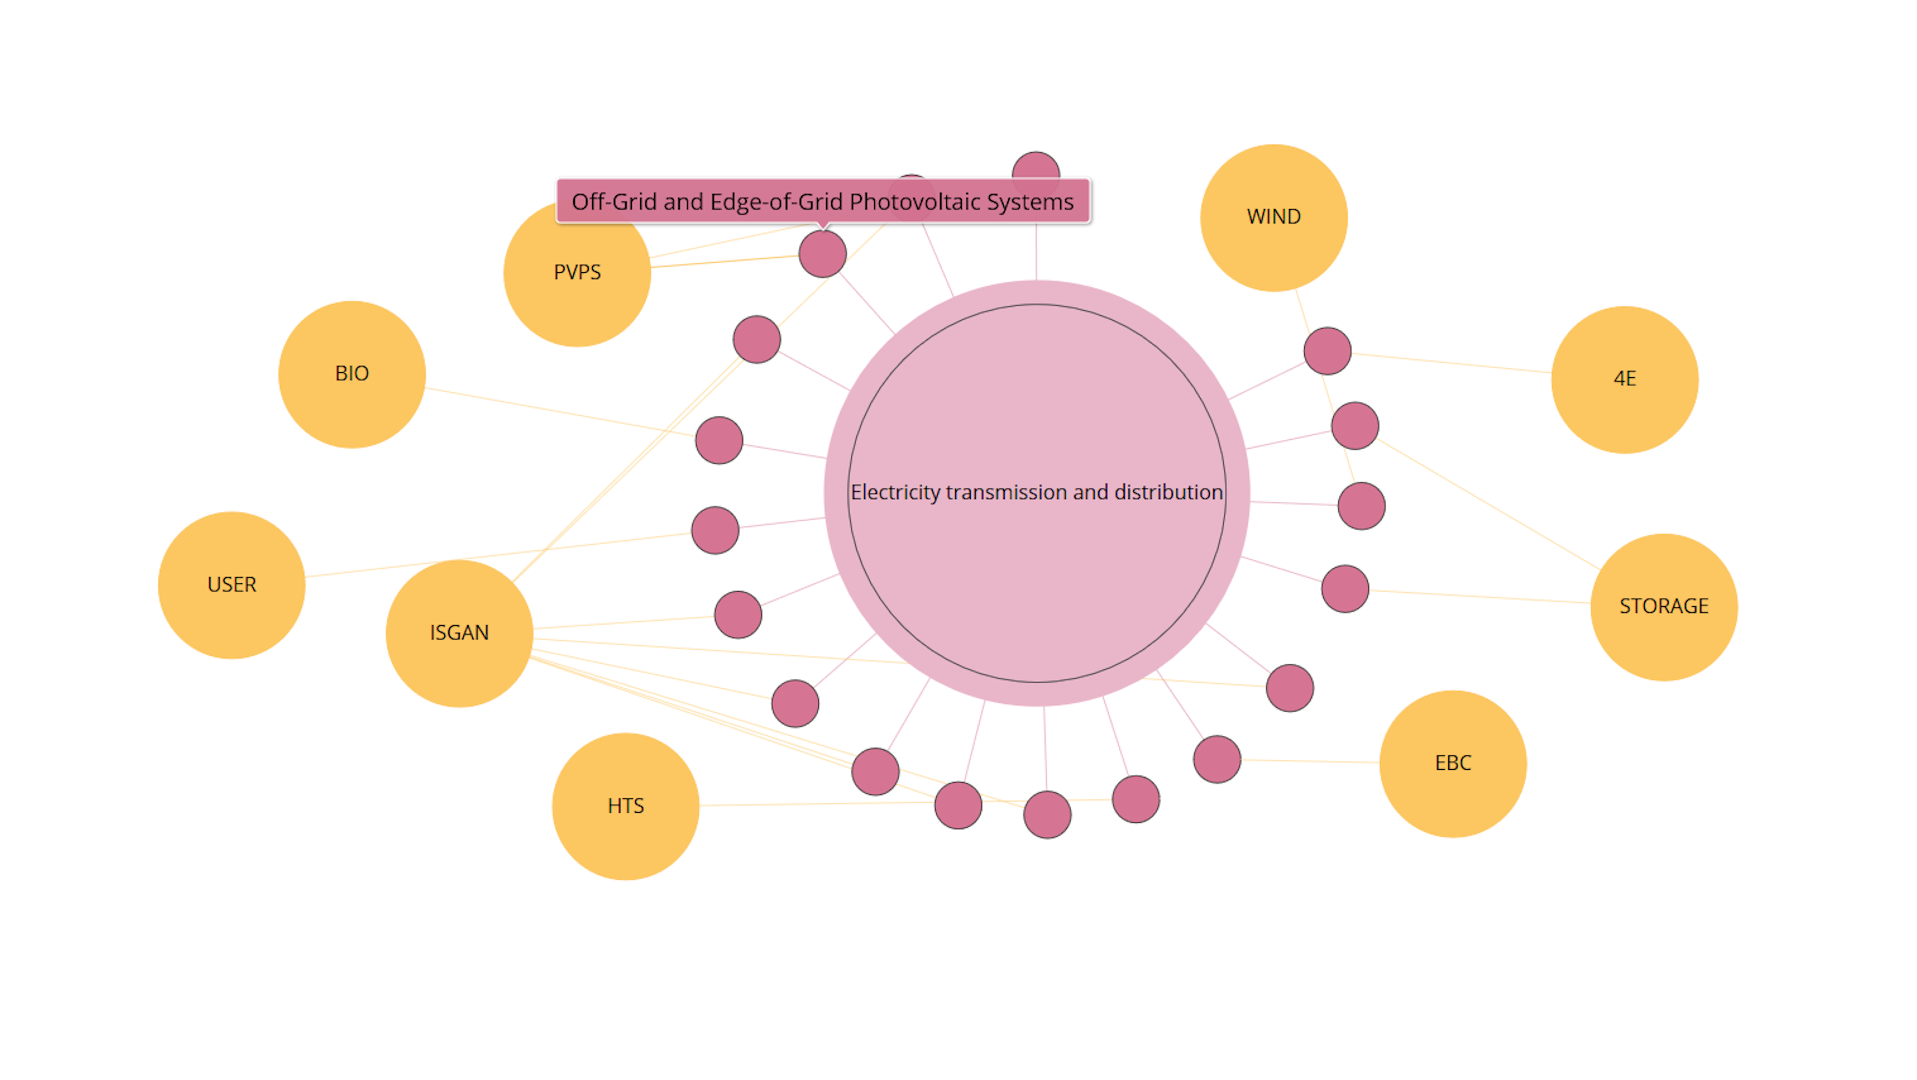
Visualisation of TCPs
After selecting a topic (in this example "Electricity transmission and distribution" was selected), this graph shows all tasks (activities) focussing on the selected topic. The topics are structured according to the IEA energy RD&D budget/expenditure statistics. Additionally, you can see the related Technology Collaboration Programmes (TCPs). Activities which had been ongoing in Summer 2020 from all IEA-TCPs are covered in this analysis. You can re-arrange the different bubbles to better meet the needs of your analysis. If a TCP consists of more than one task (activity), it also contains one entry in the database labelled “ExCo-Activities”. Available at https://nachhaltigwirtschaften.at/en/iea/visualisations/tcps-focussing-on-a-topic.php
Copyright: Austrian Energy Agency
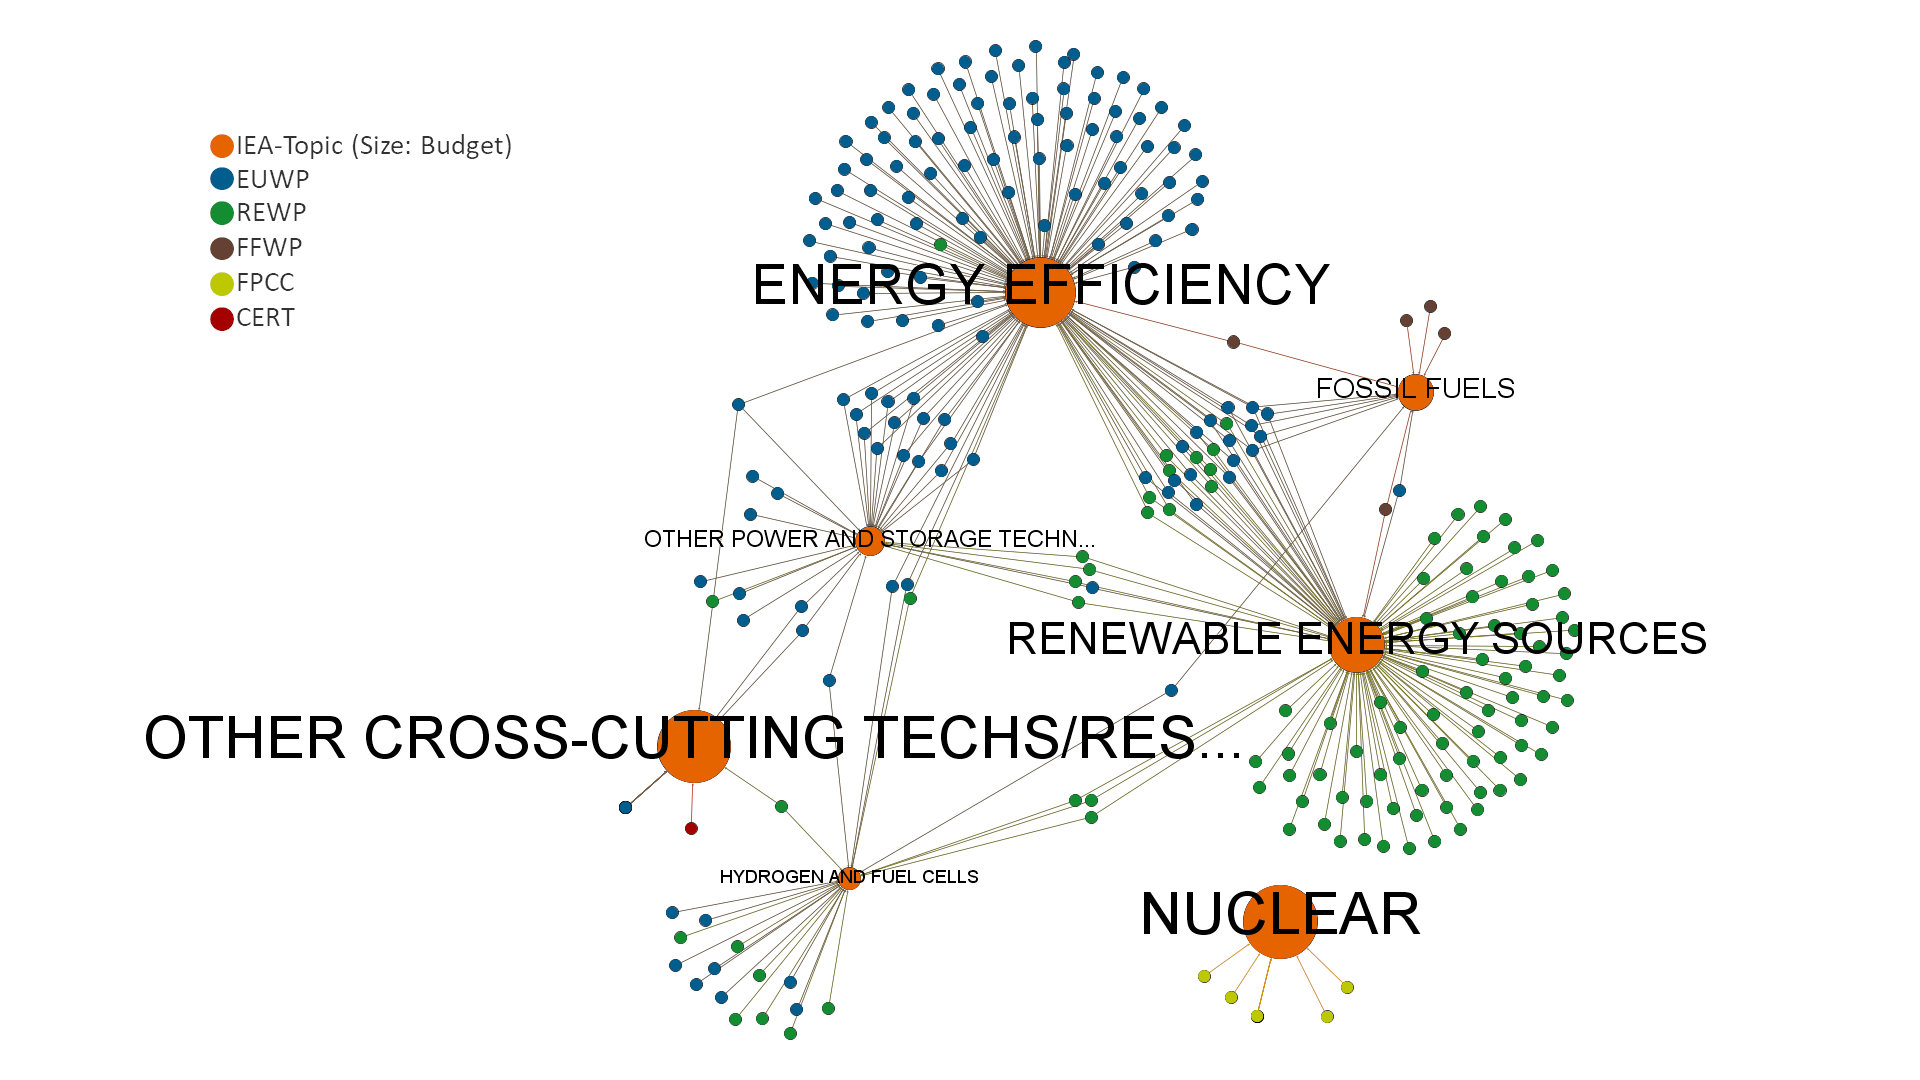
R&D Map
Visualisation of all ongoing Tasks and Annexes ("Activities") and their respective research topics.
Copyright: Austrian Energy Agency
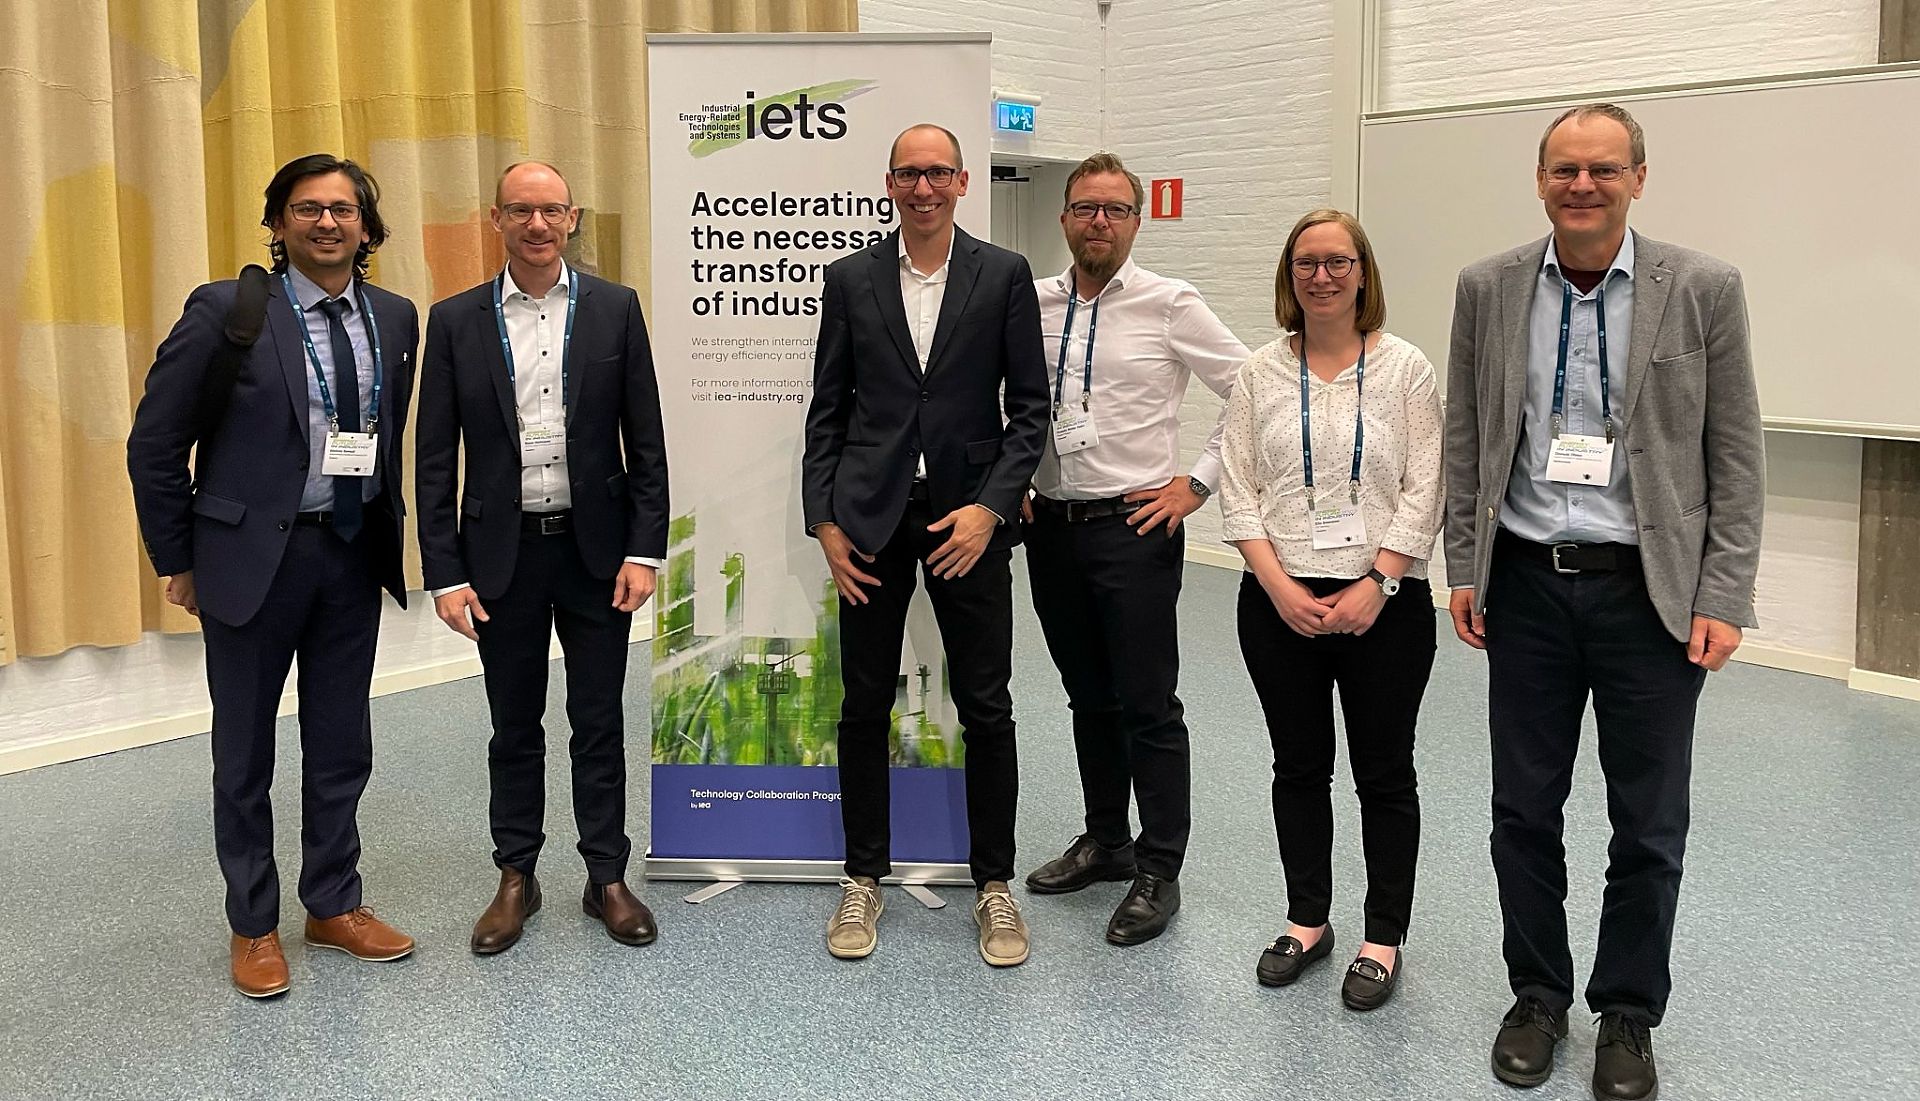
Speakers at the Energy.Future.Industry conference in Gothenburg
Speakers (left to right): Akshay Bansal PhD, Prof. René Hofmann (Lead of Task 18 Subtask 2), Dr. Felix Birkelbach, Fridolin Holm MSc, Dr. Elin Svensson, Dr. Donald Olsen.
Copyright: IEA IETS

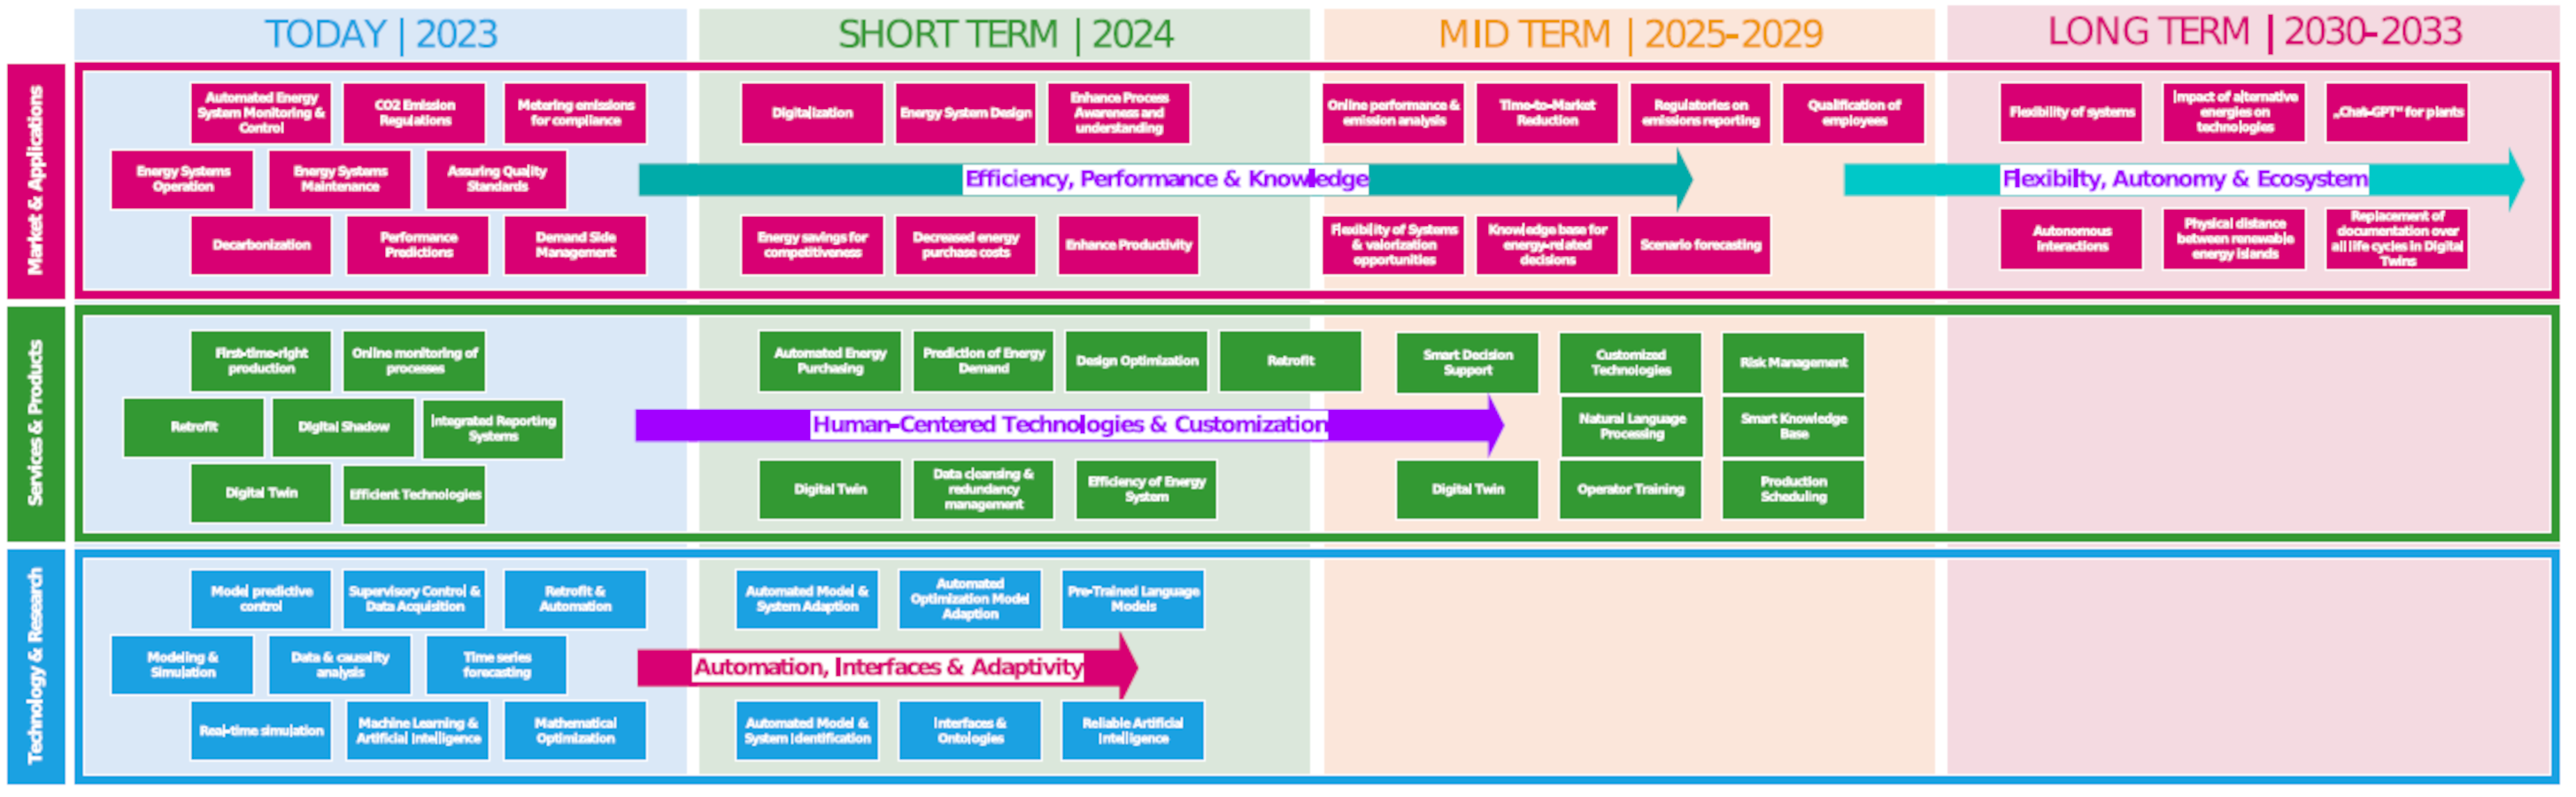
Illustration of the "Roadmap on Digitalization" that was developed in the Annex.
The roadmap shows the keywords with regard to future application areas of digital twins, which were identified during workshops in the Annex.
Copyright: TU Wien
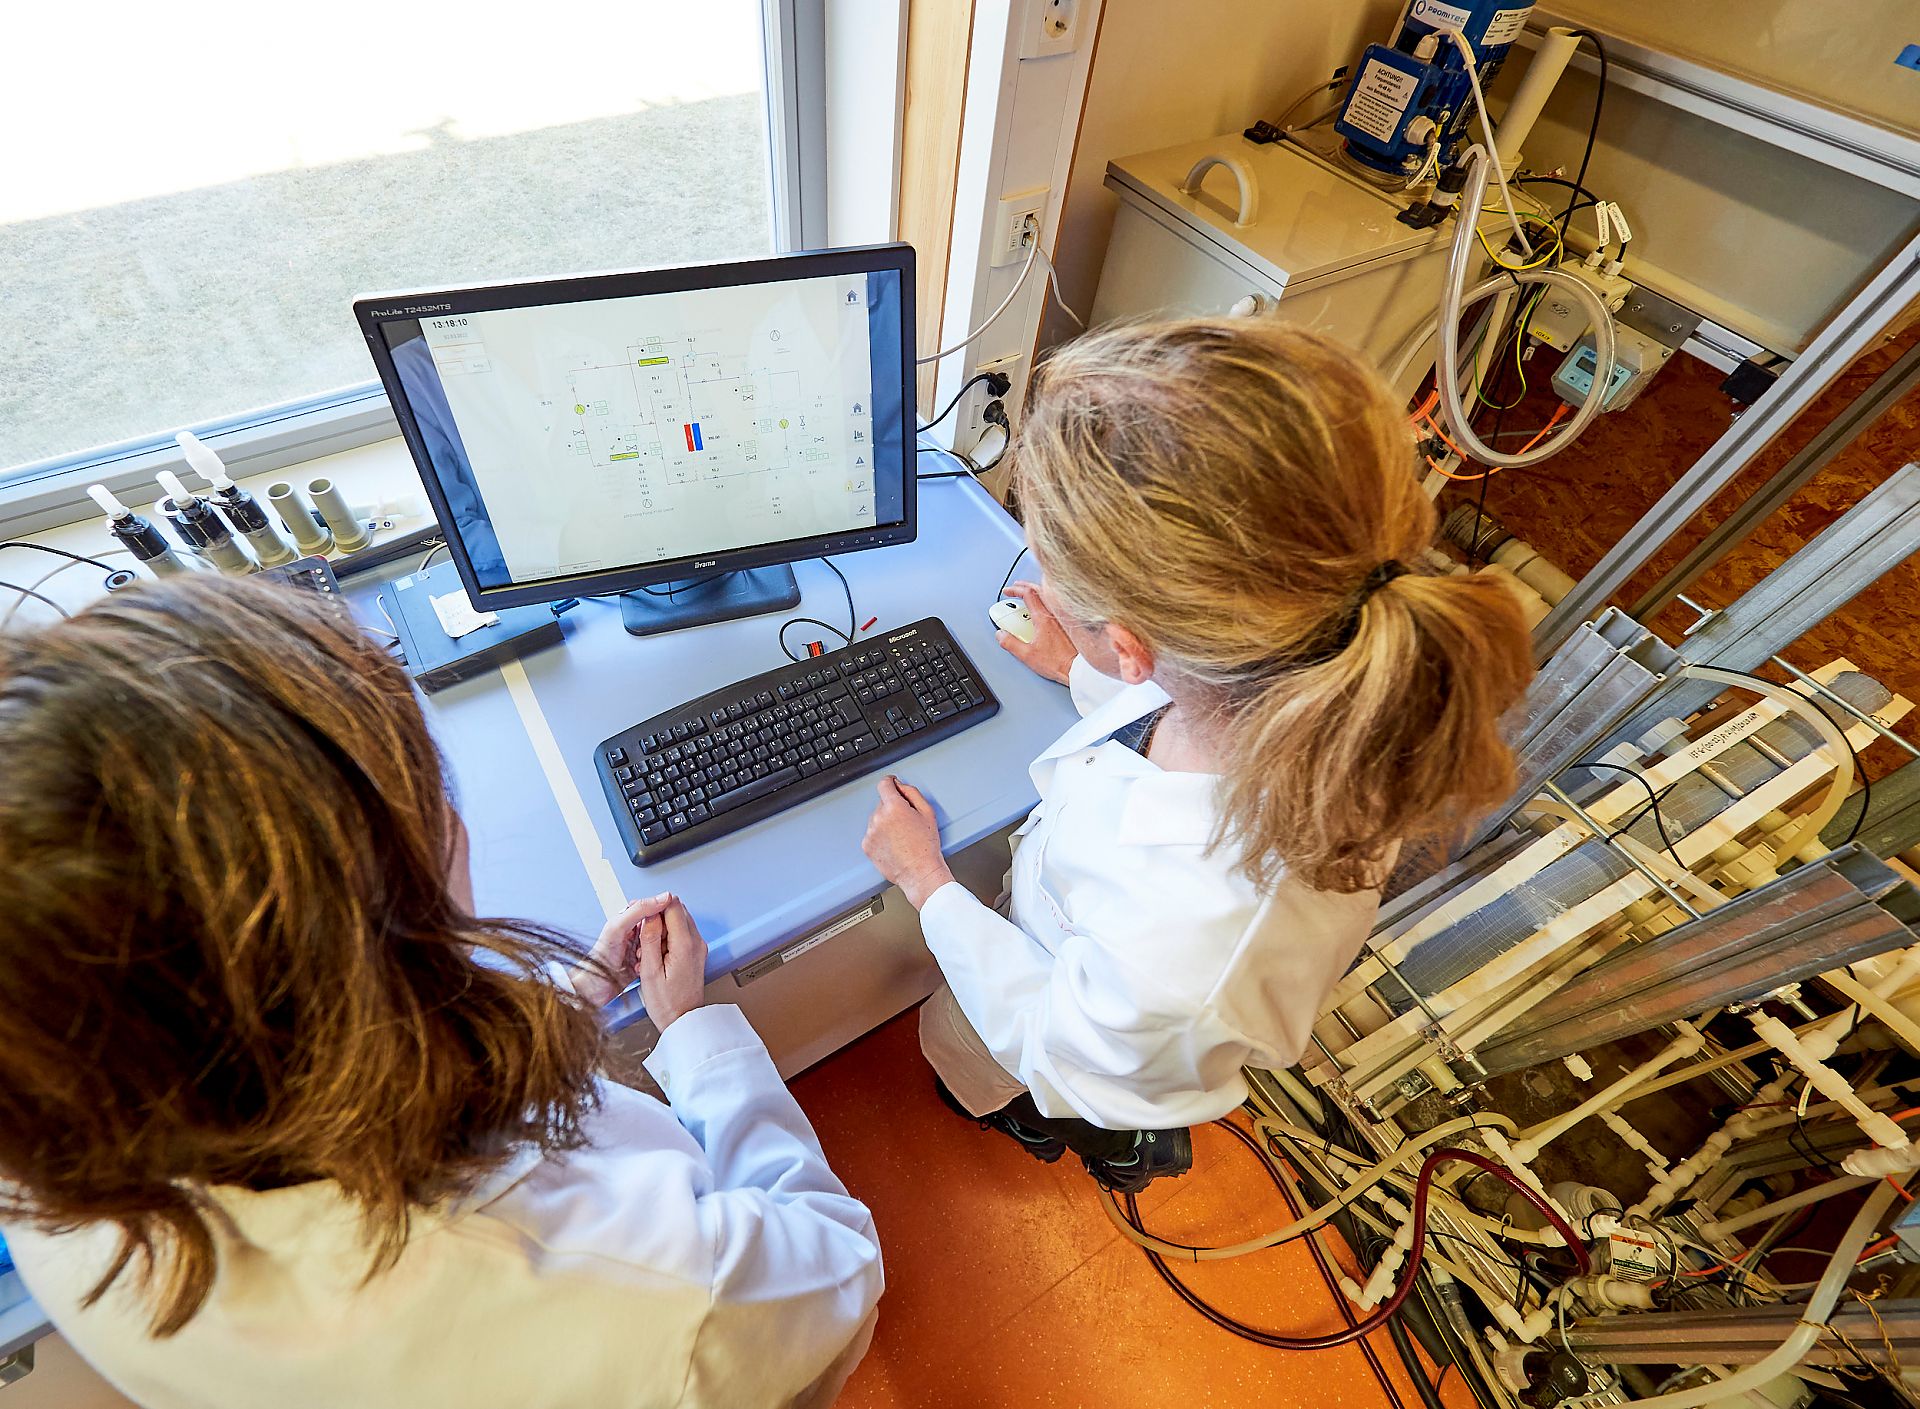
Membrane distillation plant @ AEE INTEC
The membrane distillation plant in the laboratory of AEE INTEC in Gleisdorf offers the possibility to test different types and sizes of membrane modules under varying conditions.
Copyright: ACR/schewig-fotodesign

Membrane tests for the analysis of surface properties
By means of contact angle measurements, the membrane can be analyzed before and after its application and conclusions can be drawn about its functionality and usability.
Copyright: ACR/schewig-fotodesign

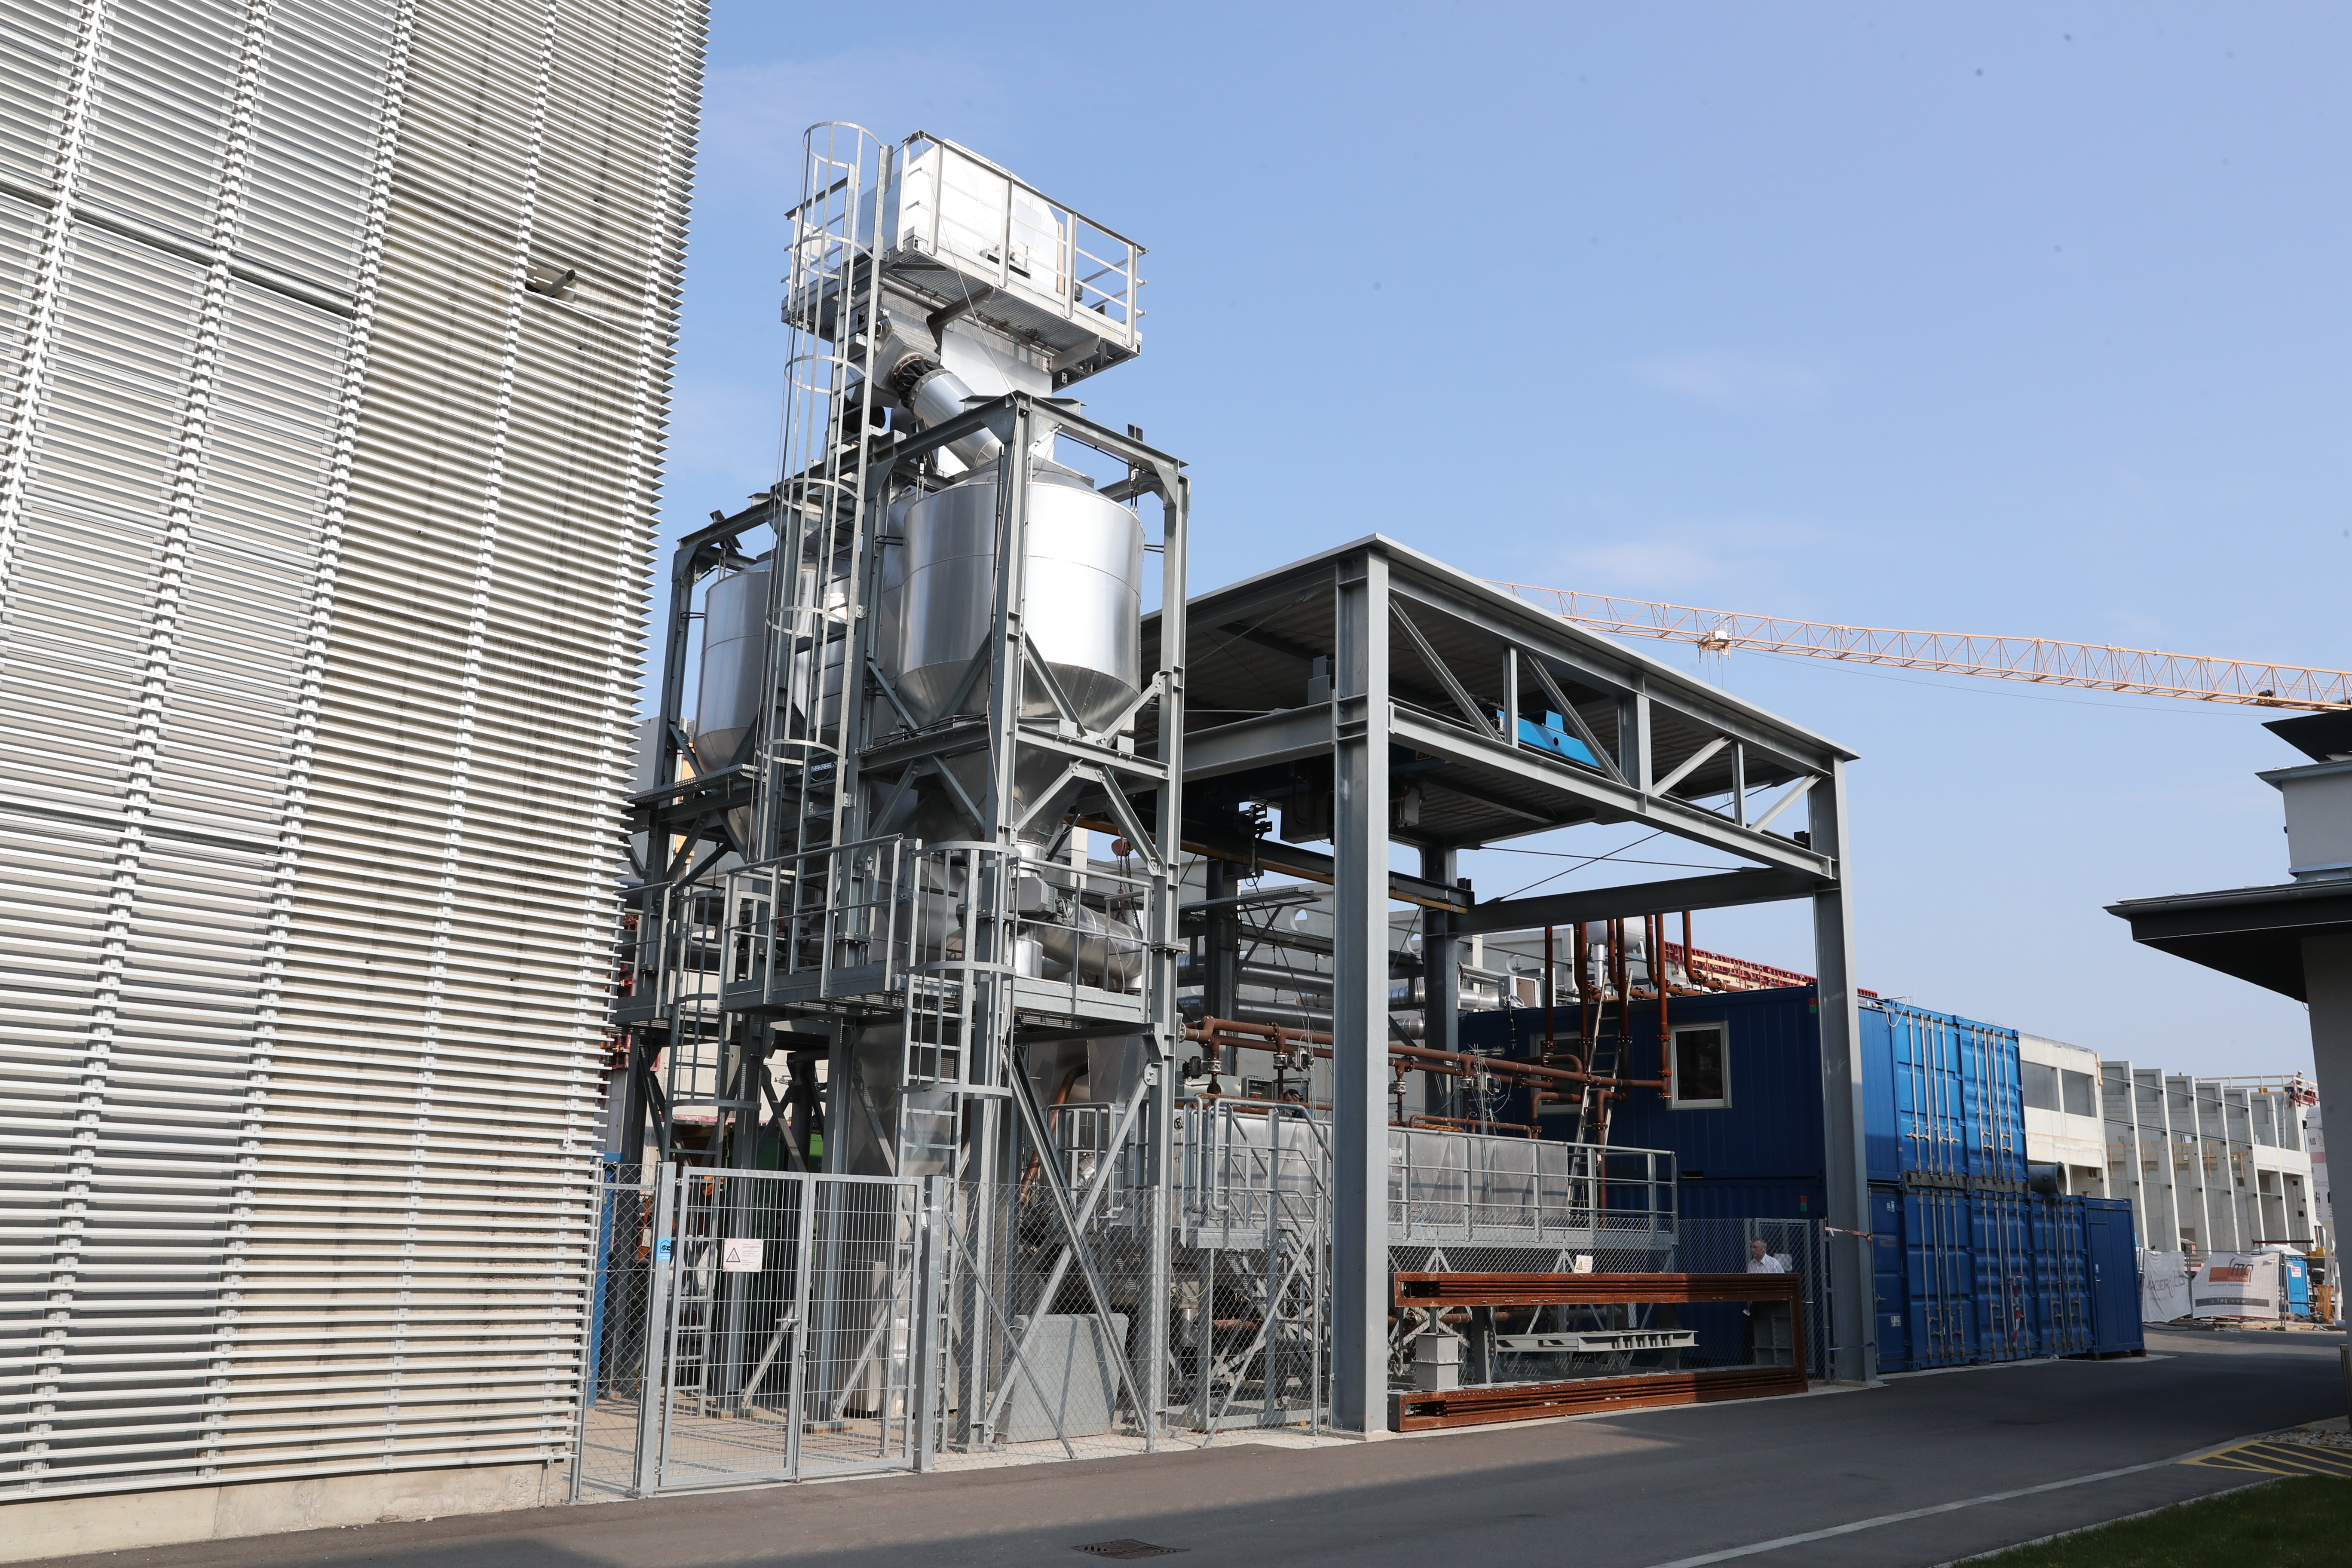
sandTES
active fluidized bed storage "sandTES" of the Institute for Energy Systems and Thermodynamics (TU Wien)
Copyright: Institut für Thermodynamik und Energietechnik, TU Wien
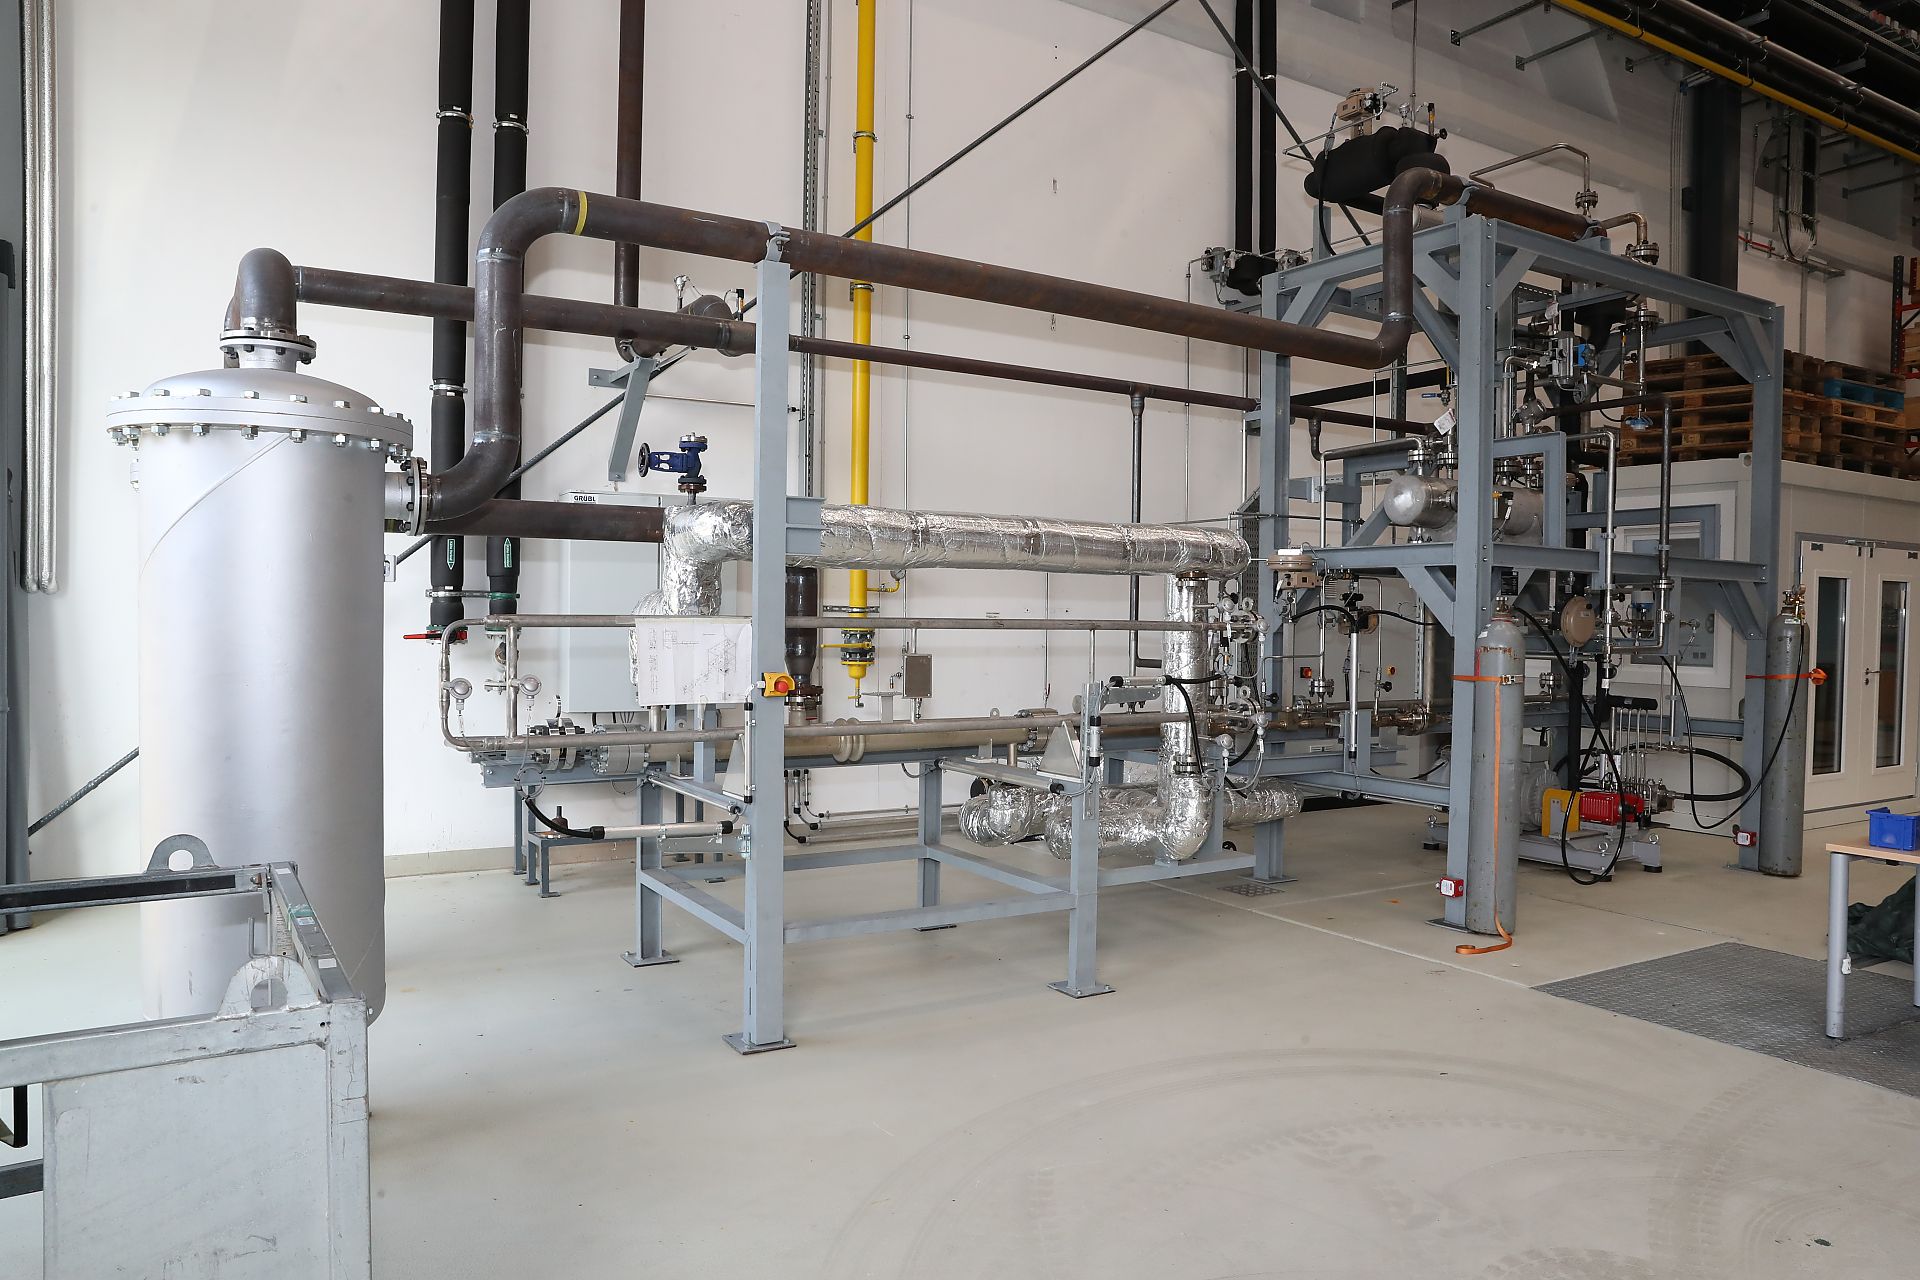
supercritical CO2 cycle
supercritical CO2 cycle for electrification of waste heat at the Institute for Energy Systems and Thermodynamics (TU Wien)
Copyright: Institut für Thermodynamik und Energietechnik, TU Wien
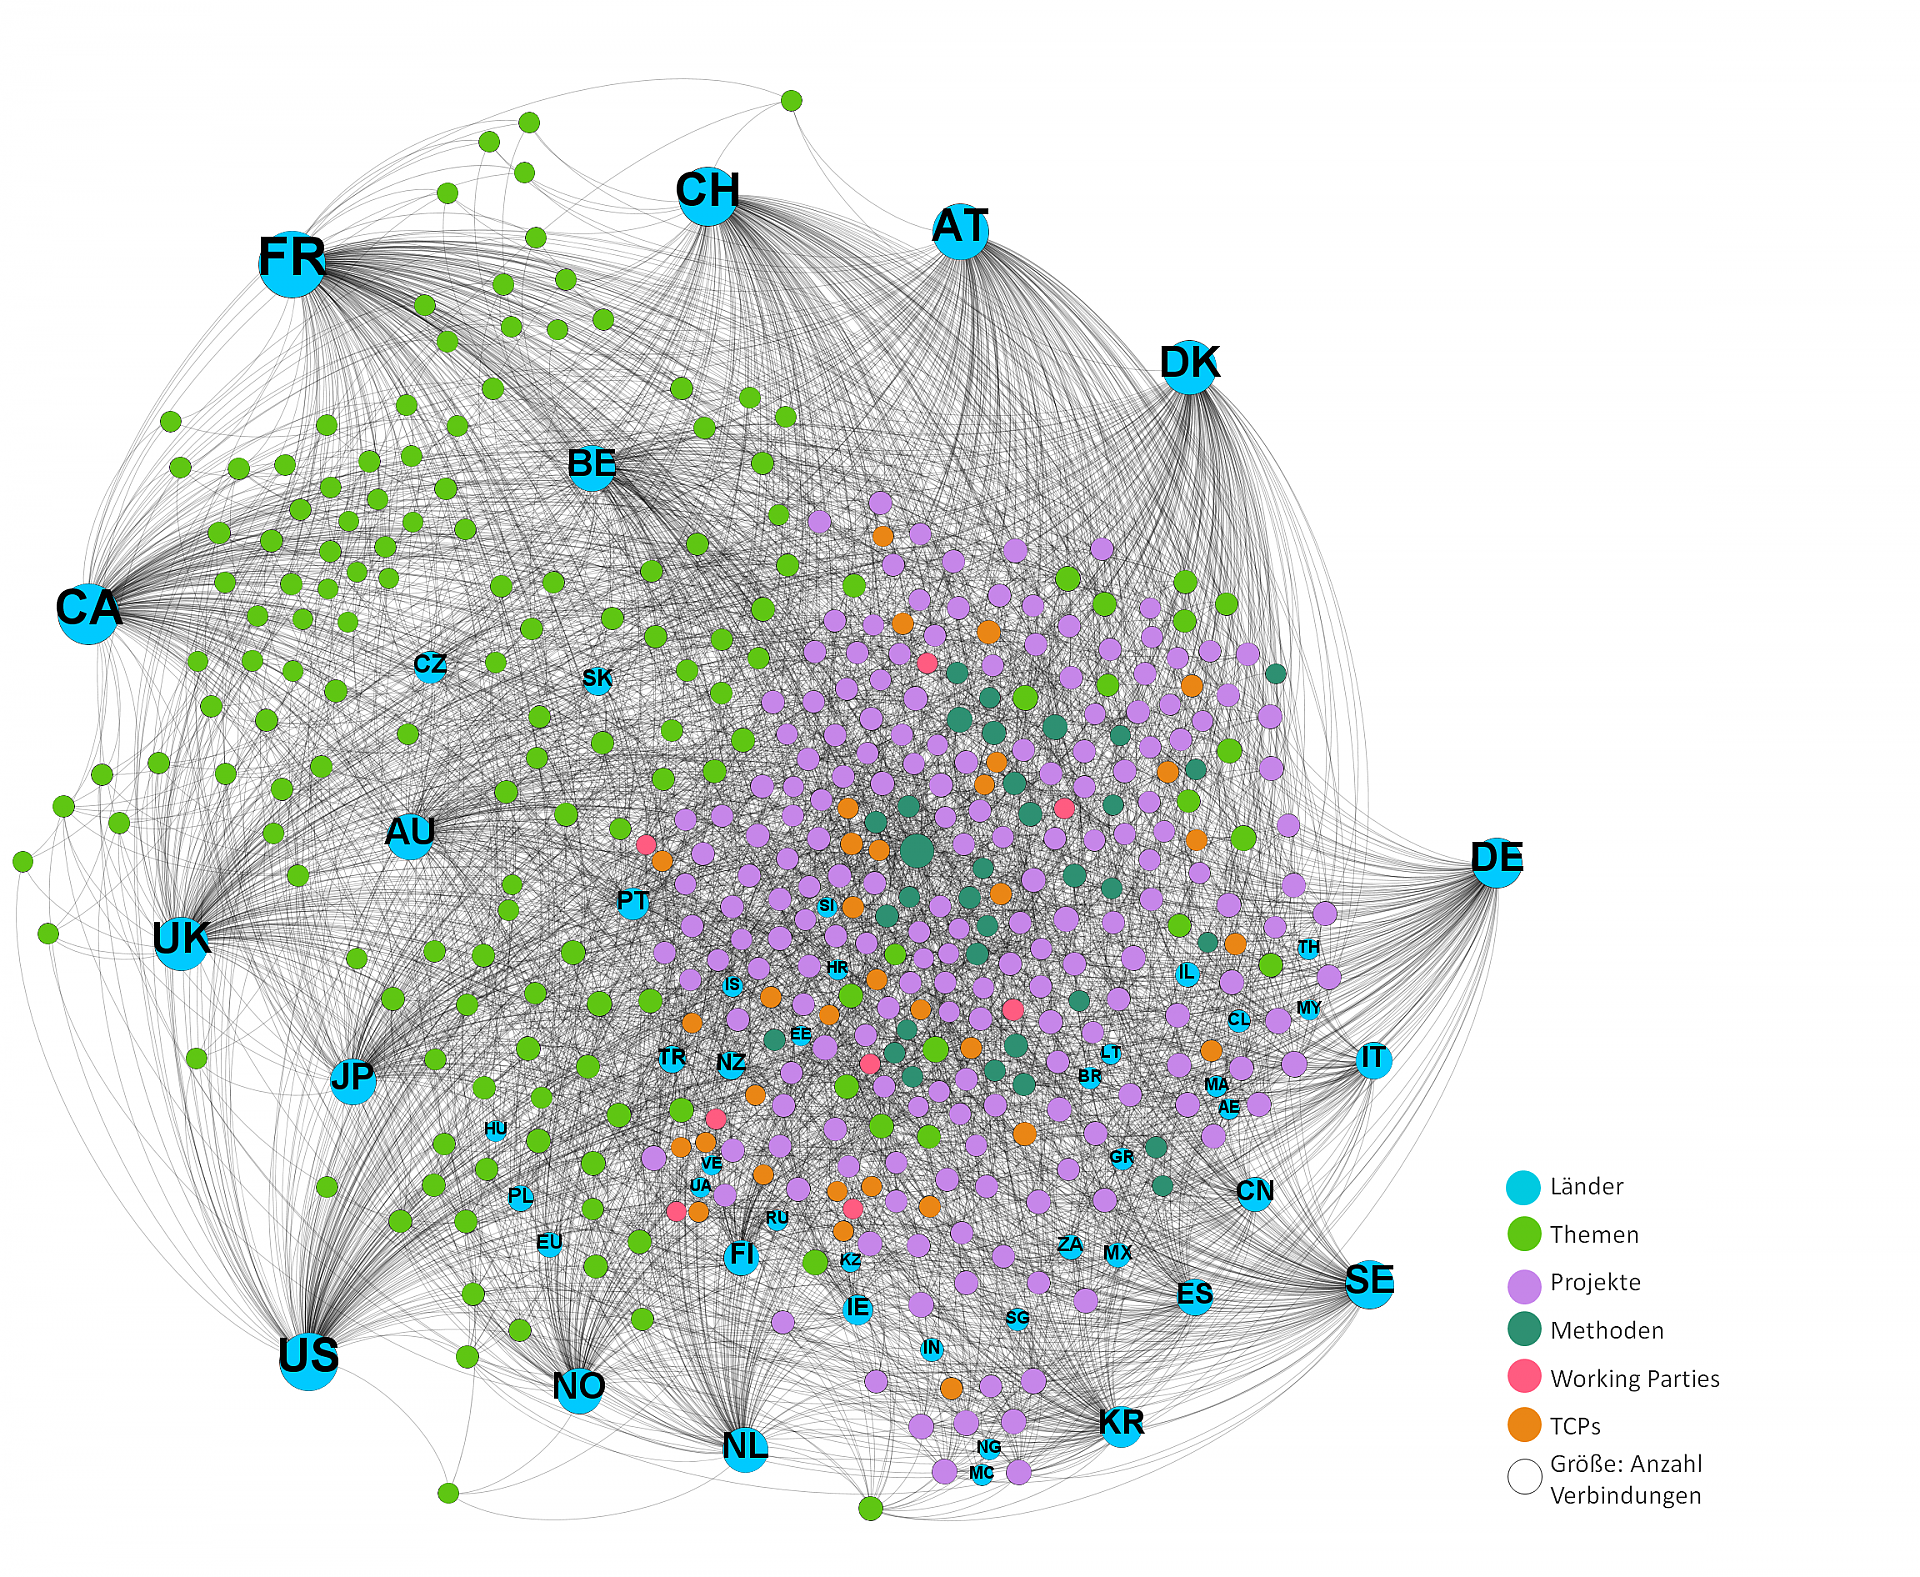
IEA-TCP Graph: Visualization of all nodes and edges in the IEA-TCP data model
Size of the nodes corresponds to the number of connections, color to the type of node (see legend).