Project Image Pool
There are 12 results.
Terms of use: The pictures on this site originate from the projects in the frame of the programmes City of Tomorrow, Building of Tomorrow and the IEA Research Cooperation. They may be used credited for non-commercial purposes under the Creative Commons License Attribution-NonCommercial (CC BY-NC).
Project Overview
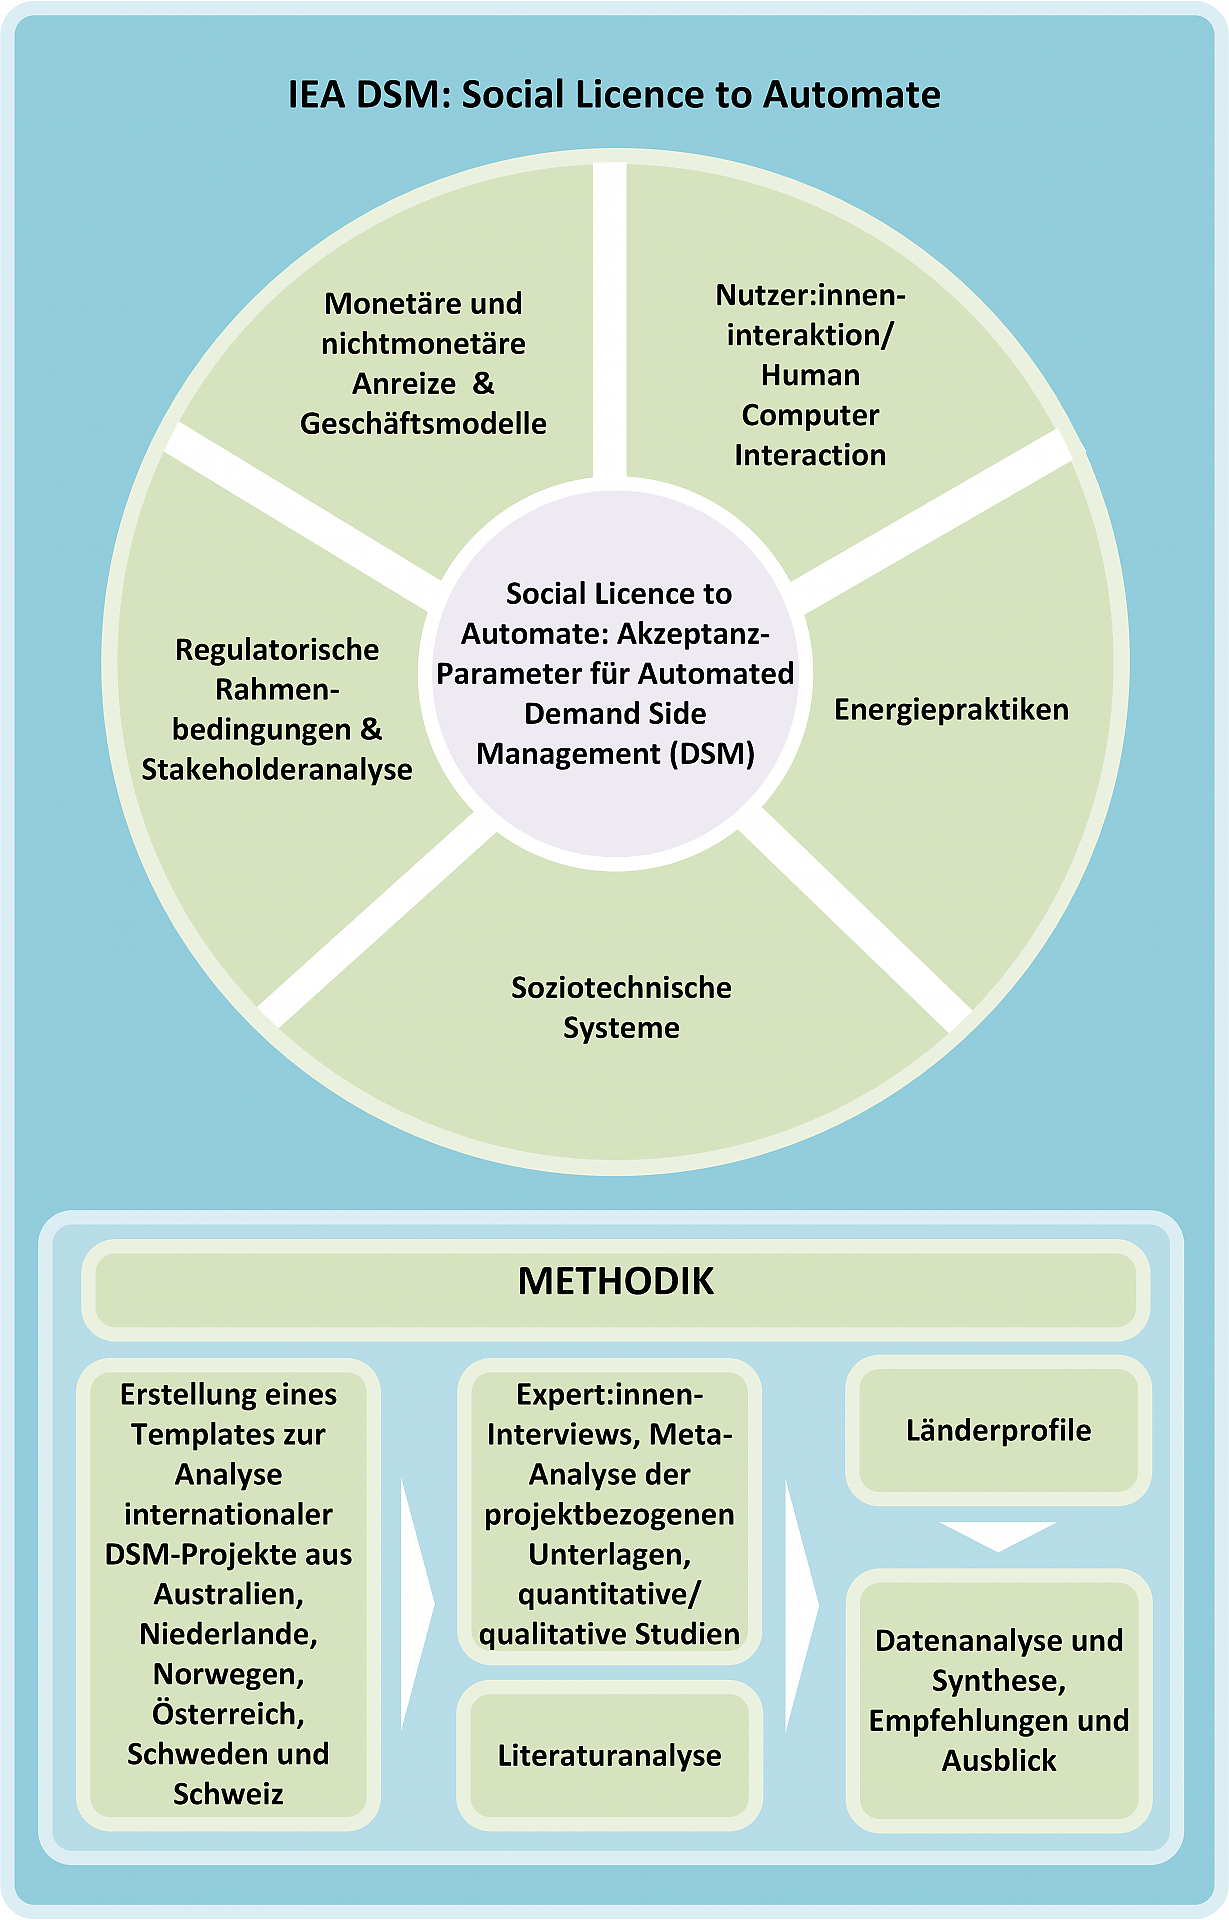
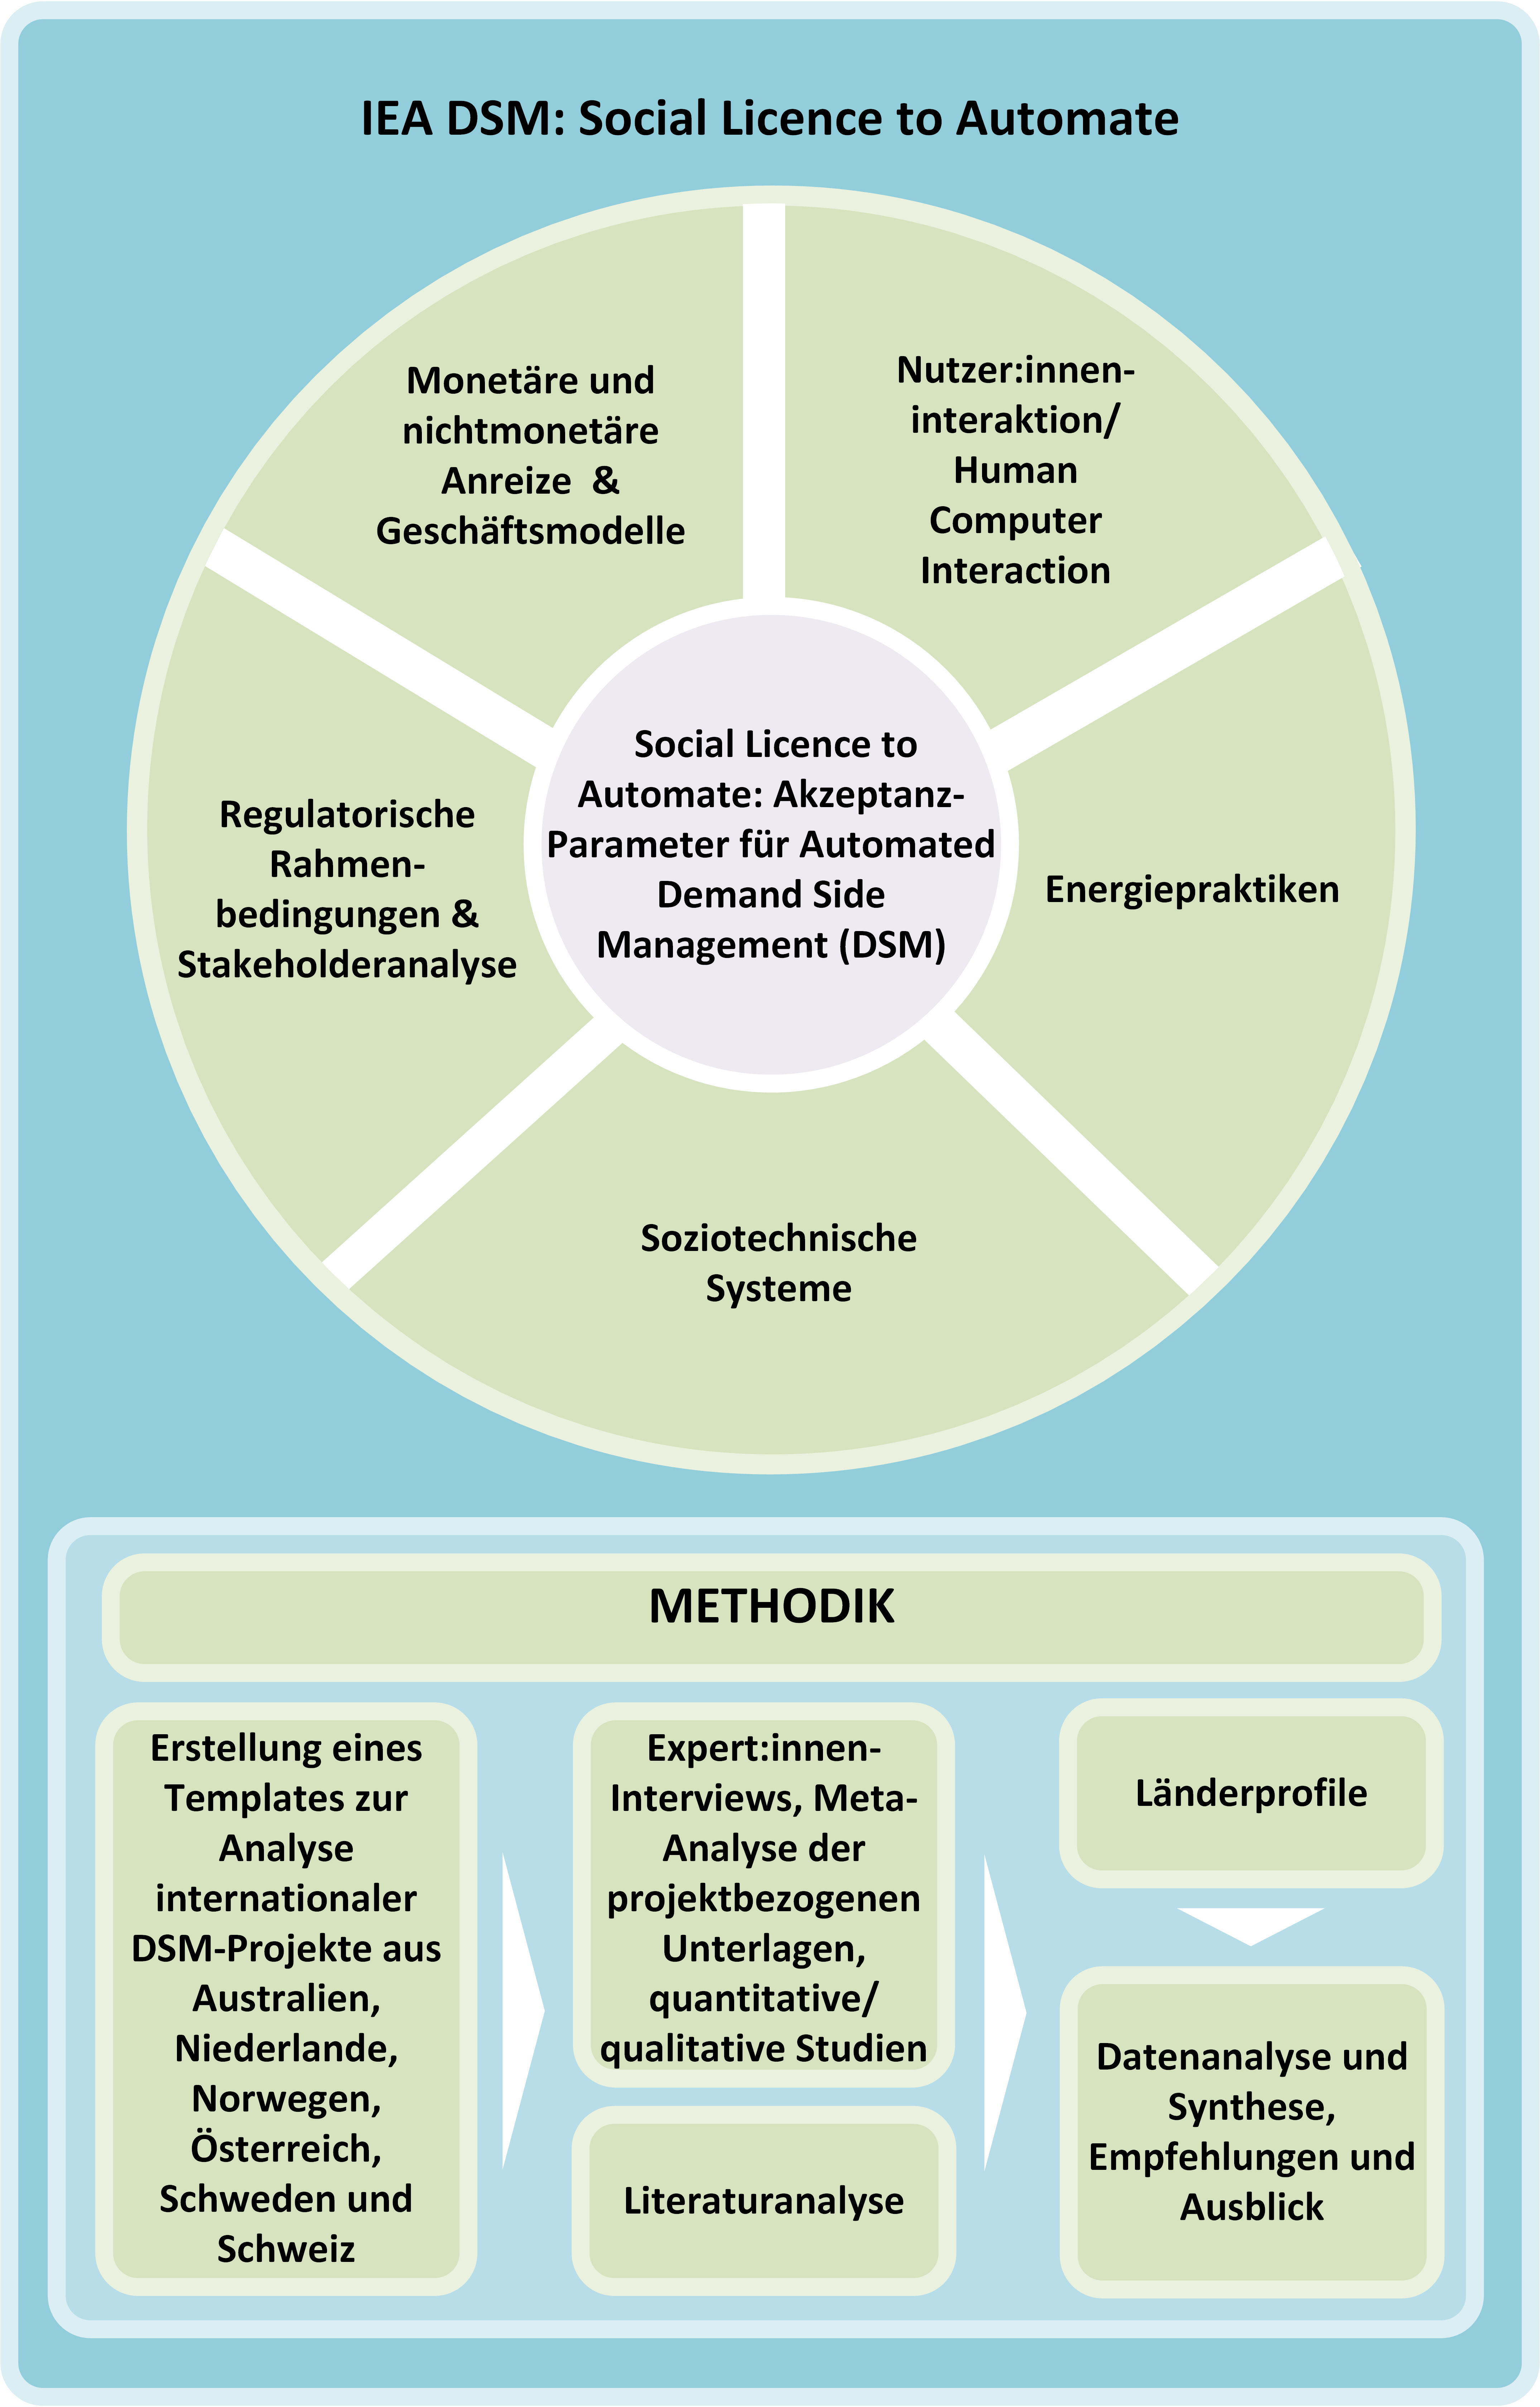
This diagram shows the topics that were considered in the context of the project "Social License to Automate". Furthermore, an overview of the methodology is given.
Copyright: AIT Austrian Institute of Technology GmbH

Business models
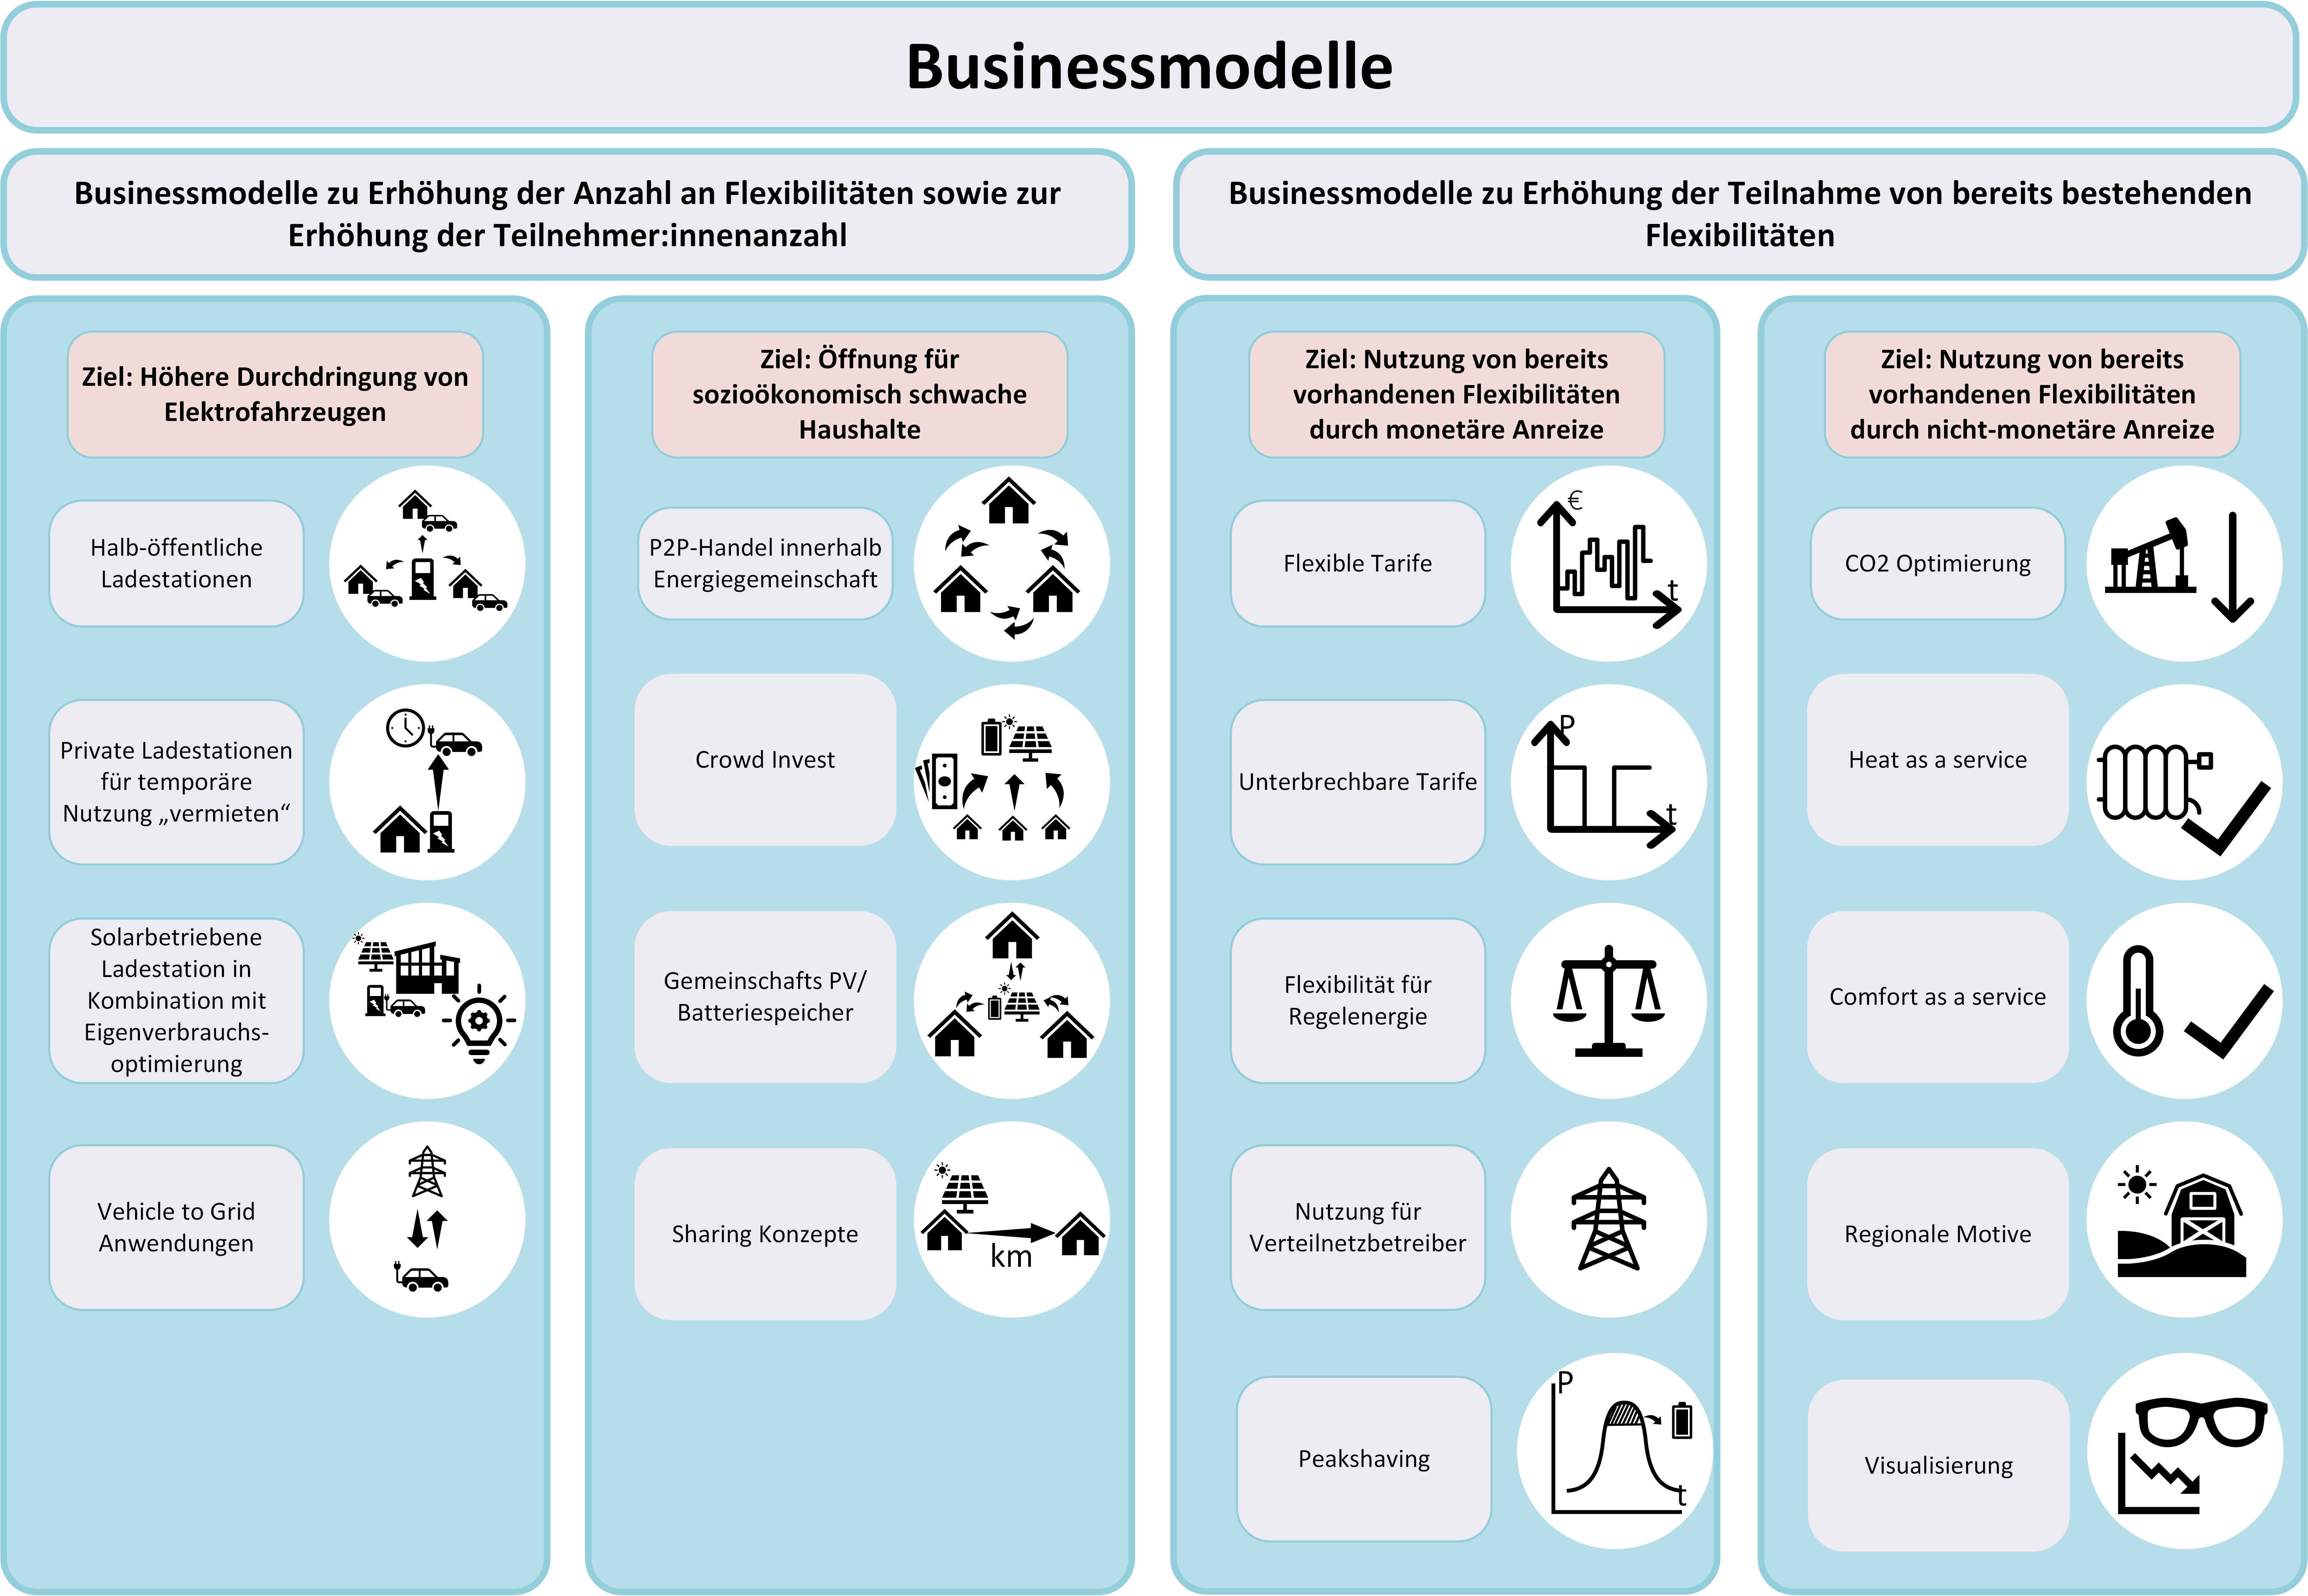
This figure gives an overview of the business models that were considered in the context of the project on various issues related to Demand Side Management (DSM). A more detailed description of the individual models can be found in the final report.
Copyright: AIT Austrian Institute of Technology GmbH
Central Characteristics of Energy Communities and Their Interactions
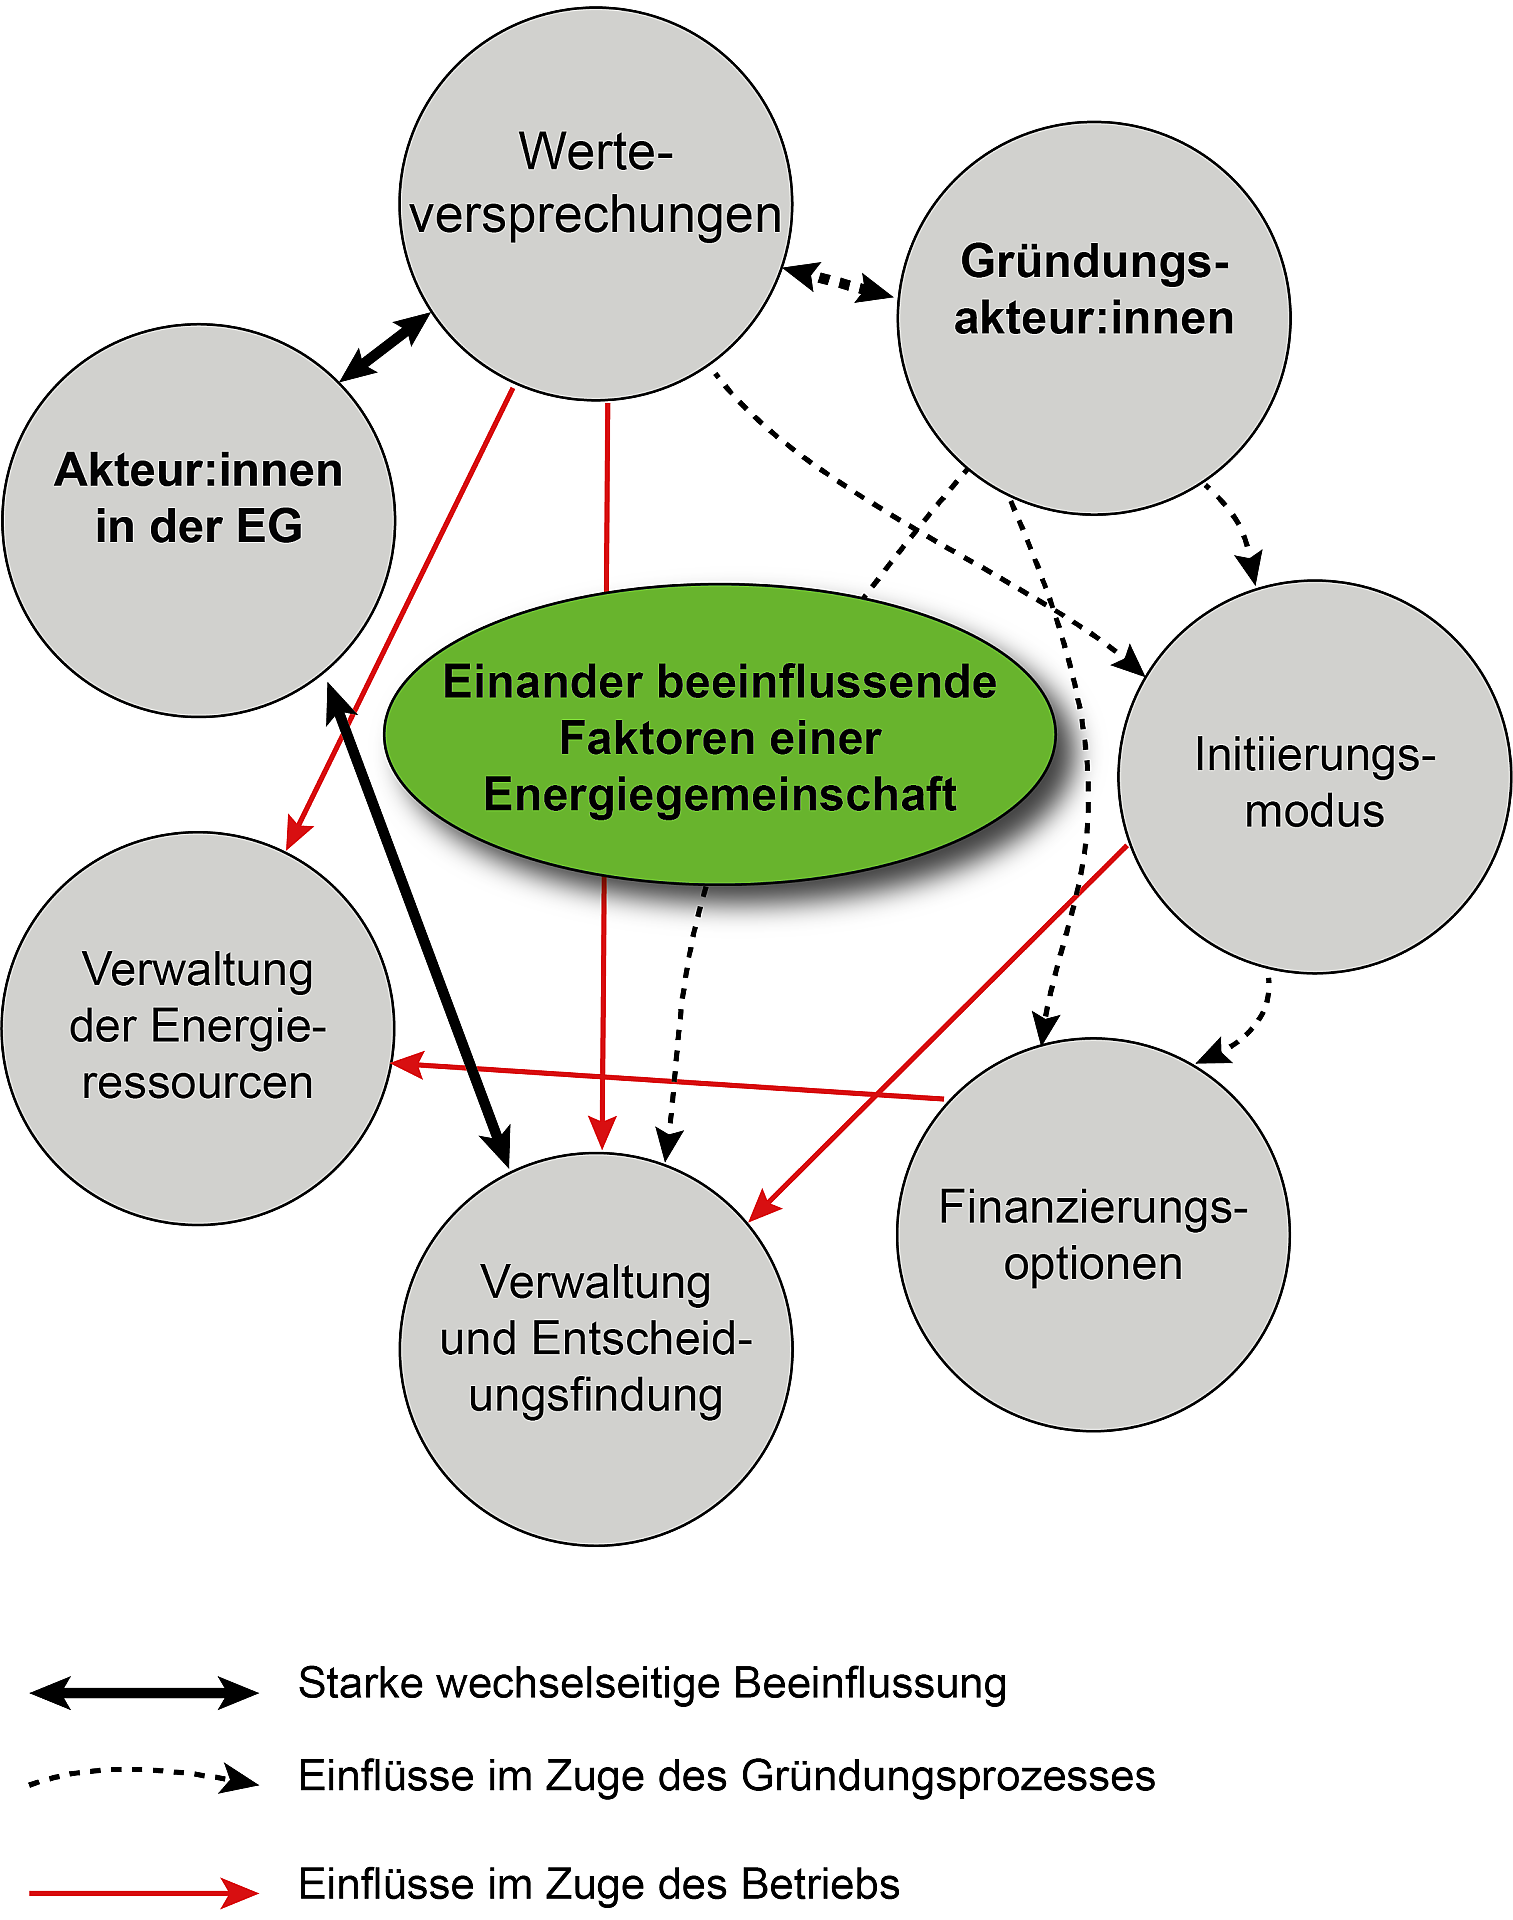
Representation of the central characteristics of energy communities (ECs) and their interrelationships. A strong mutual influence is found between the actors of the EC and the management and decision-making processes, as well as between the actors and value propositions. Influences during the founding process occur between value propositions and founding actors, value propositions and the initiation mode, and founding actors on the initiation mode, funding options, and management and decision-making. Operational influences include the impact of value propositions on the management of energy resources and general management and decision-making, as well as the influence of the initiation mode on management and decision-making, and of funding options on the management of energy resources.
Copyright: SLA2.0
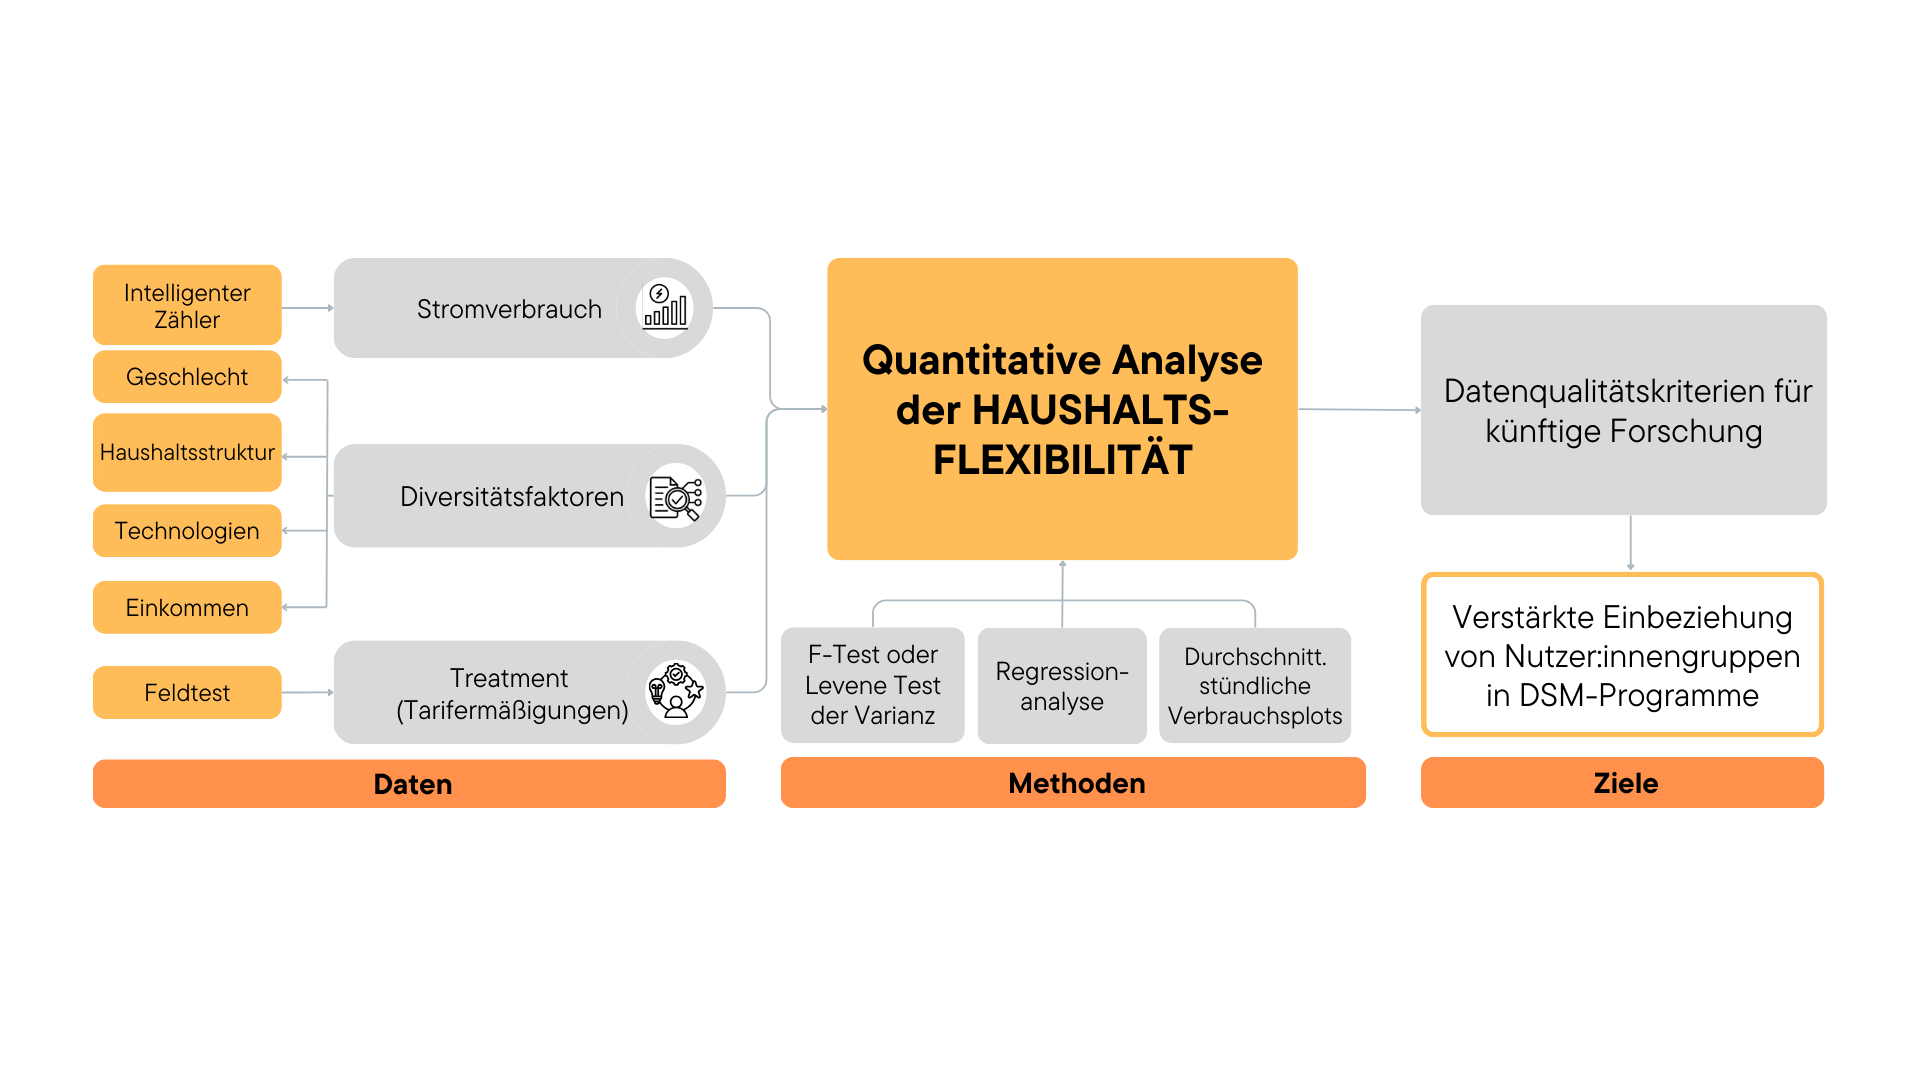
Analysis of Gender and Diversity Factors in Relation to Energy Consumption Flexibility
The graphic provides an overview of the approach to the quantitative analysis of household flexibility and the conclusions derived from it. Electricity consumption, recorded via smart meters, was combined with diversity dimensions and associated aspects such as gender, household structure, income, and available technologies. Treatments implemented during field tests, such as tariff reductions for peak load reductions, were documented in the dataset. Quantitative methods, including F-tests or Levene's test for variance, regression analysis, and plots of average consumption, were used to gain insights into consumption patterns and identify diversity-specific differences. Building on these findings, data quality criteria for future research were formulated, and a stronger inclusion of diverse user groups in demand-side management (DSM) programs was recommended.
Copyright: SLA2.0
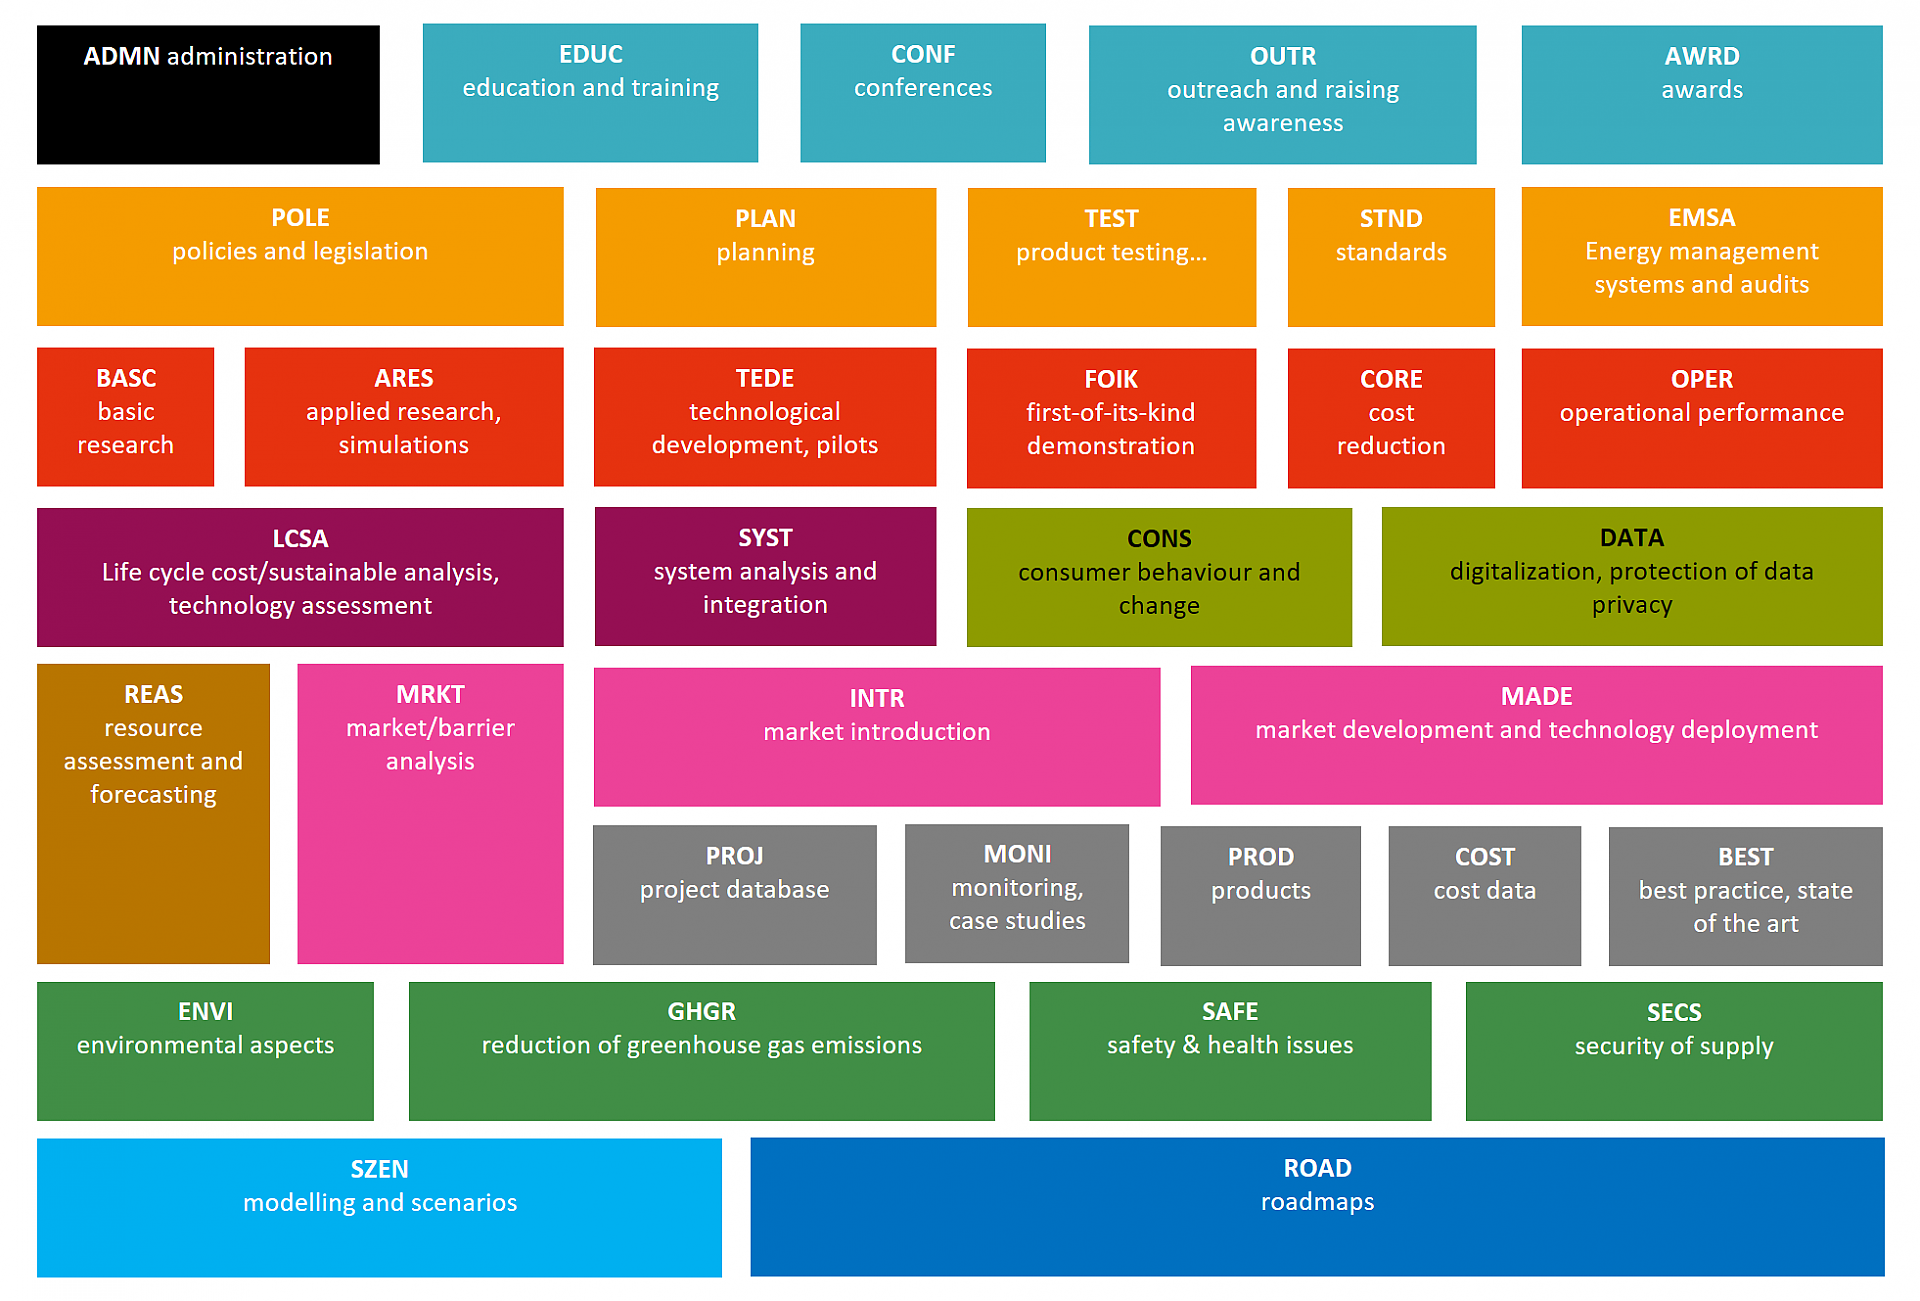
Methods
Set of methods to classify the type of activity of TCP Tasks and Annexes.
Copyright: Austrian Energy Agency
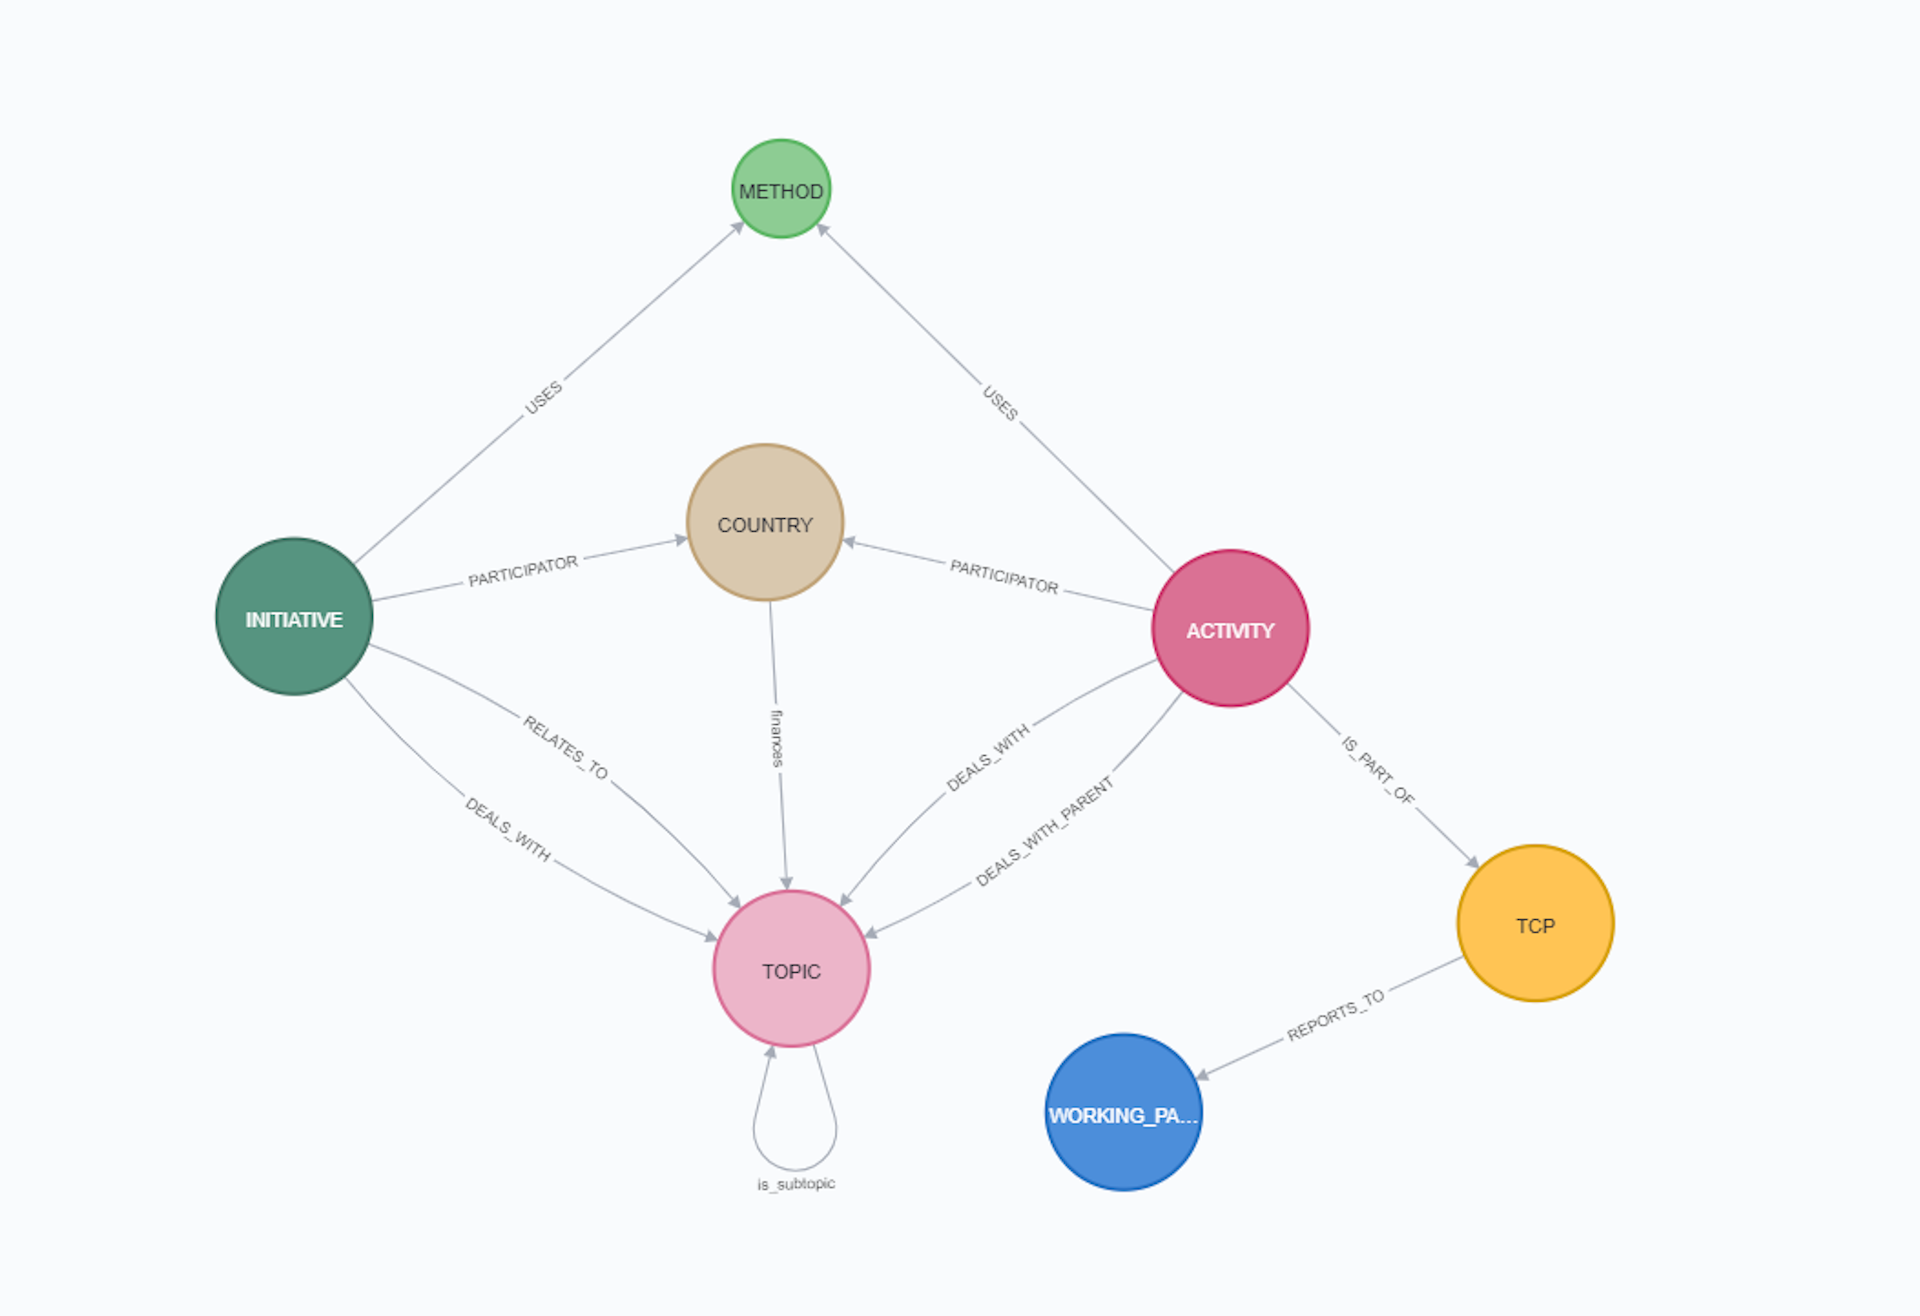
Graph Datastructure
Graphbased datastructure of the open access IEA-TCP dataset.
Copyright: Austrian Energy Agency
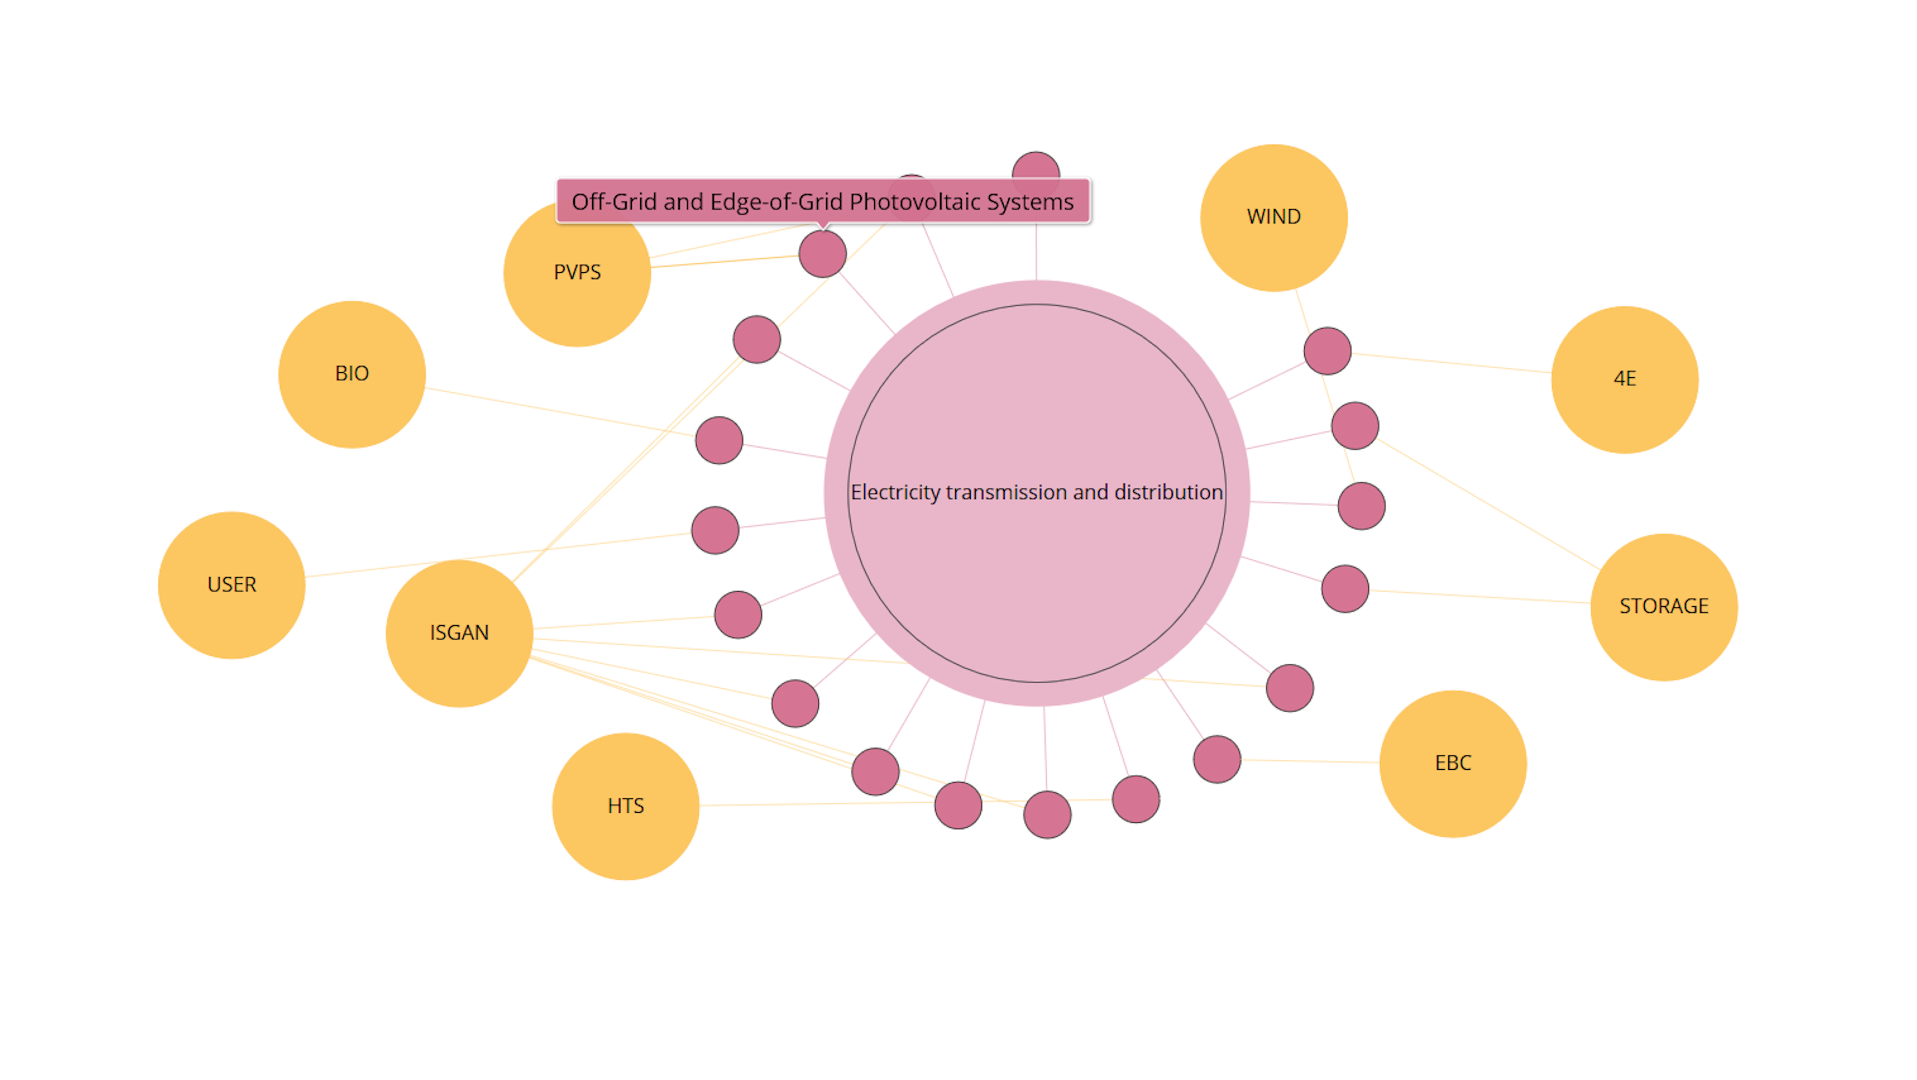
Visualisation of TCPs
After selecting a topic (in this example "Electricity transmission and distribution" was selected), this graph shows all tasks (activities) focussing on the selected topic. The topics are structured according to the IEA energy RD&D budget/expenditure statistics. Additionally, you can see the related Technology Collaboration Programmes (TCPs). Activities which had been ongoing in Summer 2020 from all IEA-TCPs are covered in this analysis. You can re-arrange the different bubbles to better meet the needs of your analysis. If a TCP consists of more than one task (activity), it also contains one entry in the database labelled “ExCo-Activities”. Available at https://nachhaltigwirtschaften.at/en/iea/visualisations/tcps-focussing-on-a-topic.php
Copyright: Austrian Energy Agency
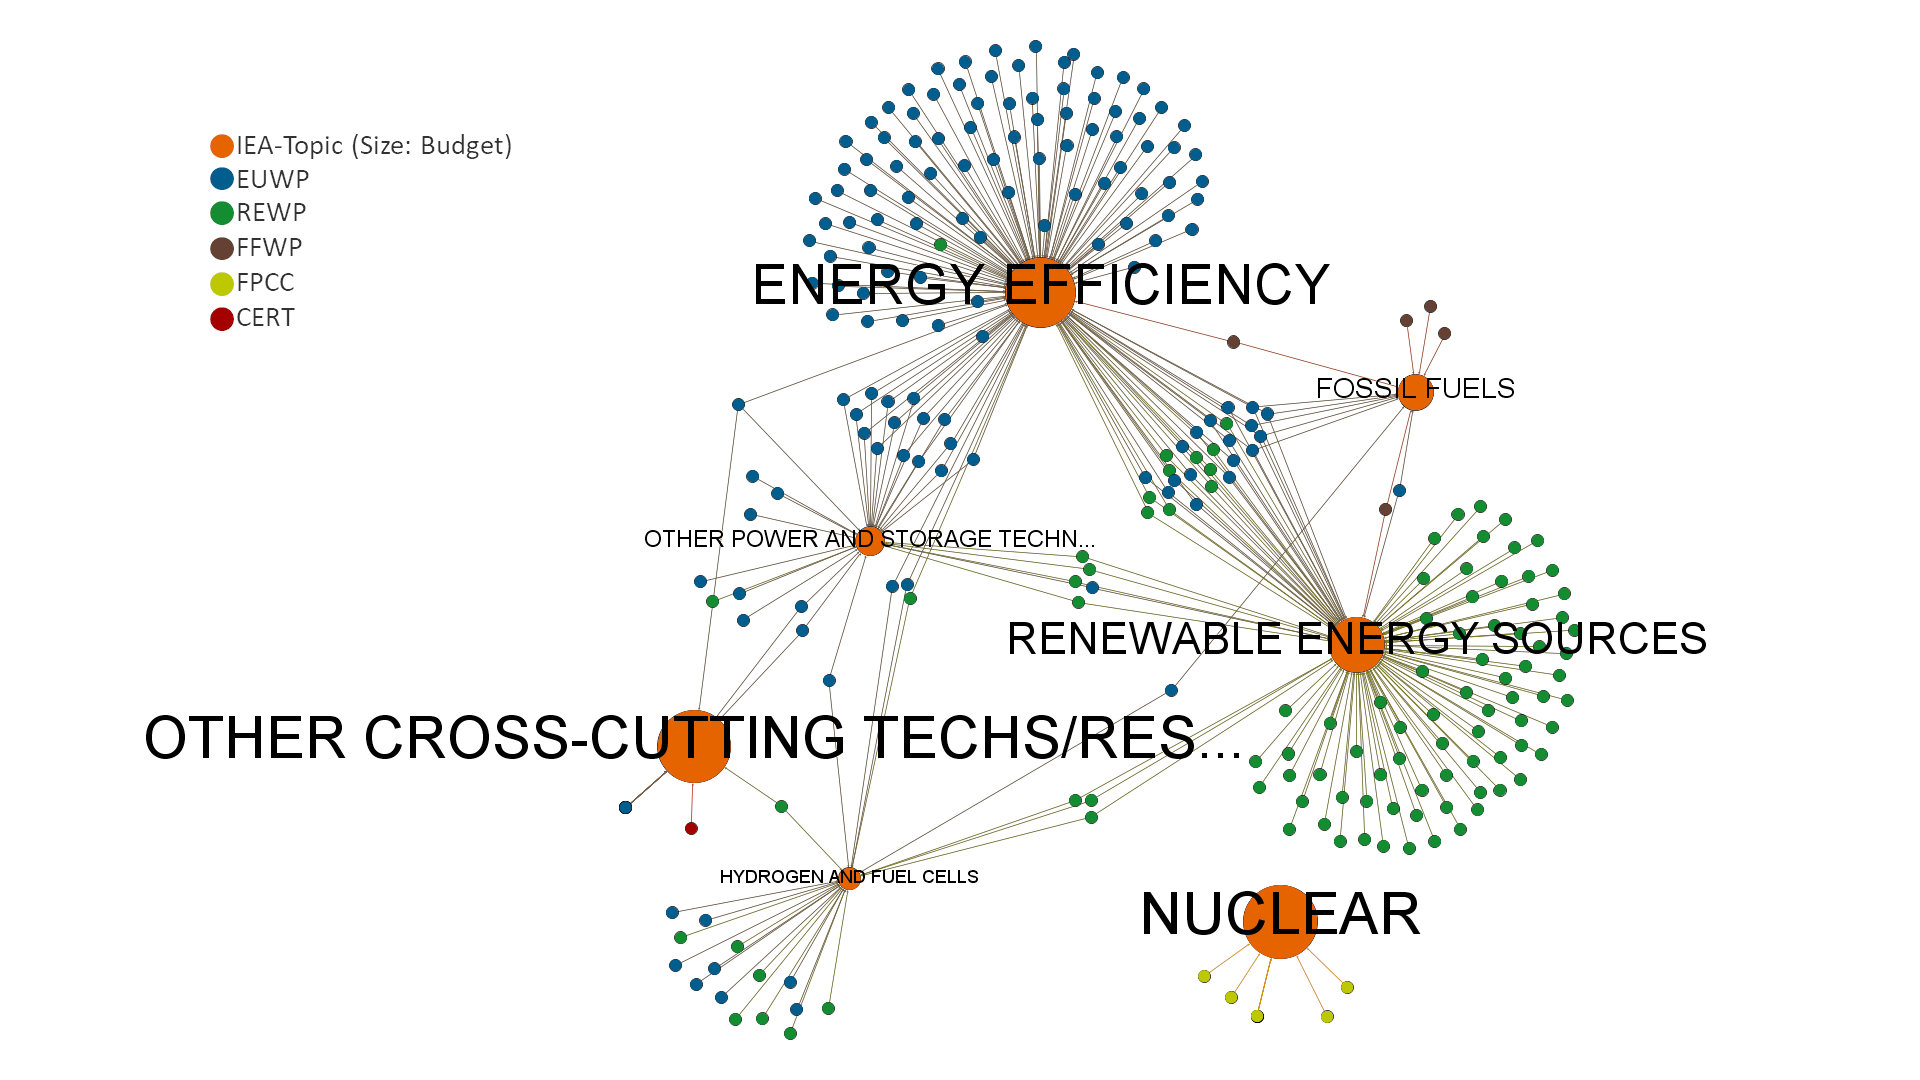
R&D Map
Visualisation of all ongoing Tasks and Annexes ("Activities") and their respective research topics.
Copyright: Austrian Energy Agency
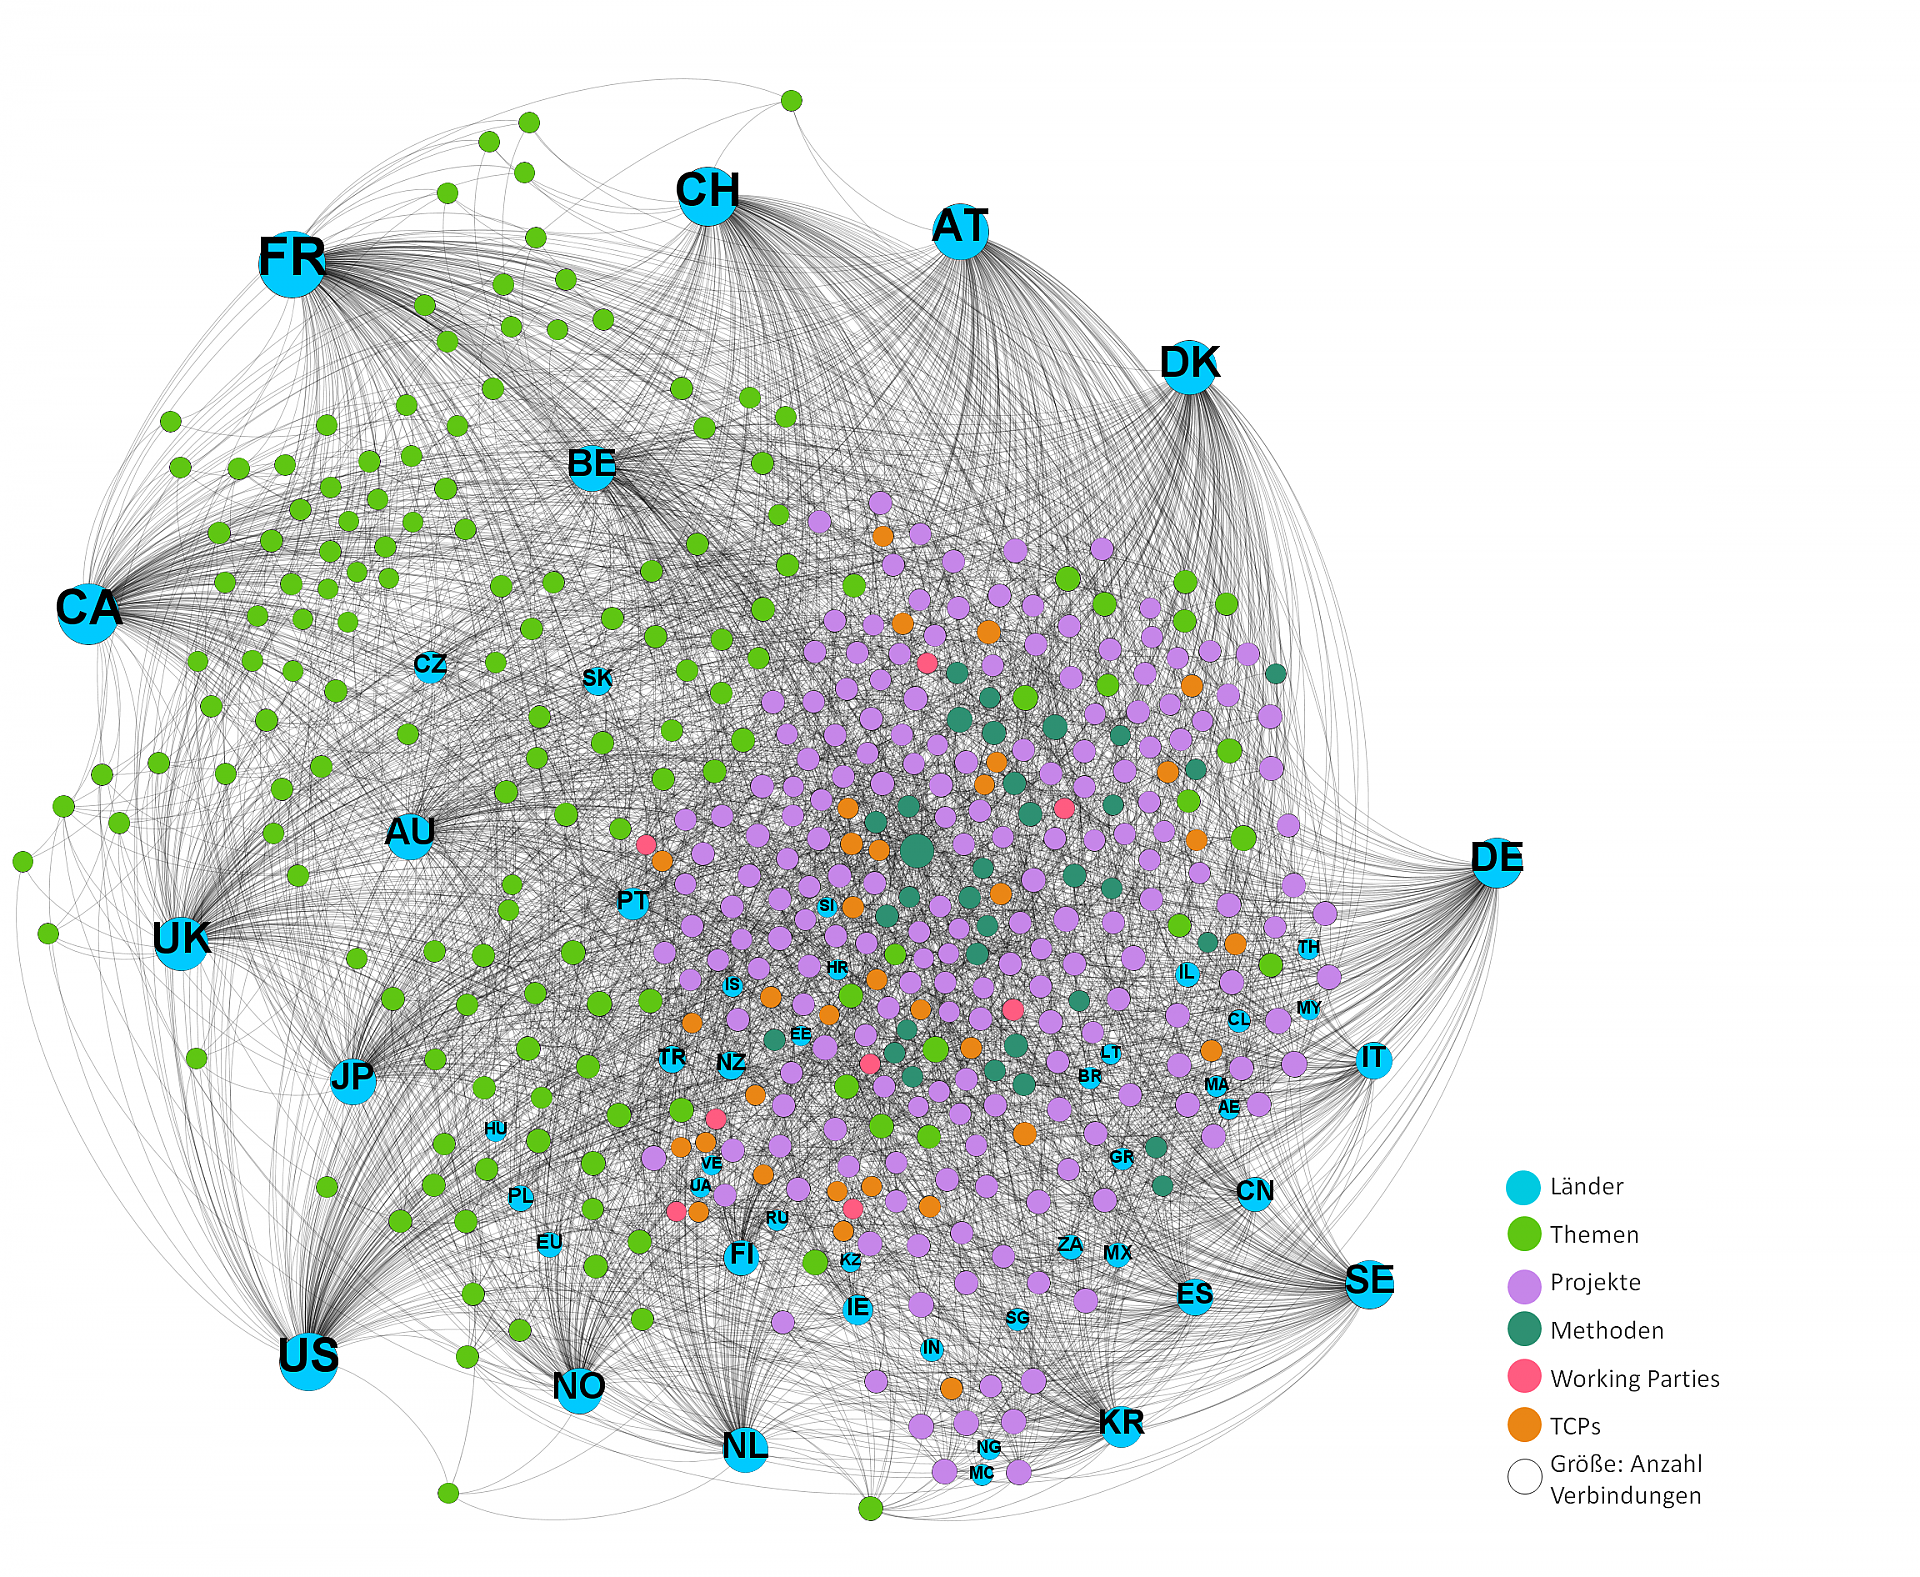
IEA-TCP Graph: Visualization of all nodes and edges in the IEA-TCP data model
Size of the nodes corresponds to the number of connections, color to the type of node (see legend).
Copyright: Österreichische Energieagentur 2018
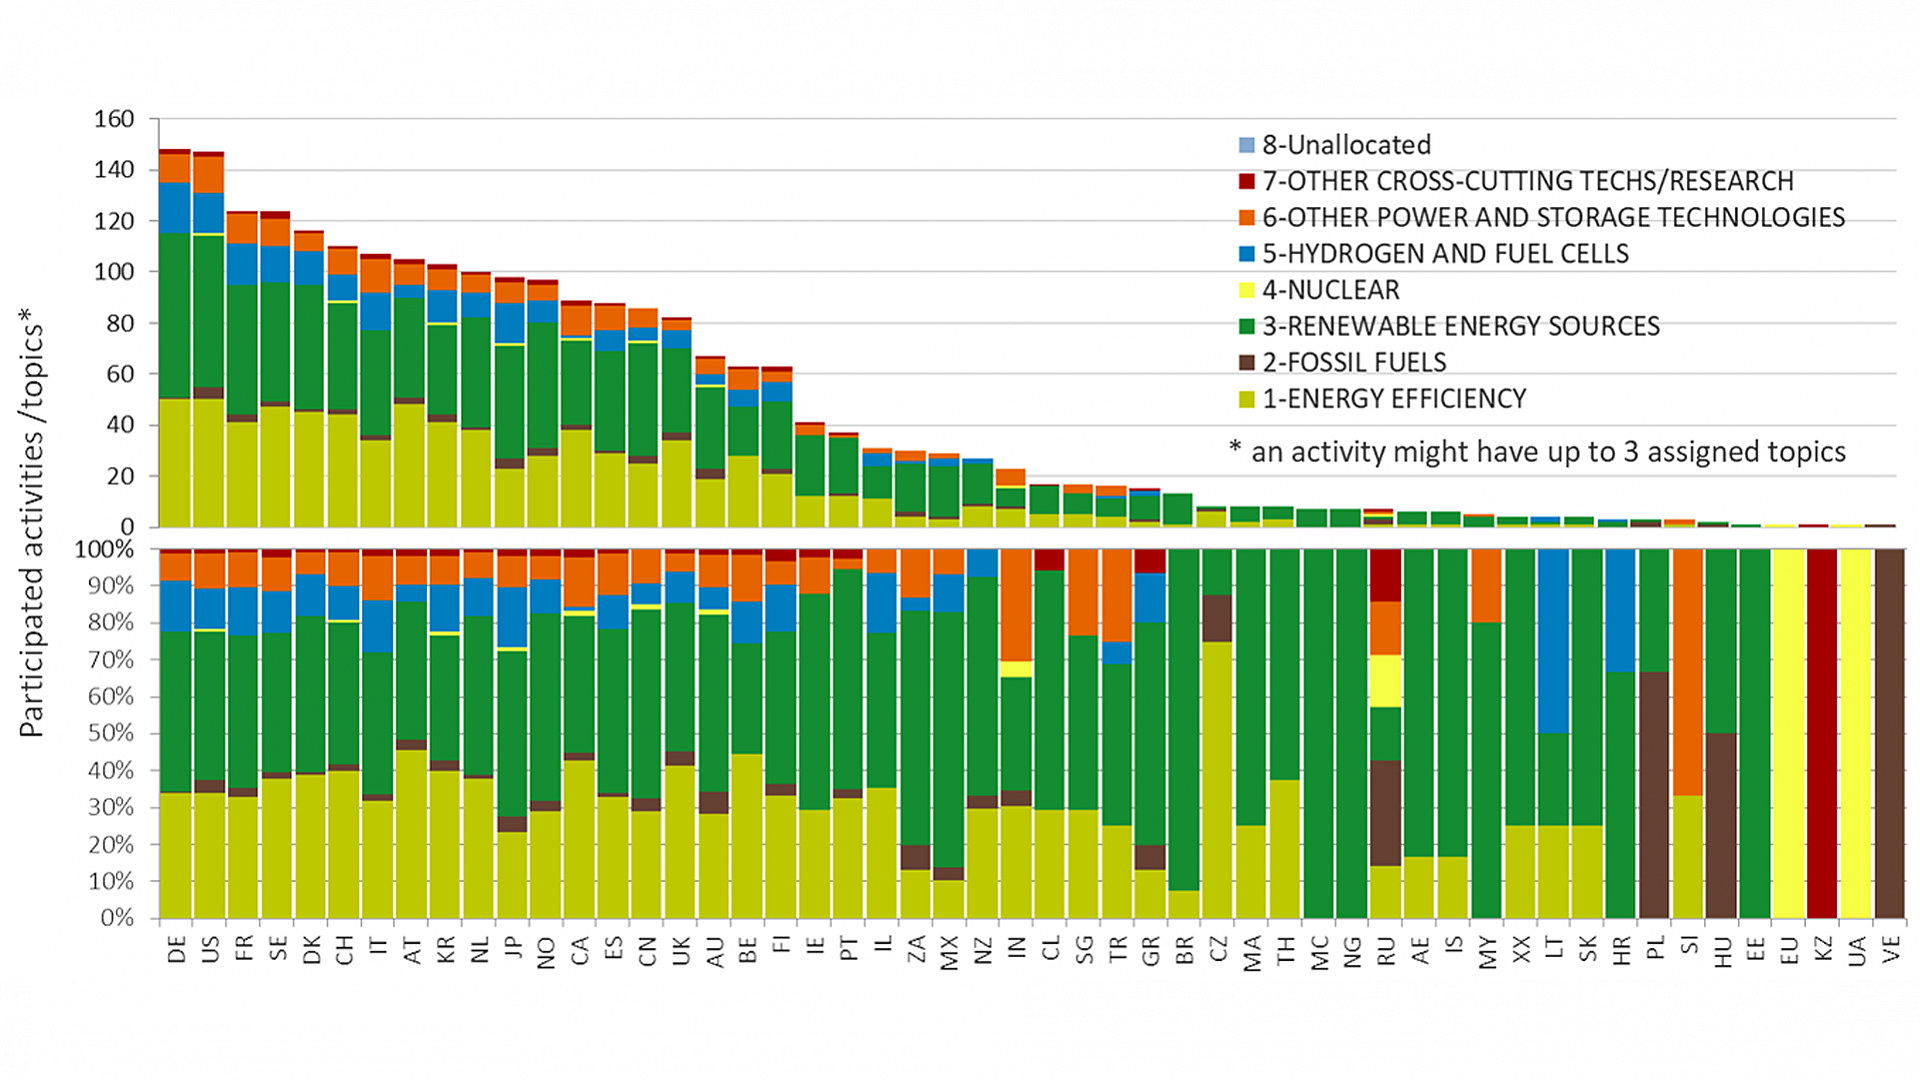
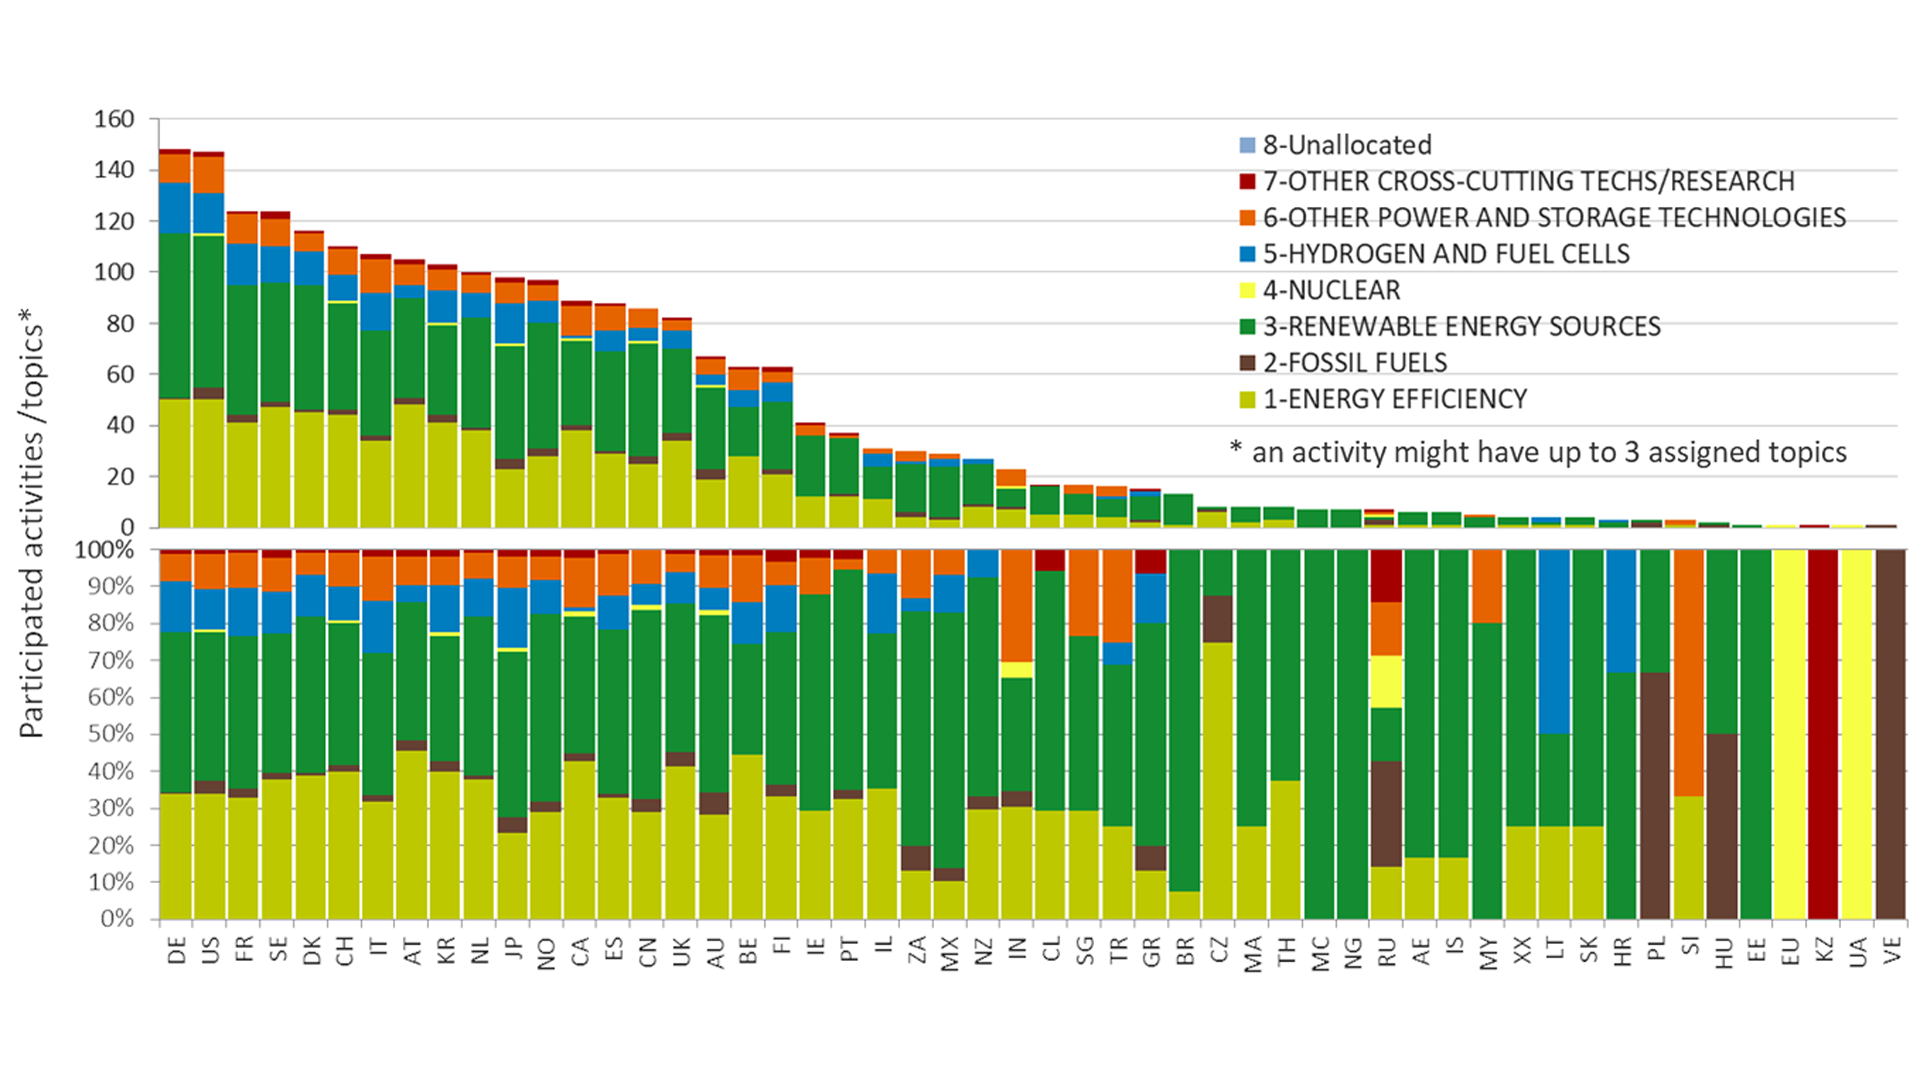
Participation of countries in IEA Technology Collaboration Programmes and Related Research Topics
Absolute (upper chart) and relative (lower chart) number of TCP-activities that countries are participating in. The color code shows how the assigned activities are related to the IEA-Topics and how the countries set their priorities with regard to the research topics (based on the IEA RD&D taxonomy).
Copyright: Österreichische Energieagentur, 2018
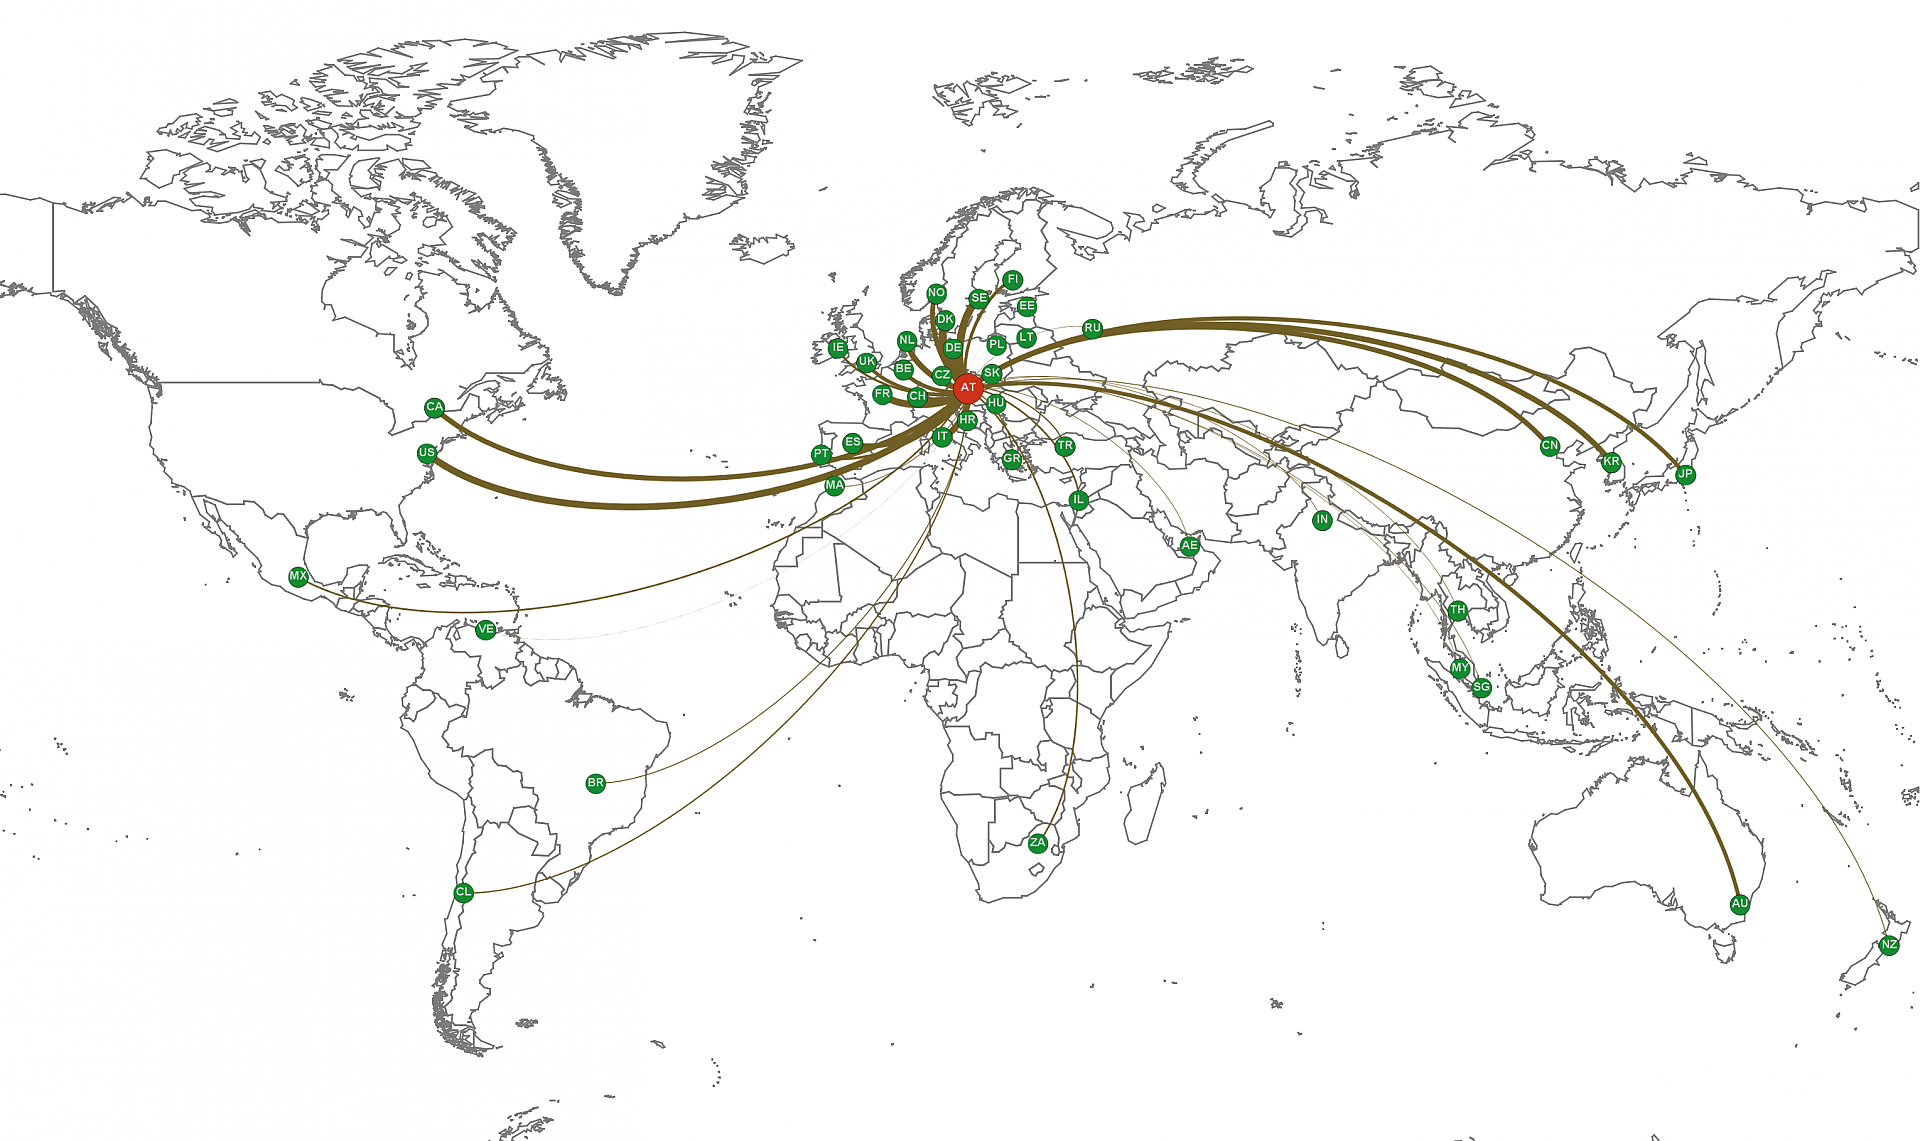
International cooperations of Austria in context of TCP activities.
Worldmap of Austrias cooperations with other countries in context of the IEA Technology Collaboration Program reasearch activities. Line thickness indicates the number of cooperations.
Copyright: Österreichische Energieagentur 2018
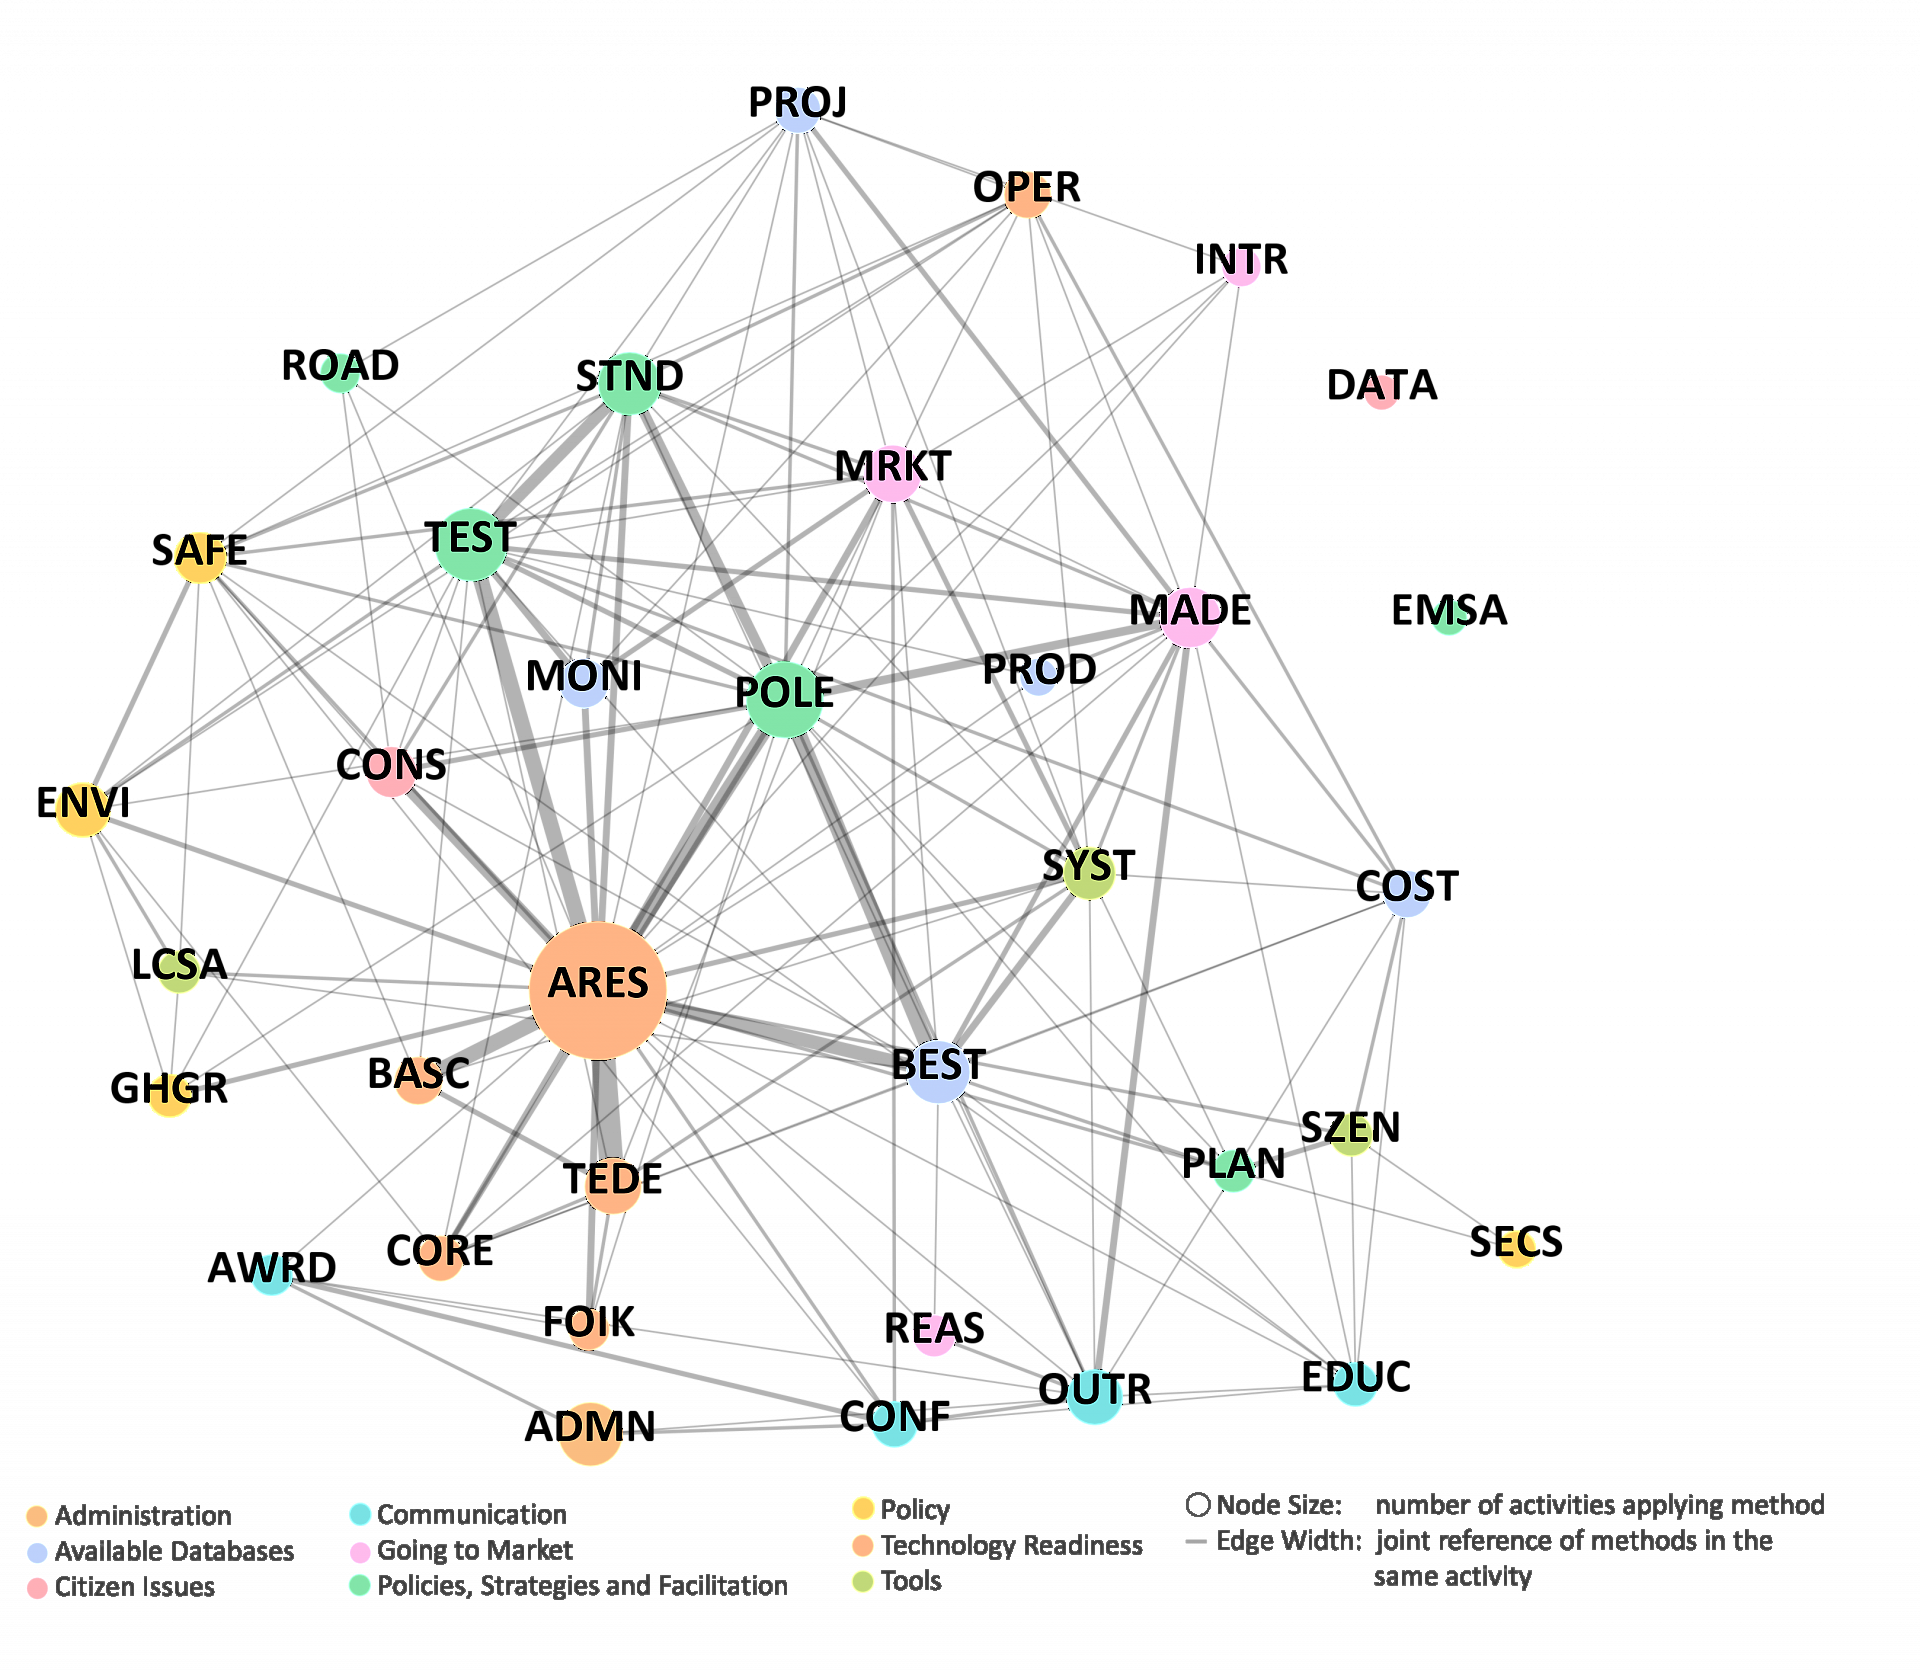
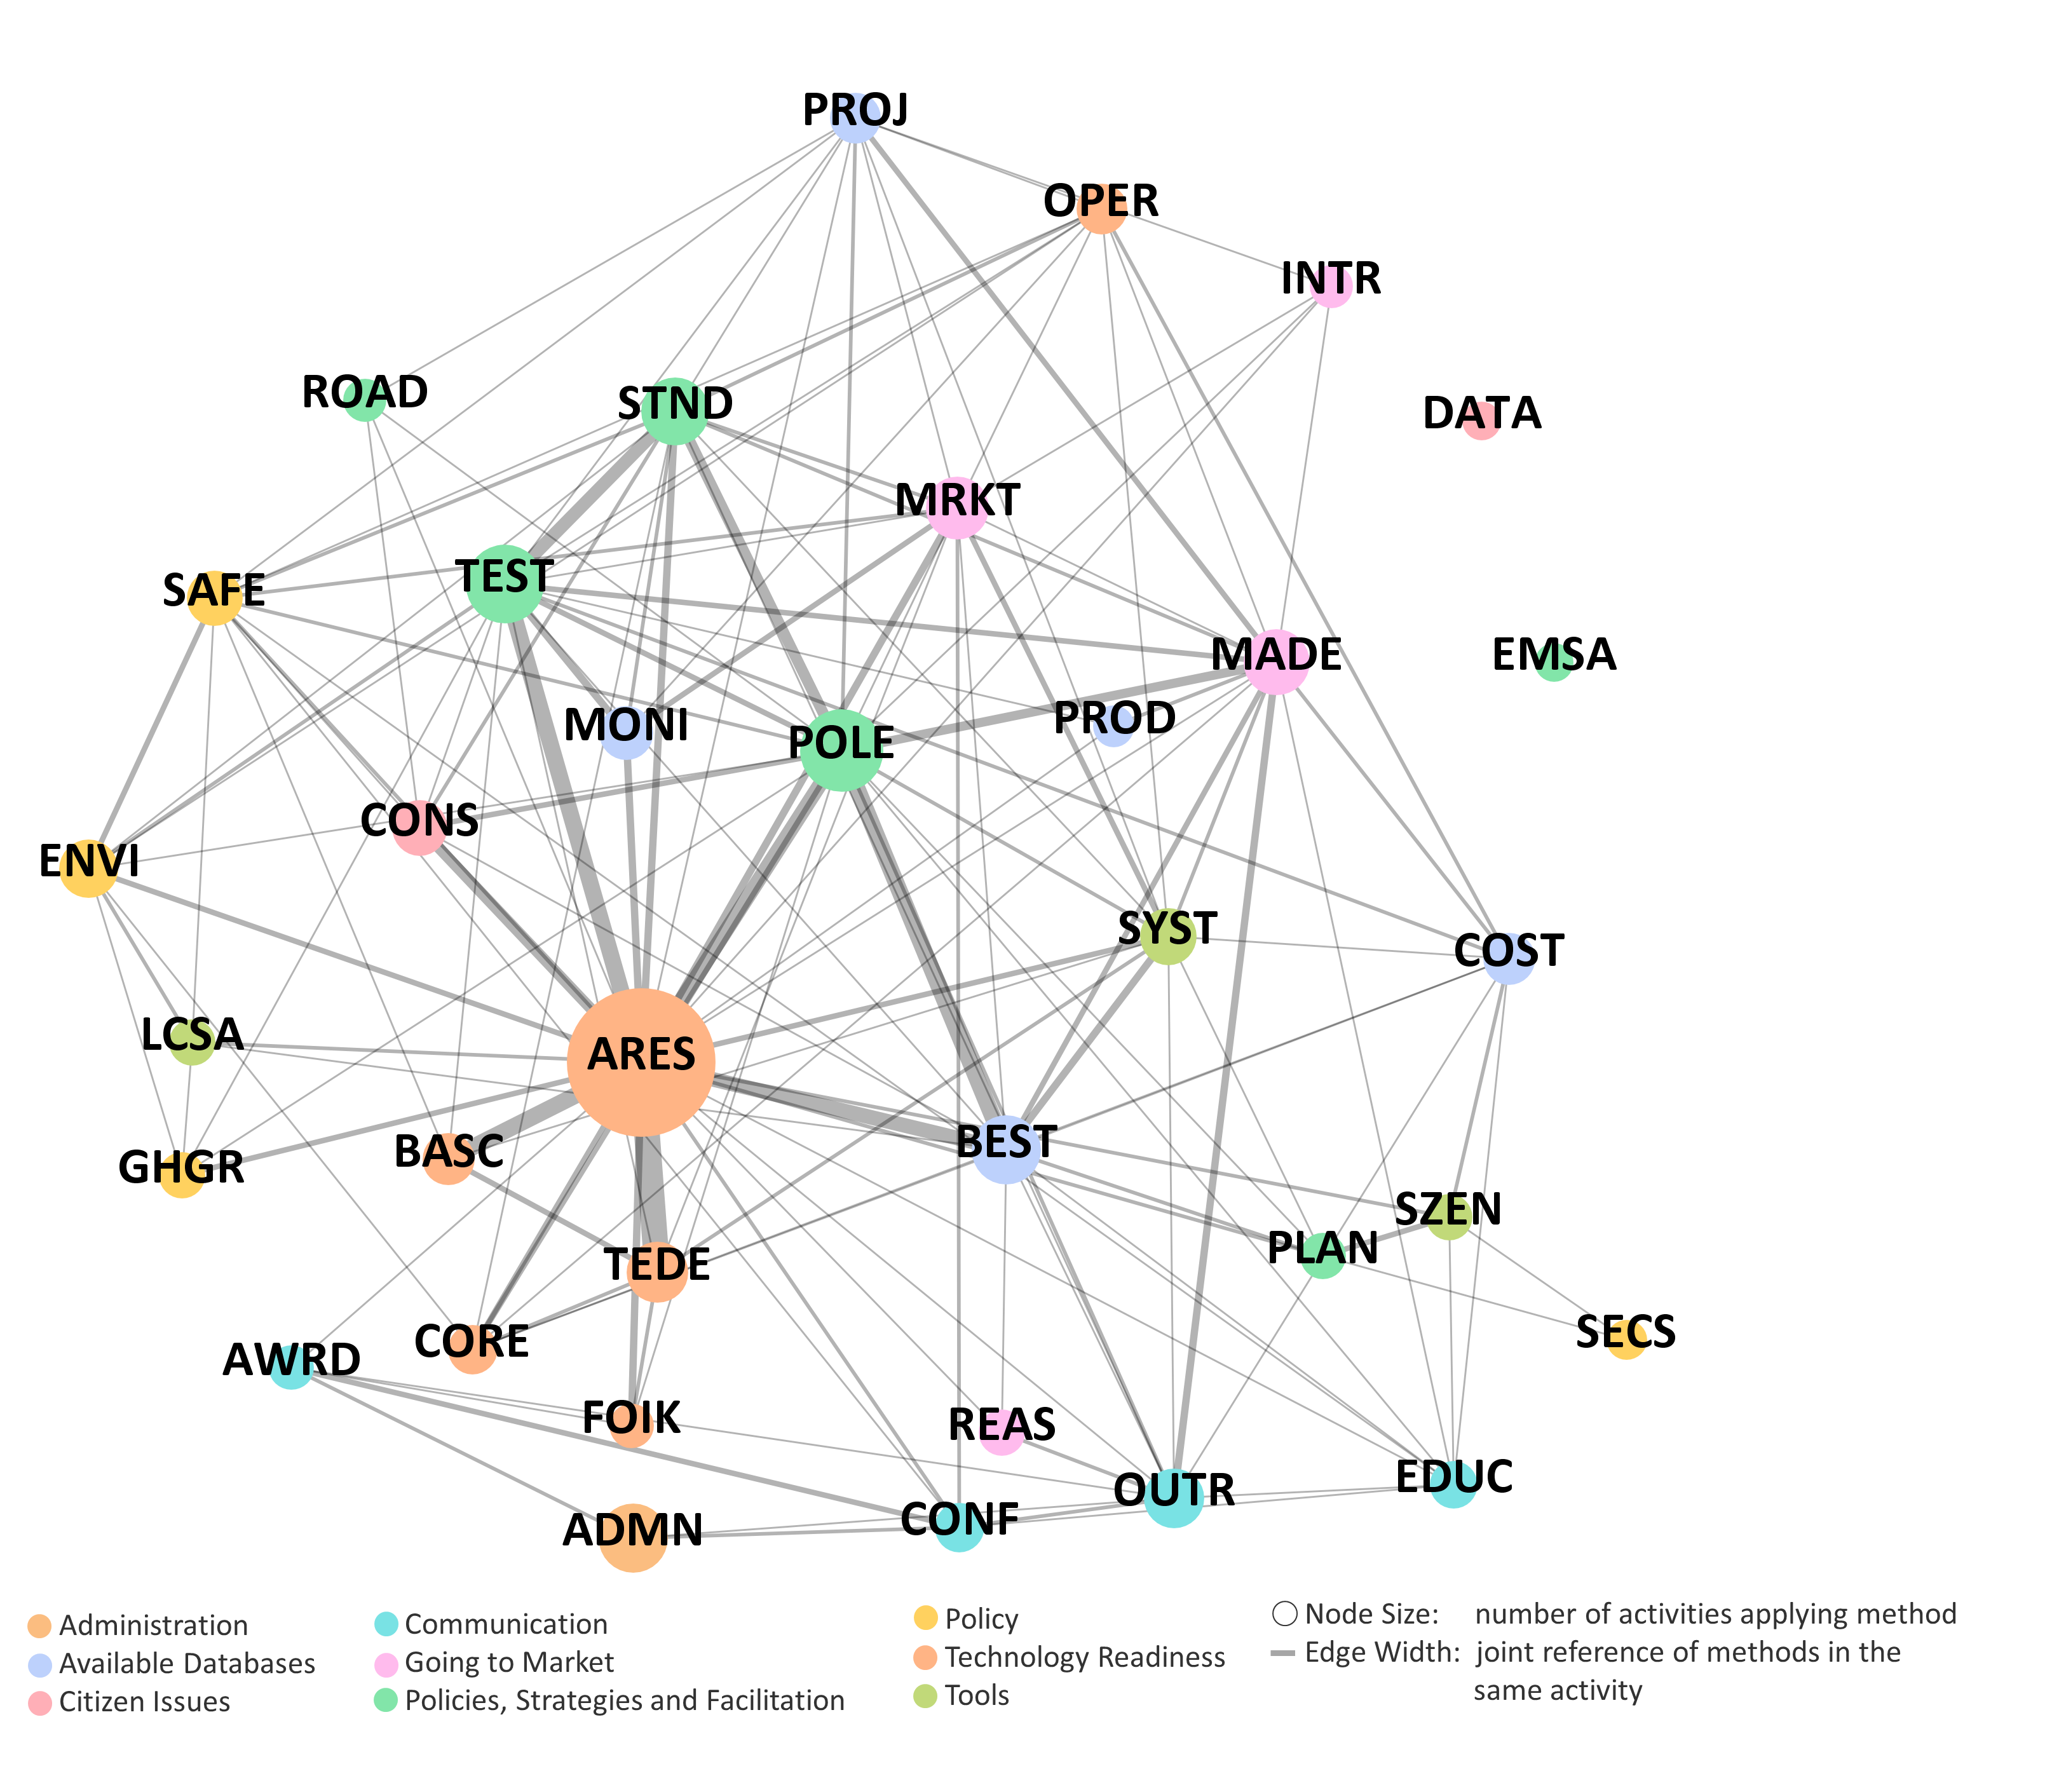
Combination of Methods used by TCP-Activities
A set of methods was developed to categorize the kind of project work that is done in the activities. The figure shows which methods are applied how often in total (node size), and which methods were frequently applied together (edge width) by activities. The color corresponds to the different method cate-gories described in chapter.