Project Image Pool
There are 418 results.
Terms of use: The pictures on this site originate from the projects in the frame of the programmes City of Tomorrow, Building of Tomorrow and the IEA Research Cooperation. They may be used credited for non-commercial purposes under the Creative Commons License Attribution-NonCommercial (CC BY-NC).
Graphical representation of the assessment across a range of different storage technologies
Comparison of various parameters (storage capacity, TRL, efficiency, cost, safety and commercial availability) for the storage technologies under consideration. These include liquid hydrogen, compressed hydrogen, organic hydrogen carriers, metal hydrides, ammonia, but also redox flow and lithium-based battery systems, pumped storage and chemical looping hydrogen (HyLoop).
Copyright: CEET/TU Graz
Participants of the Annex Meeting of 16 May 2017
The meeting on Annex 31 was held on 16 May in the rooms of the Institute of Chemical Engineering and Environmental Technology. Hideo Inoue, Alexander Dyck and Werner Lehnert gave technical presentations on the research activities at their respective facilities.
Copyright: TU Graz

Reactor system for hydrogen production
Schematic depiction of the high pressure fixed bed reactor system for the production of compressed ultra-pure hydrogen (left); photo of the reactor system (right).
Copyright: TU Graz
Stand of the different baterry technologies.
This figure shows the development status of various technologies for rechargeable batteries in consumer electronics.
Copyright: 4E EDNA
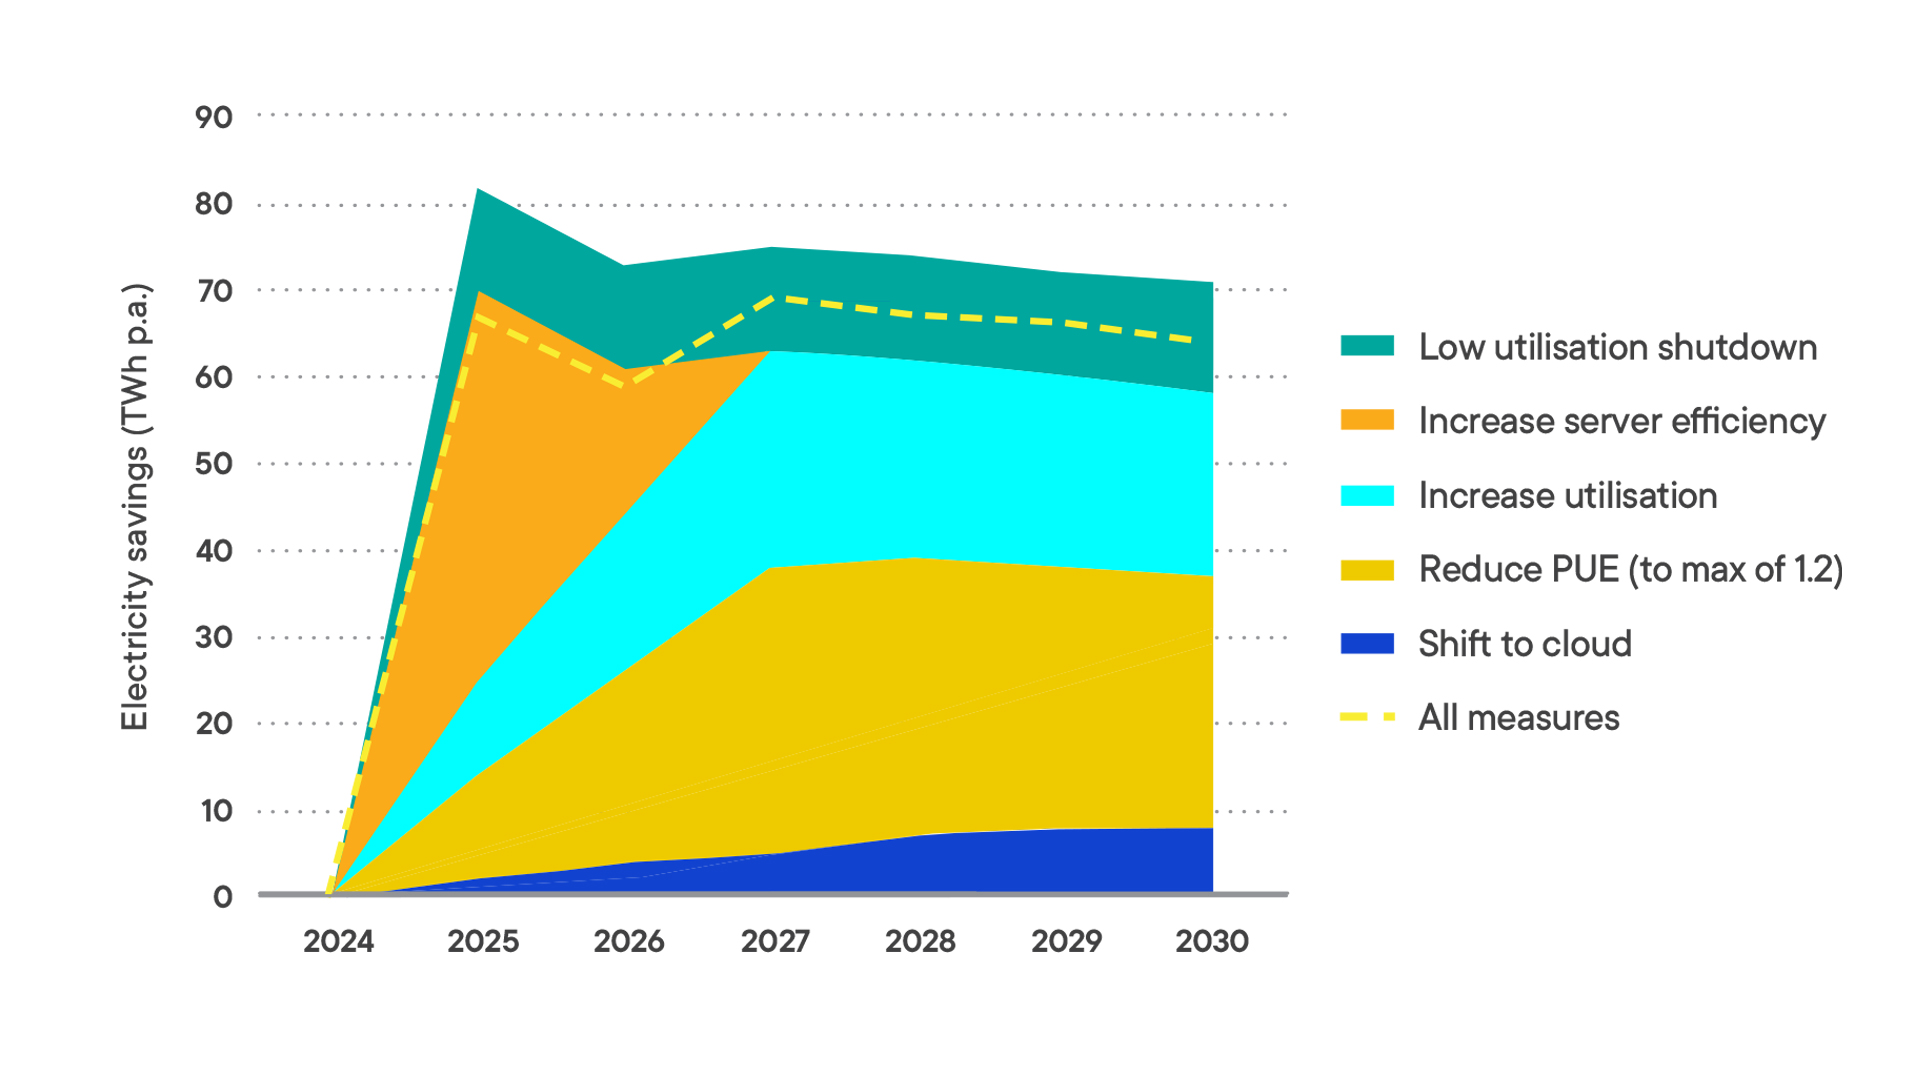
Potential energy savings from measures for Data Centres.
The graphic shows the estimated energy savings per year until 2030, for a range of possible measures to improve the efficiency of Data centres, according to modeling conducted by EDNA in 2024.
Copyright: 4E EDNA
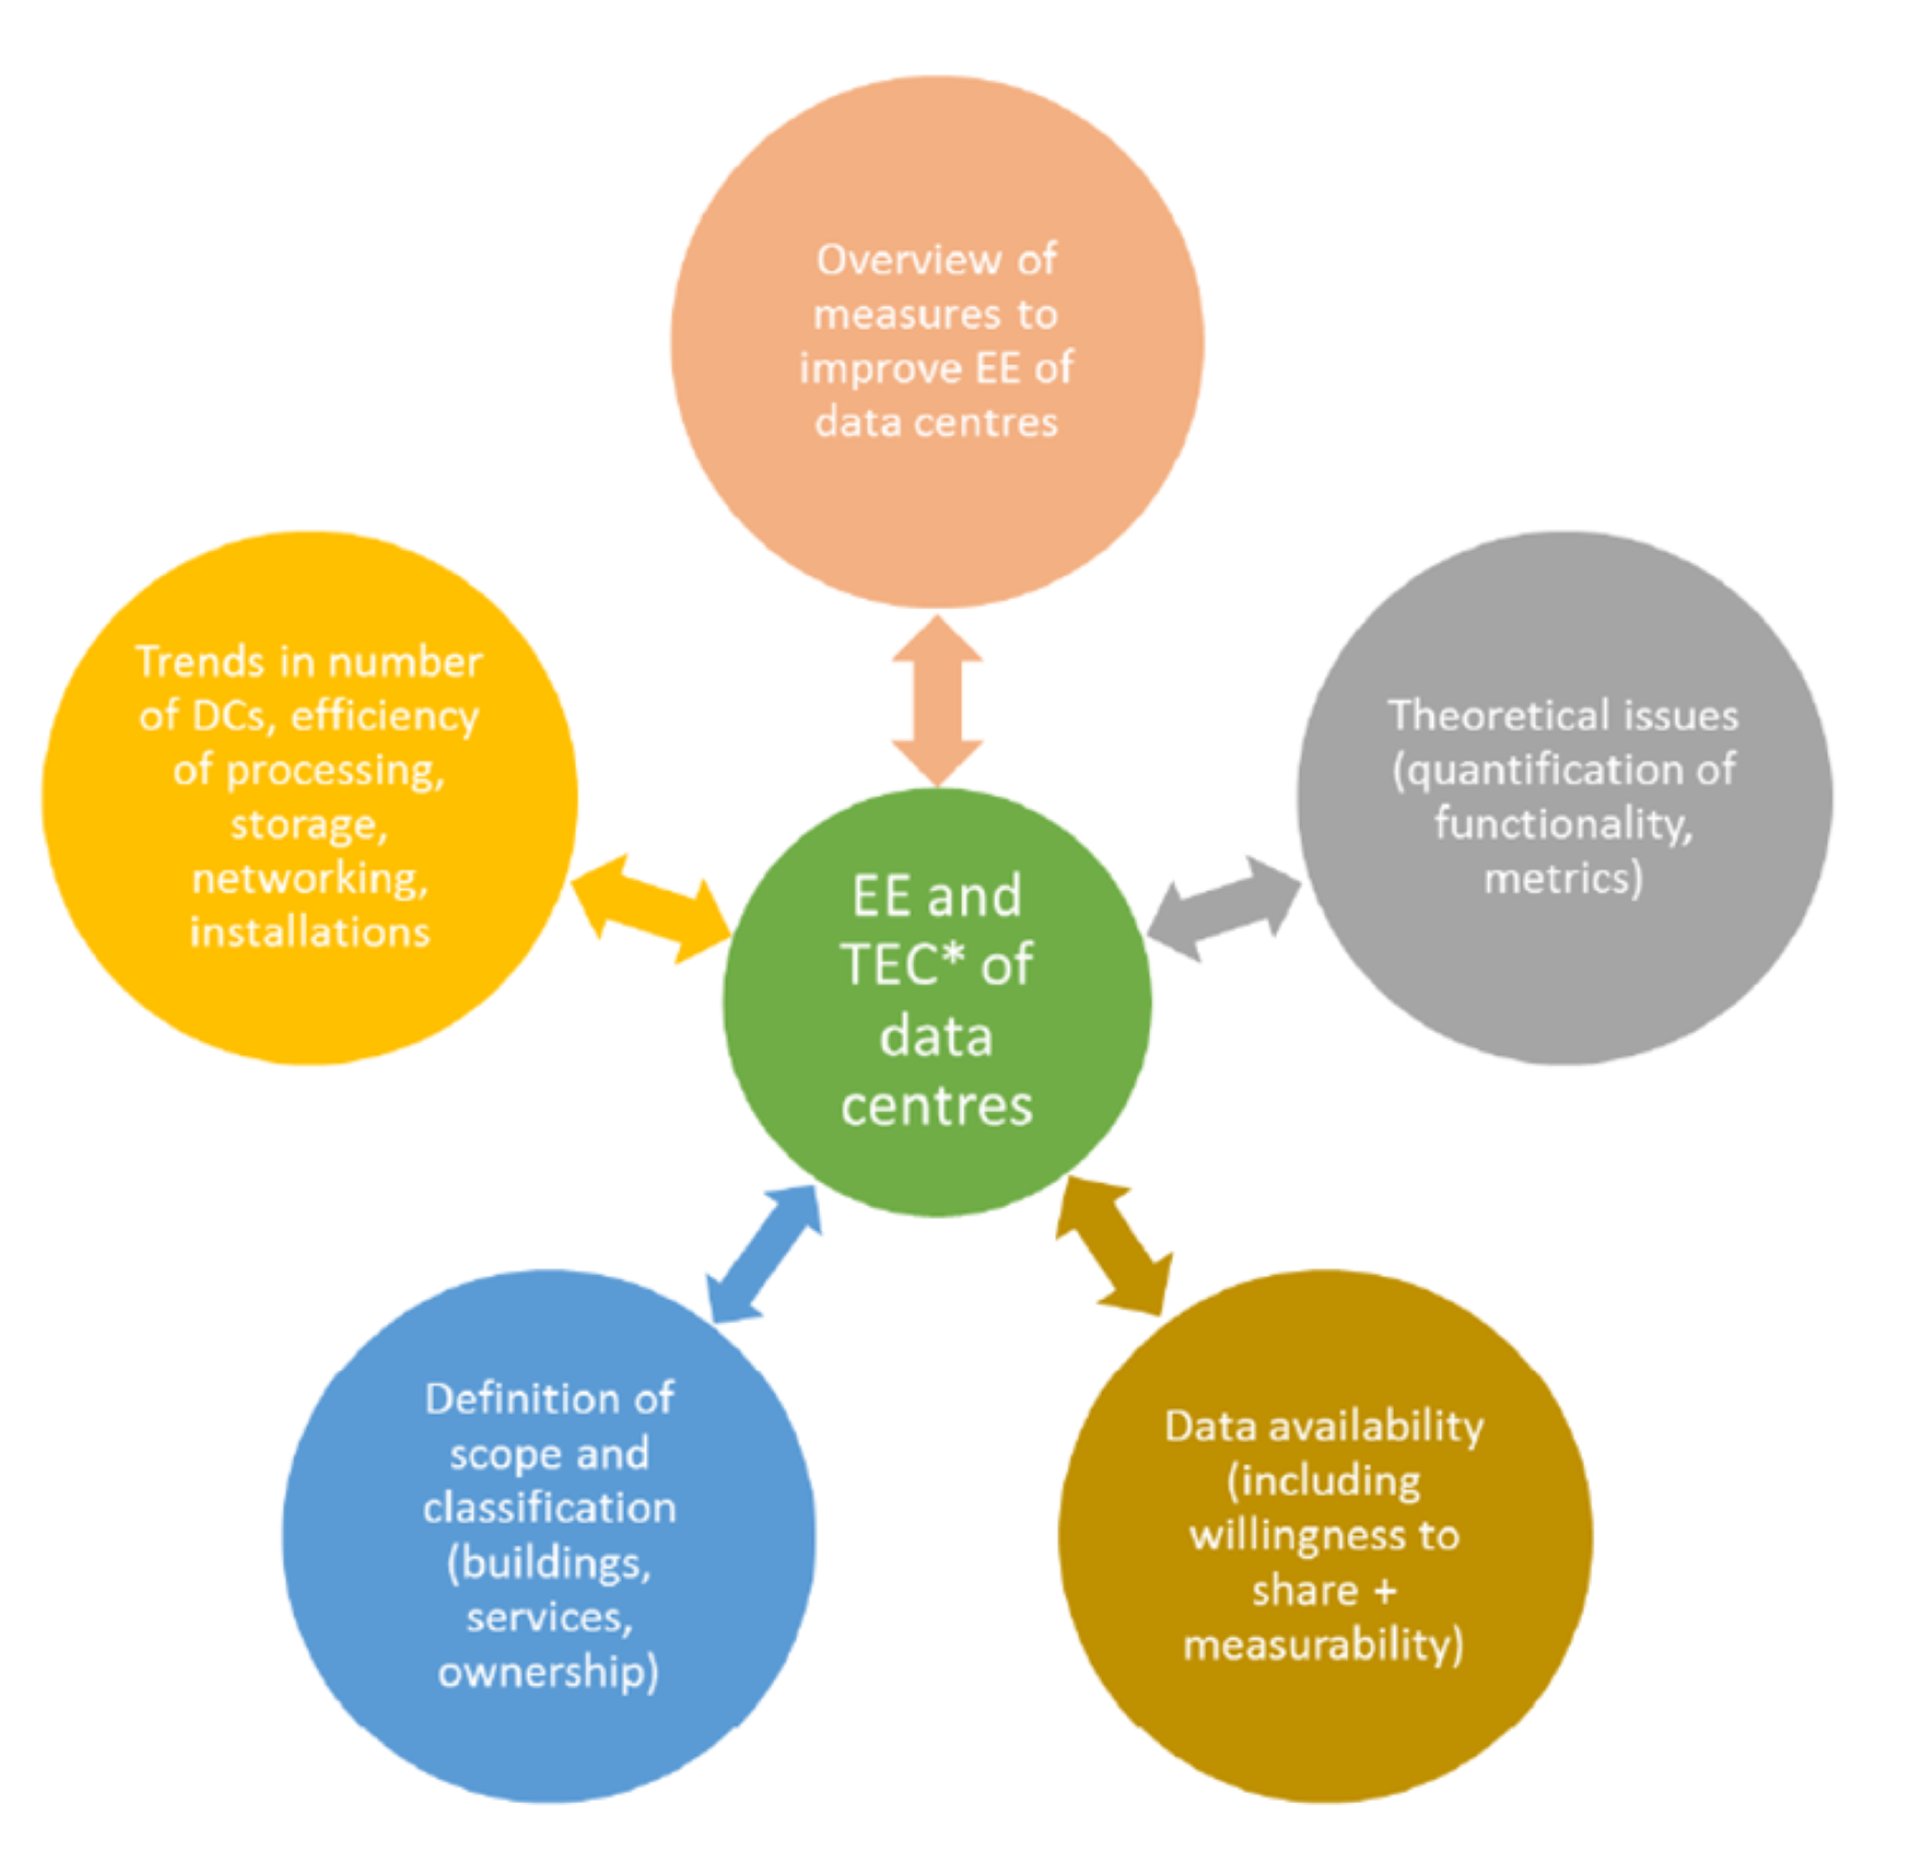
IEA 4E EDNA Activities of the workstream opn energy effi ciency of data centres
This figure shows the diff erent activities that contribute to the workstream on energy effi ciency of data centres.
Copyright: 4E EDNA
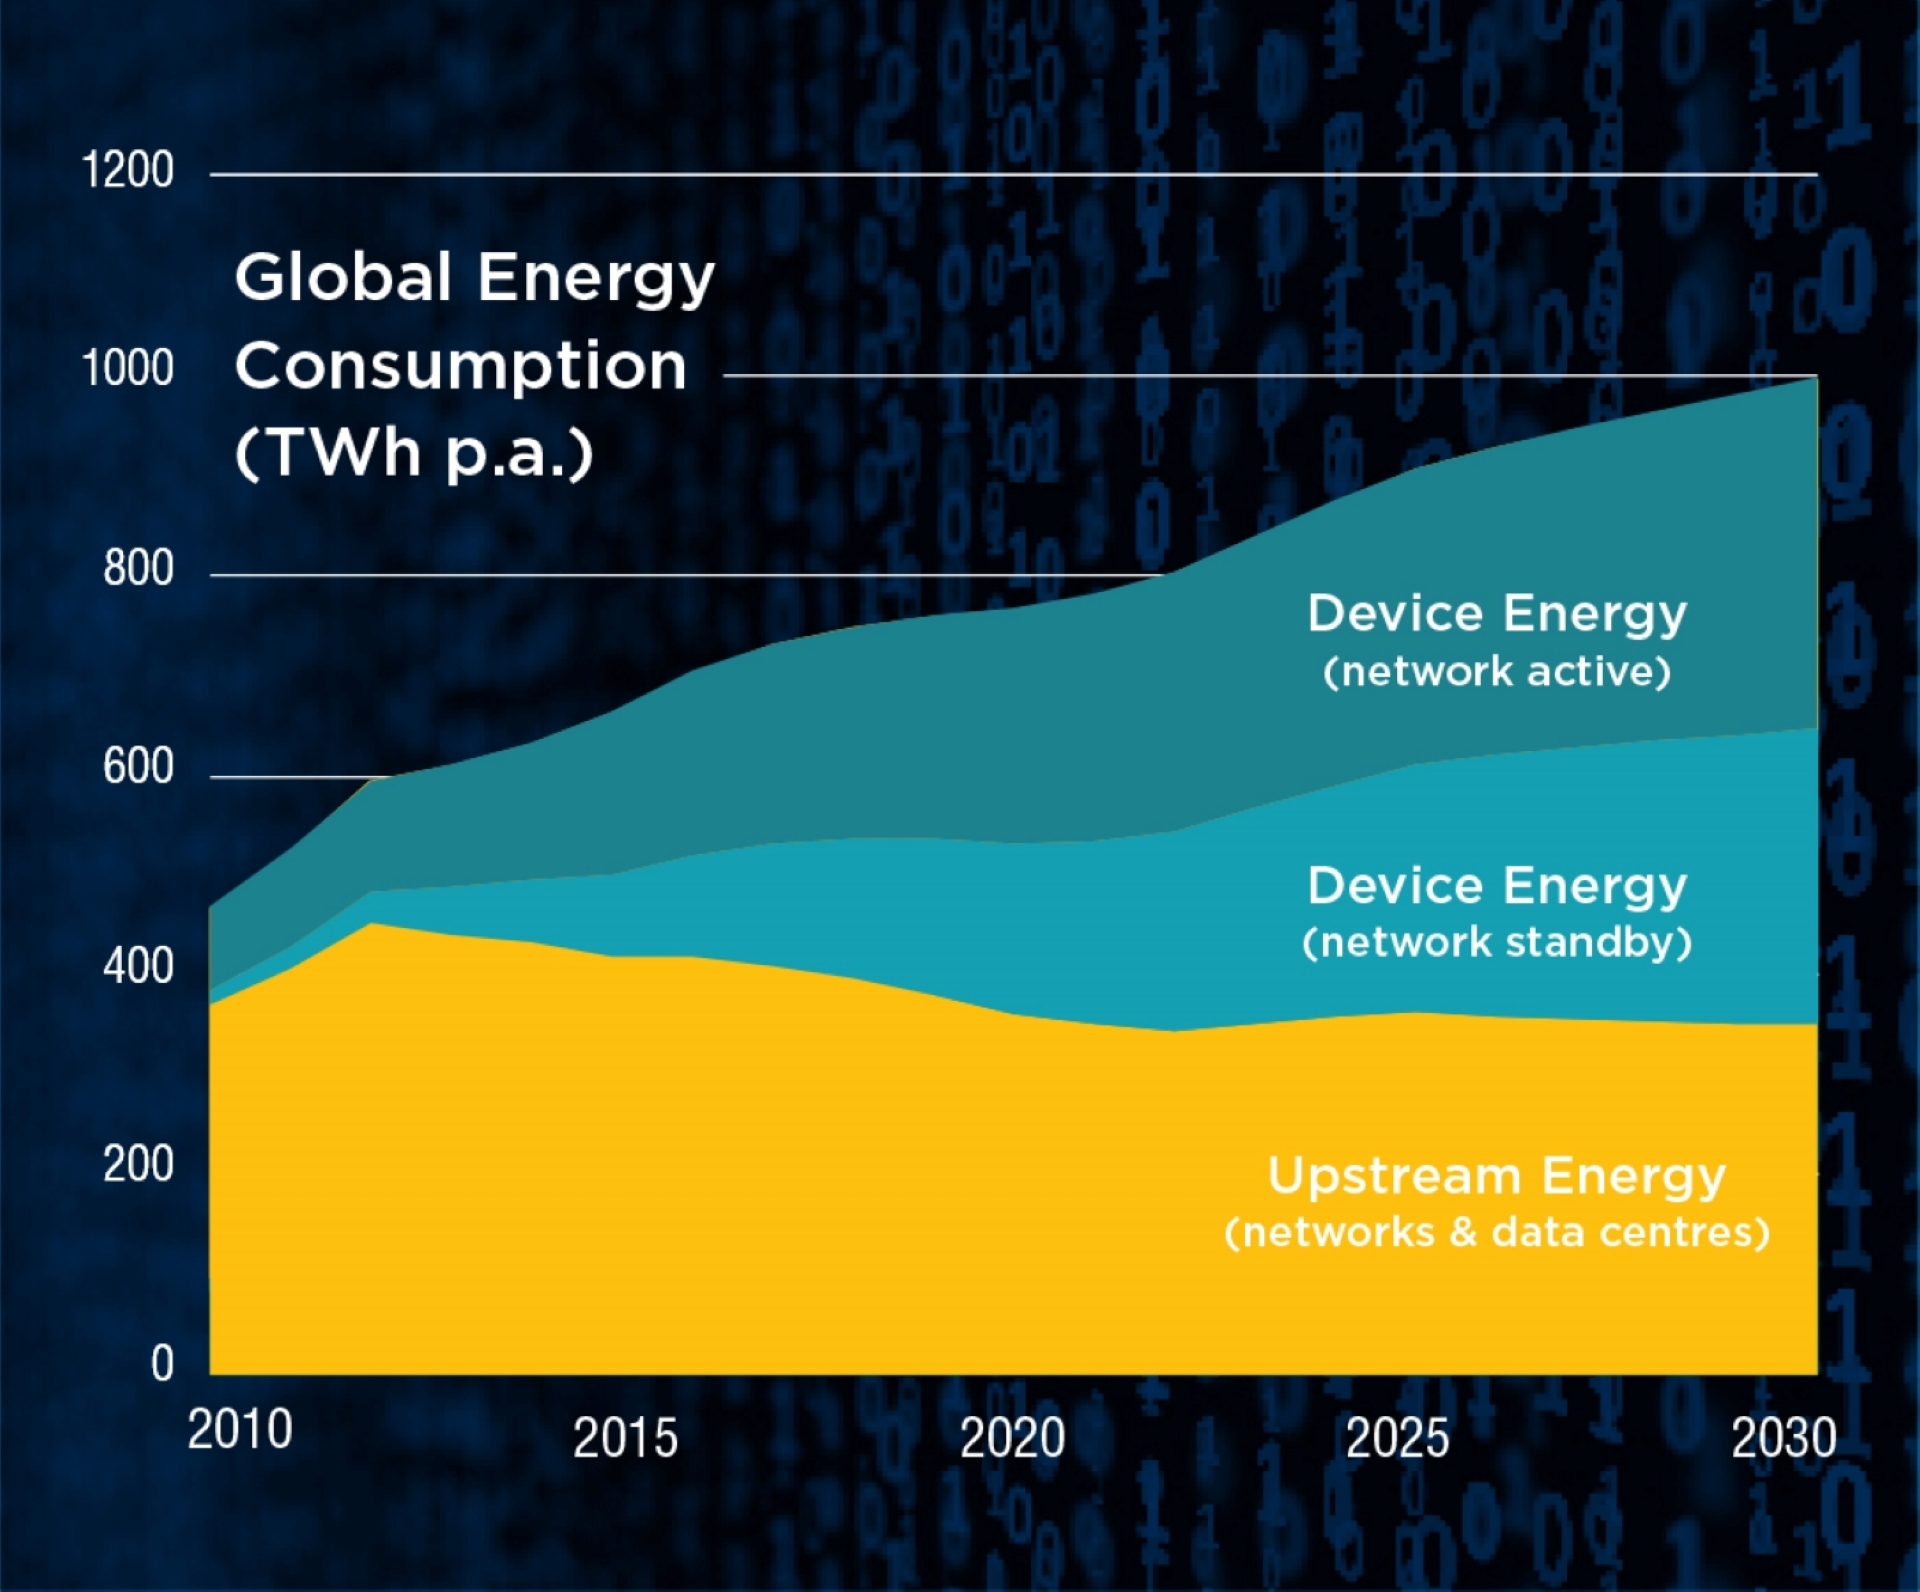
Global Energy Consumption of network connected devices 2010-2030
The figure shows a graph with the annual energy consumption of network-connected devices in different operating modes - network active and network standby - as well as with the upstream energy consumption of networks and data centers. By 2030, the total global energy consumption of network-connected devices will increase to about 1,000 TWh/yr. Device-related energy consumption in particular will increase significantly, whereas upstream energy consumption will decrease somewhat and account for about one-third of the energy consumption associated with network-connected devices. These and other graphs on the energy consumption of network-connected devices can be quantified using the EDNA Total Energy Model.
Copyright: EDNA, 2020

Network connected devices
Schematic overview of network-connected devices and application areas.
Copyright: EDNA, 2020

New image of EDNA´s website
New EDNA platform website with a range of residential connected devices, which are in the focus of EDNA´s work.
Copyright: 4E EDNA

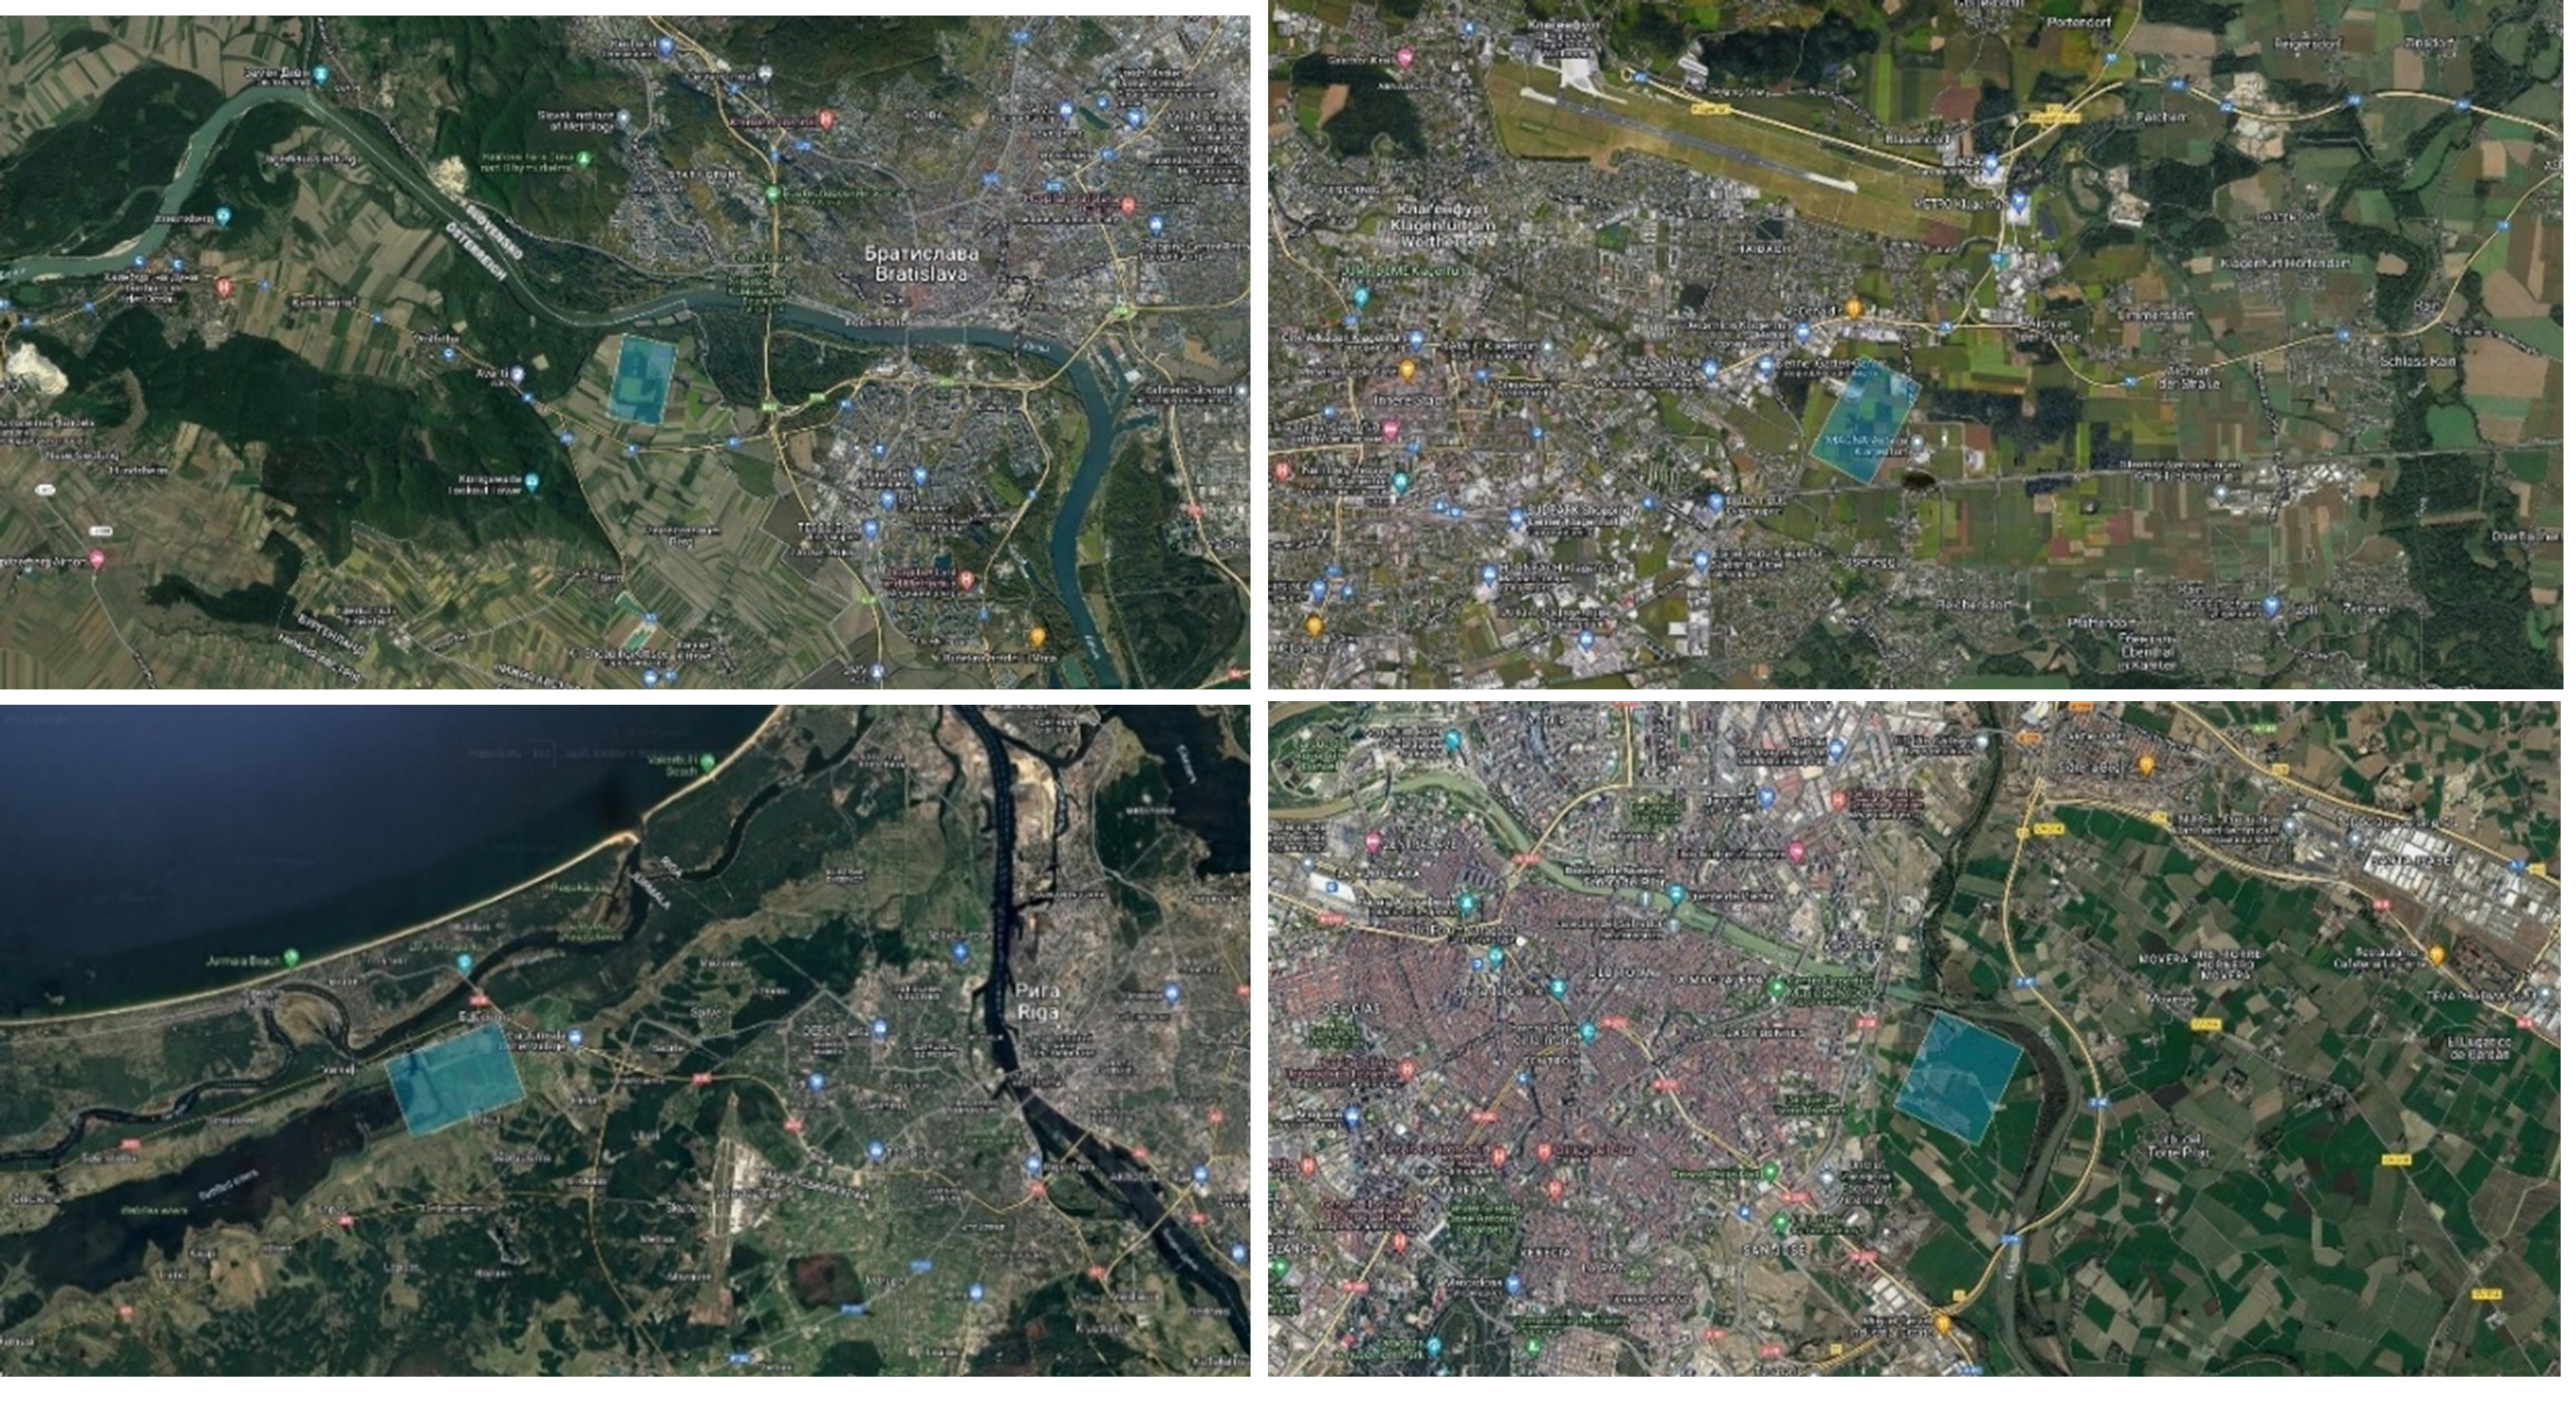
The large-scale thermal solar plant of Silkeborg, Dk
Overview over the large-scale solar thermal plant in Silkeborg, Denmark (left) and schematic showing the different sections and piping of the installation (right)
Copyright: © Silkeborg Forsyning AB
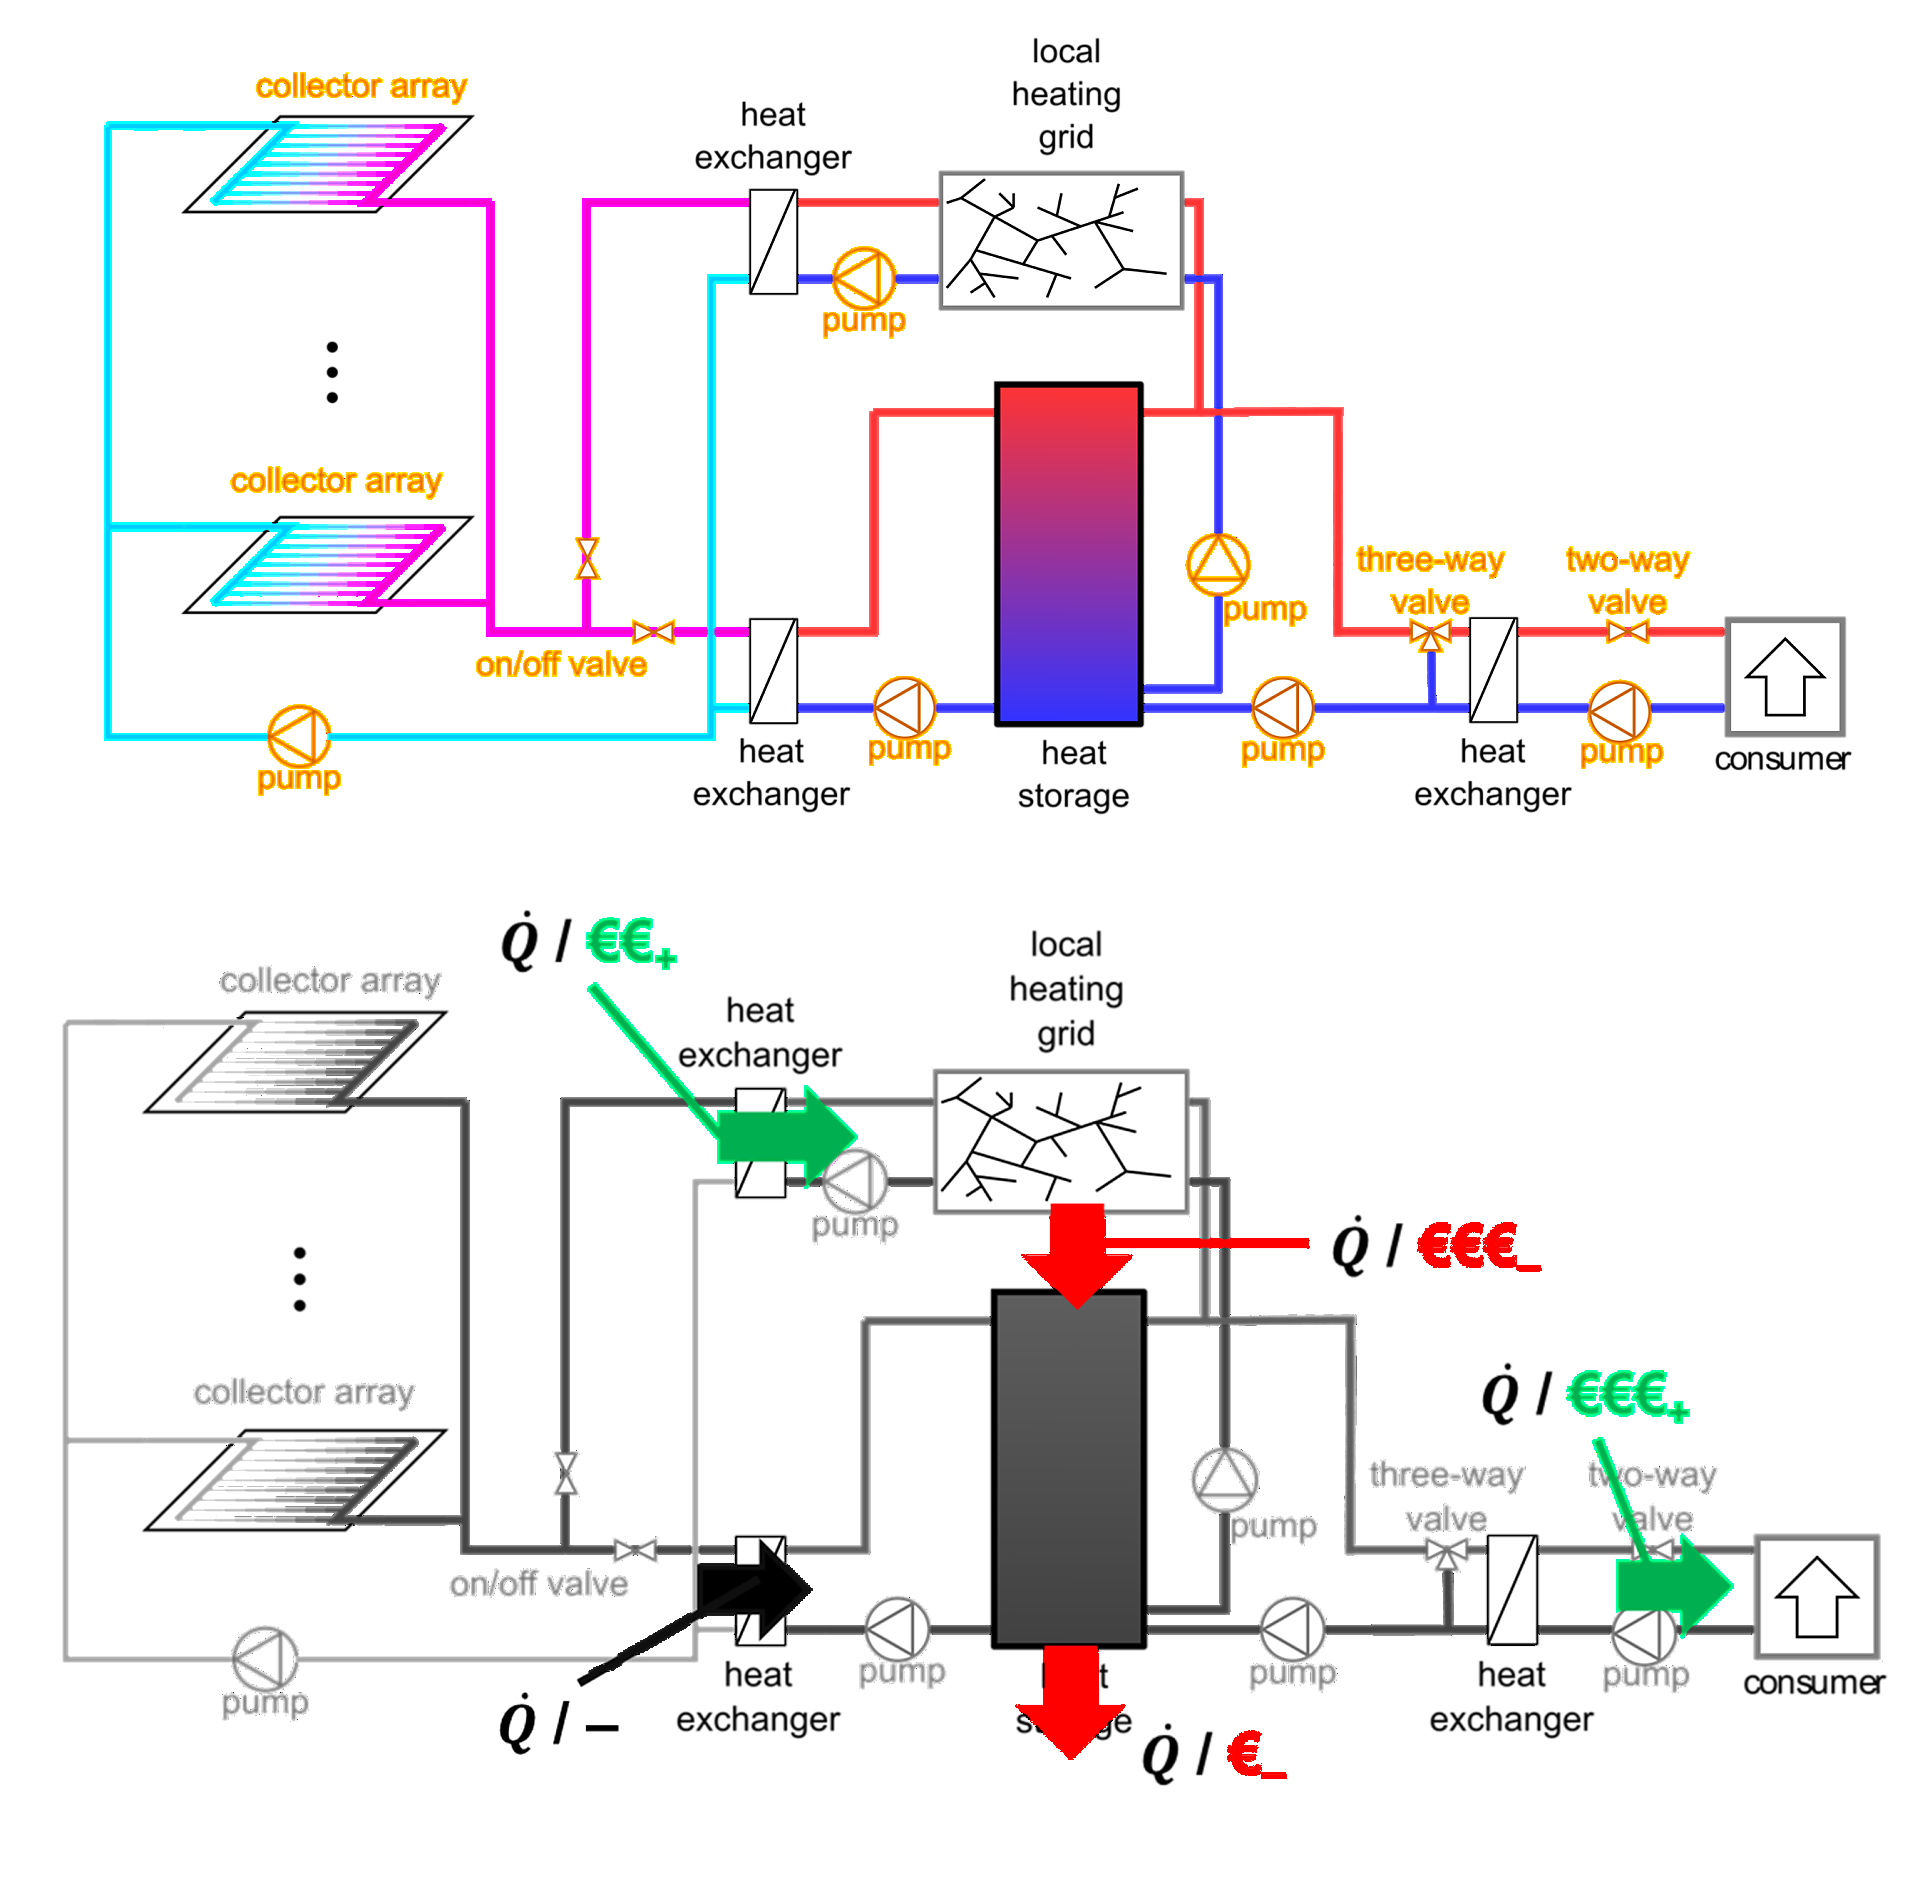
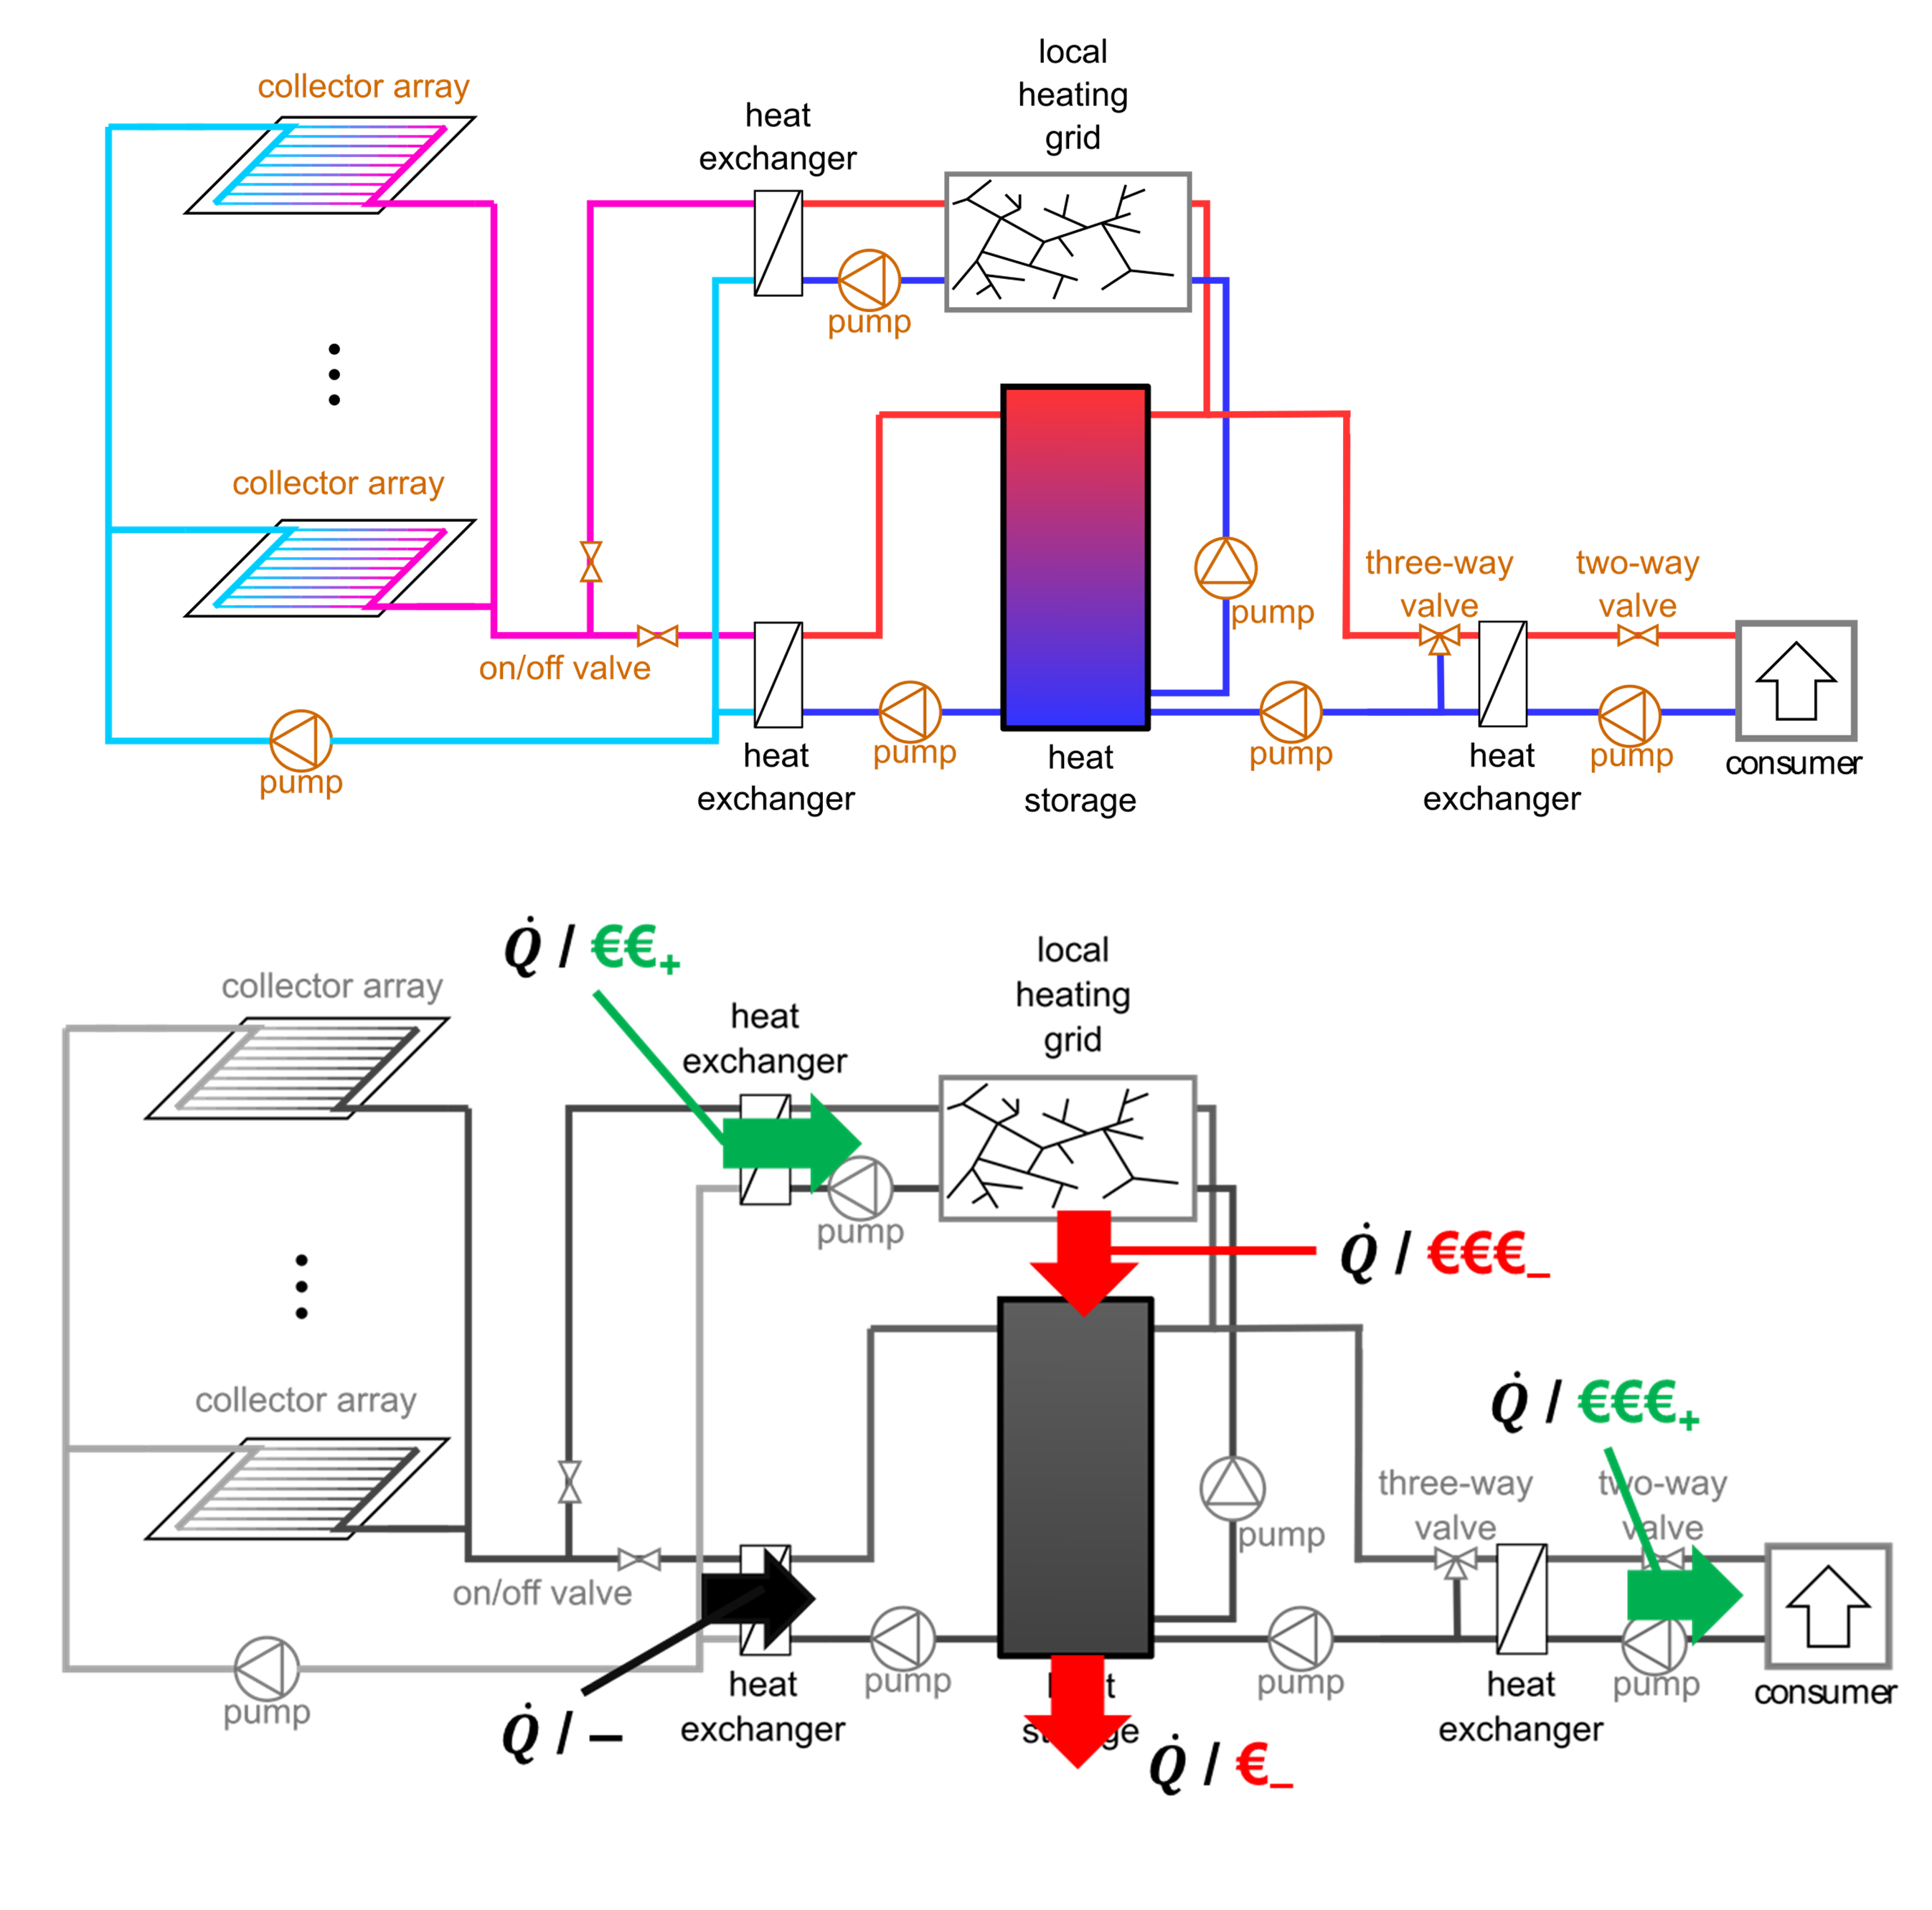
Solare District Heating: Structure, Heat and Revenue Streams
General structure of solar district heating (top) as well as important heat and revenue streams (bottom): The figure shows solar collectors, heat exchangers, a buffer storage, pumps, valves, the grid and consumers.
Copyright: © Dr. Viktor Unterberger / BEST GmbH
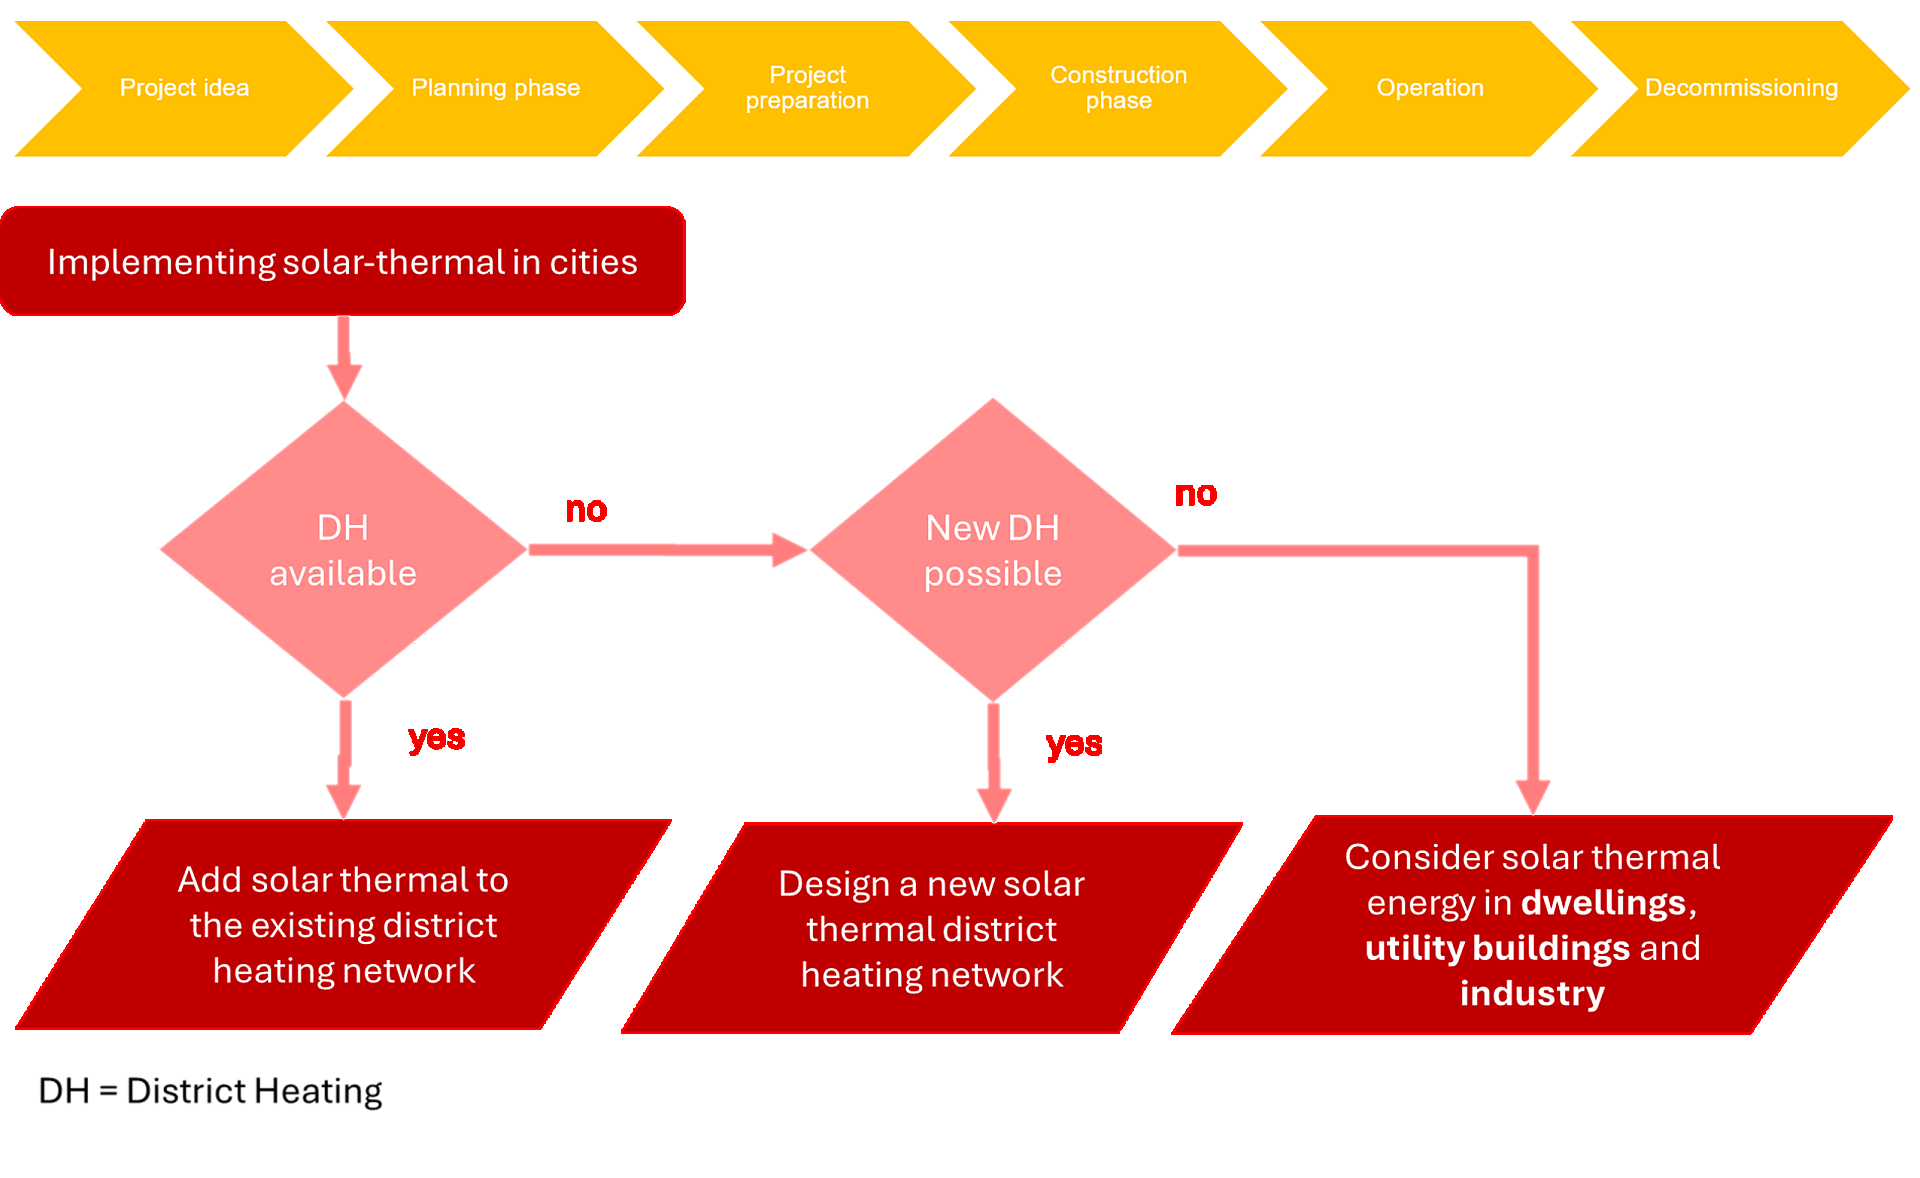
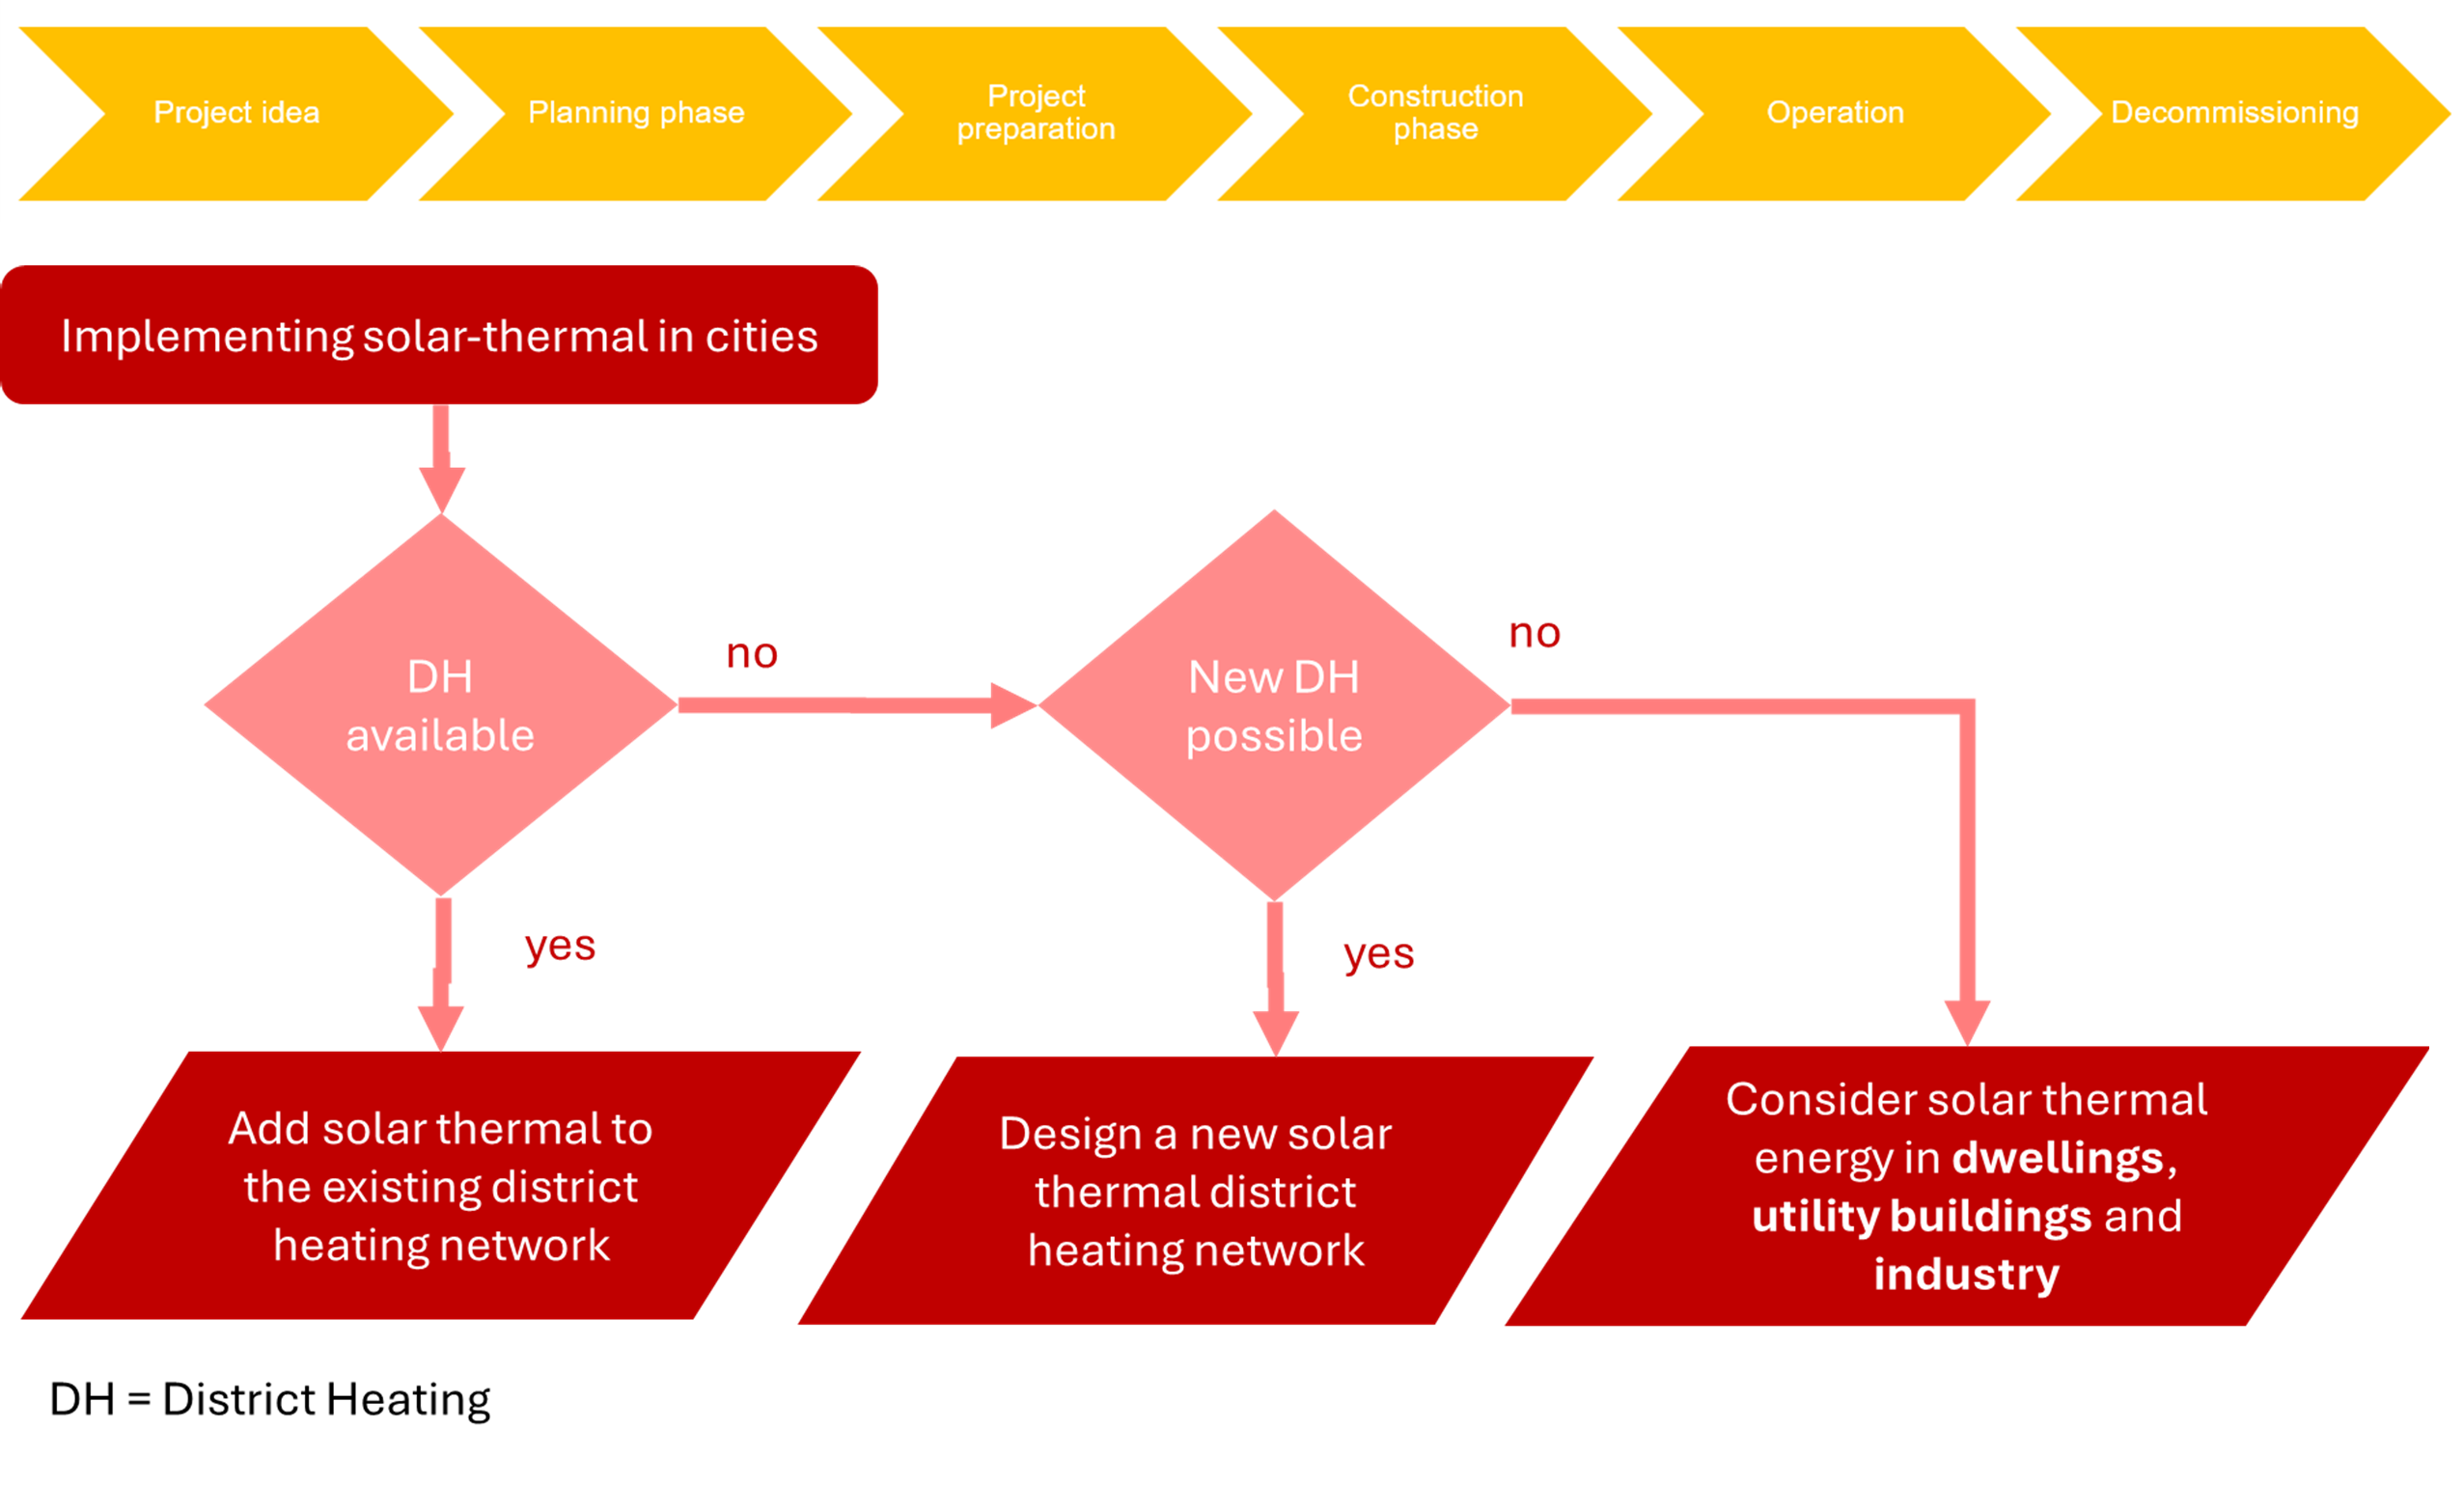
Thermal Solar Plants: Life Cycle and Planning
Stages in the solar thermal plant life cycle (top), flow chart for the decision about implementation of solar district heating (bottom)
Copyright: © IEA SHC Task 68 – Subtask C

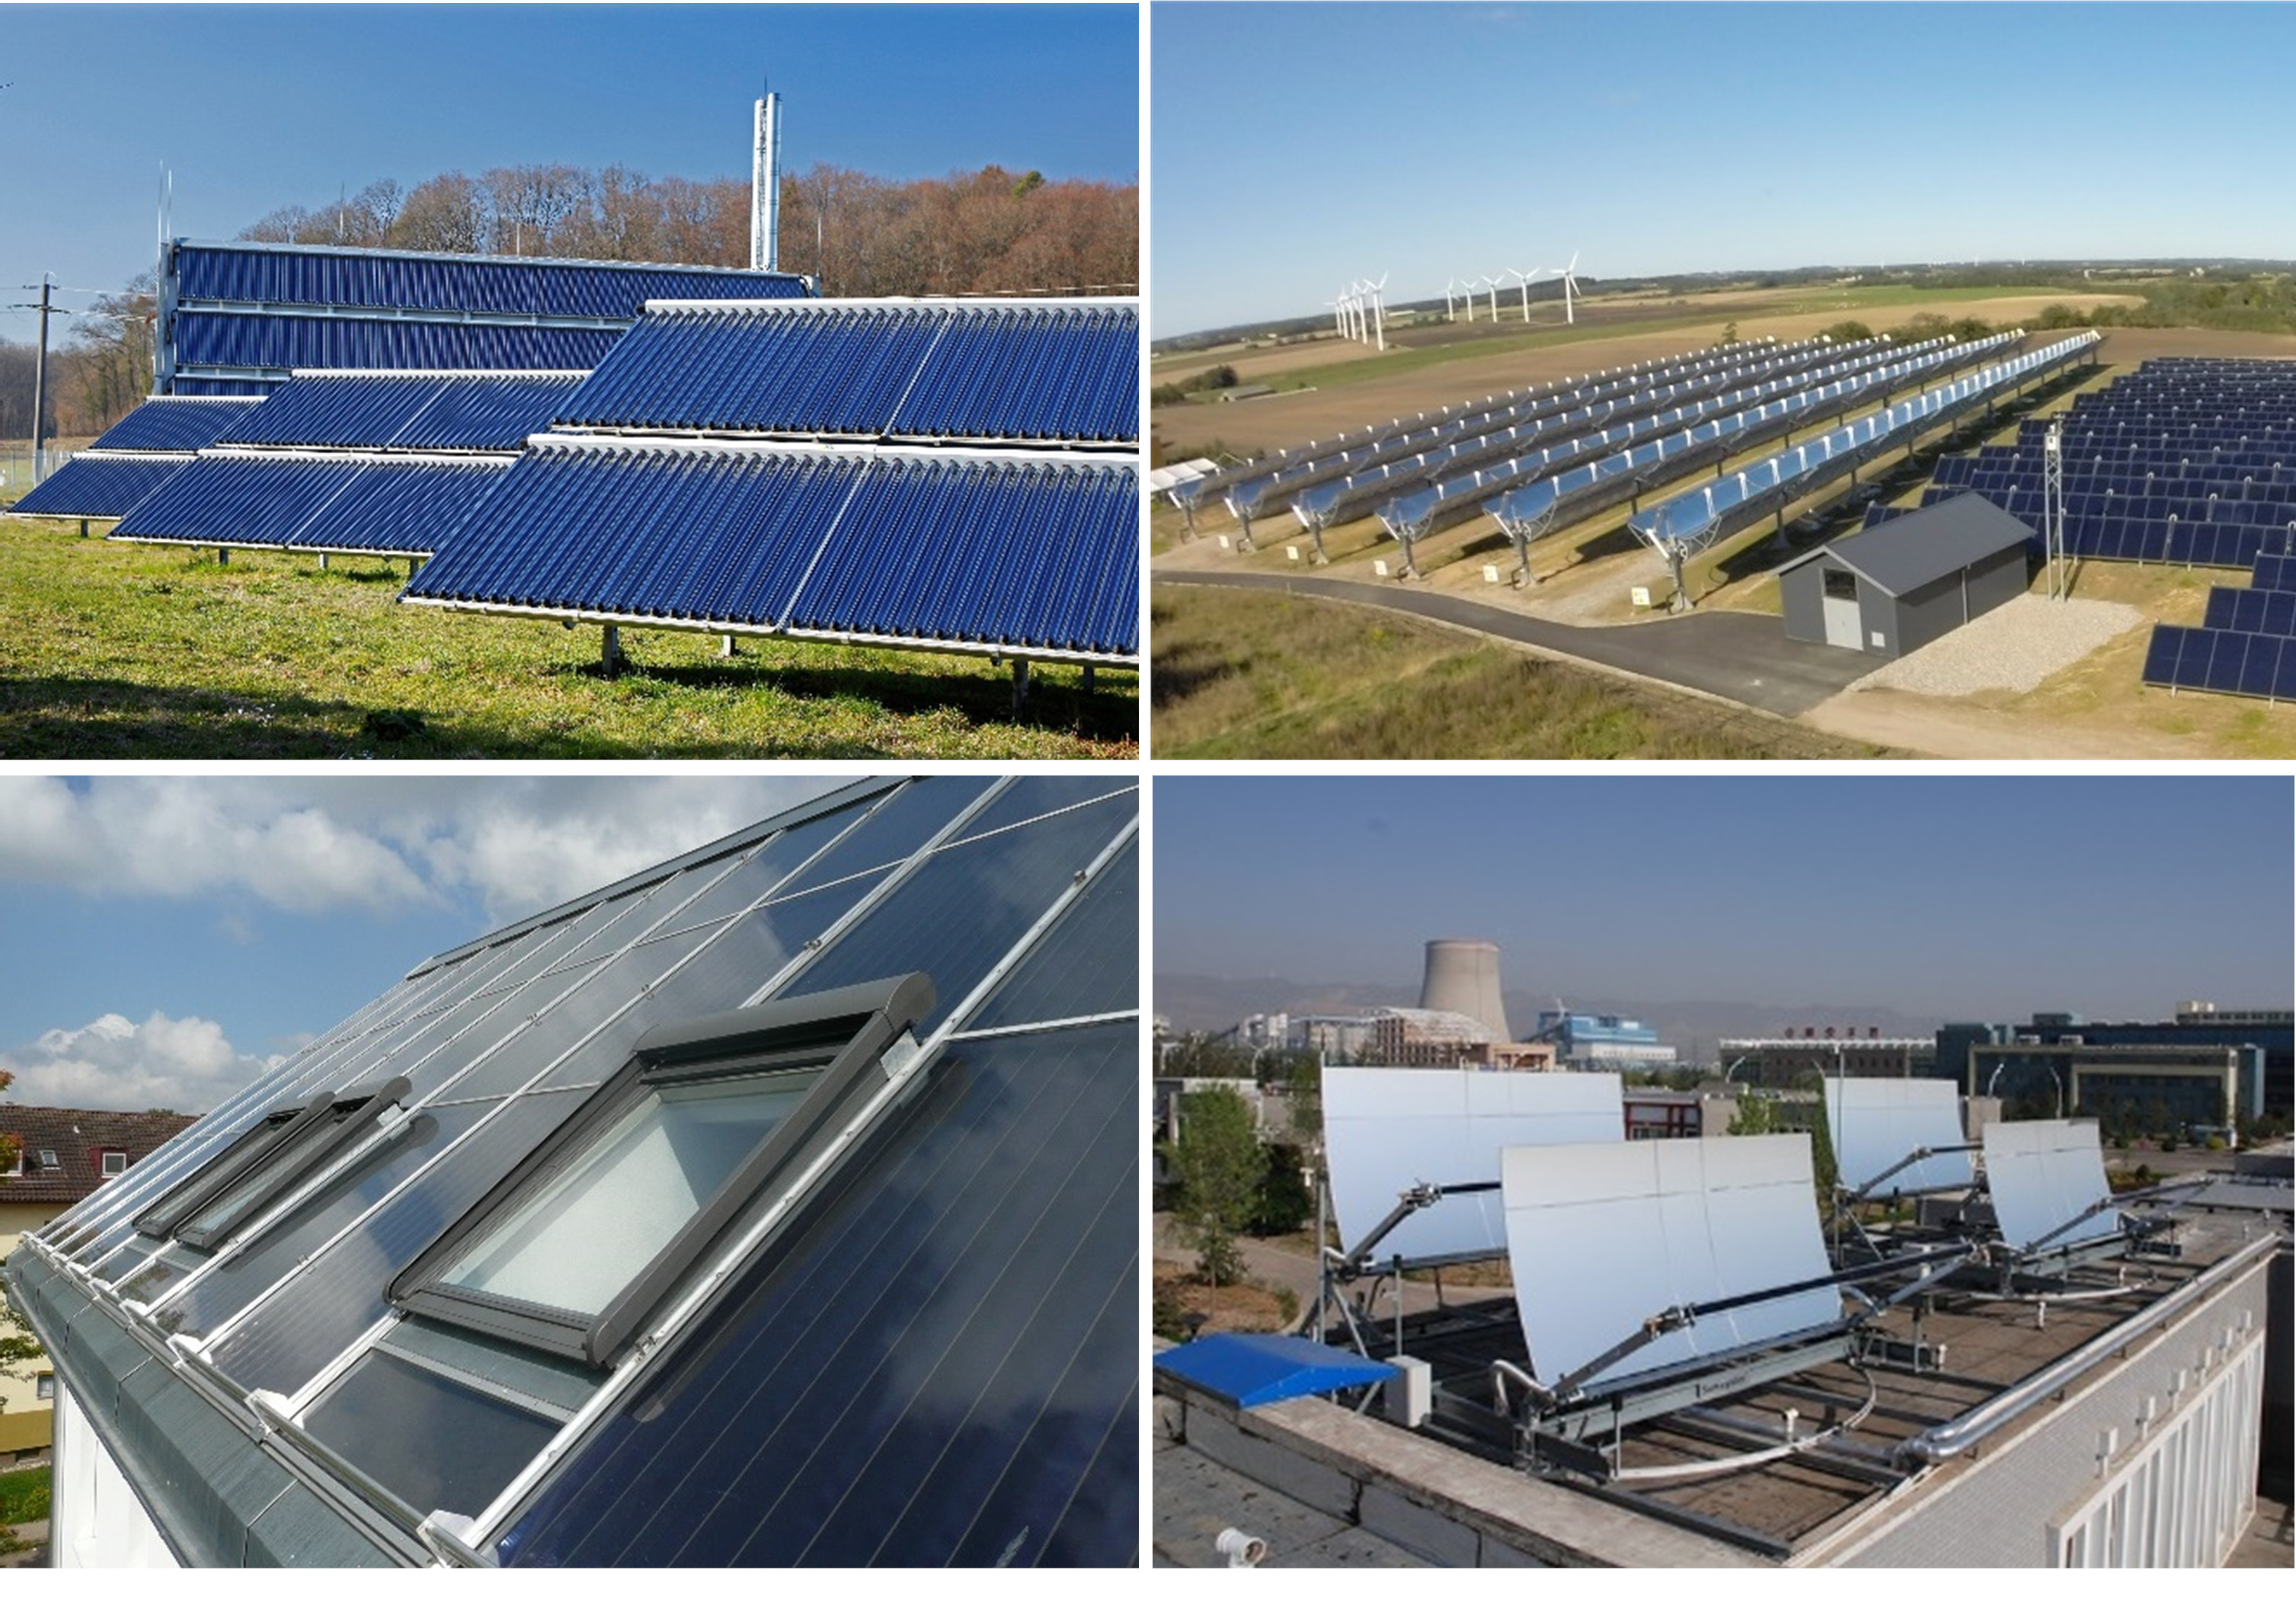
Examples for modern solar thermal collectors
Ground mounted evacuated tube collectors in Büsingen, Germany; combination of flat plate collectors and parabolic trough collectors in Taars, Denmark; roof integrated solar thermal collectors on “solar@home” building in Crailsheim, Germany; demo system of Sun Oyster on a flat roof in Zhangjiakou, China
Copyright: © Solites, Aalborg CSP und sunoyster.com
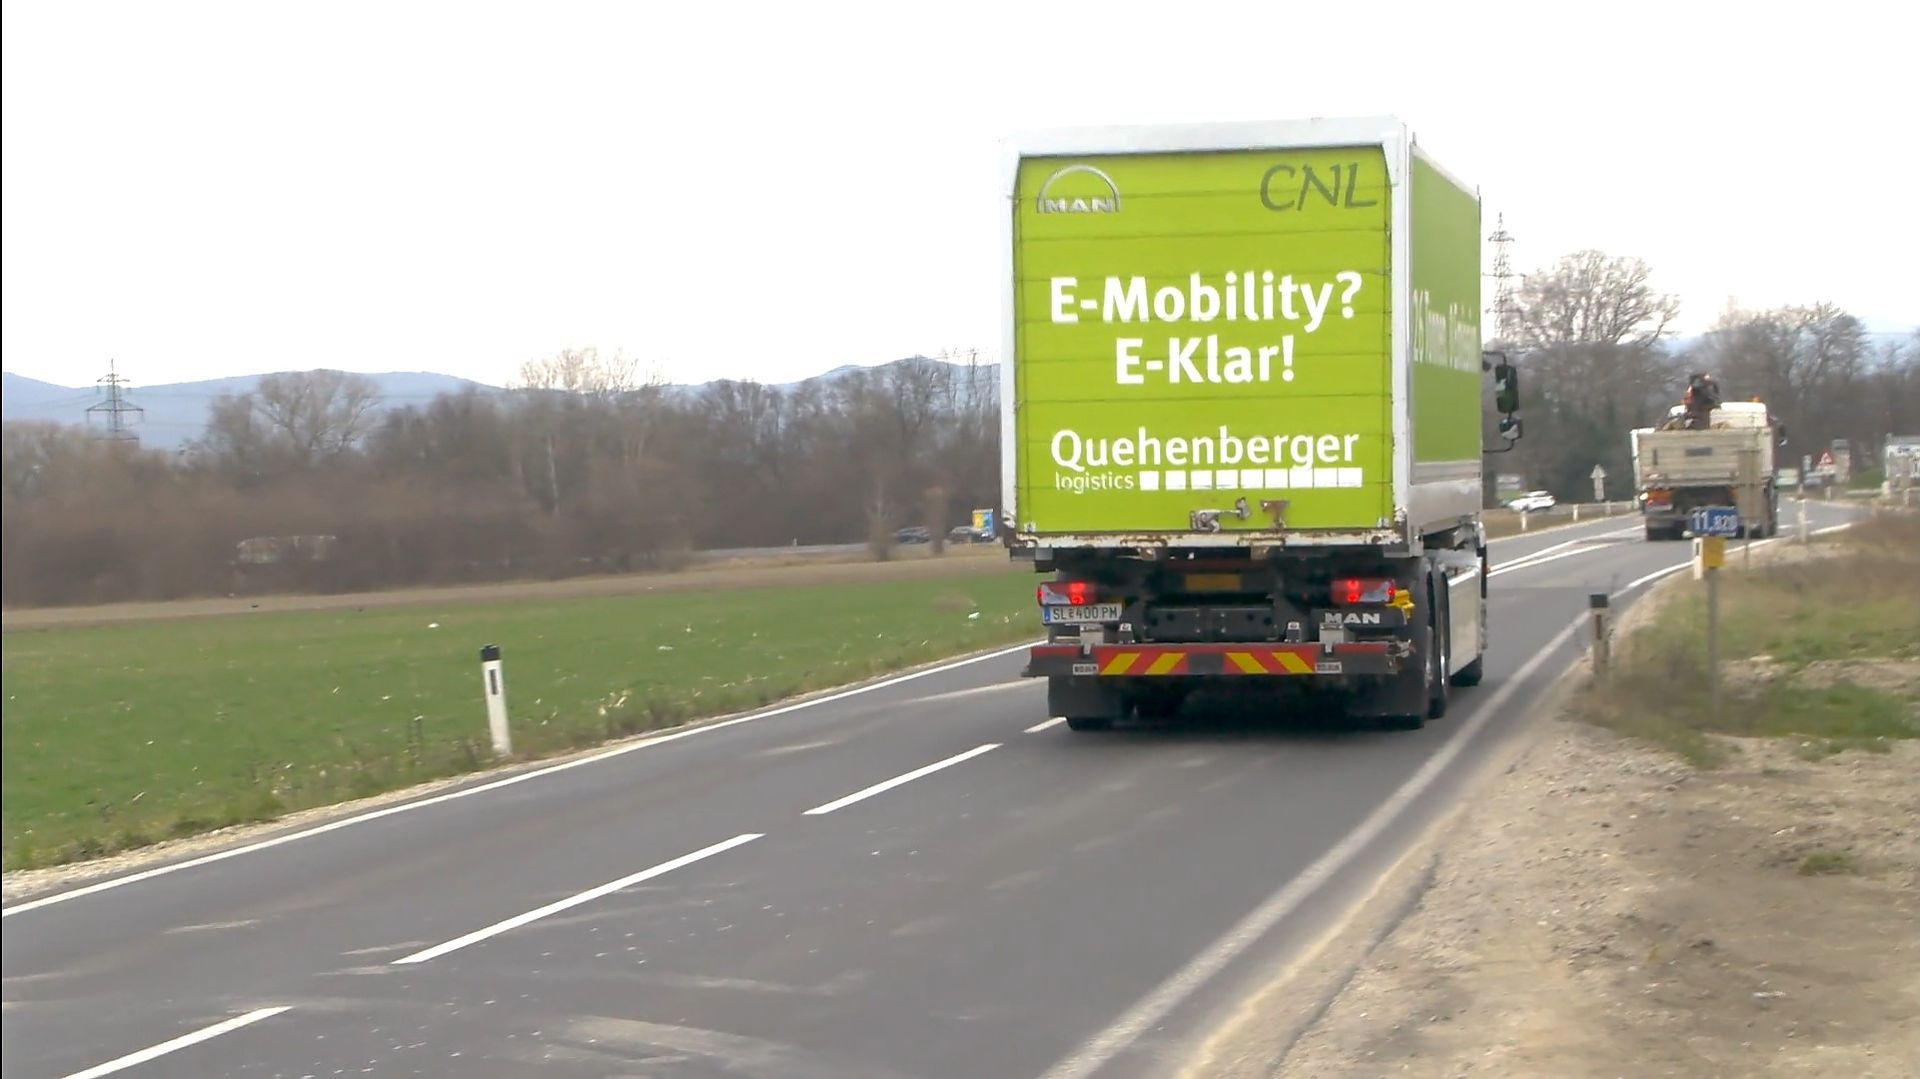
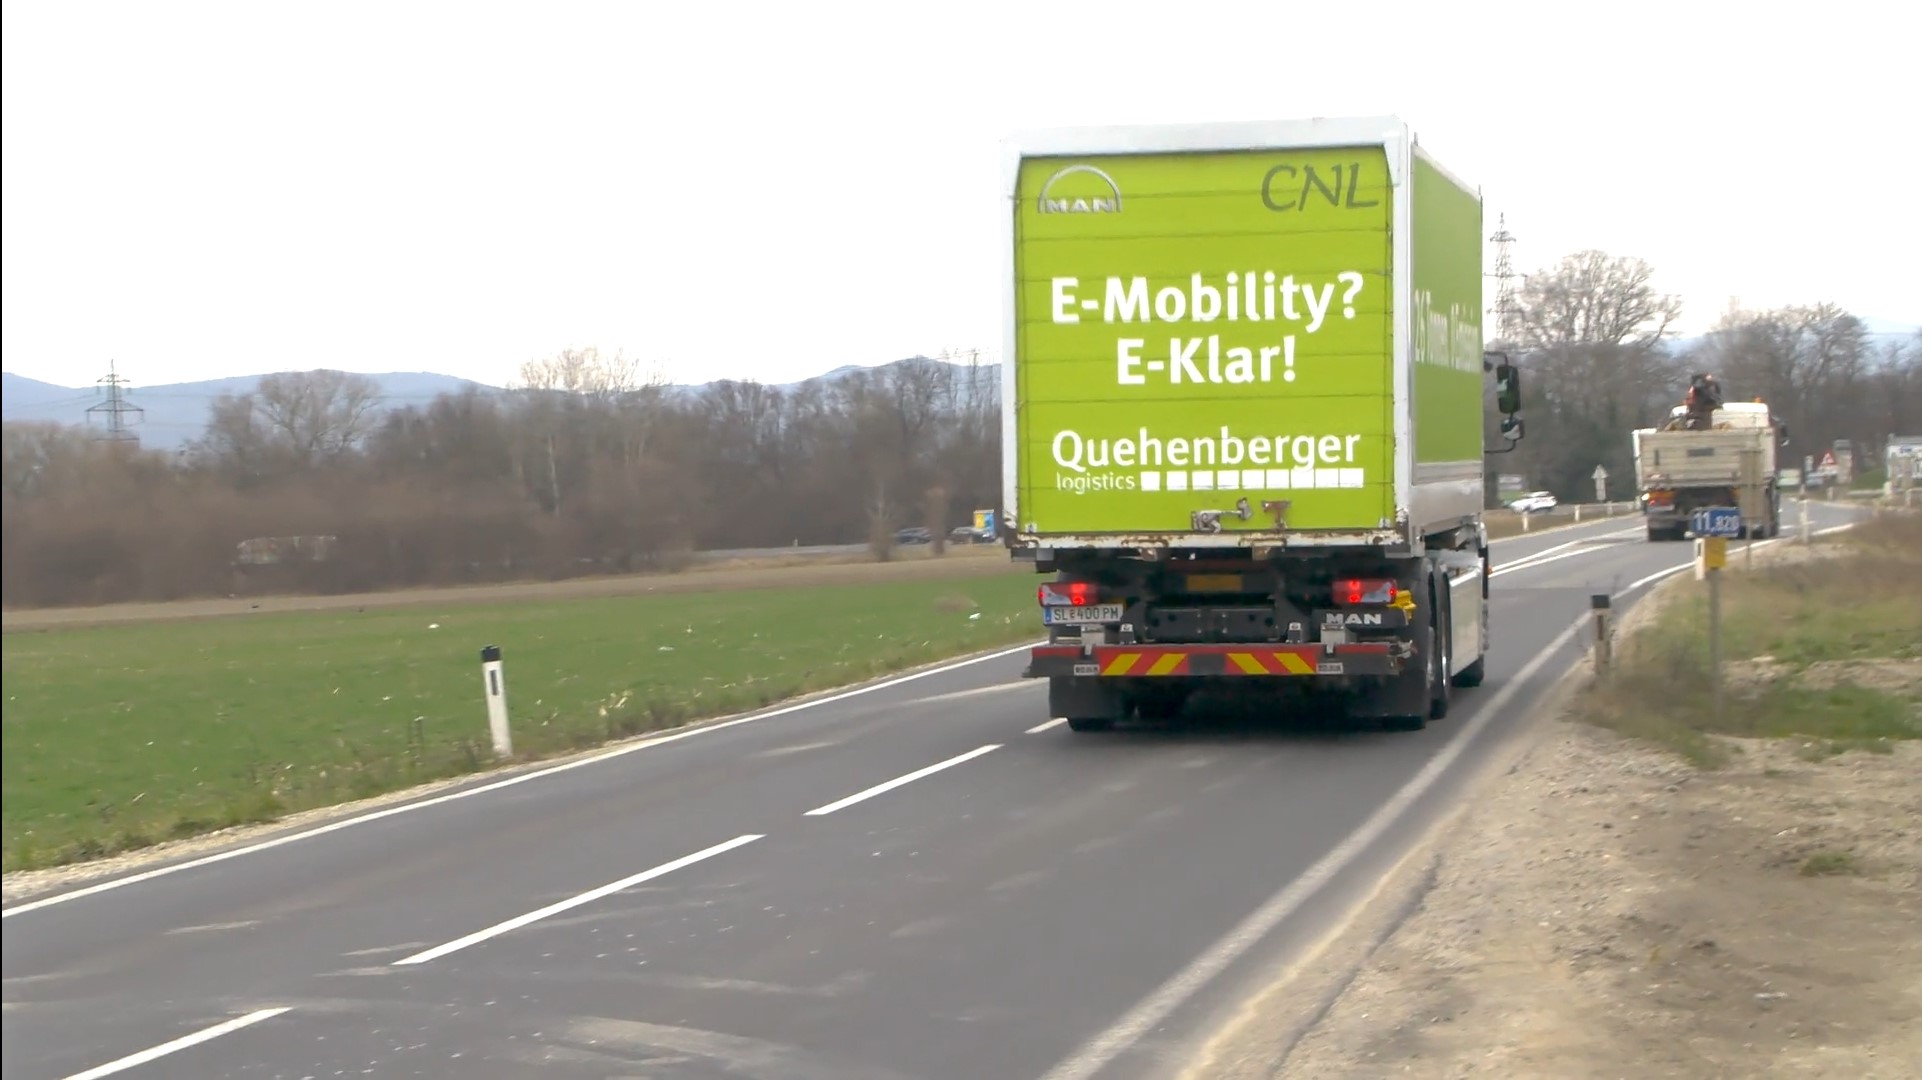
E-truck on country road
Electric Truck Prototype (26 to) during overland field test at Austrian Logistics company, member of Council of Sustainable Logistics.
Copyright: CNL/EVN/Vouillarmet 2021
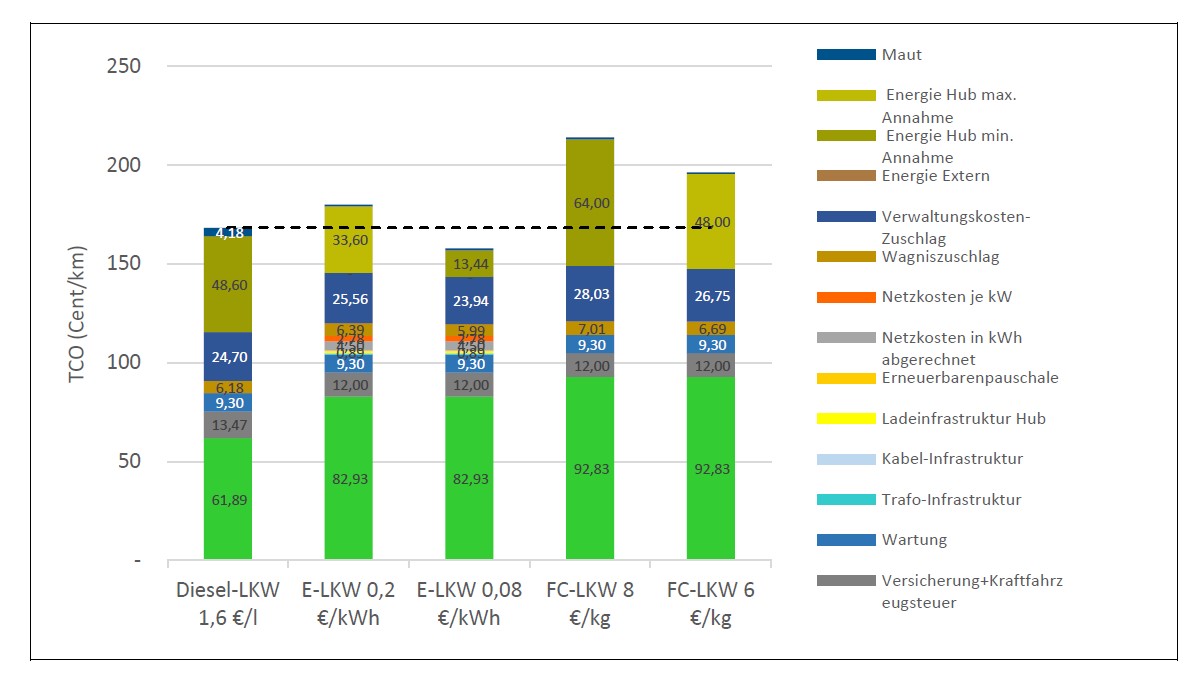
TCO of the various drive technologies compared
Total cost of ownership (TCO) of Diesel, electric and FCEV trucks under different energy price assumptions. Use case: Retail in one-shift operation.
Copyright: CNL (2022)
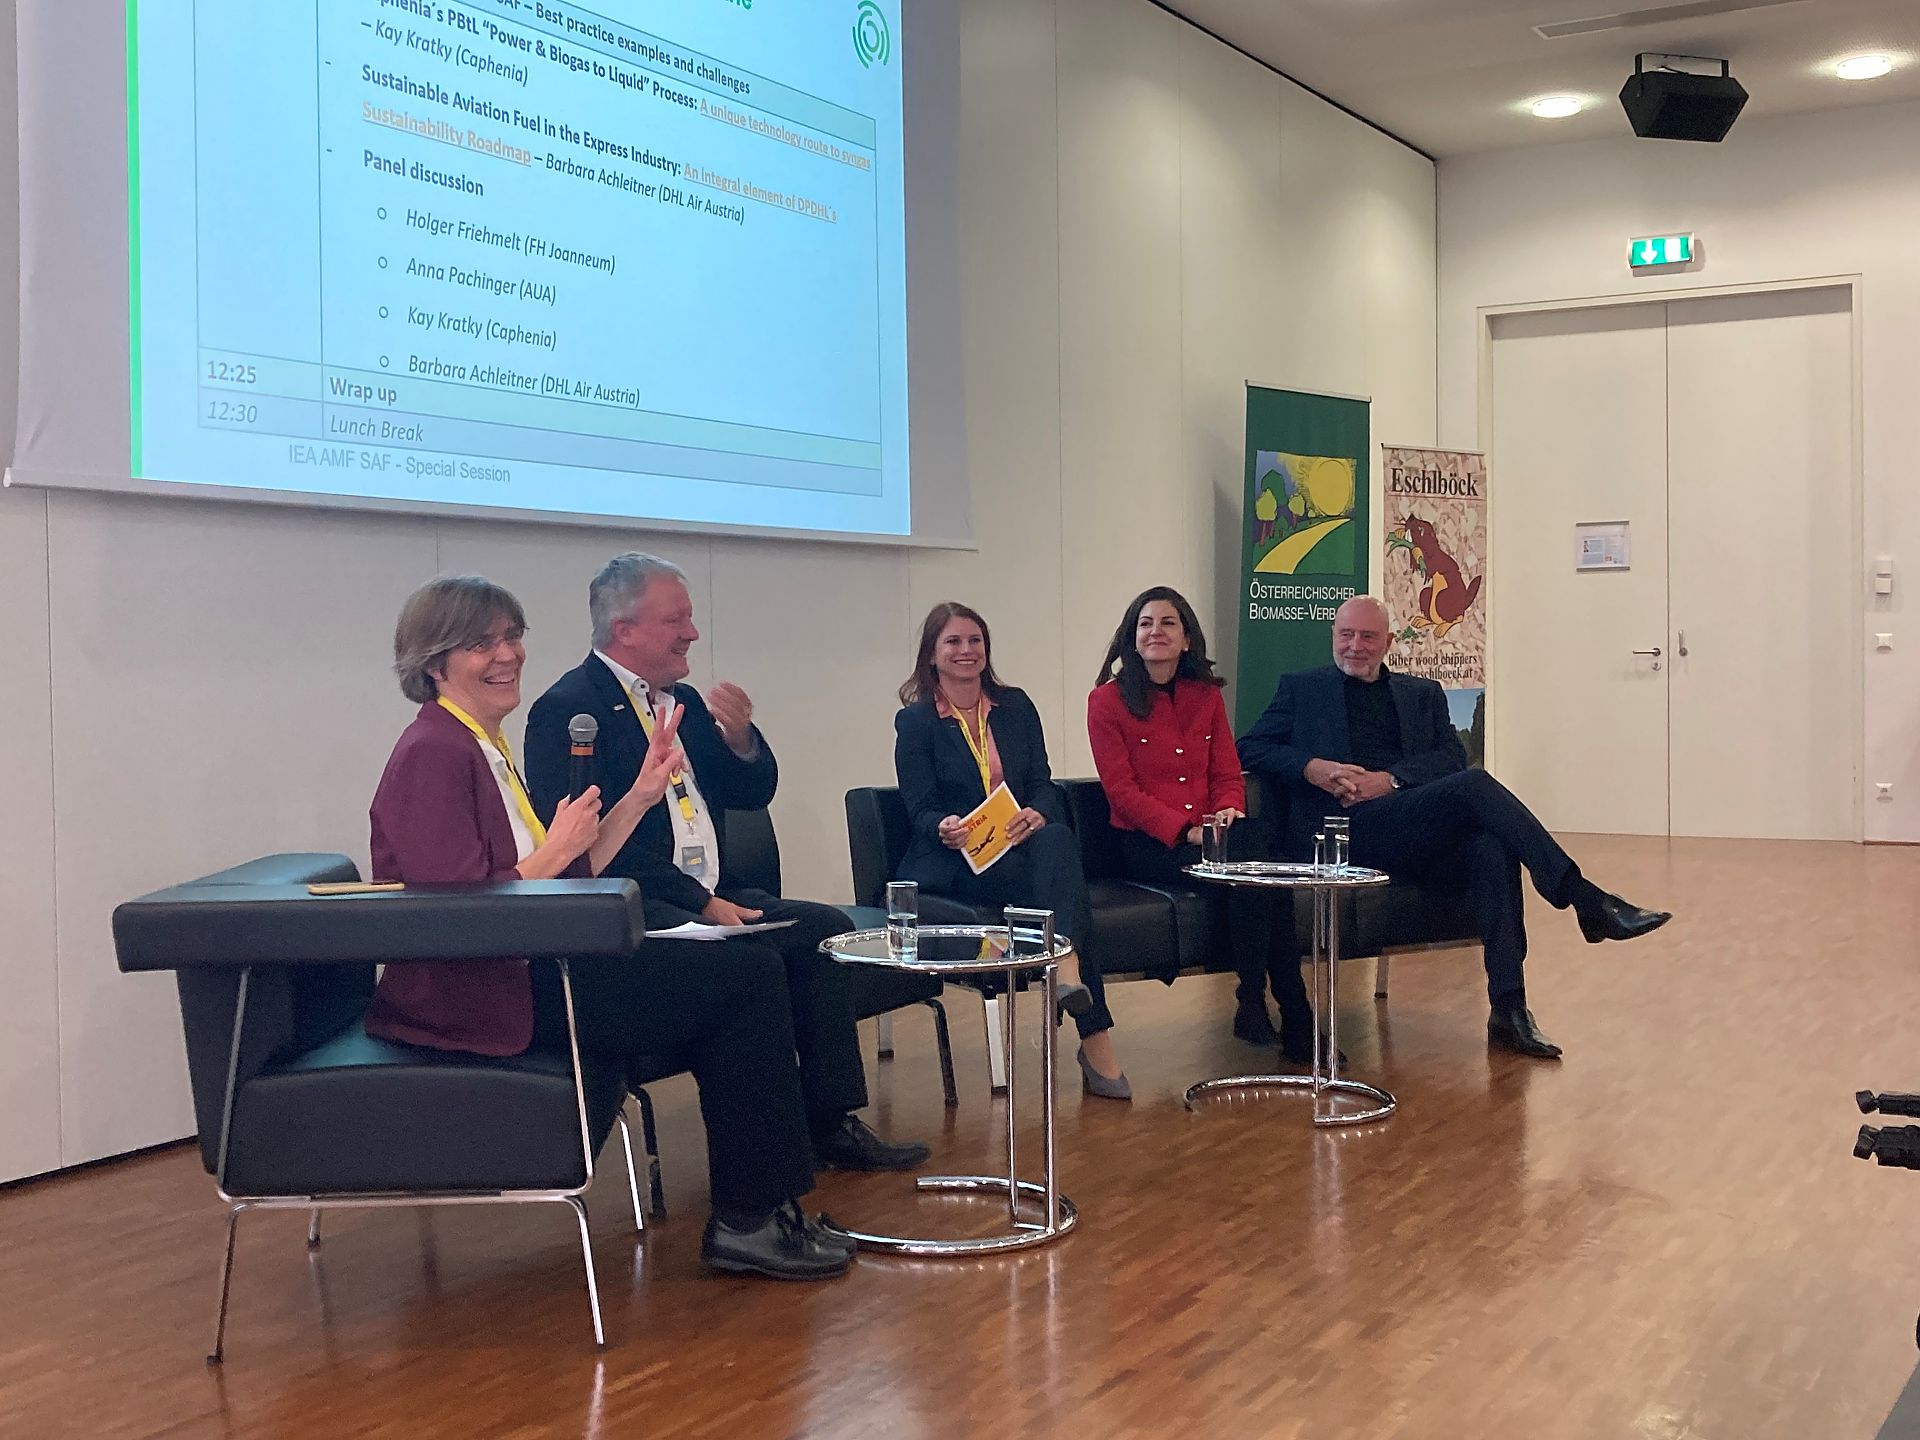
AMF Task 63: Workshop Panel
Panel discussion with Dina Bacovsky, Holger Friehmelt, Barbara Achleitner, Anna Pachinger and Kay Kratky
Copyright: Doris Matschegg
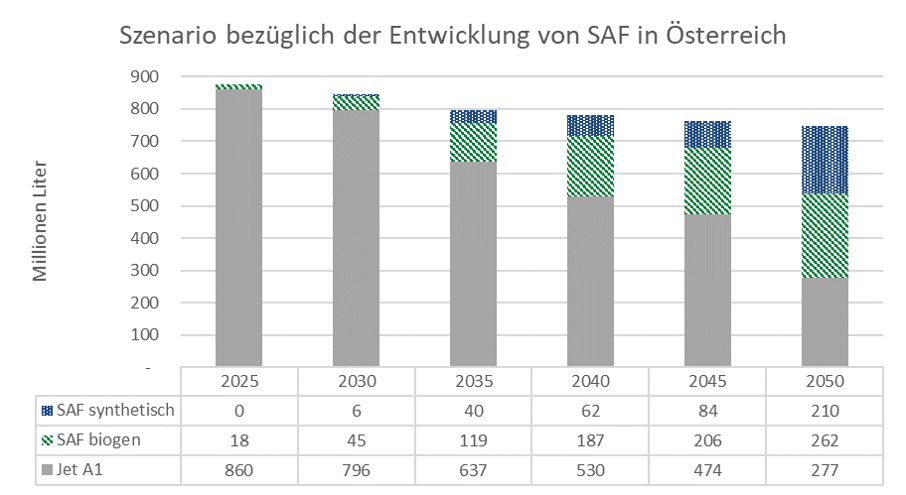
AMF Task 63: Development of SAF in Austria
Scenario regarding the development of SAF in Austria until 2050
Copyright: Doris Matschegg
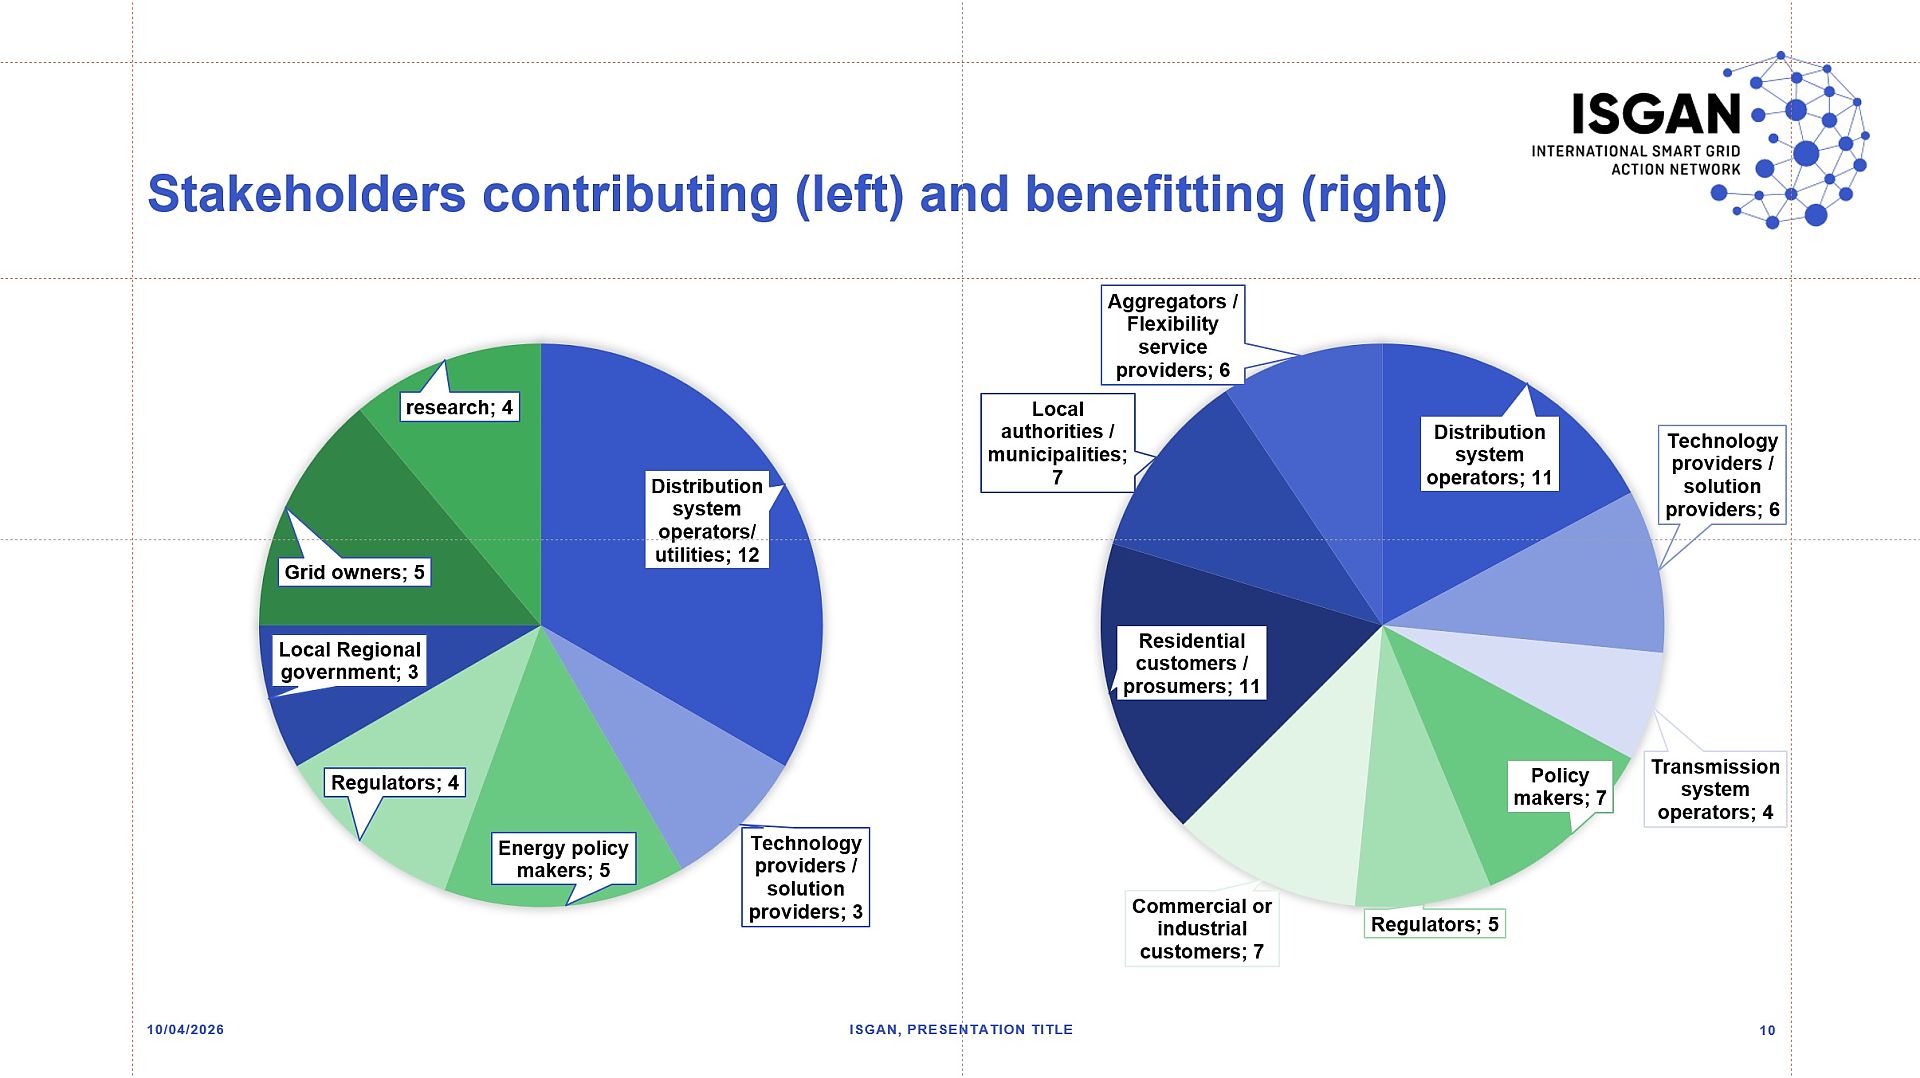
Stakeholders contributing and benefiting from the innovations in the ISGAN Casebook
The chart compares the stakeholders who contributed to the case studies in the ISGAN Casebook on planning smart distribution grids with those who benefited from them.
Copyright: Susanne Windischberger
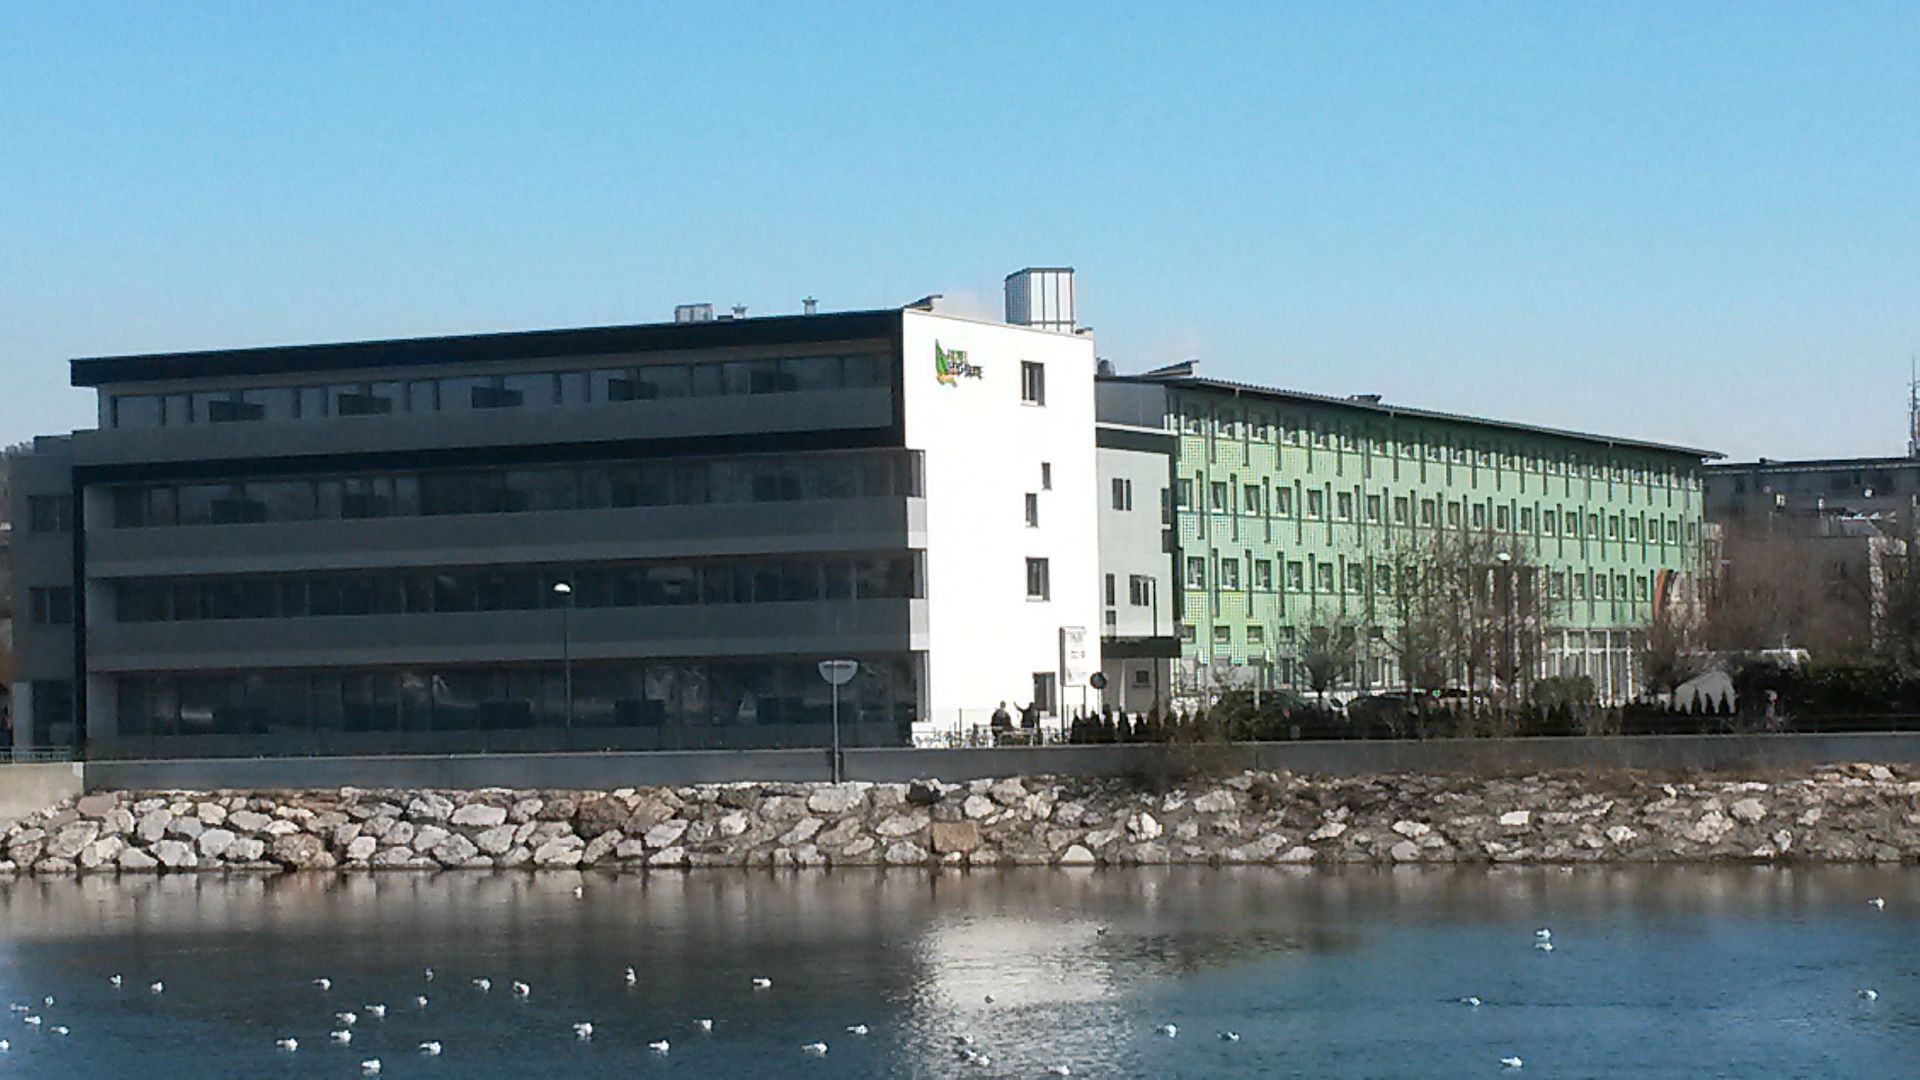
Eco-Suite-Hotel and Kolpighaus
The picture shows the Eco-Suite hotel and in the background the Kolpighaus, the picture is taken from the opposite side of the river Salzach.
Copyright: Robert Freund

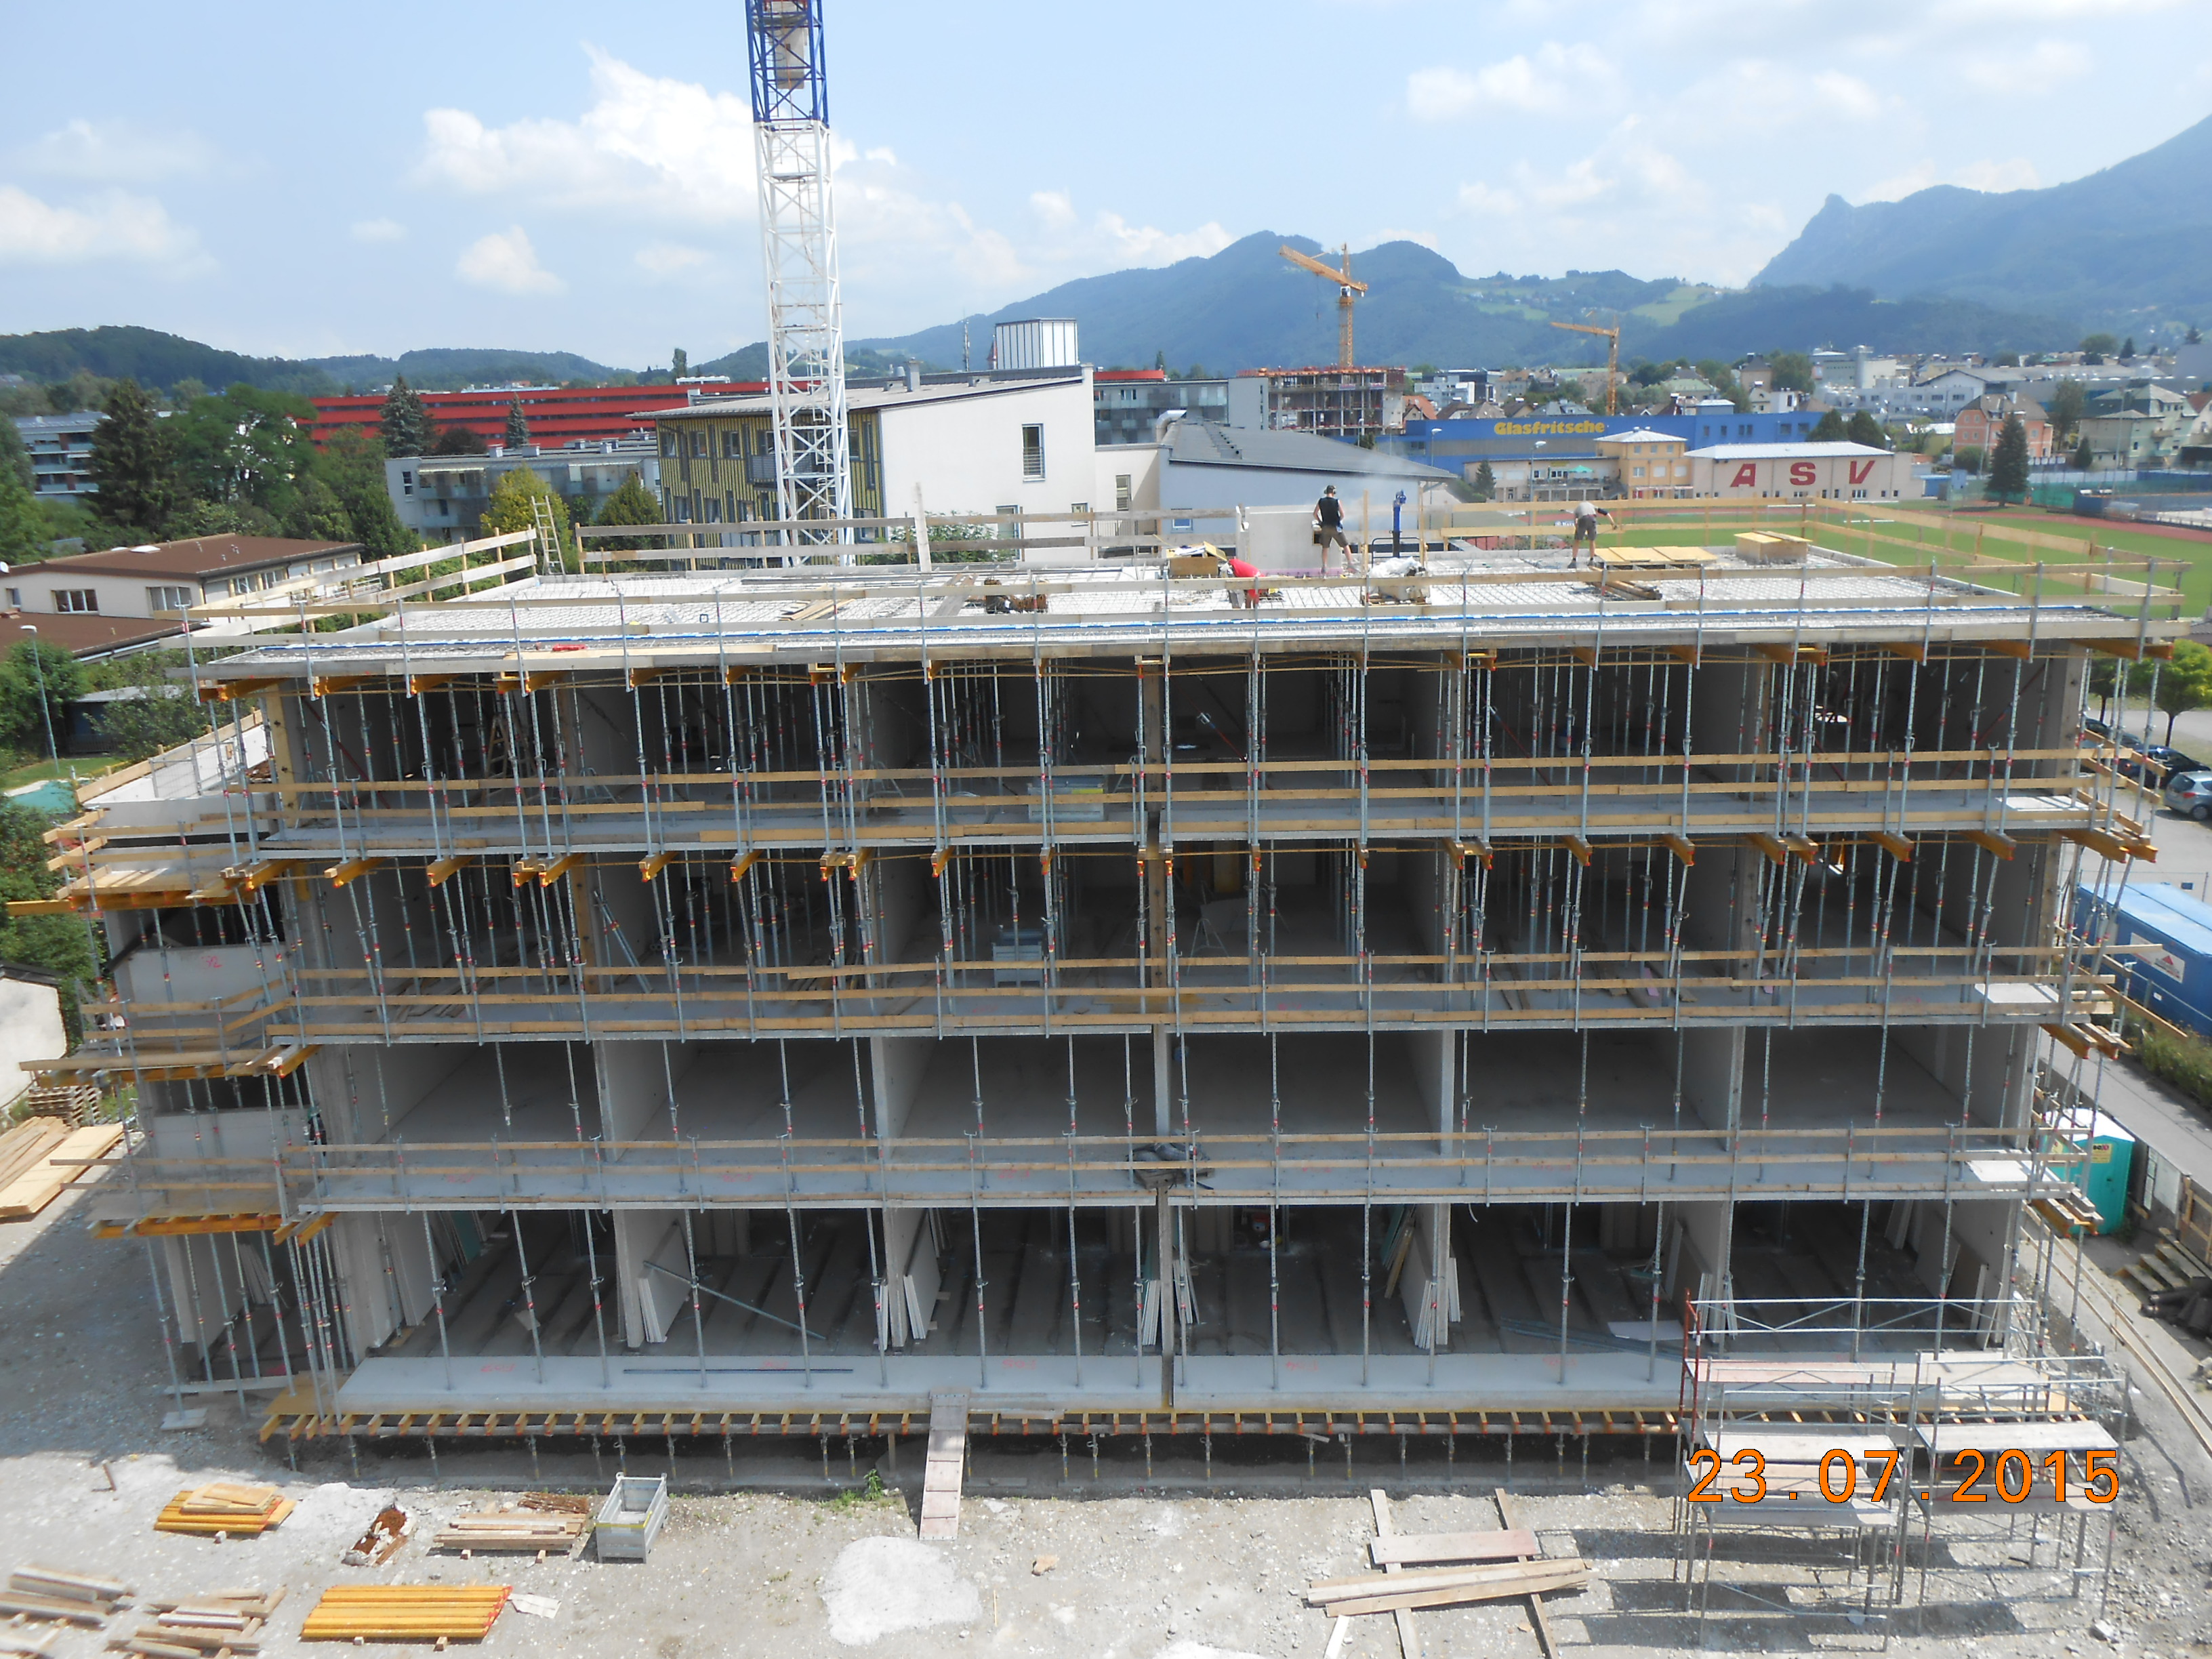
Construction site of Eco-Suite hotel in July 2015
The photo shows the construction side in July 2015, the facade oriented towards the river Salzach.