Project Image Pool
There are 416 results.
Terms of use: The pictures on this site originate from the projects in the frame of the programmes City of Tomorrow, Building of Tomorrow and the IEA Research Cooperation. They may be used credited for non-commercial purposes under the Creative Commons License Attribution-NonCommercial (CC BY-NC).


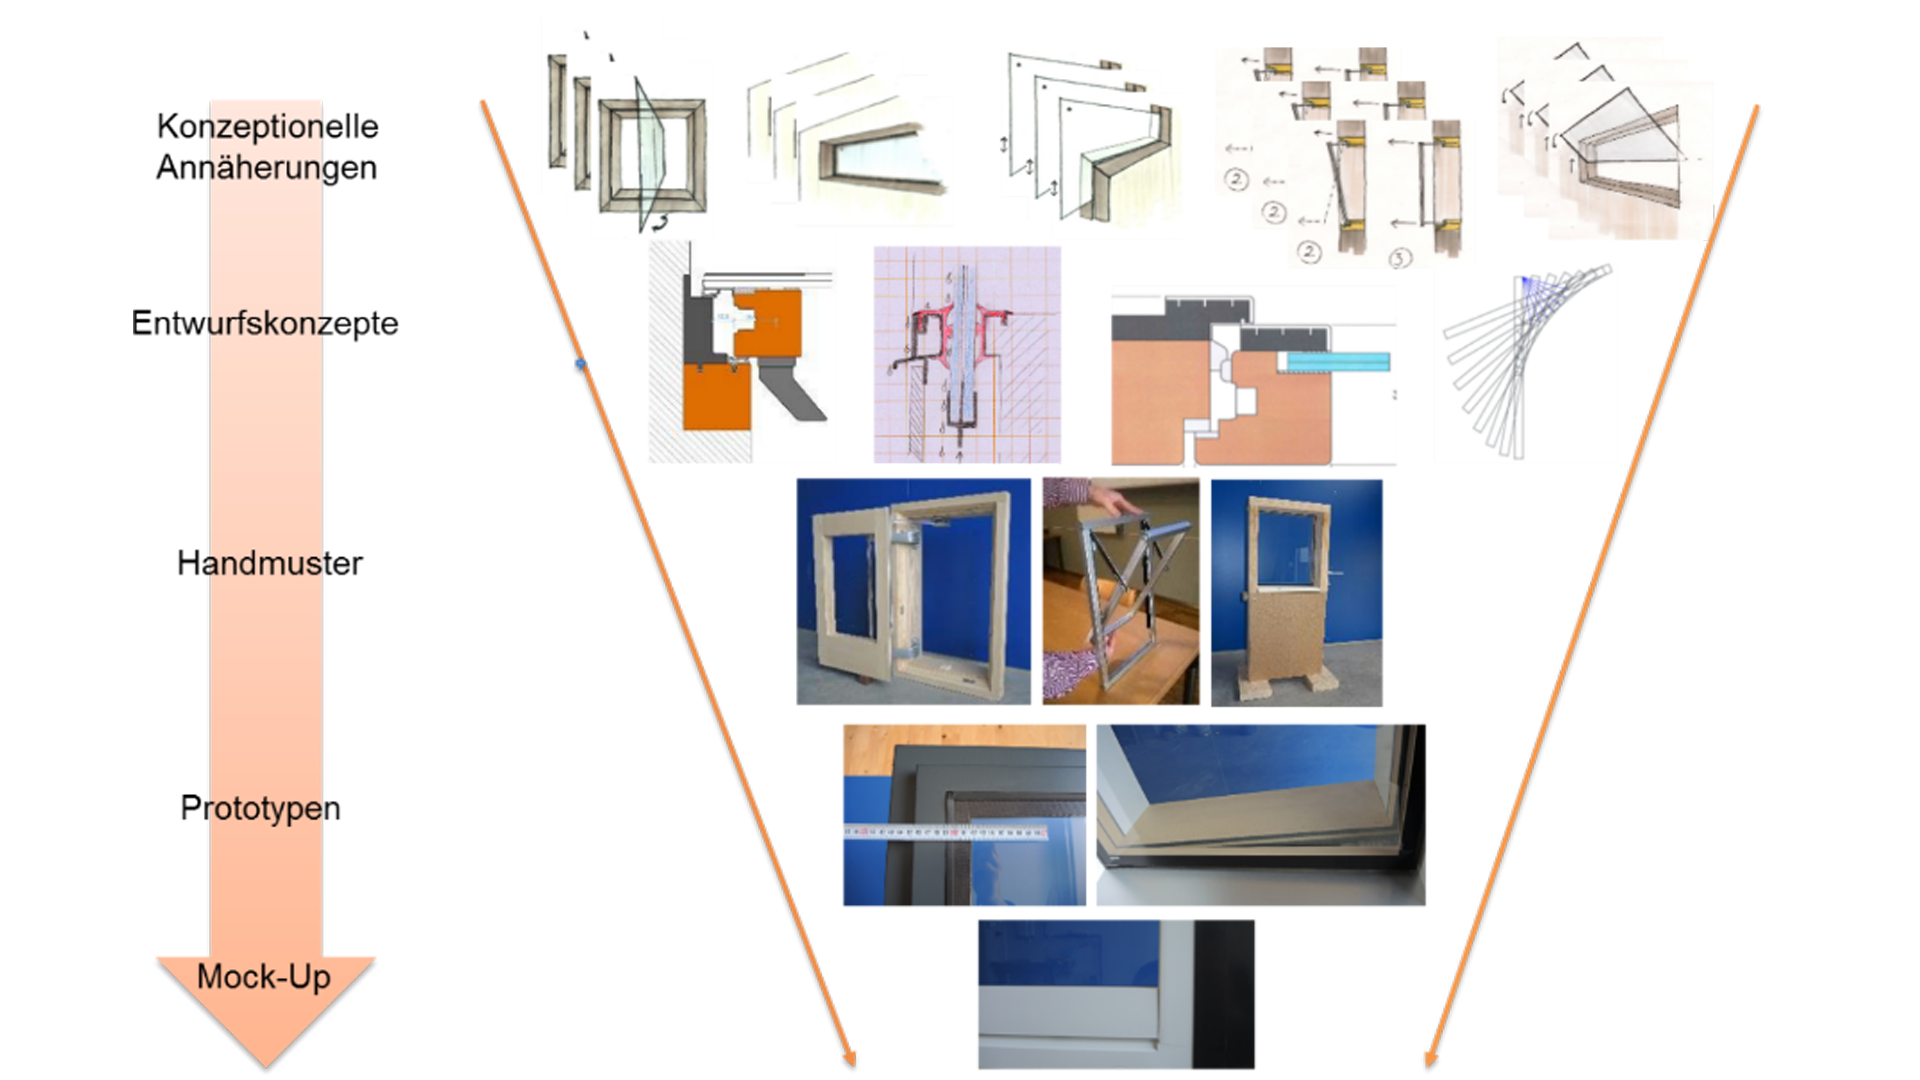
Reductive Approach toward new window concepts for vacuumglass windows
Reductive Approach for different vacuum-glass-windows: concepts - sketches - specimen - prototypes - mock-ups
Copyright: Team Projekt MOTIVE (Abt. Bauphysik und Bauökologie, TU Wien & Holzforschung Austria)
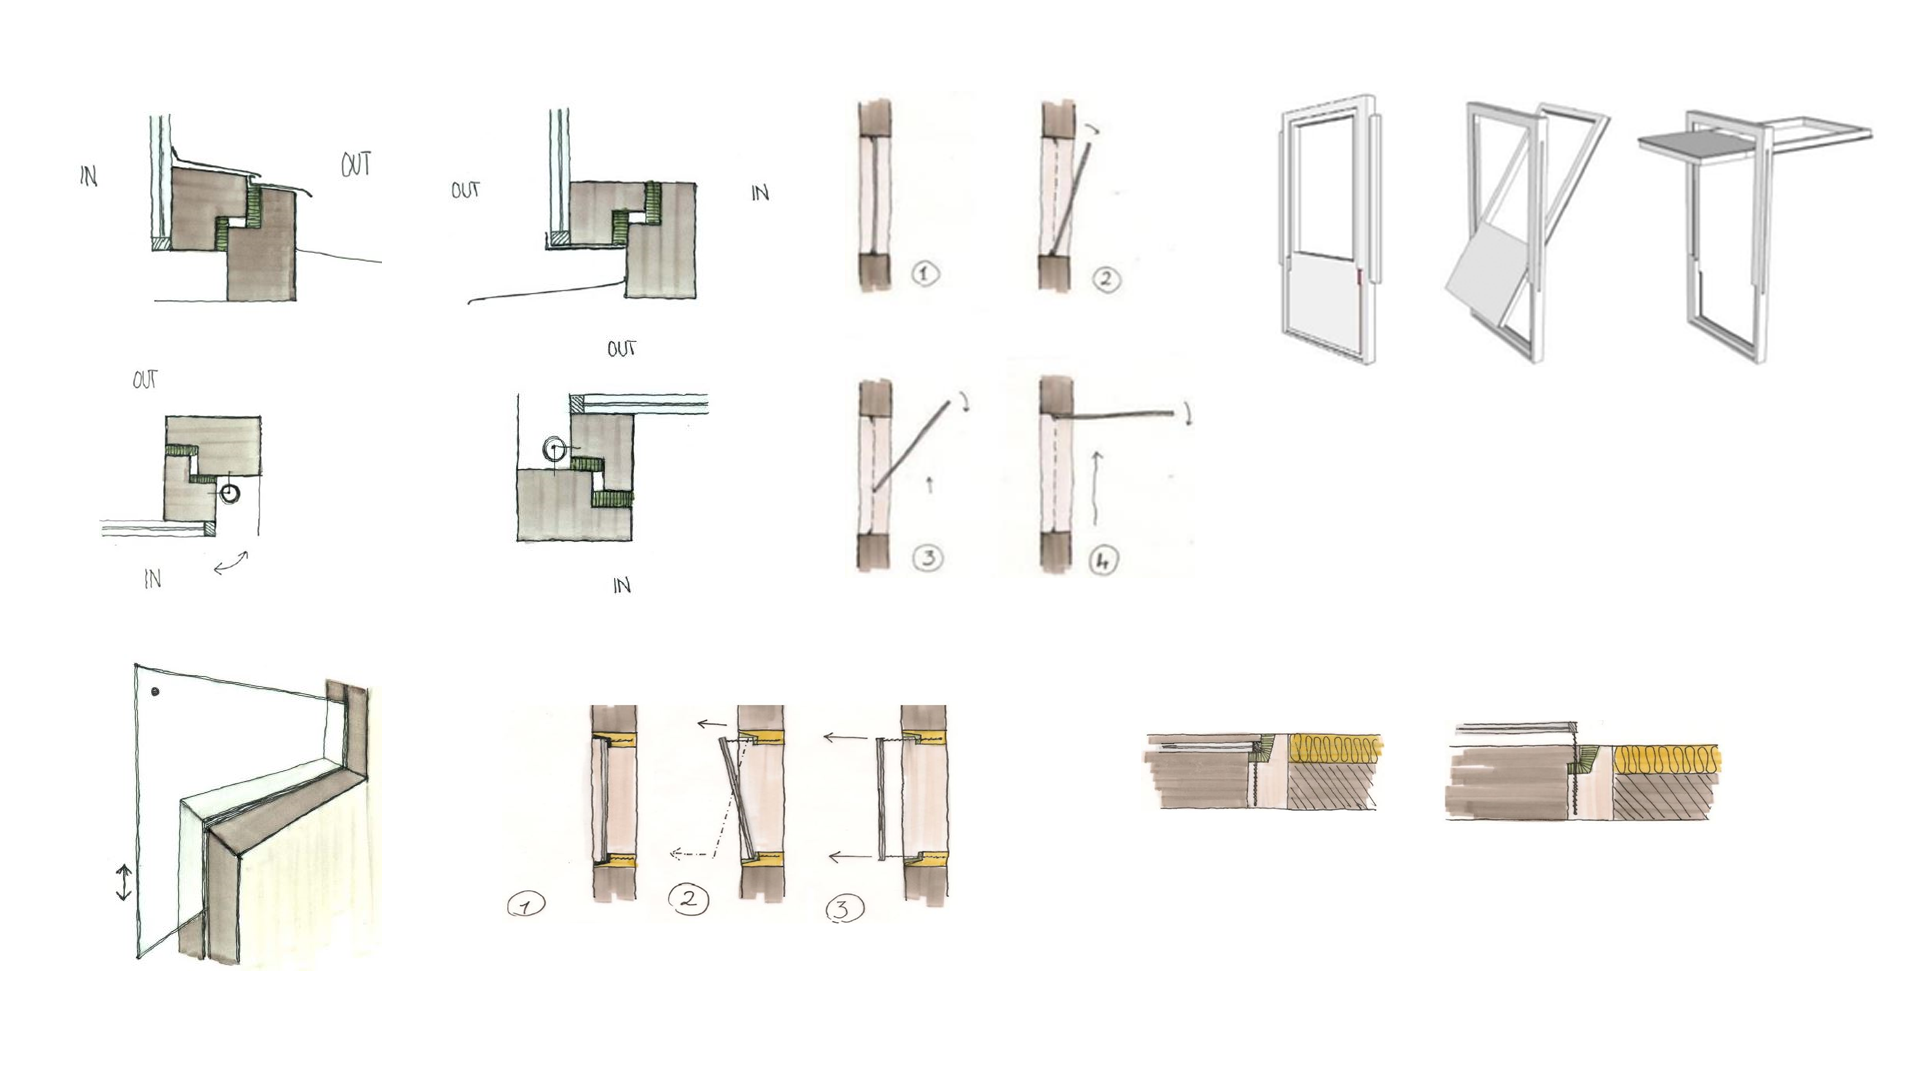
Different Window-Concepts
Different Design-Sketches of unconventional Windows with Vacuumglazing. All of them do feature unconventional opening / operation schemes
Copyright: Team Projekt MOTIVE (Abt. Bauphysik und Bauökologie, TU Wien & Holzforschung Austria)
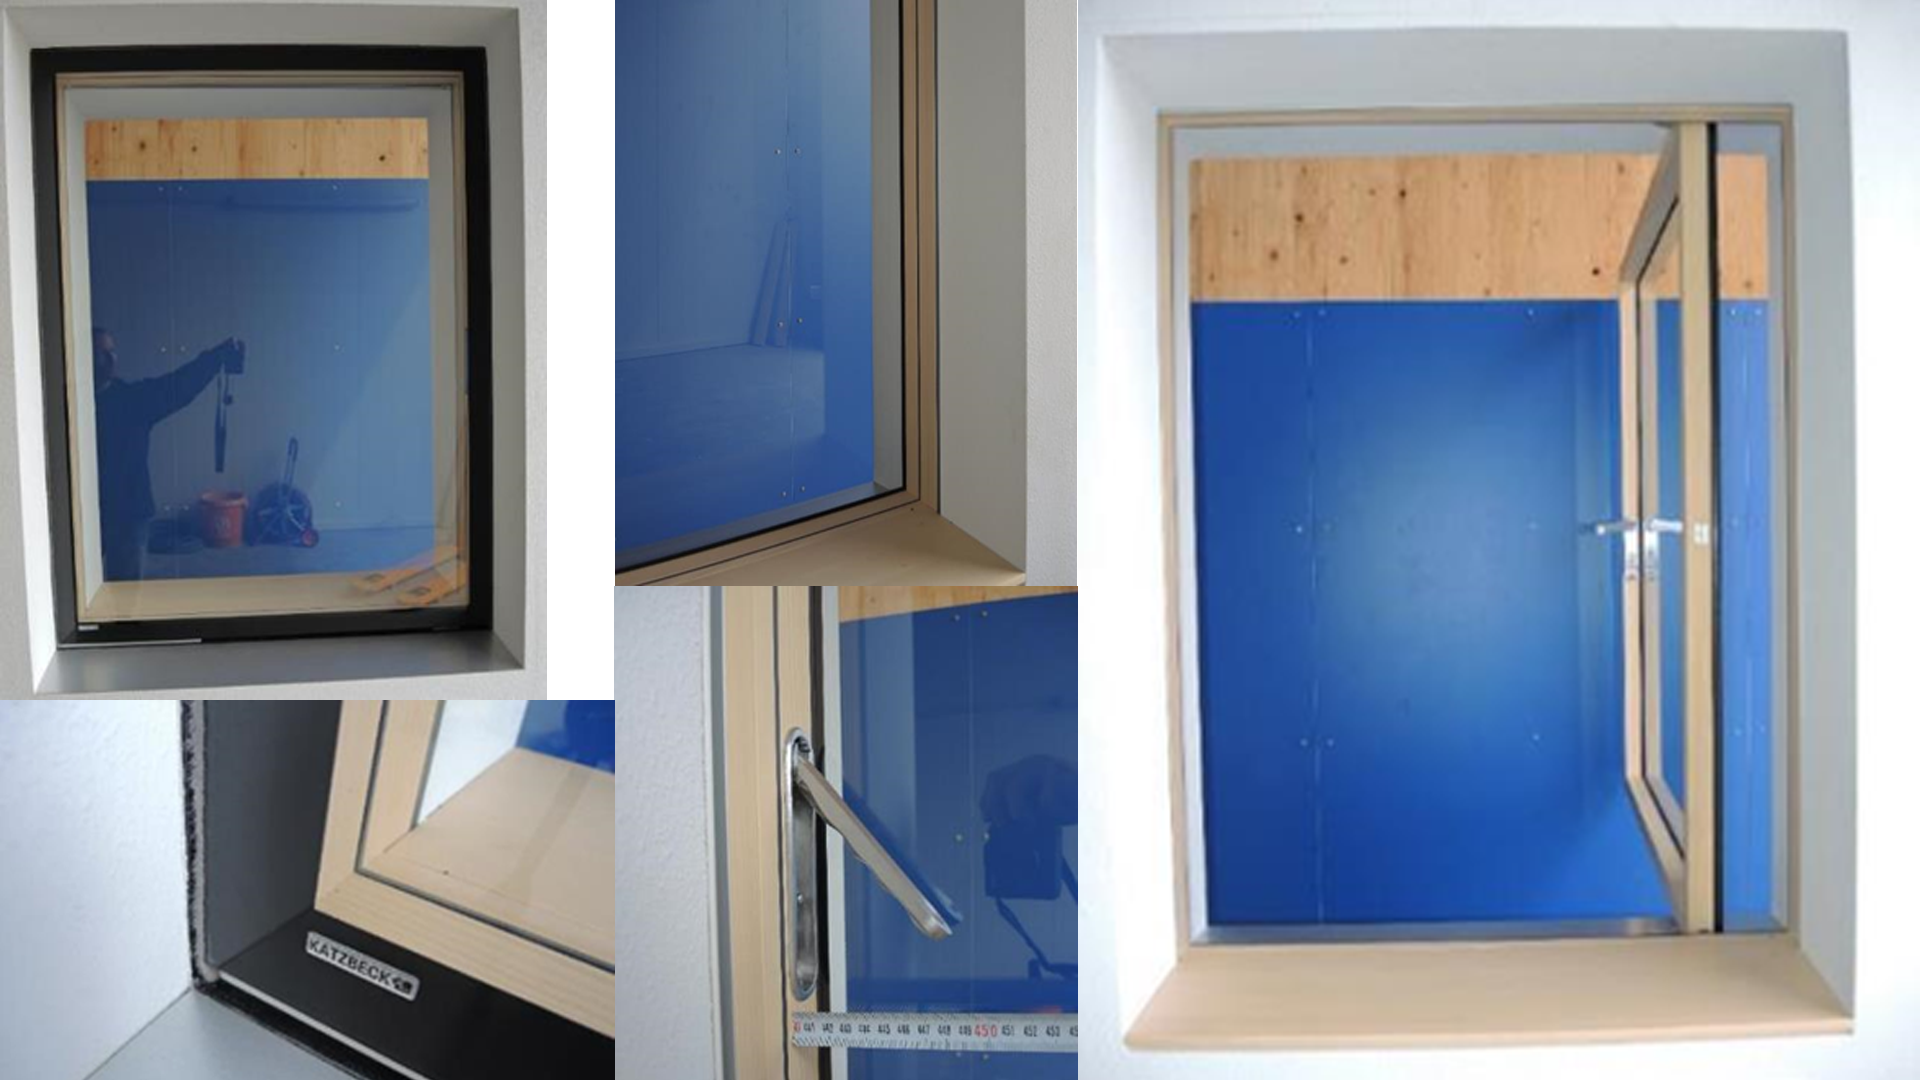
Vacuum-glazing-window with opening direction to inside and indoor-sided vacuum glazing
A set of illustrations of a window-prototype with vacuum-glazing interface on the inside and opening direction to the inside.
Copyright: Team Projekt MOTIVE (Abt. Bauphysik und Bauökologie, TU Wien & Holzforschung Austria)
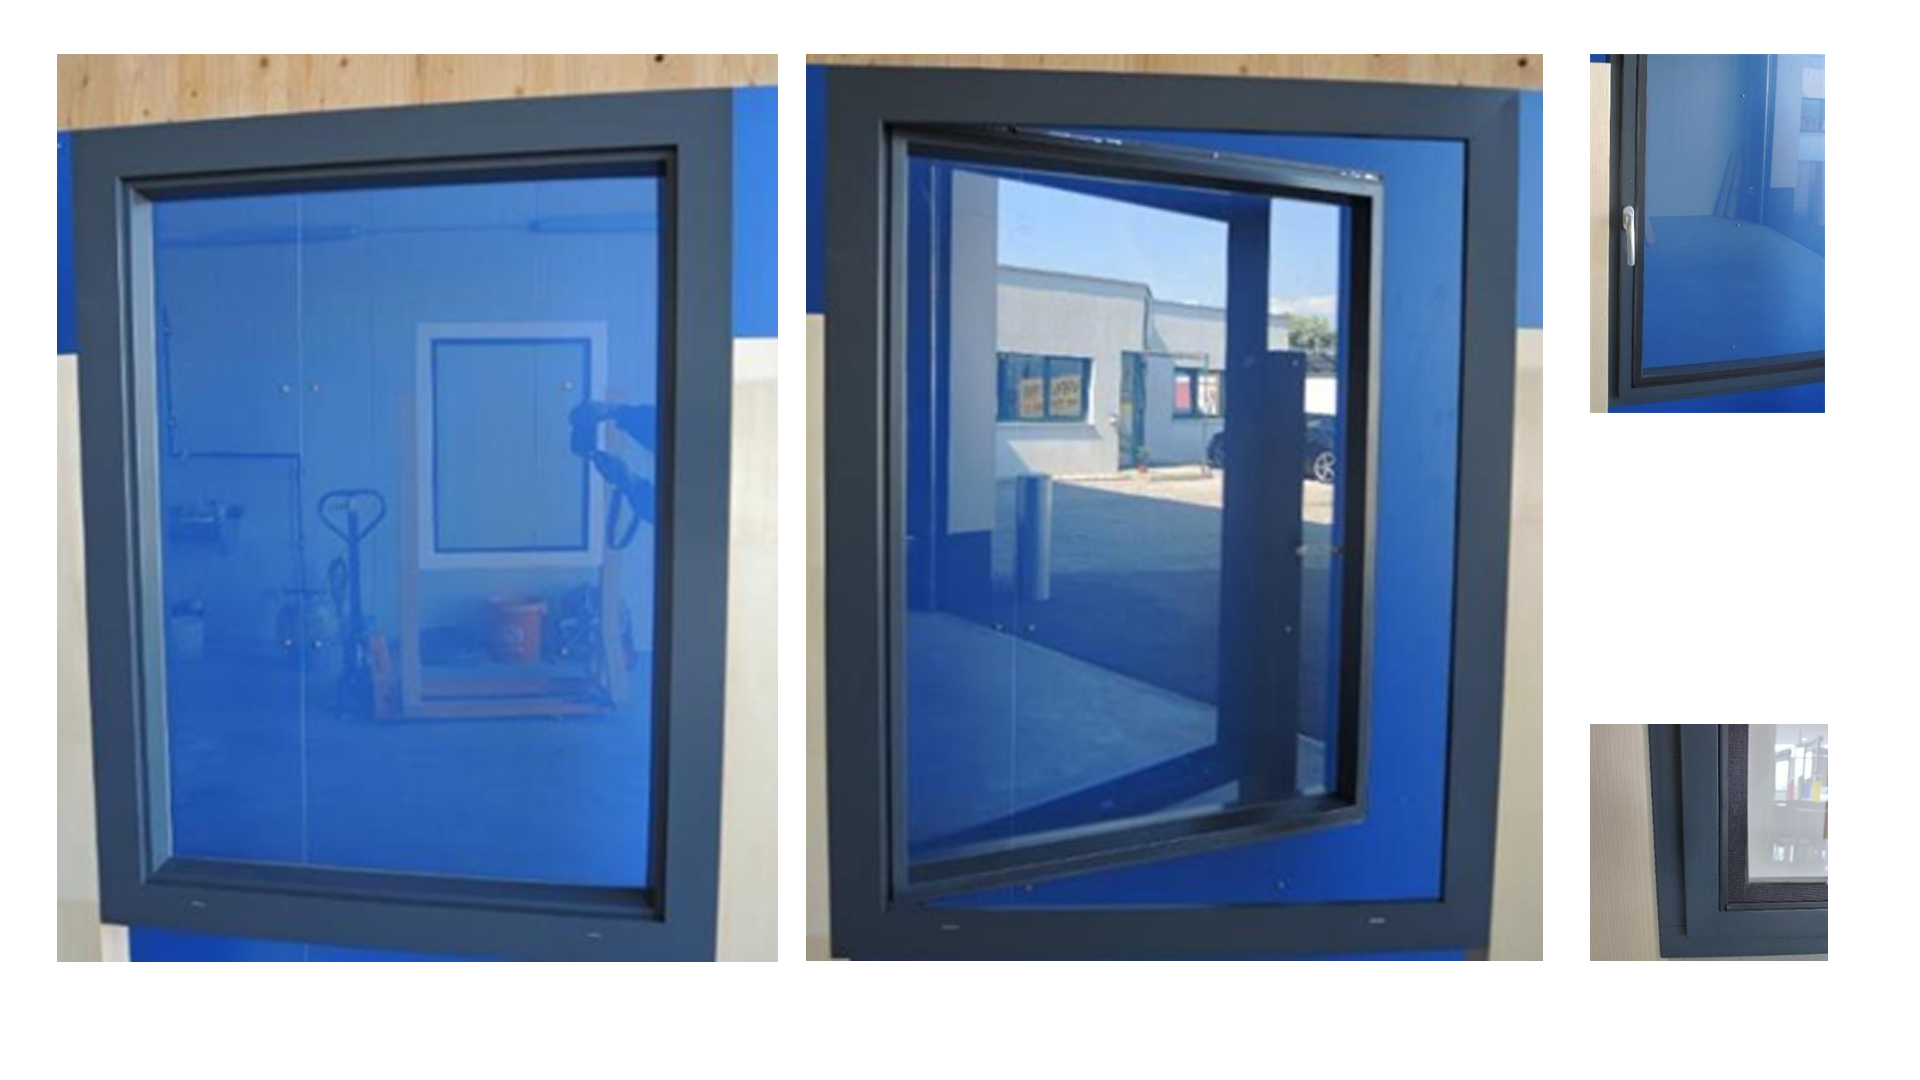
Vacuum-glazing-window in fully-glazed appearance, opening direction to the outside.
This non-conventional window was concepted during the MOTIVE-project. It's attractive architectural appearance is based on a fully-glazed impression. However, the opening direction to the ouside needs to be furtherly worked on, regarding user acceptance, maintenance, and sun protection.
Copyright: Team Projekt MOTIVE (Abt. Bauphysik und Bauökologie, TU Wien & Holzforschung Austria)
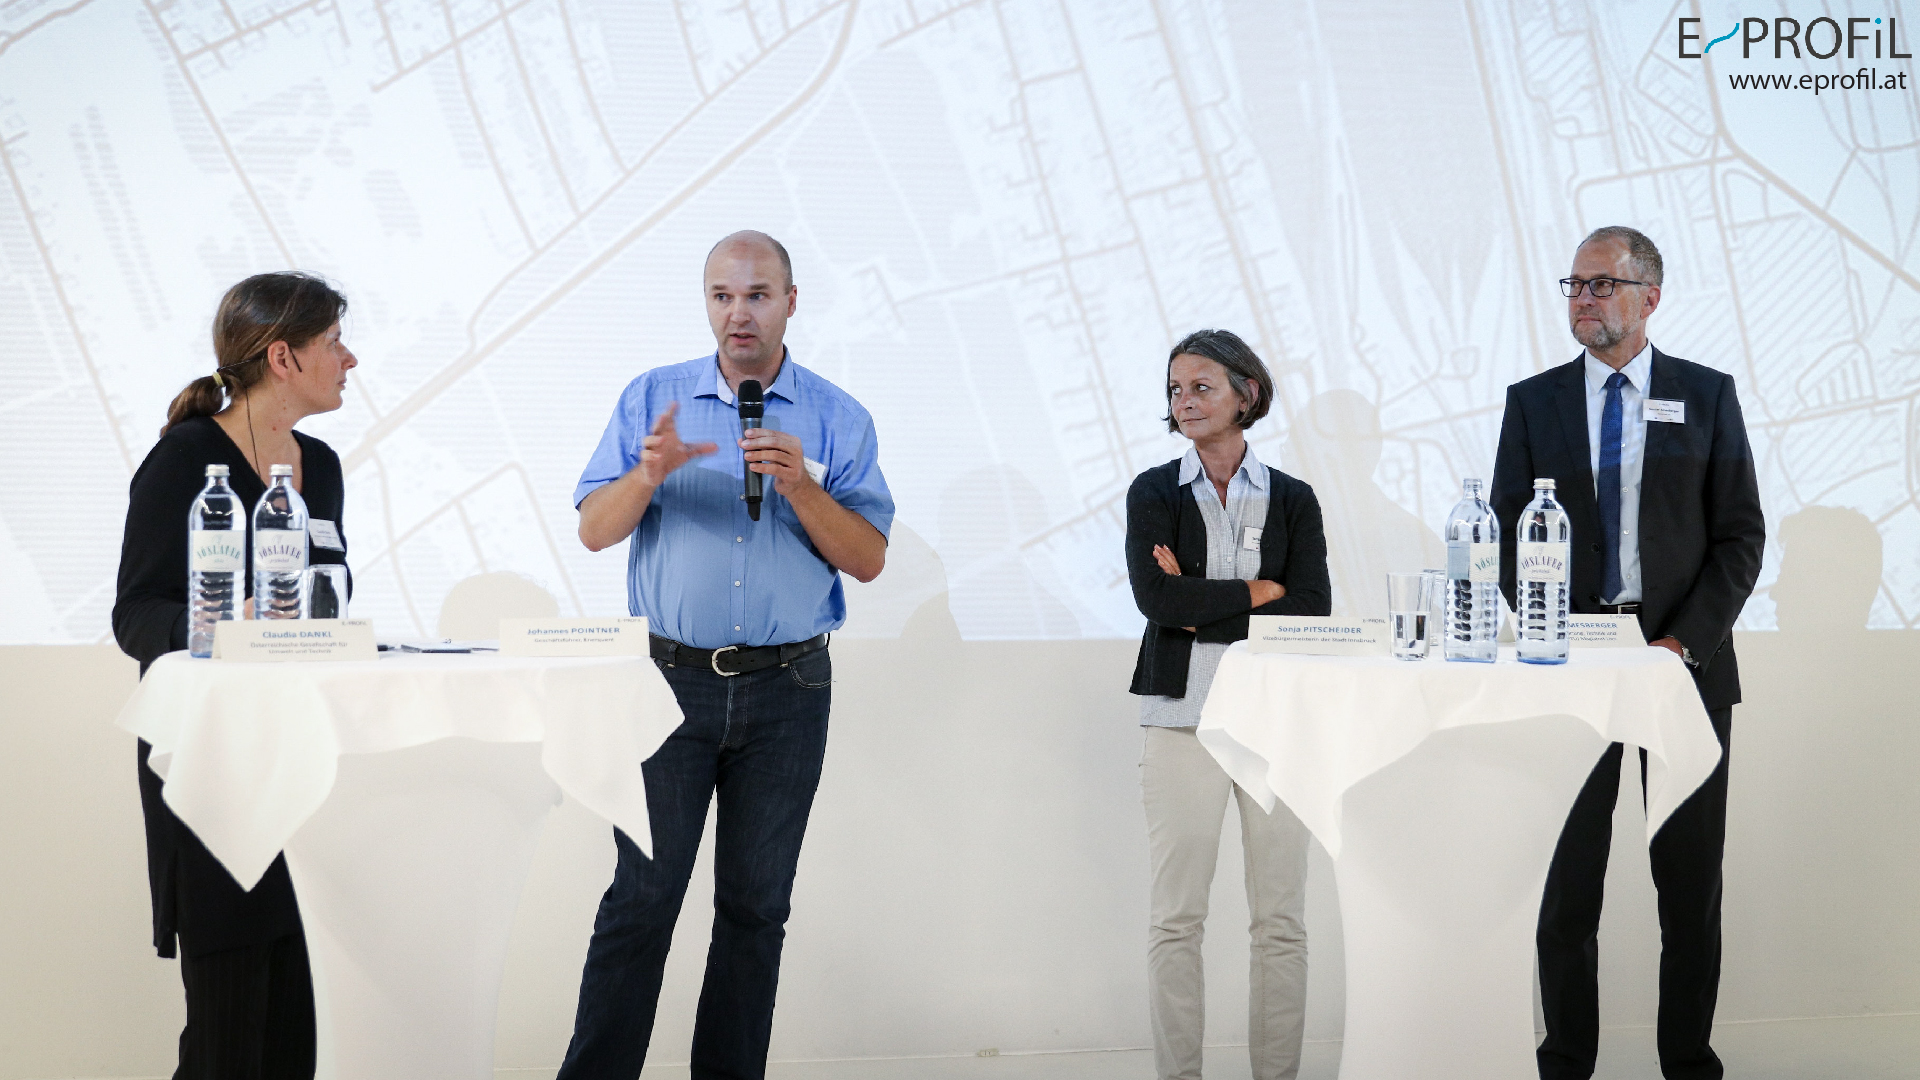
Panel discussion on "energetic transformations in urban quarters" - E_PROFIL
Within the final event of the project E_PROFIL at Ars Electronica Deep Space. Left to right: Claudia Dankl (ÖGUT. Moderation), Johannes Pointner (Enerquent), Sonja Pitscheider (City of Innsbruck), Gunter Amesberger (Planning Director, City of Linz).
Copyright: Ars Electronica Futurelab, 2017

Share of multi-flat buildings and multi-storey housing in buildings with flats - Linz central region
Own illustration by SRF/TU Wien, 2017, based on Statistics Austria's "Gebäude- und Wohnungszählung" 2011.
Copyright: Robert Kalasek, TU Wien, 2017
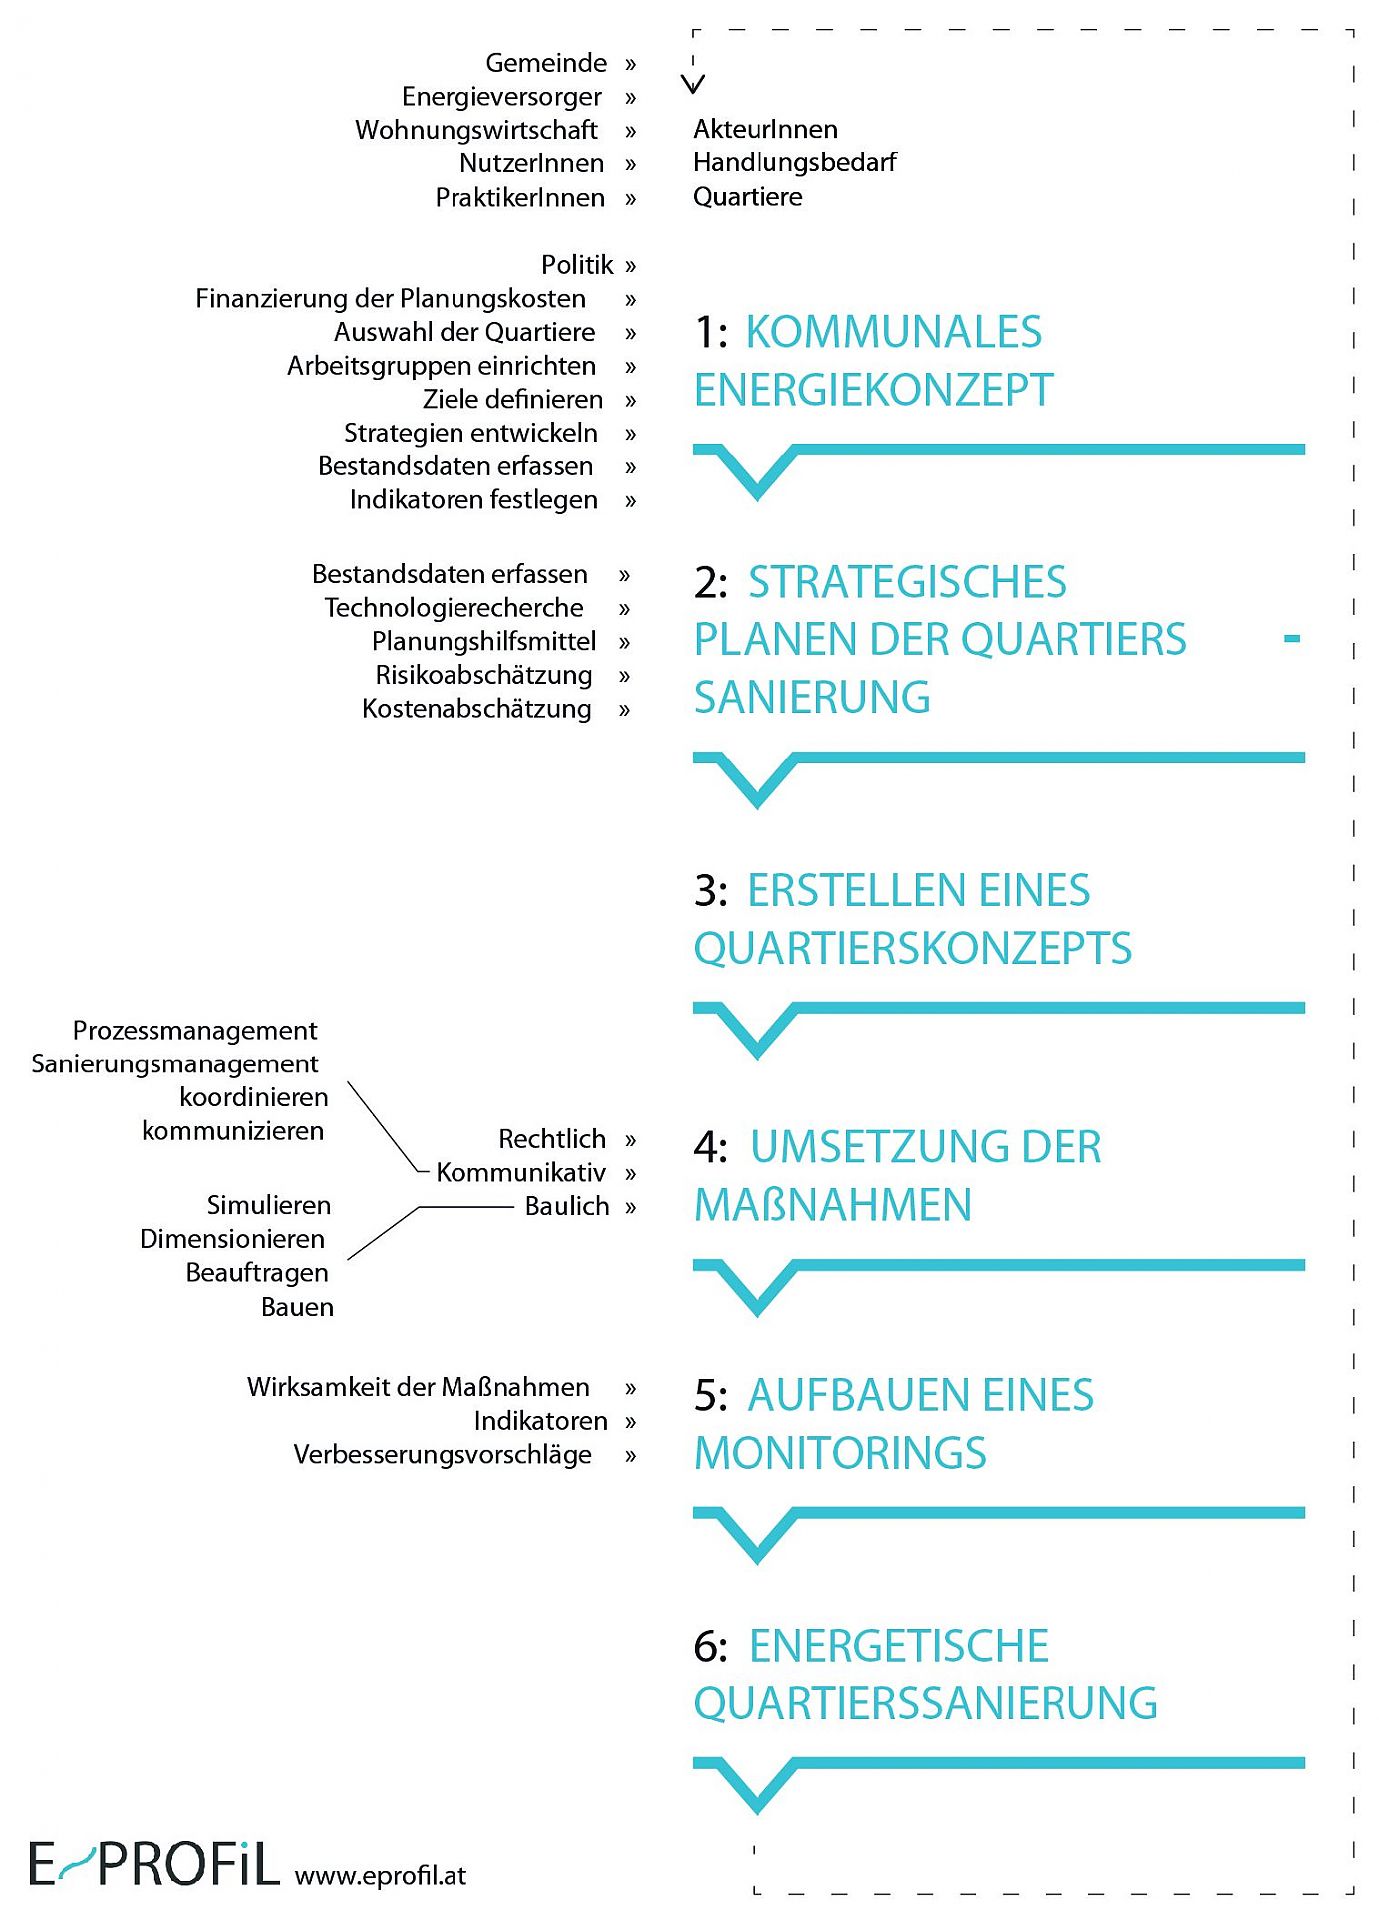
Energetic management of urban quarters - ideal-typical process
more here: http://www.eprofil.at/res/booklet.pdf
Copyright: Ars Electronica Futurelab, 2017
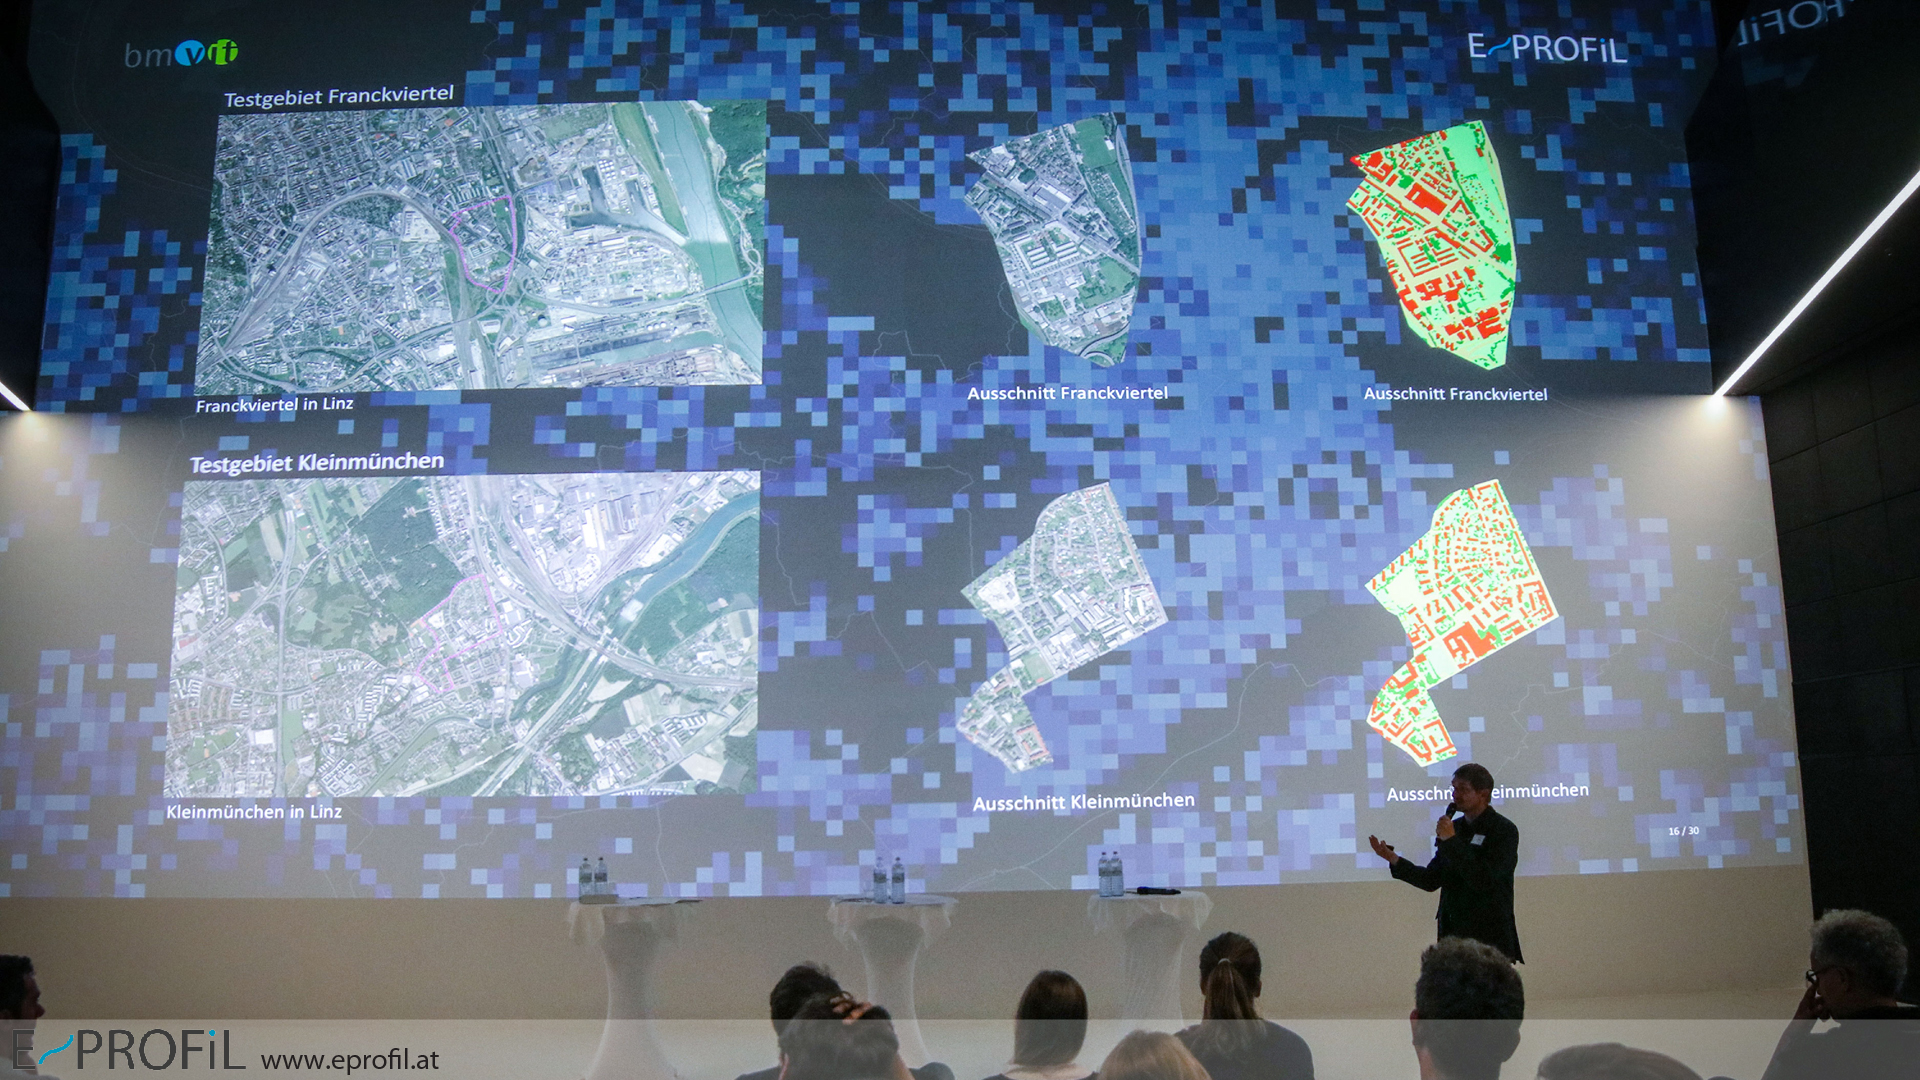
Final event of the project E_PROFIL at Ars Electronica Center
Presentation of the urban quarters Kleinmünchen and Bergern in Linz.
Copyright: Ars Electronica Futurelab, 2017

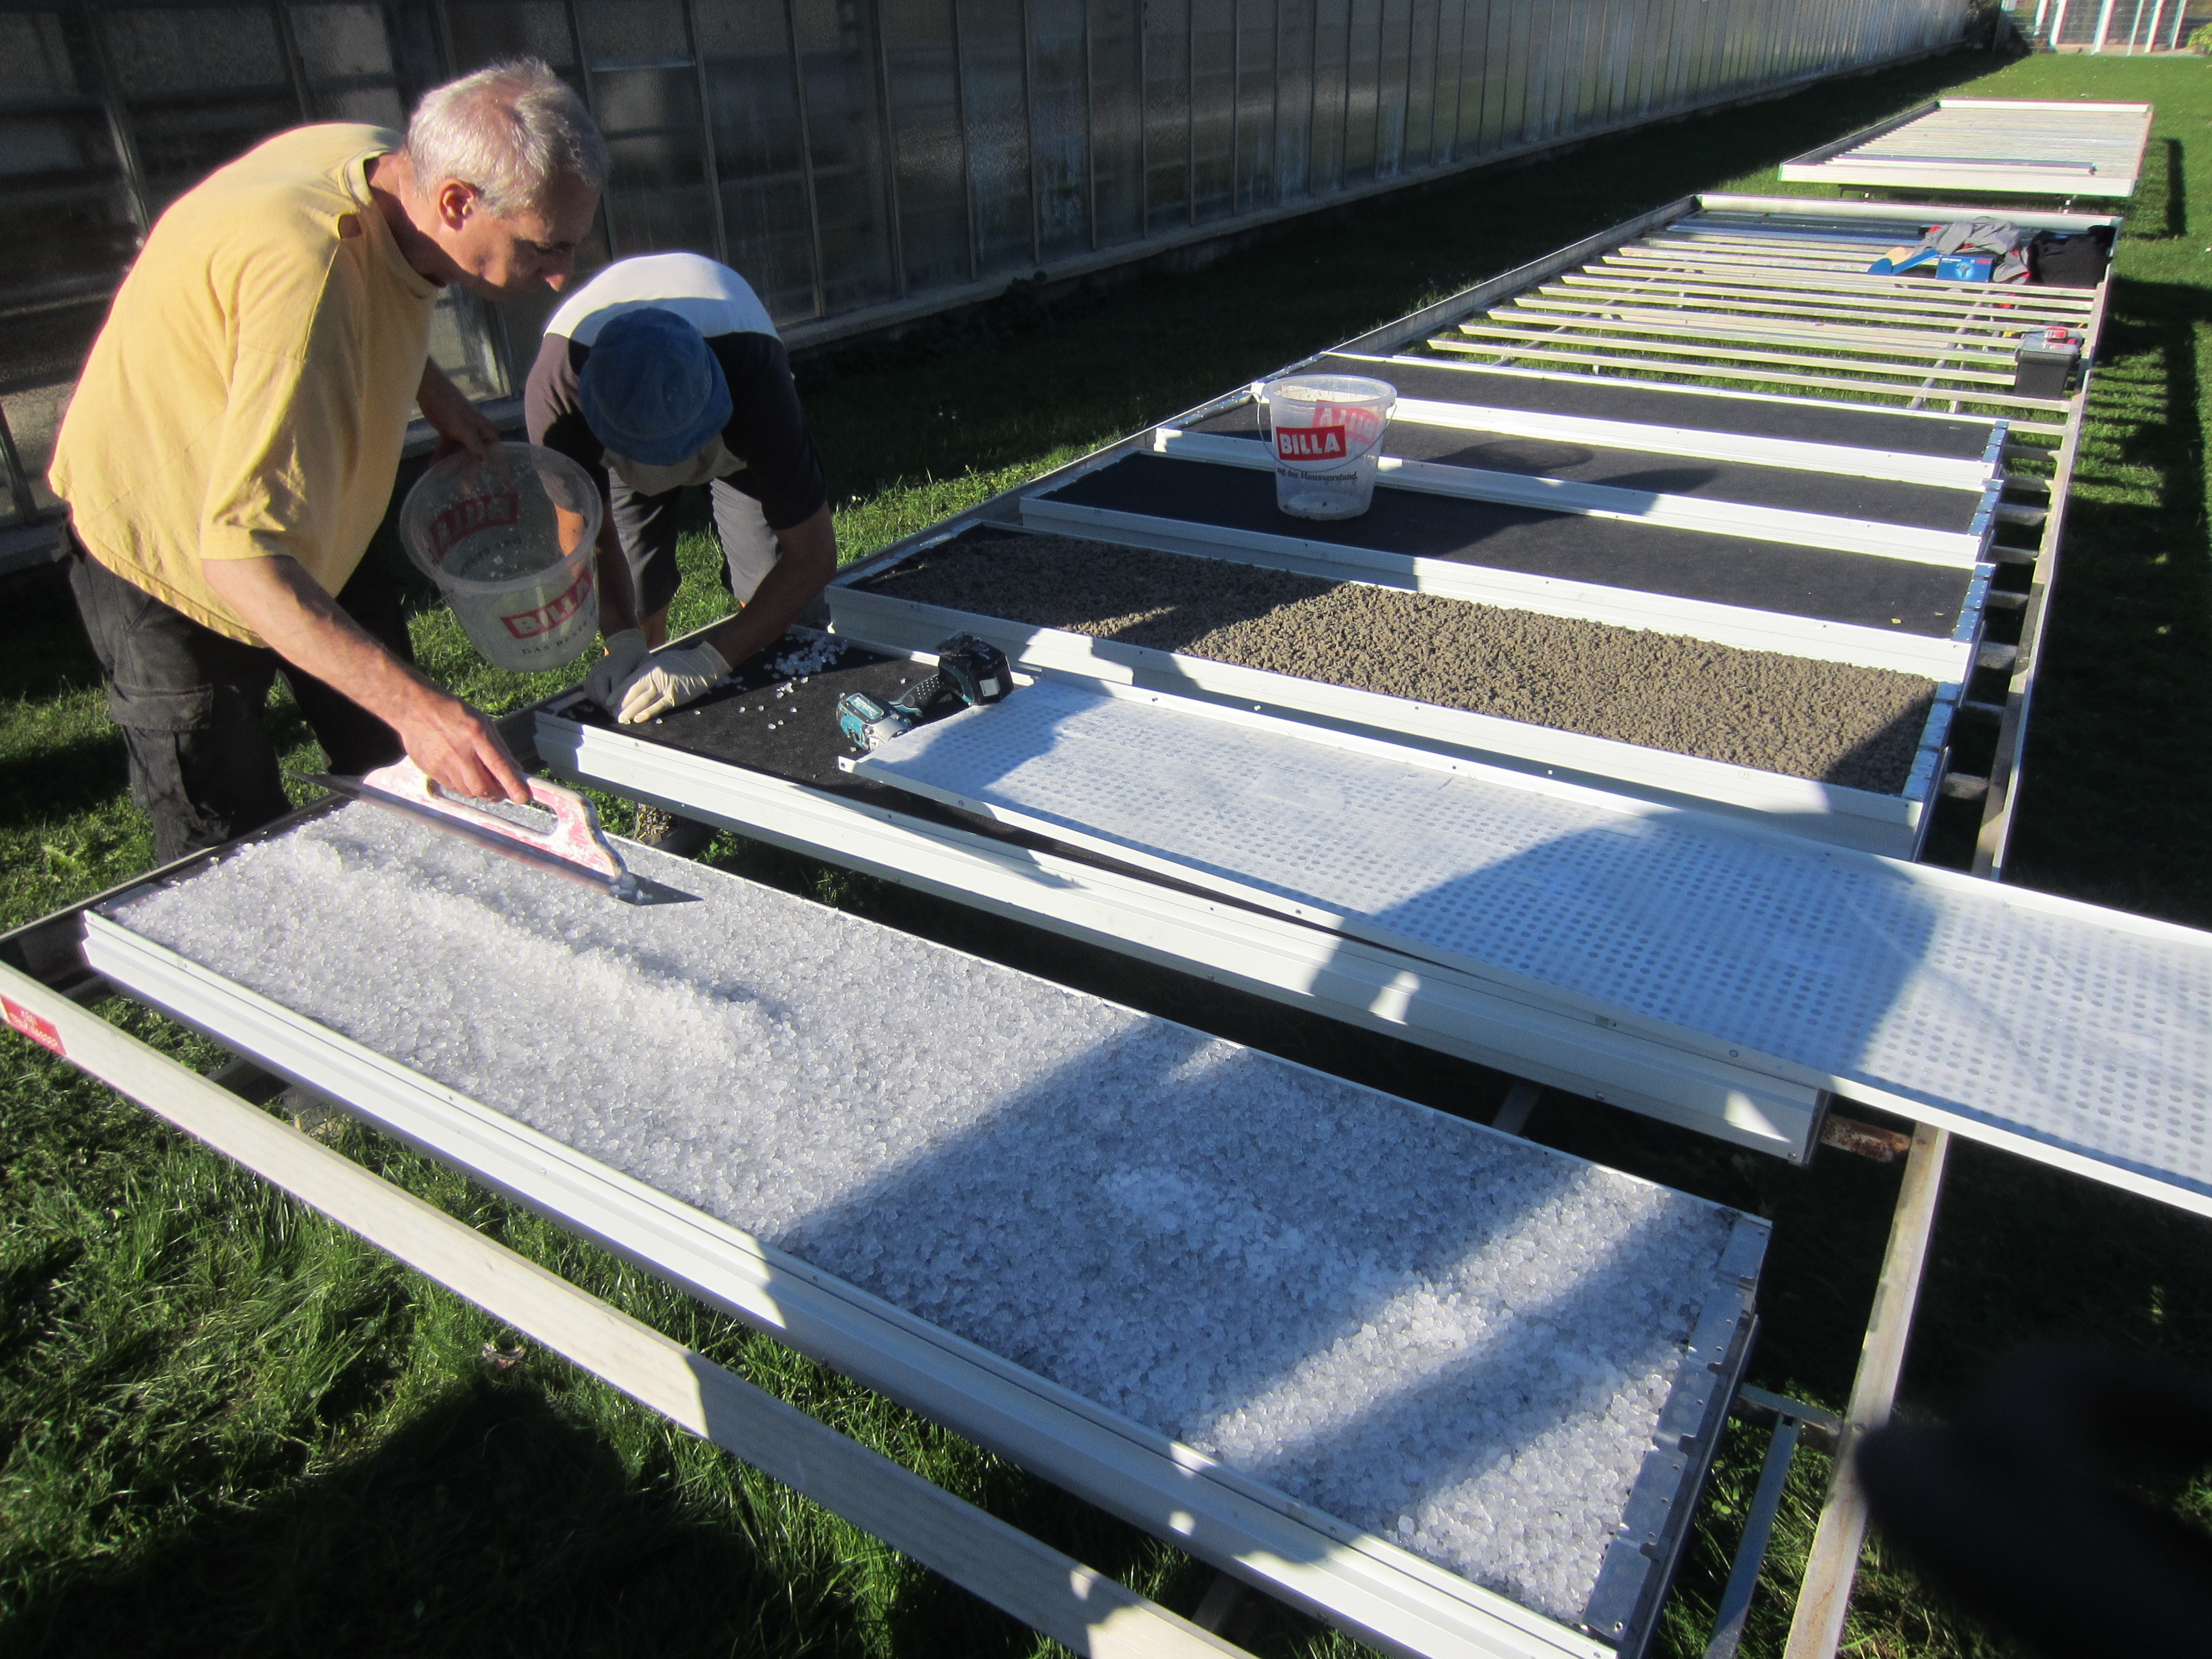
Setting the moss-plants
After constructing the panels, different moss plants were prepared for setting onto / into the the prepared panels.