Project Image Pool
There are 419 results.
Terms of use: The pictures on this site originate from the projects in the frame of the programmes City of Tomorrow, Building of Tomorrow and the IEA Research Cooperation. They may be used credited for non-commercial purposes under the Creative Commons License Attribution-NonCommercial (CC BY-NC).
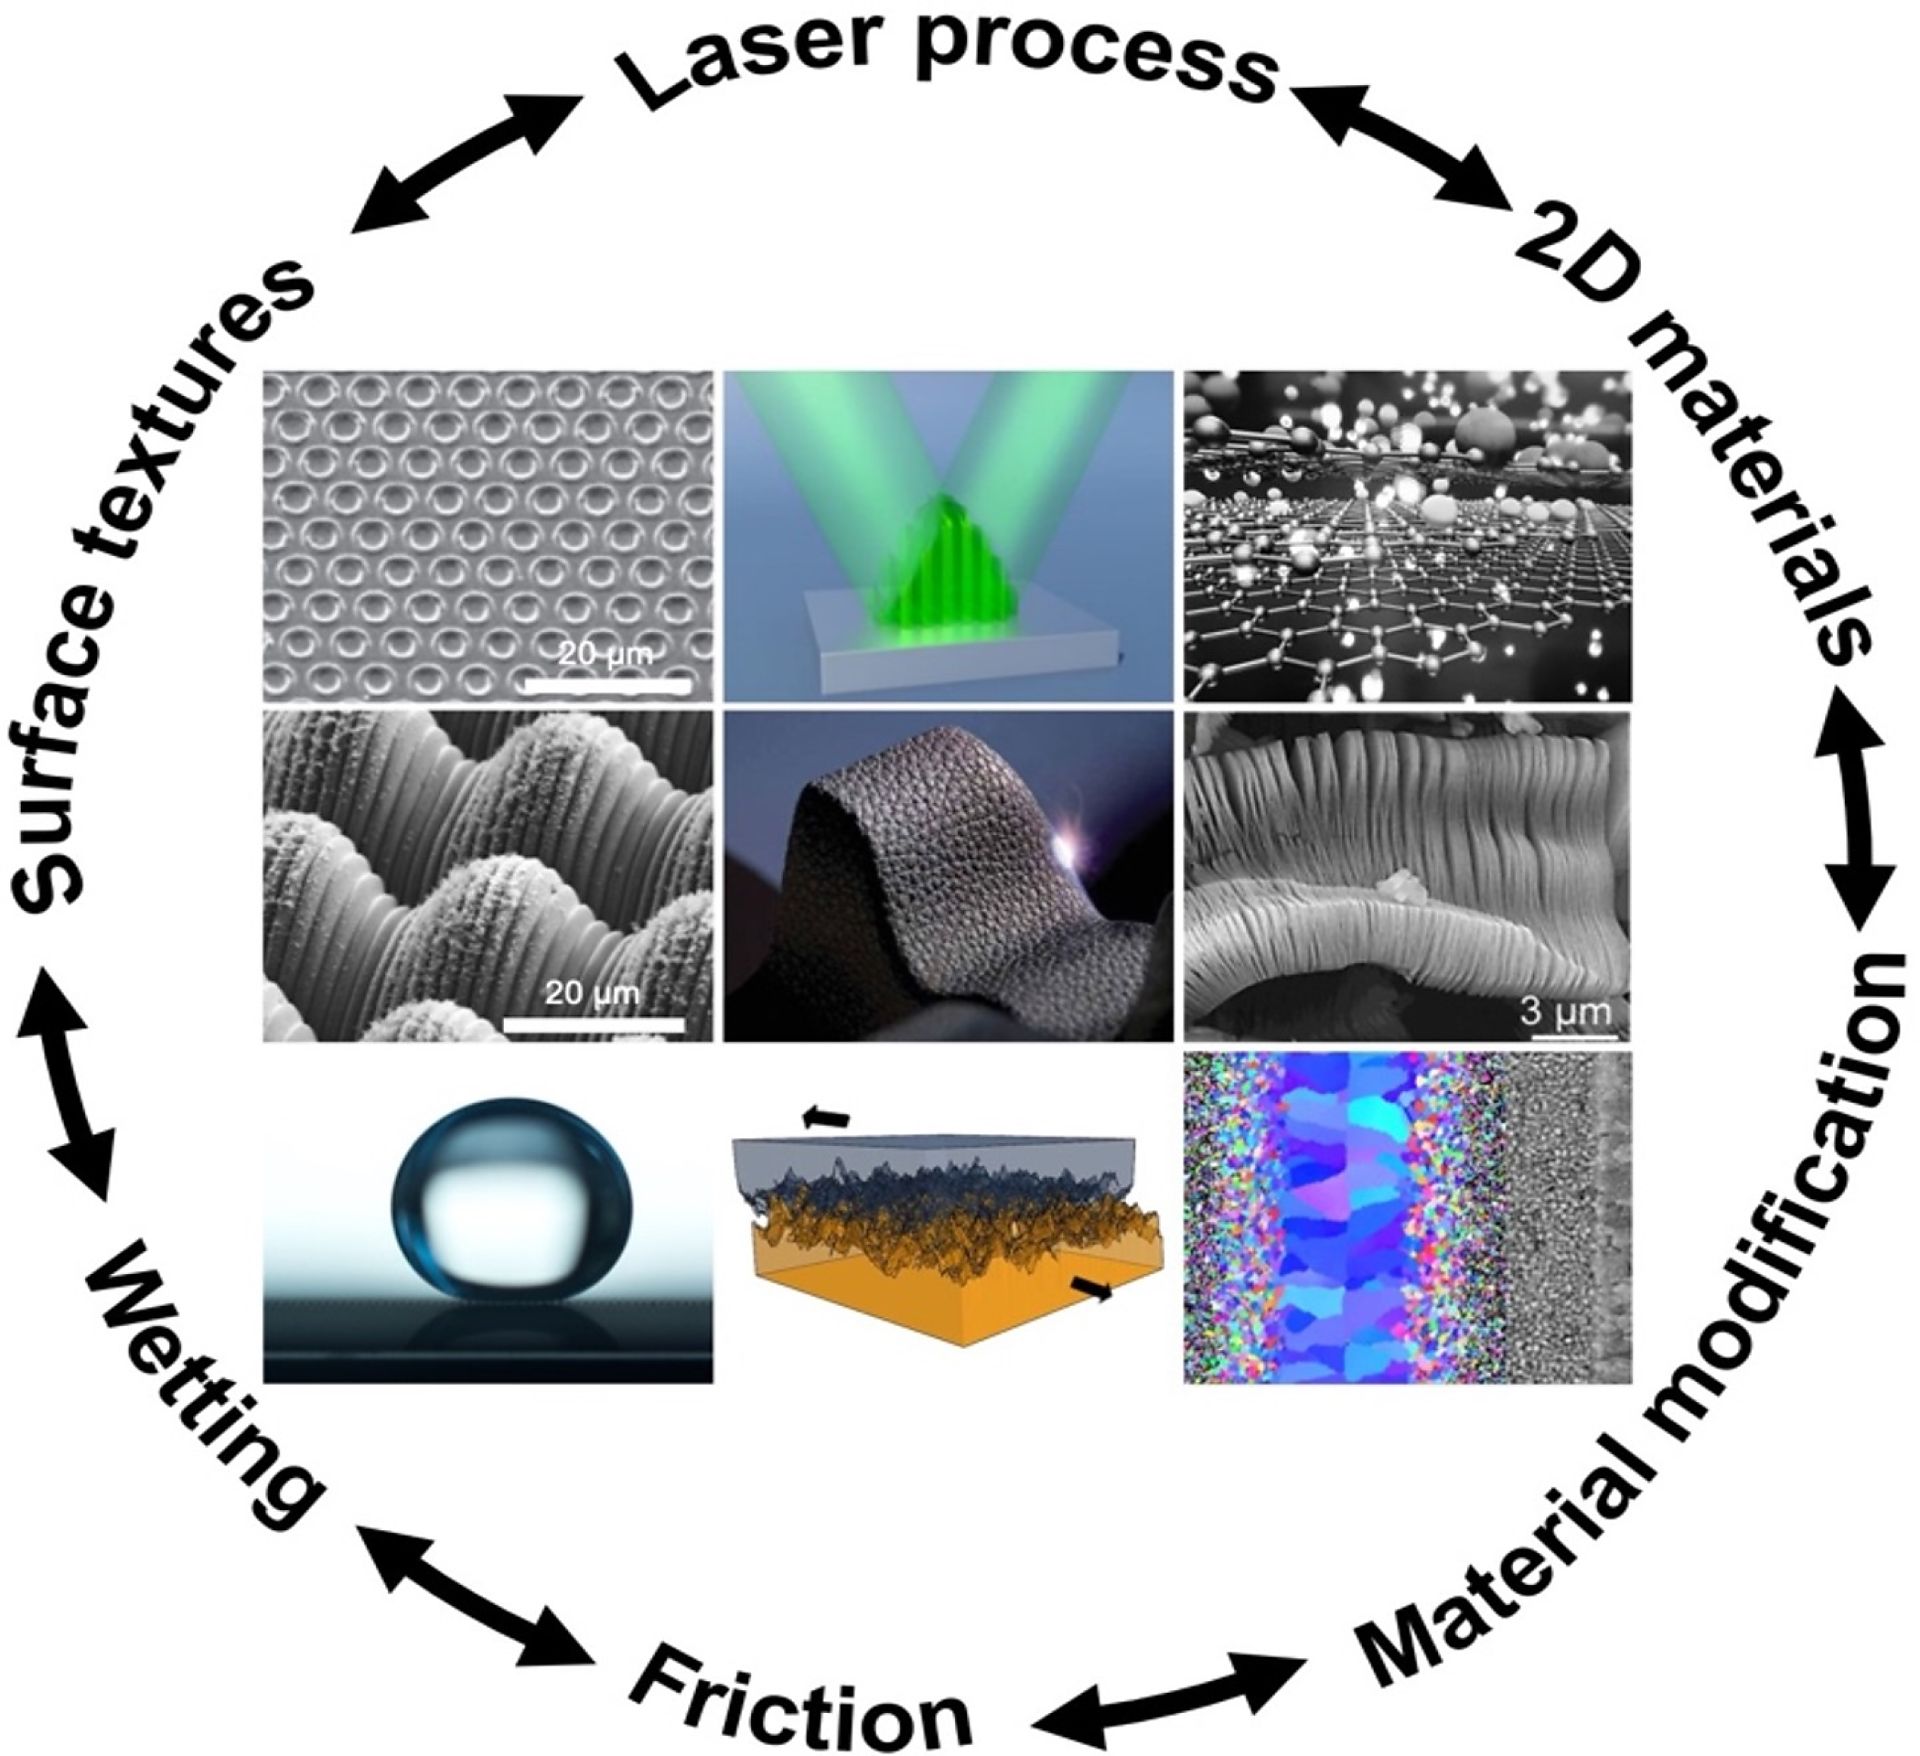
Laser meets 2D Materials
The figure describes the synergetic approach of structuring material surfaces using laser processes and combining them with novel 2D materials. This combination allows the precise generation of well-defined and remotely arranged structures in material surfaces and the possibility of modifying mechanical properties as well as wetting and tribological properties through the additional deposition of layers based on 2D materials such as graphene or MXene.
Copyright: self-made
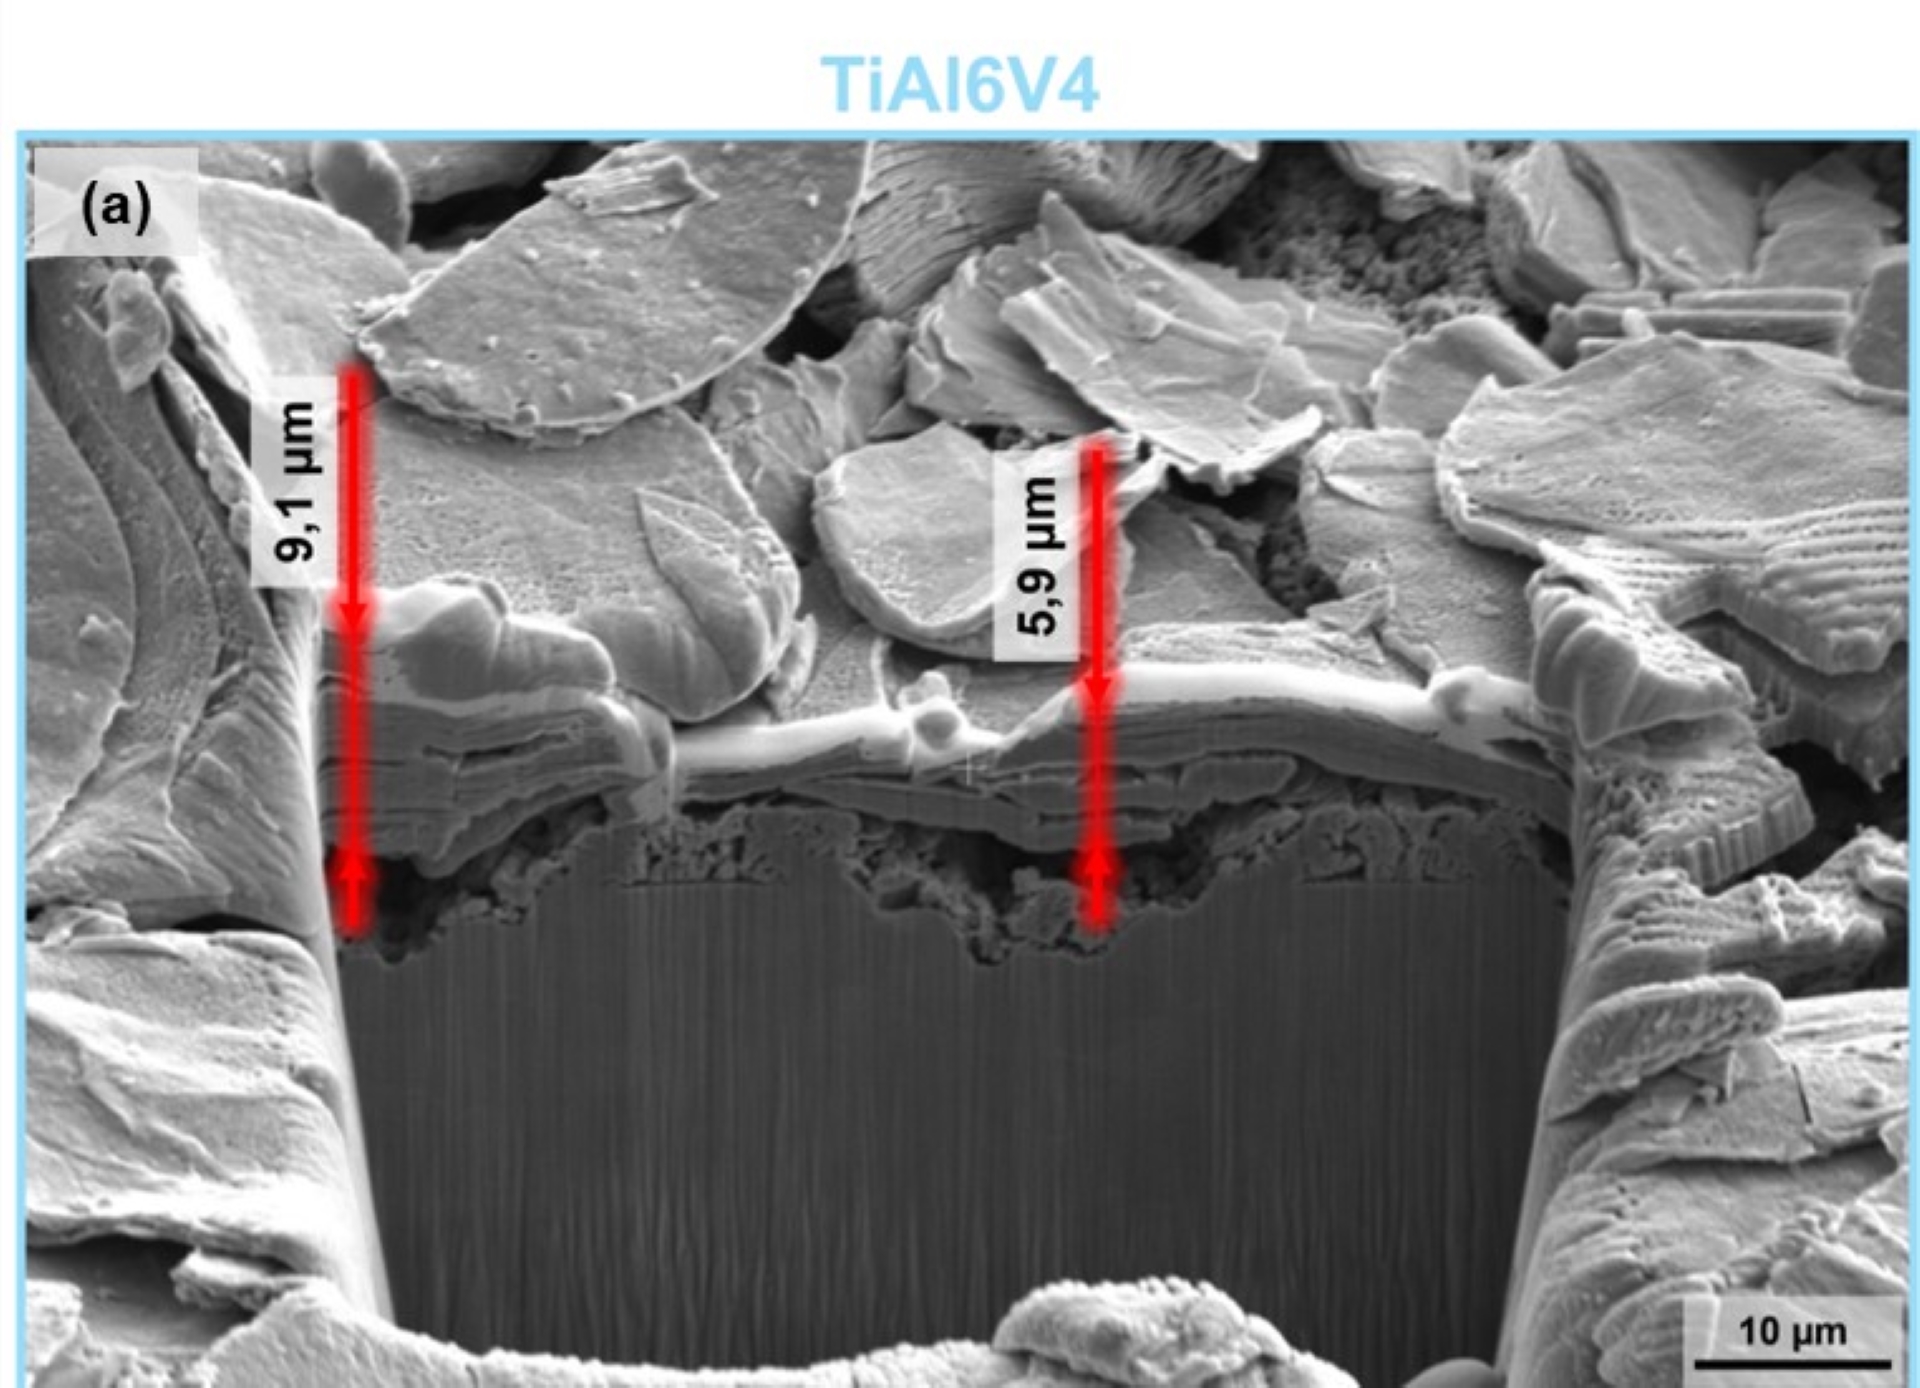
Cross-sectional image of a laser-structured and coated steel surface
The image shows an FIB cross-section of a steel surface that has been structured using laser interference and then coated with a 2D material, in this case MXene as transition metal carbide Ti3C2. The individual MXene flakes deposited in the valleys of the laser structures are clearly recognisable.
Copyright: self-made
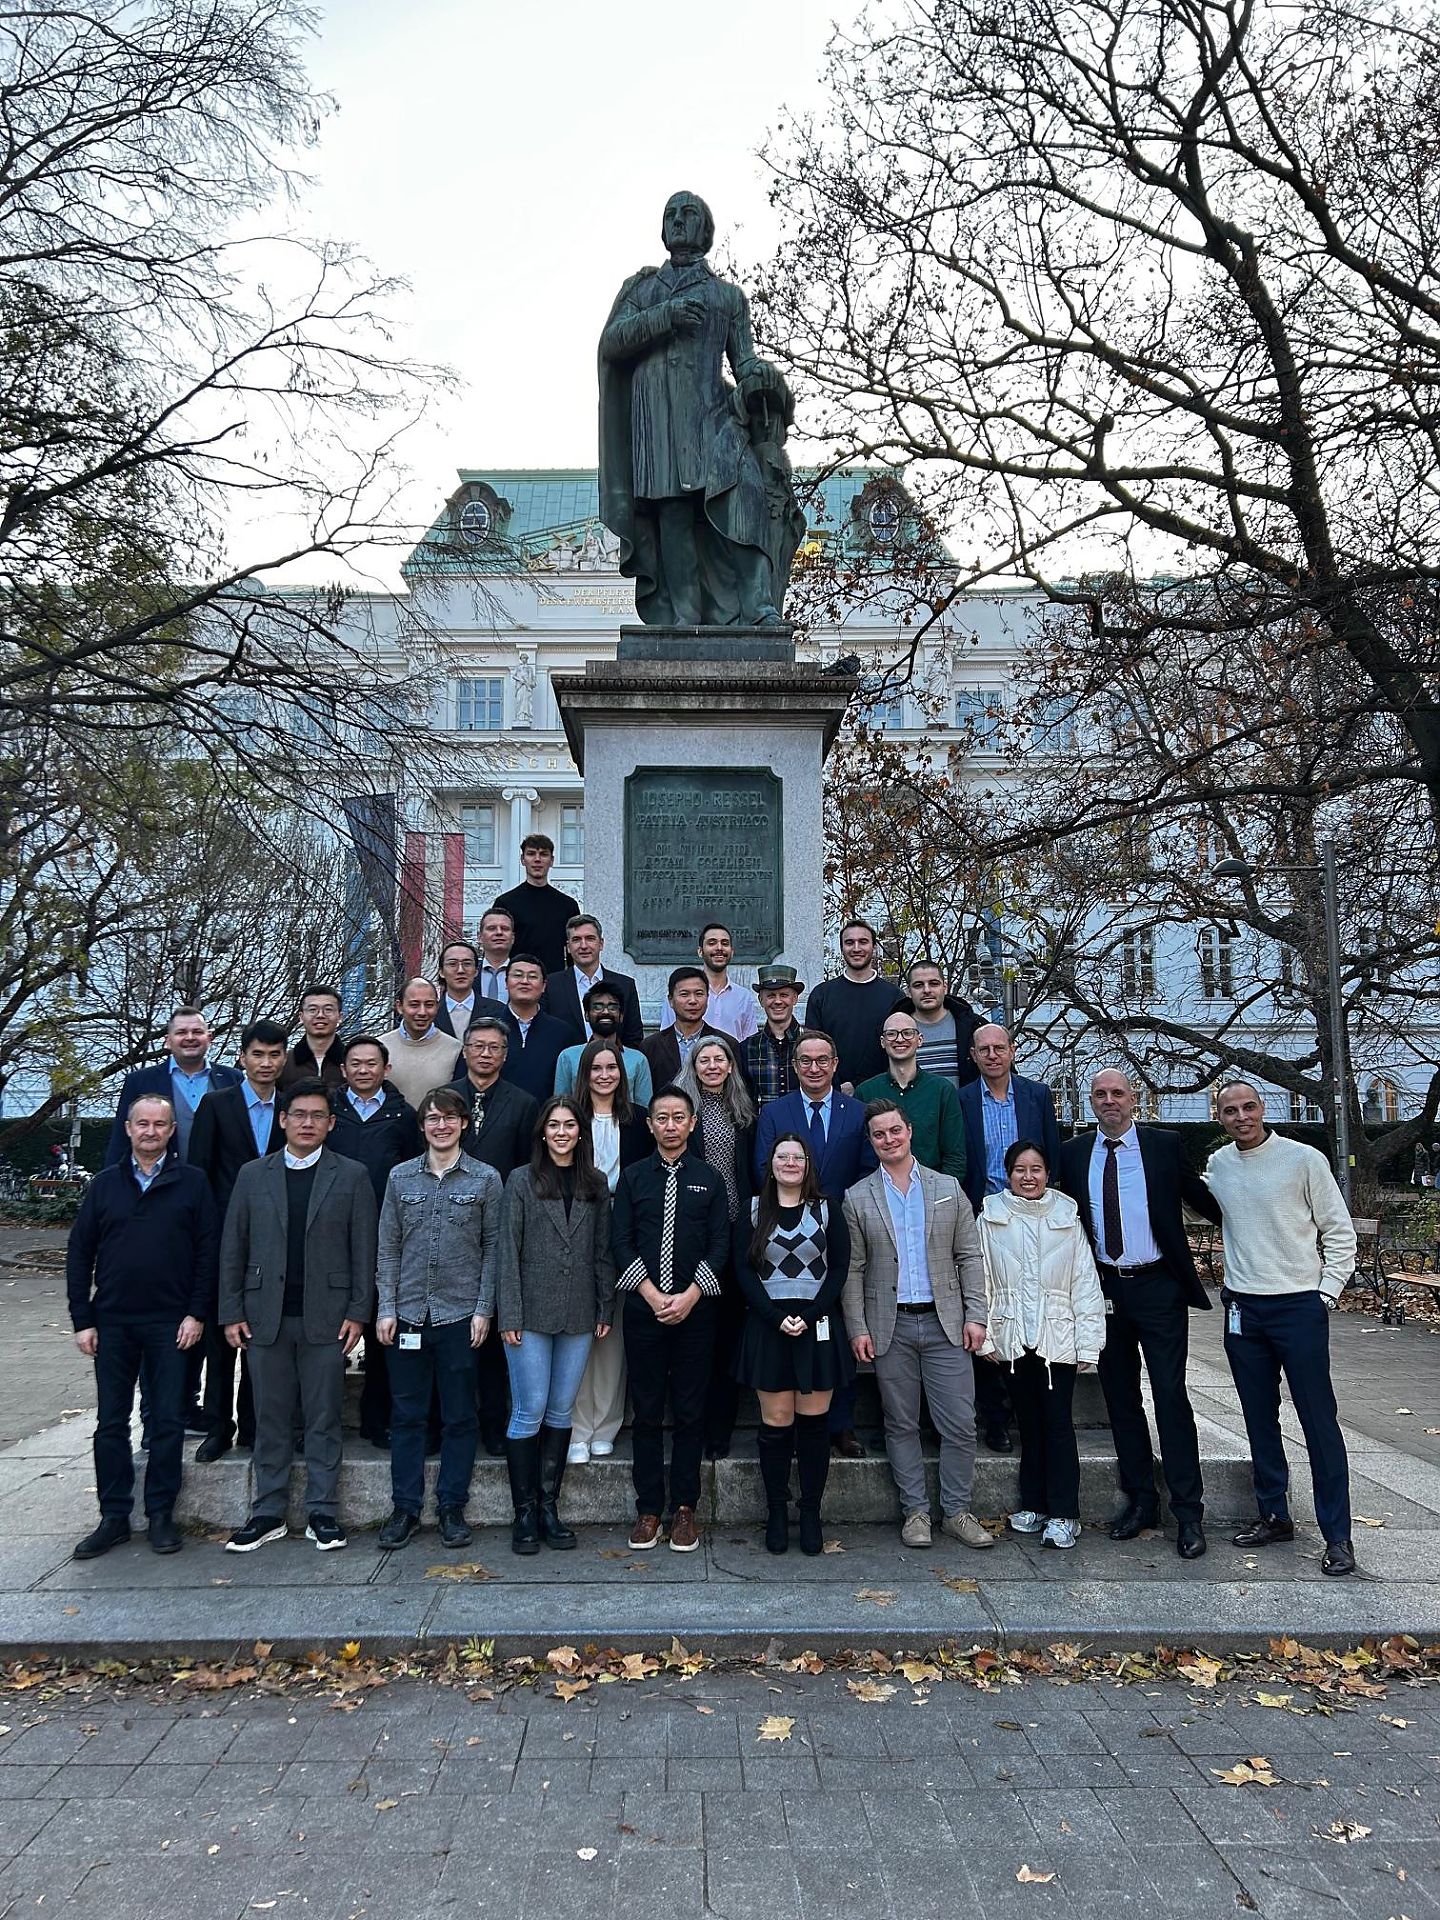
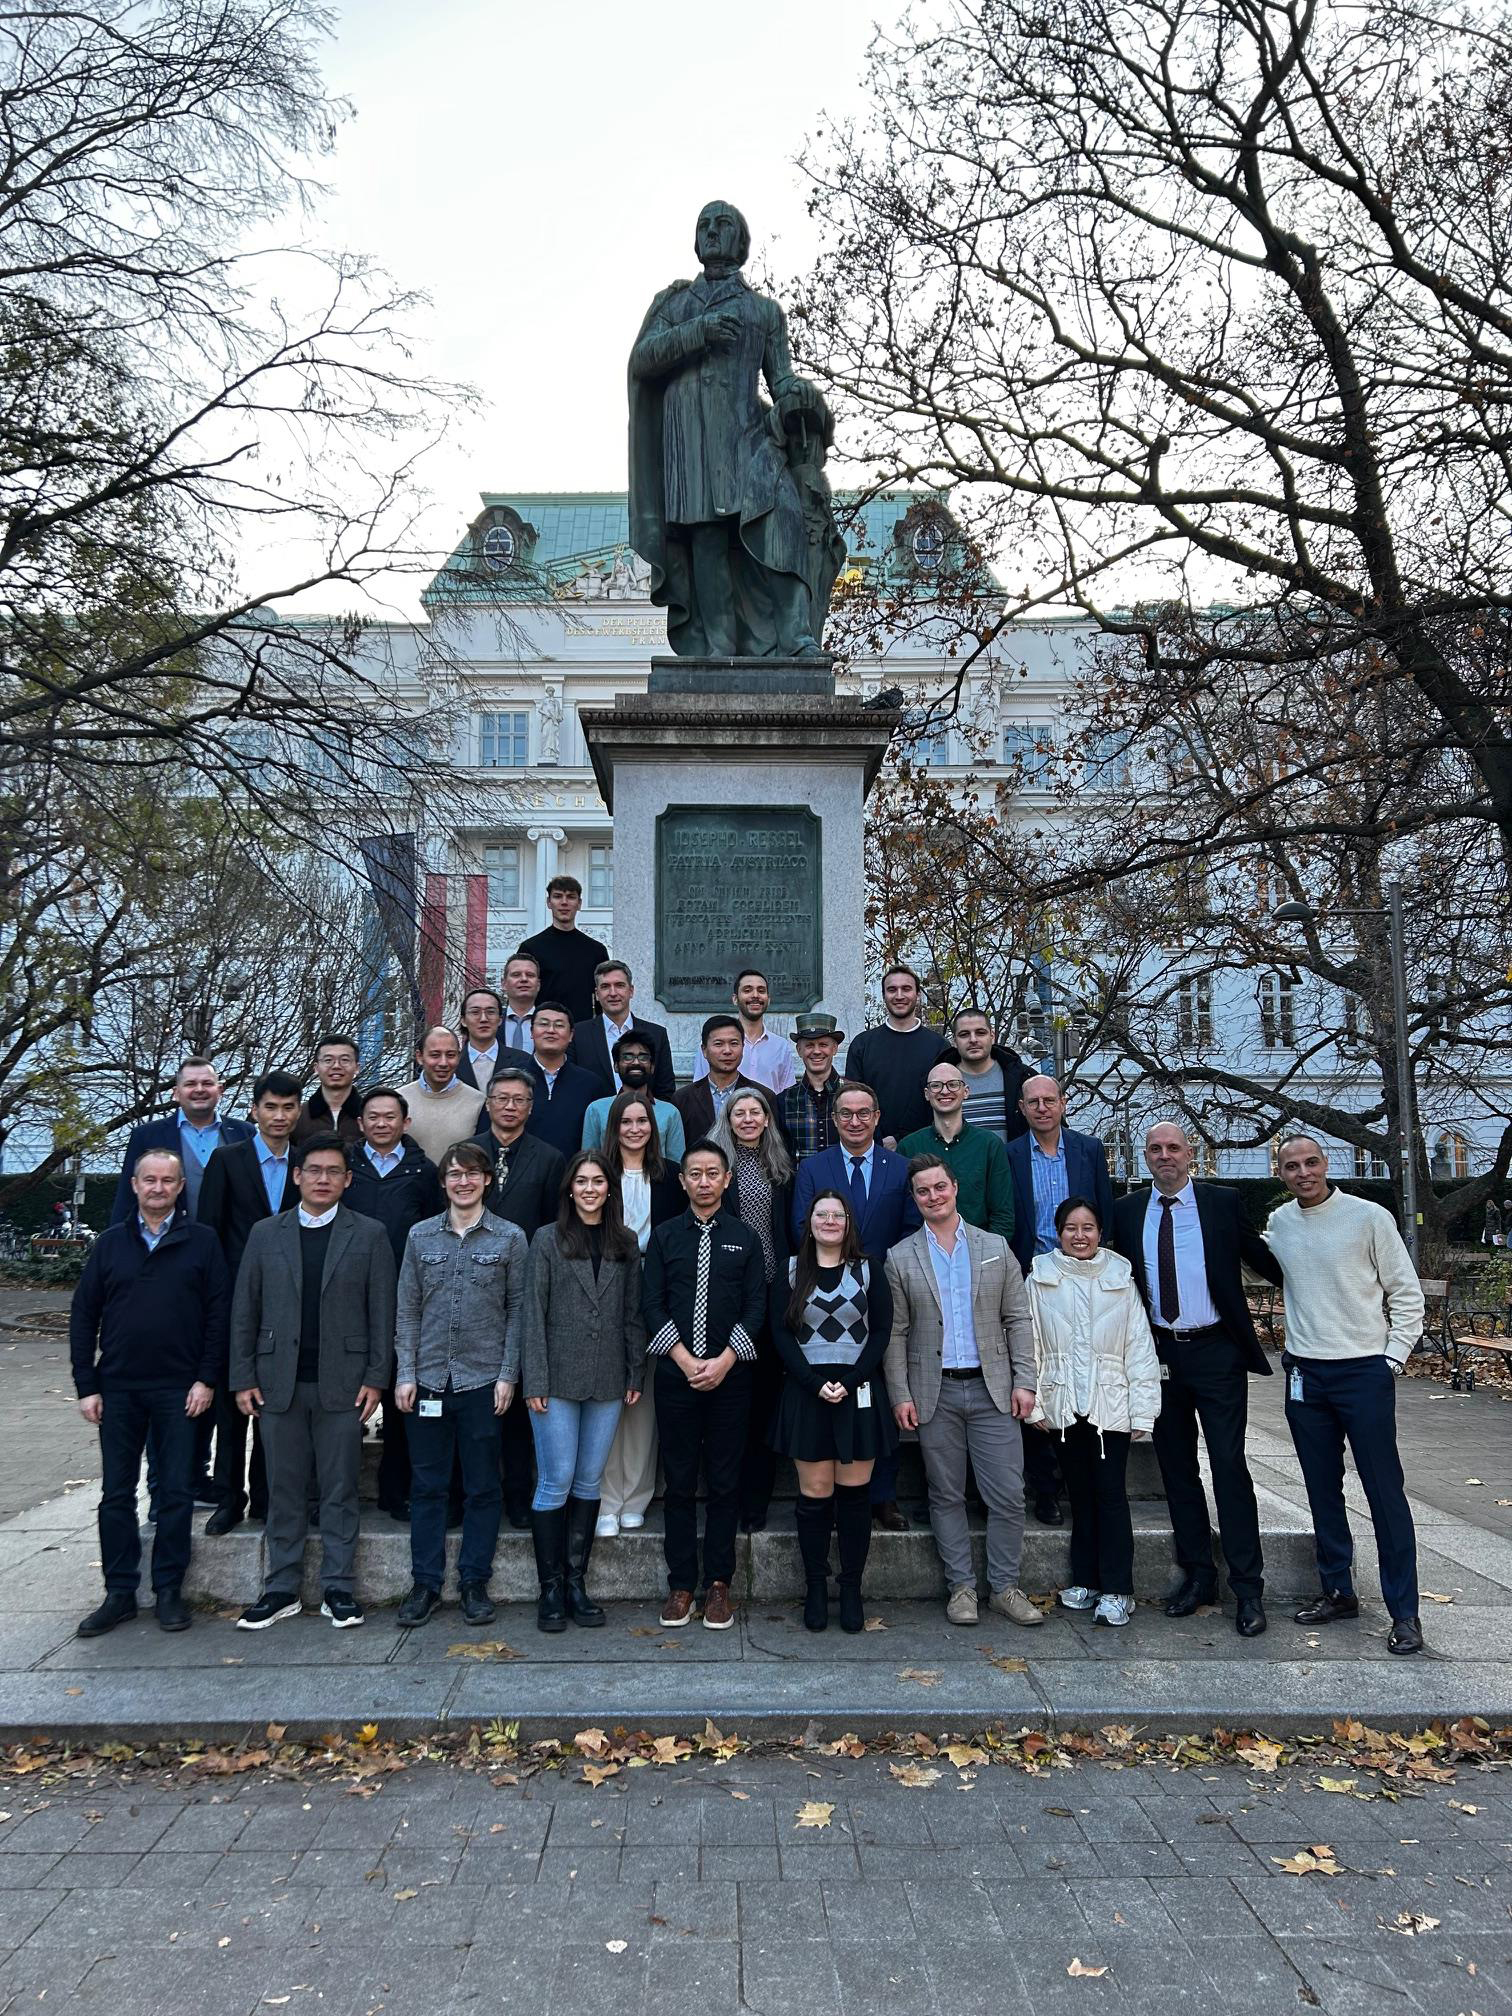
Group photo TU Vienna - Nanjing Symposium Tribology
In December 2024, the 3rd TU Wien-Nanjing Tribology Symposium was held at TU Wien with around 60 international guests on the topic of novel 2D materials and methods for reducing friction and wear. This is also the core topic of Task 12 within the AMT-TCP.
Copyright: Carsten Gachot
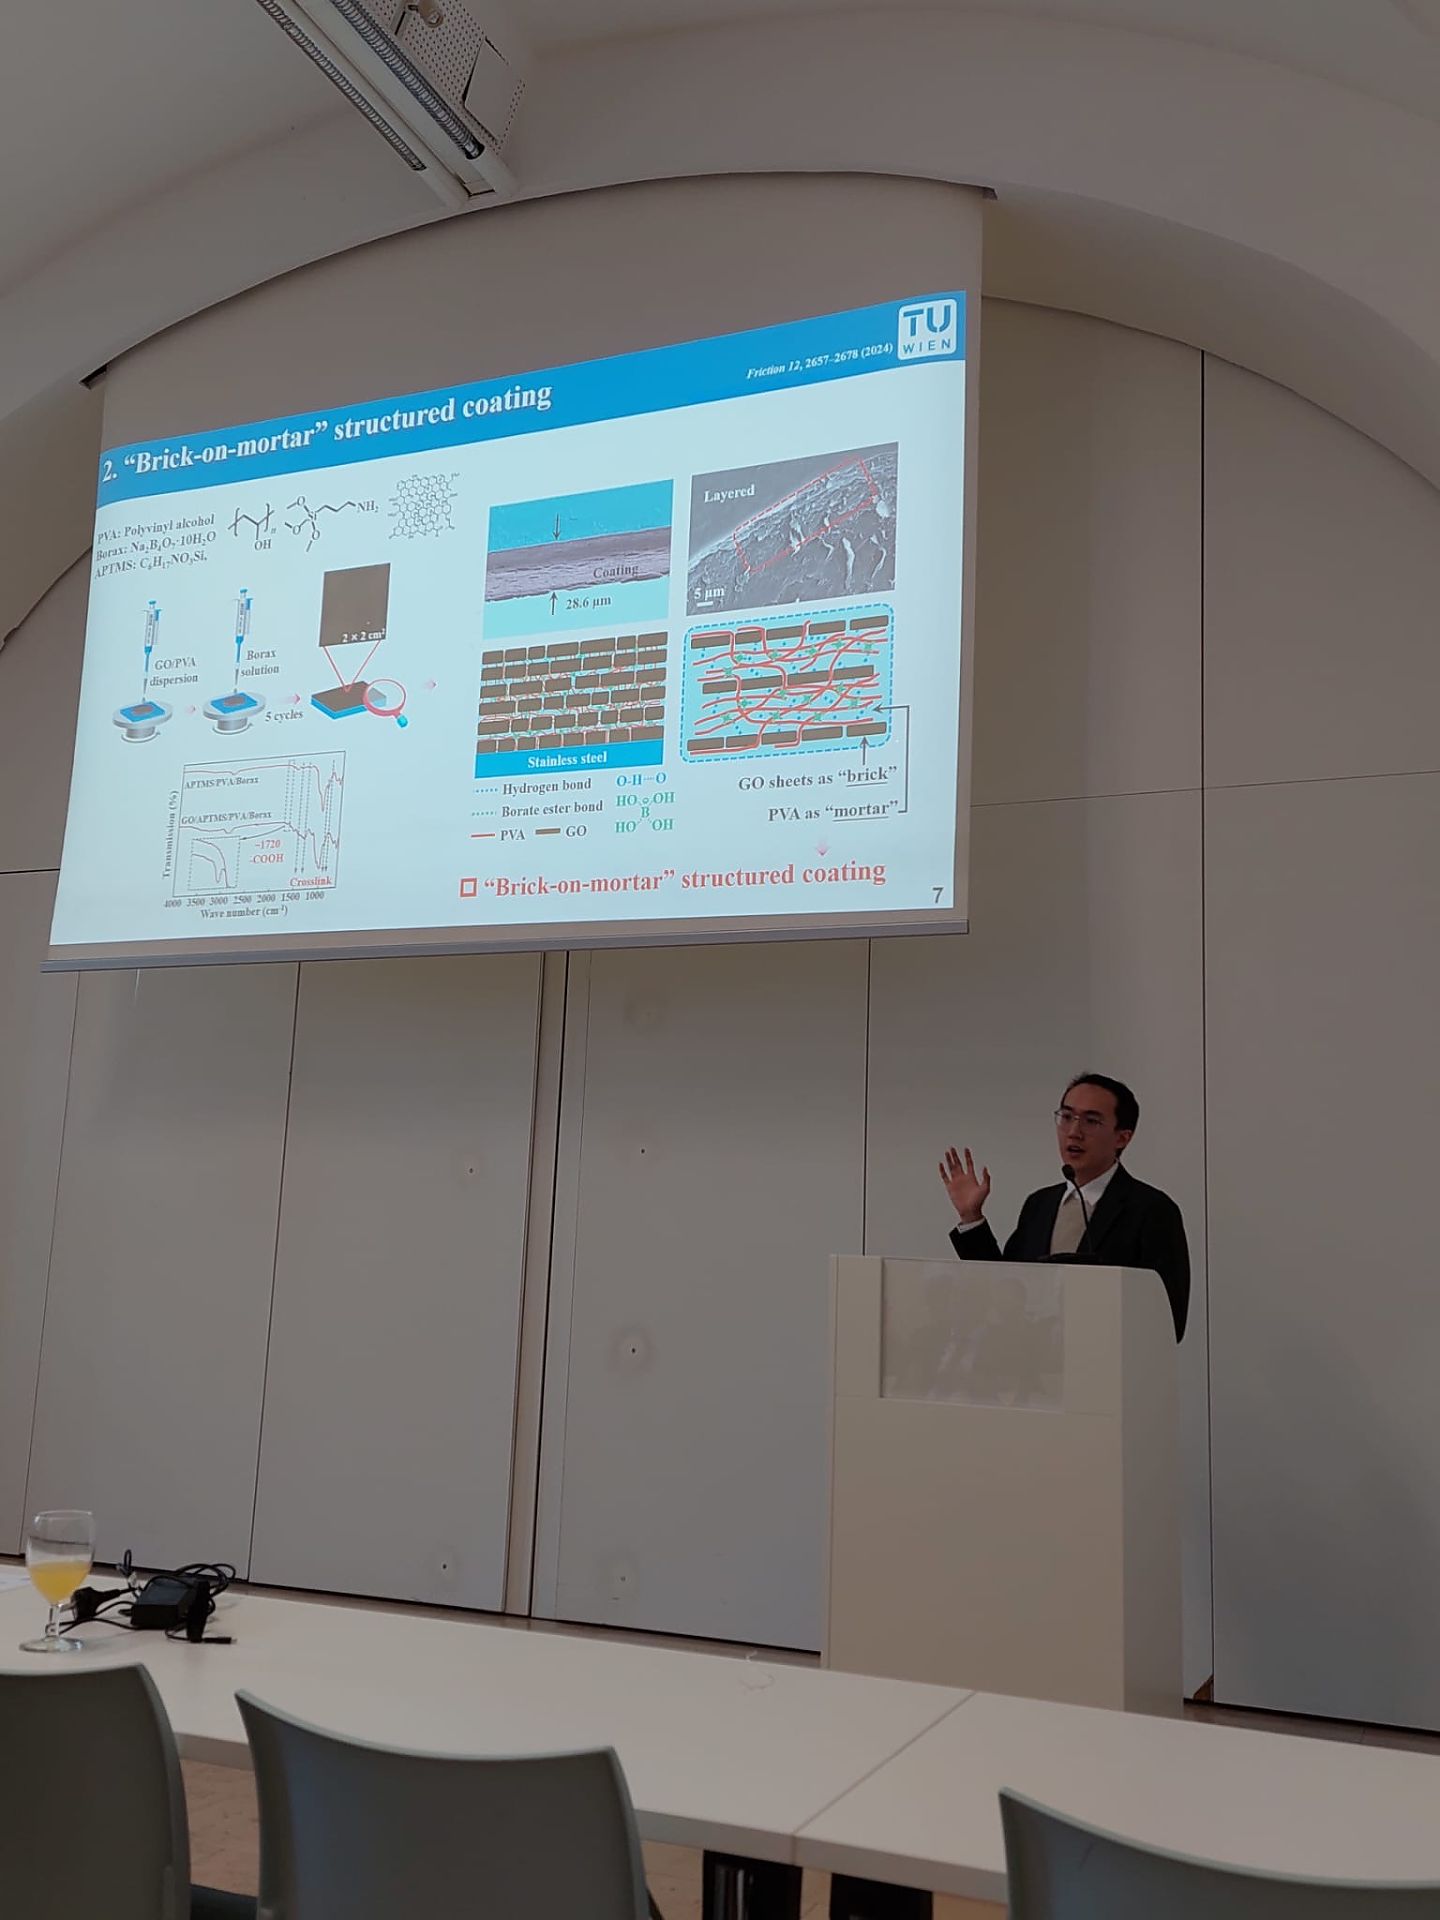
TU Vienna-Nanjing Tribology Symposium December 2024
Presentation during the 3rd TU Vienna-Nanjing Tribology Symposium.
Copyright: Carsten Gachot
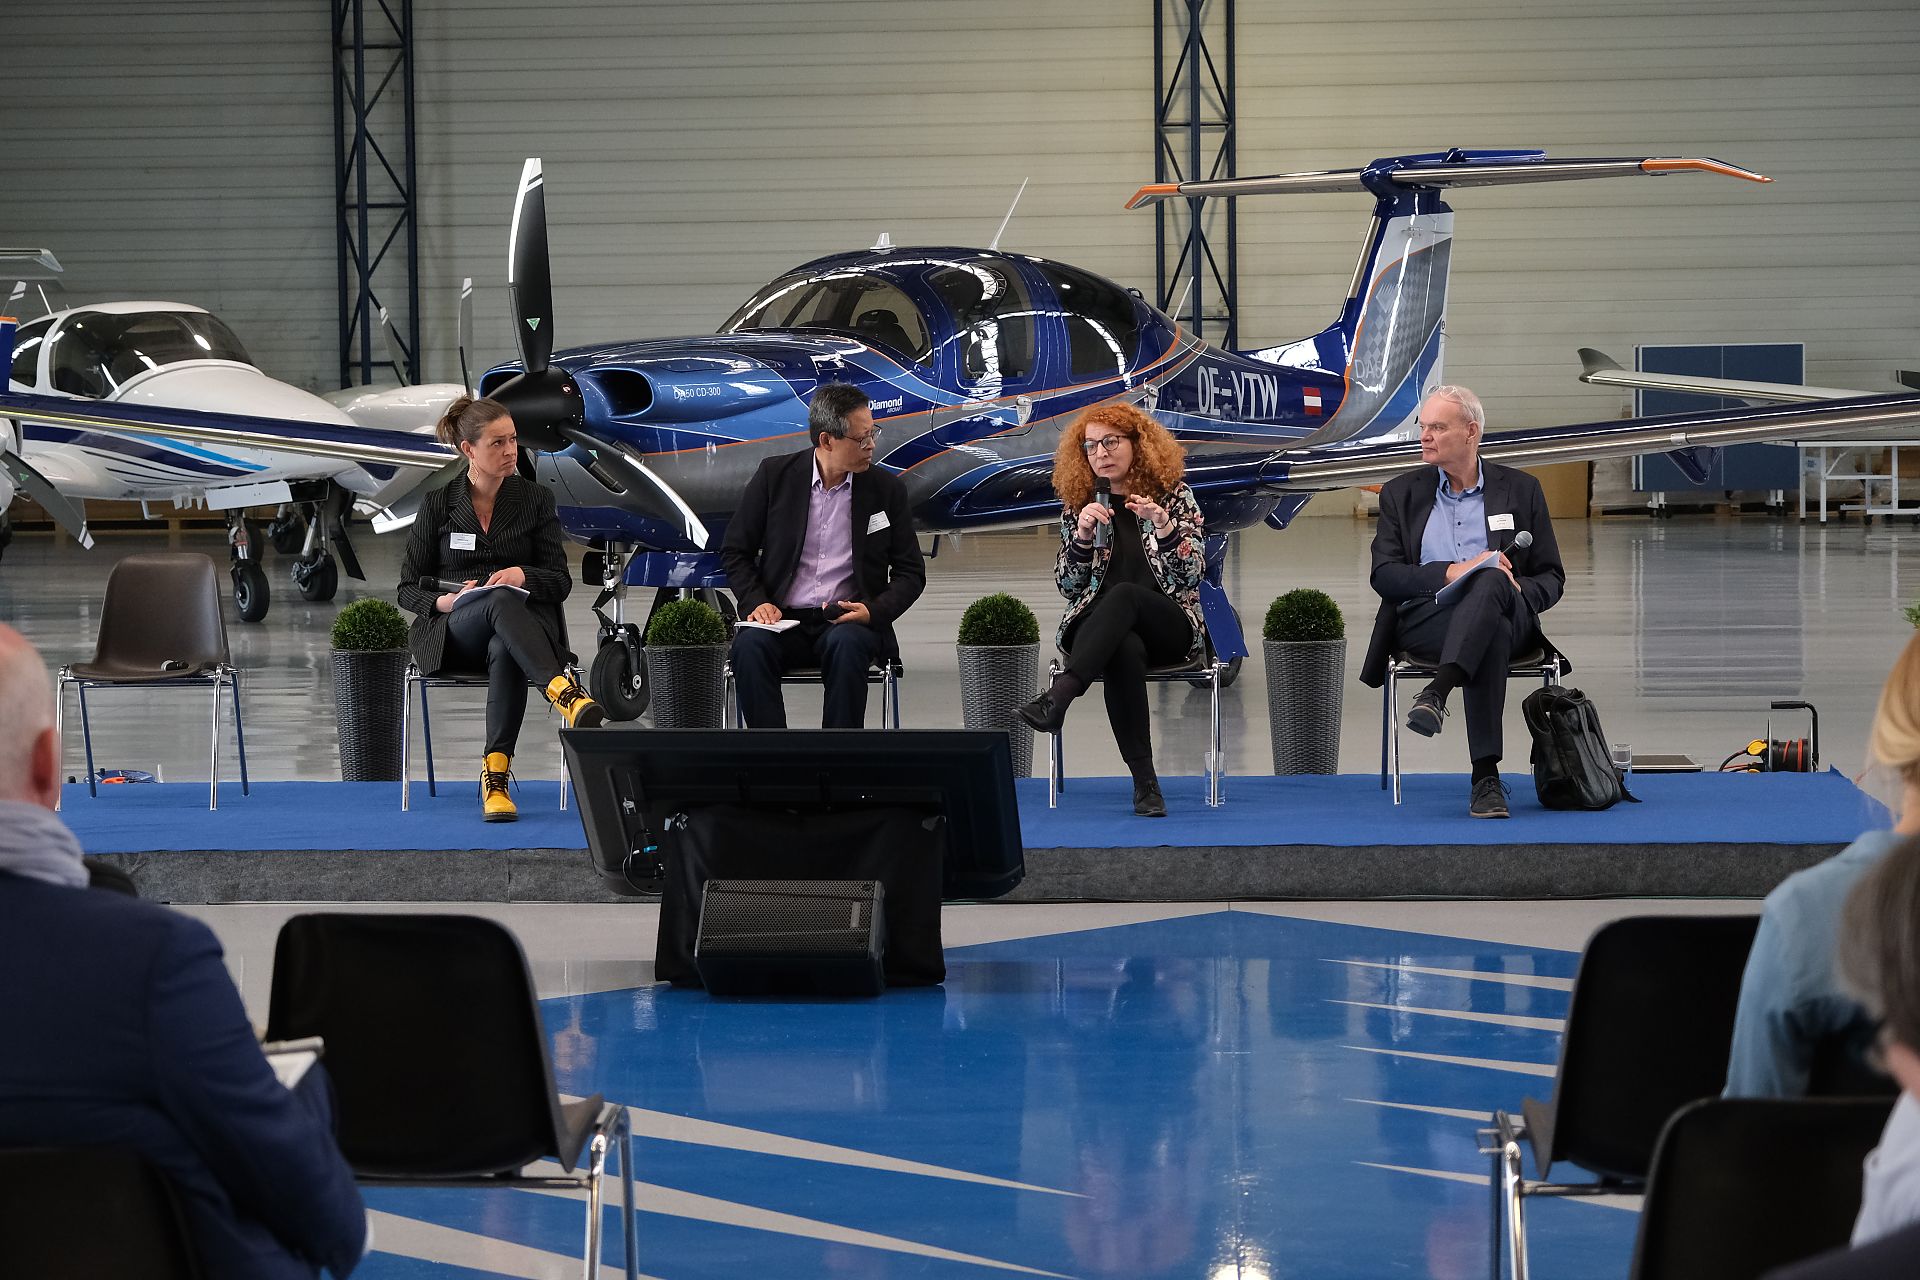
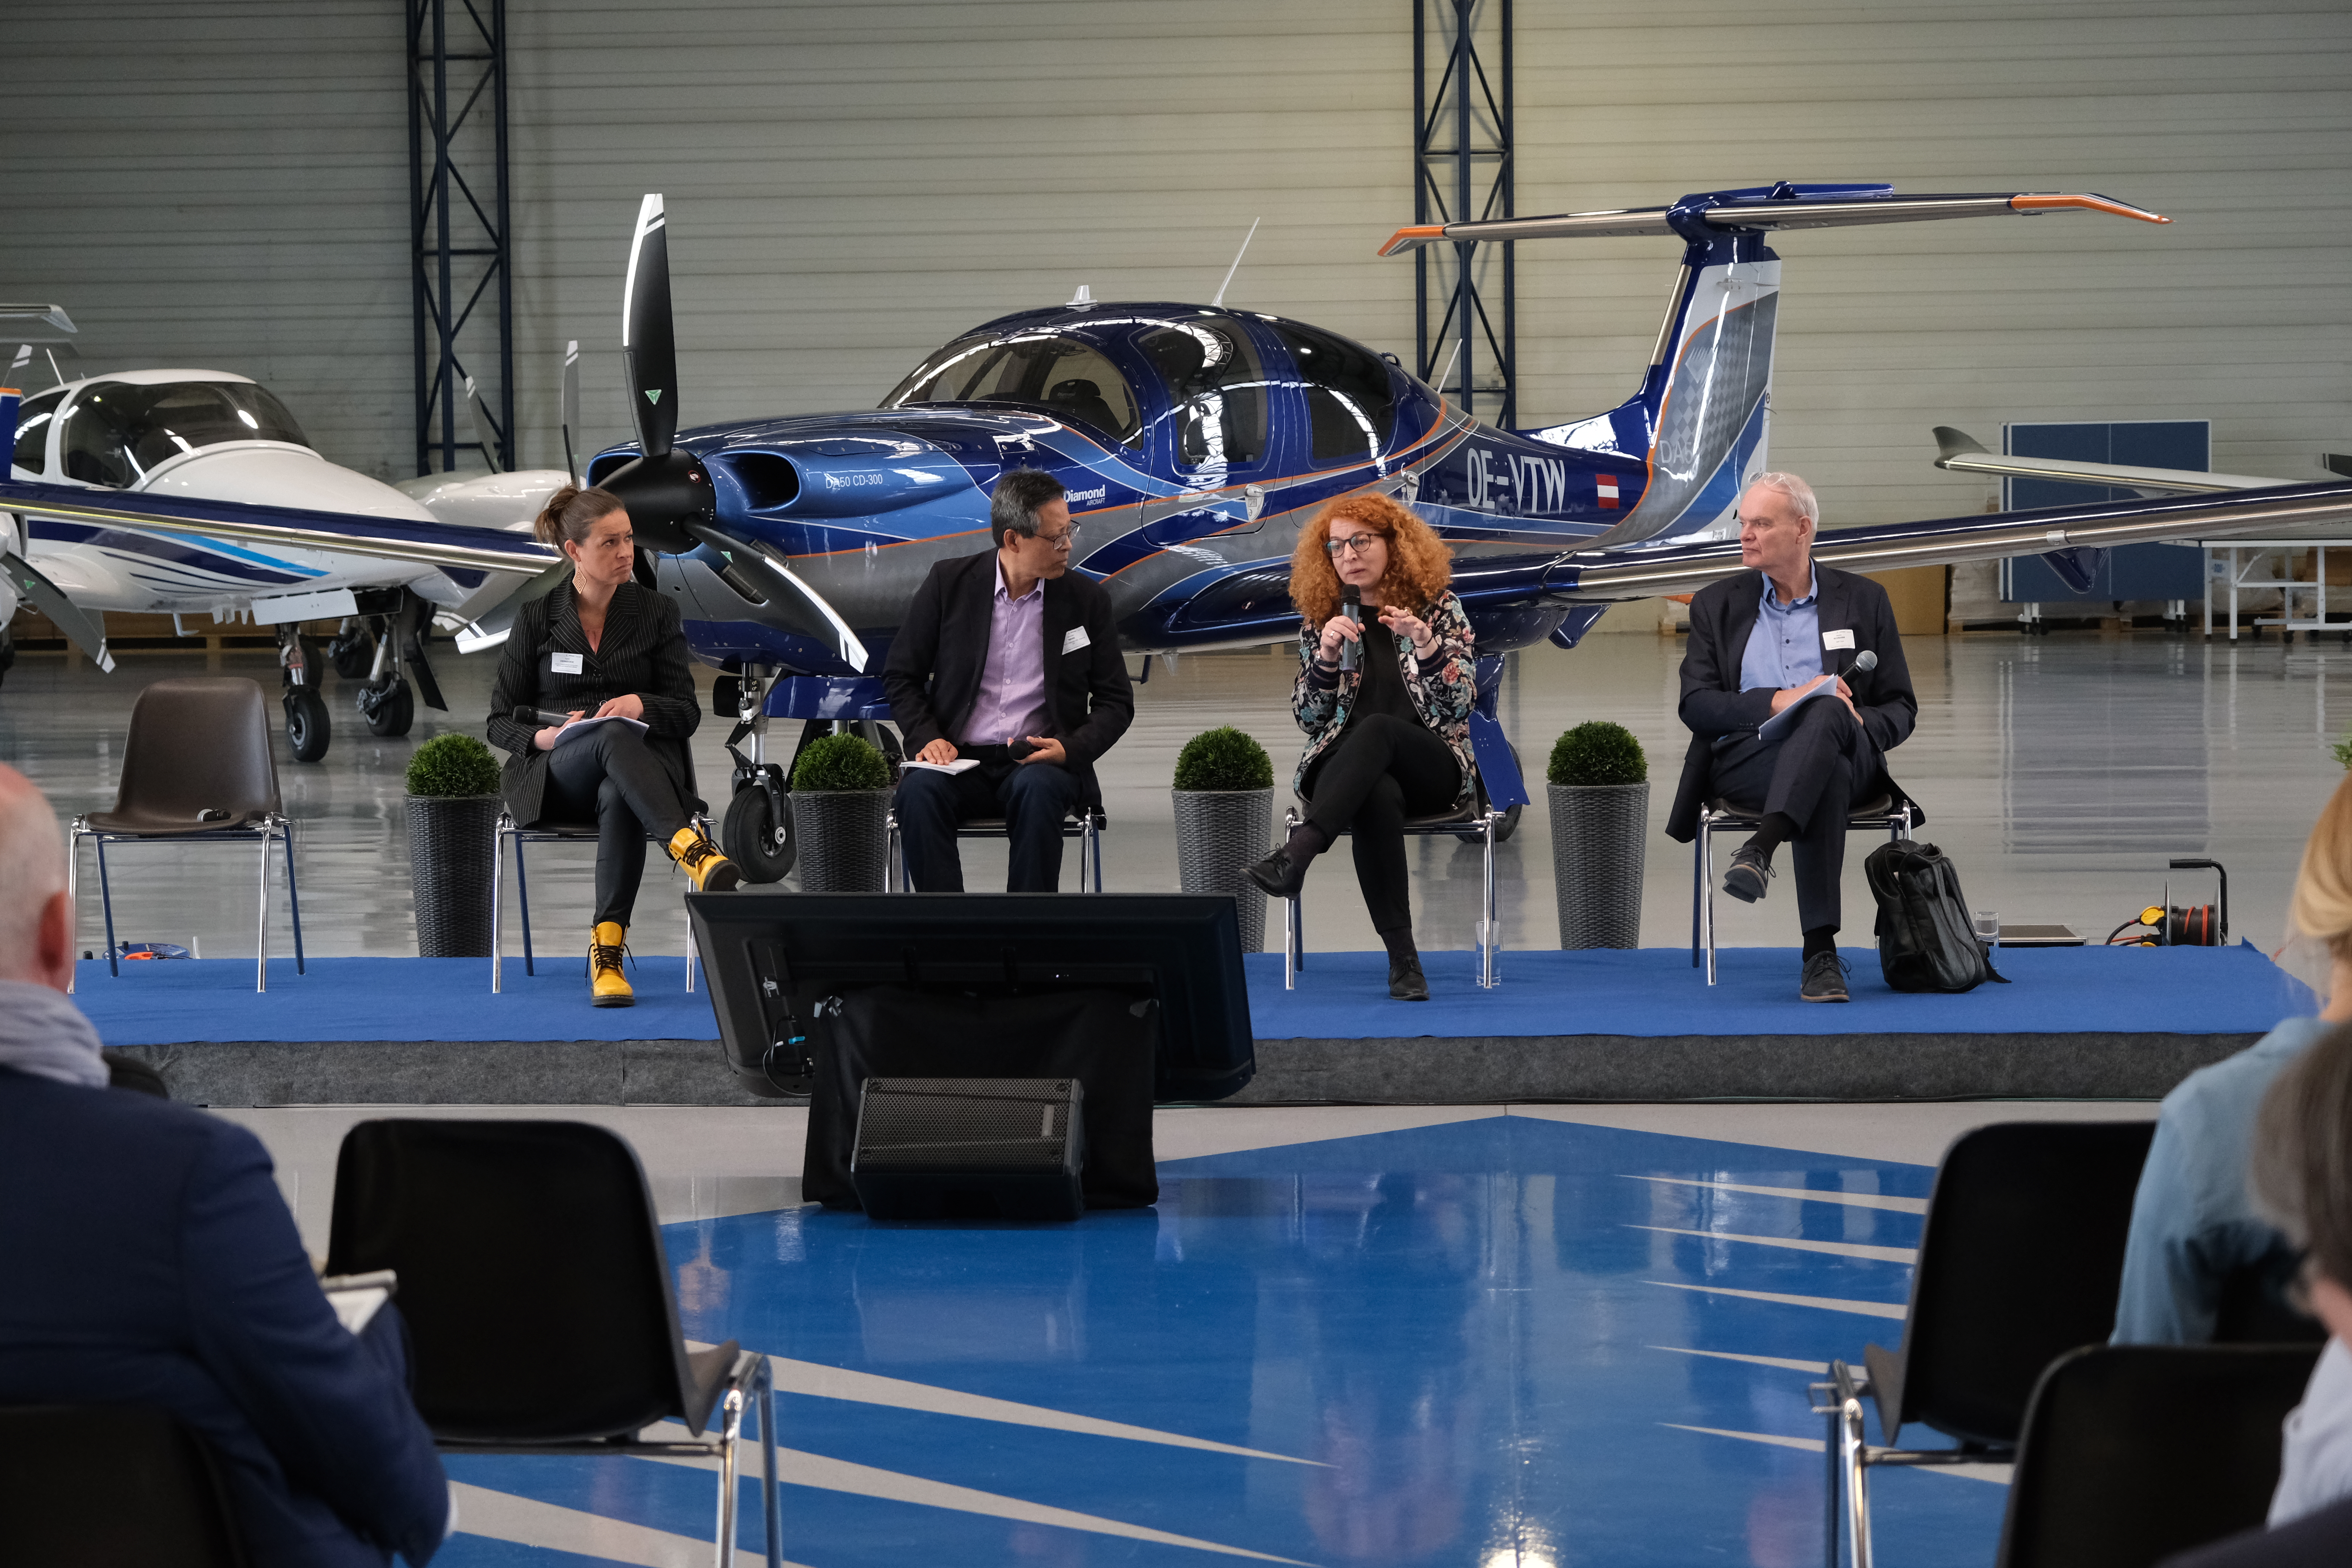
AMF ExCo 69 - International SAF Conference in Wr. Neustadt
Panel discussion at the international SAF Conference in Wr. Neustadt in 2025
Copyright: Sandra Tronigger

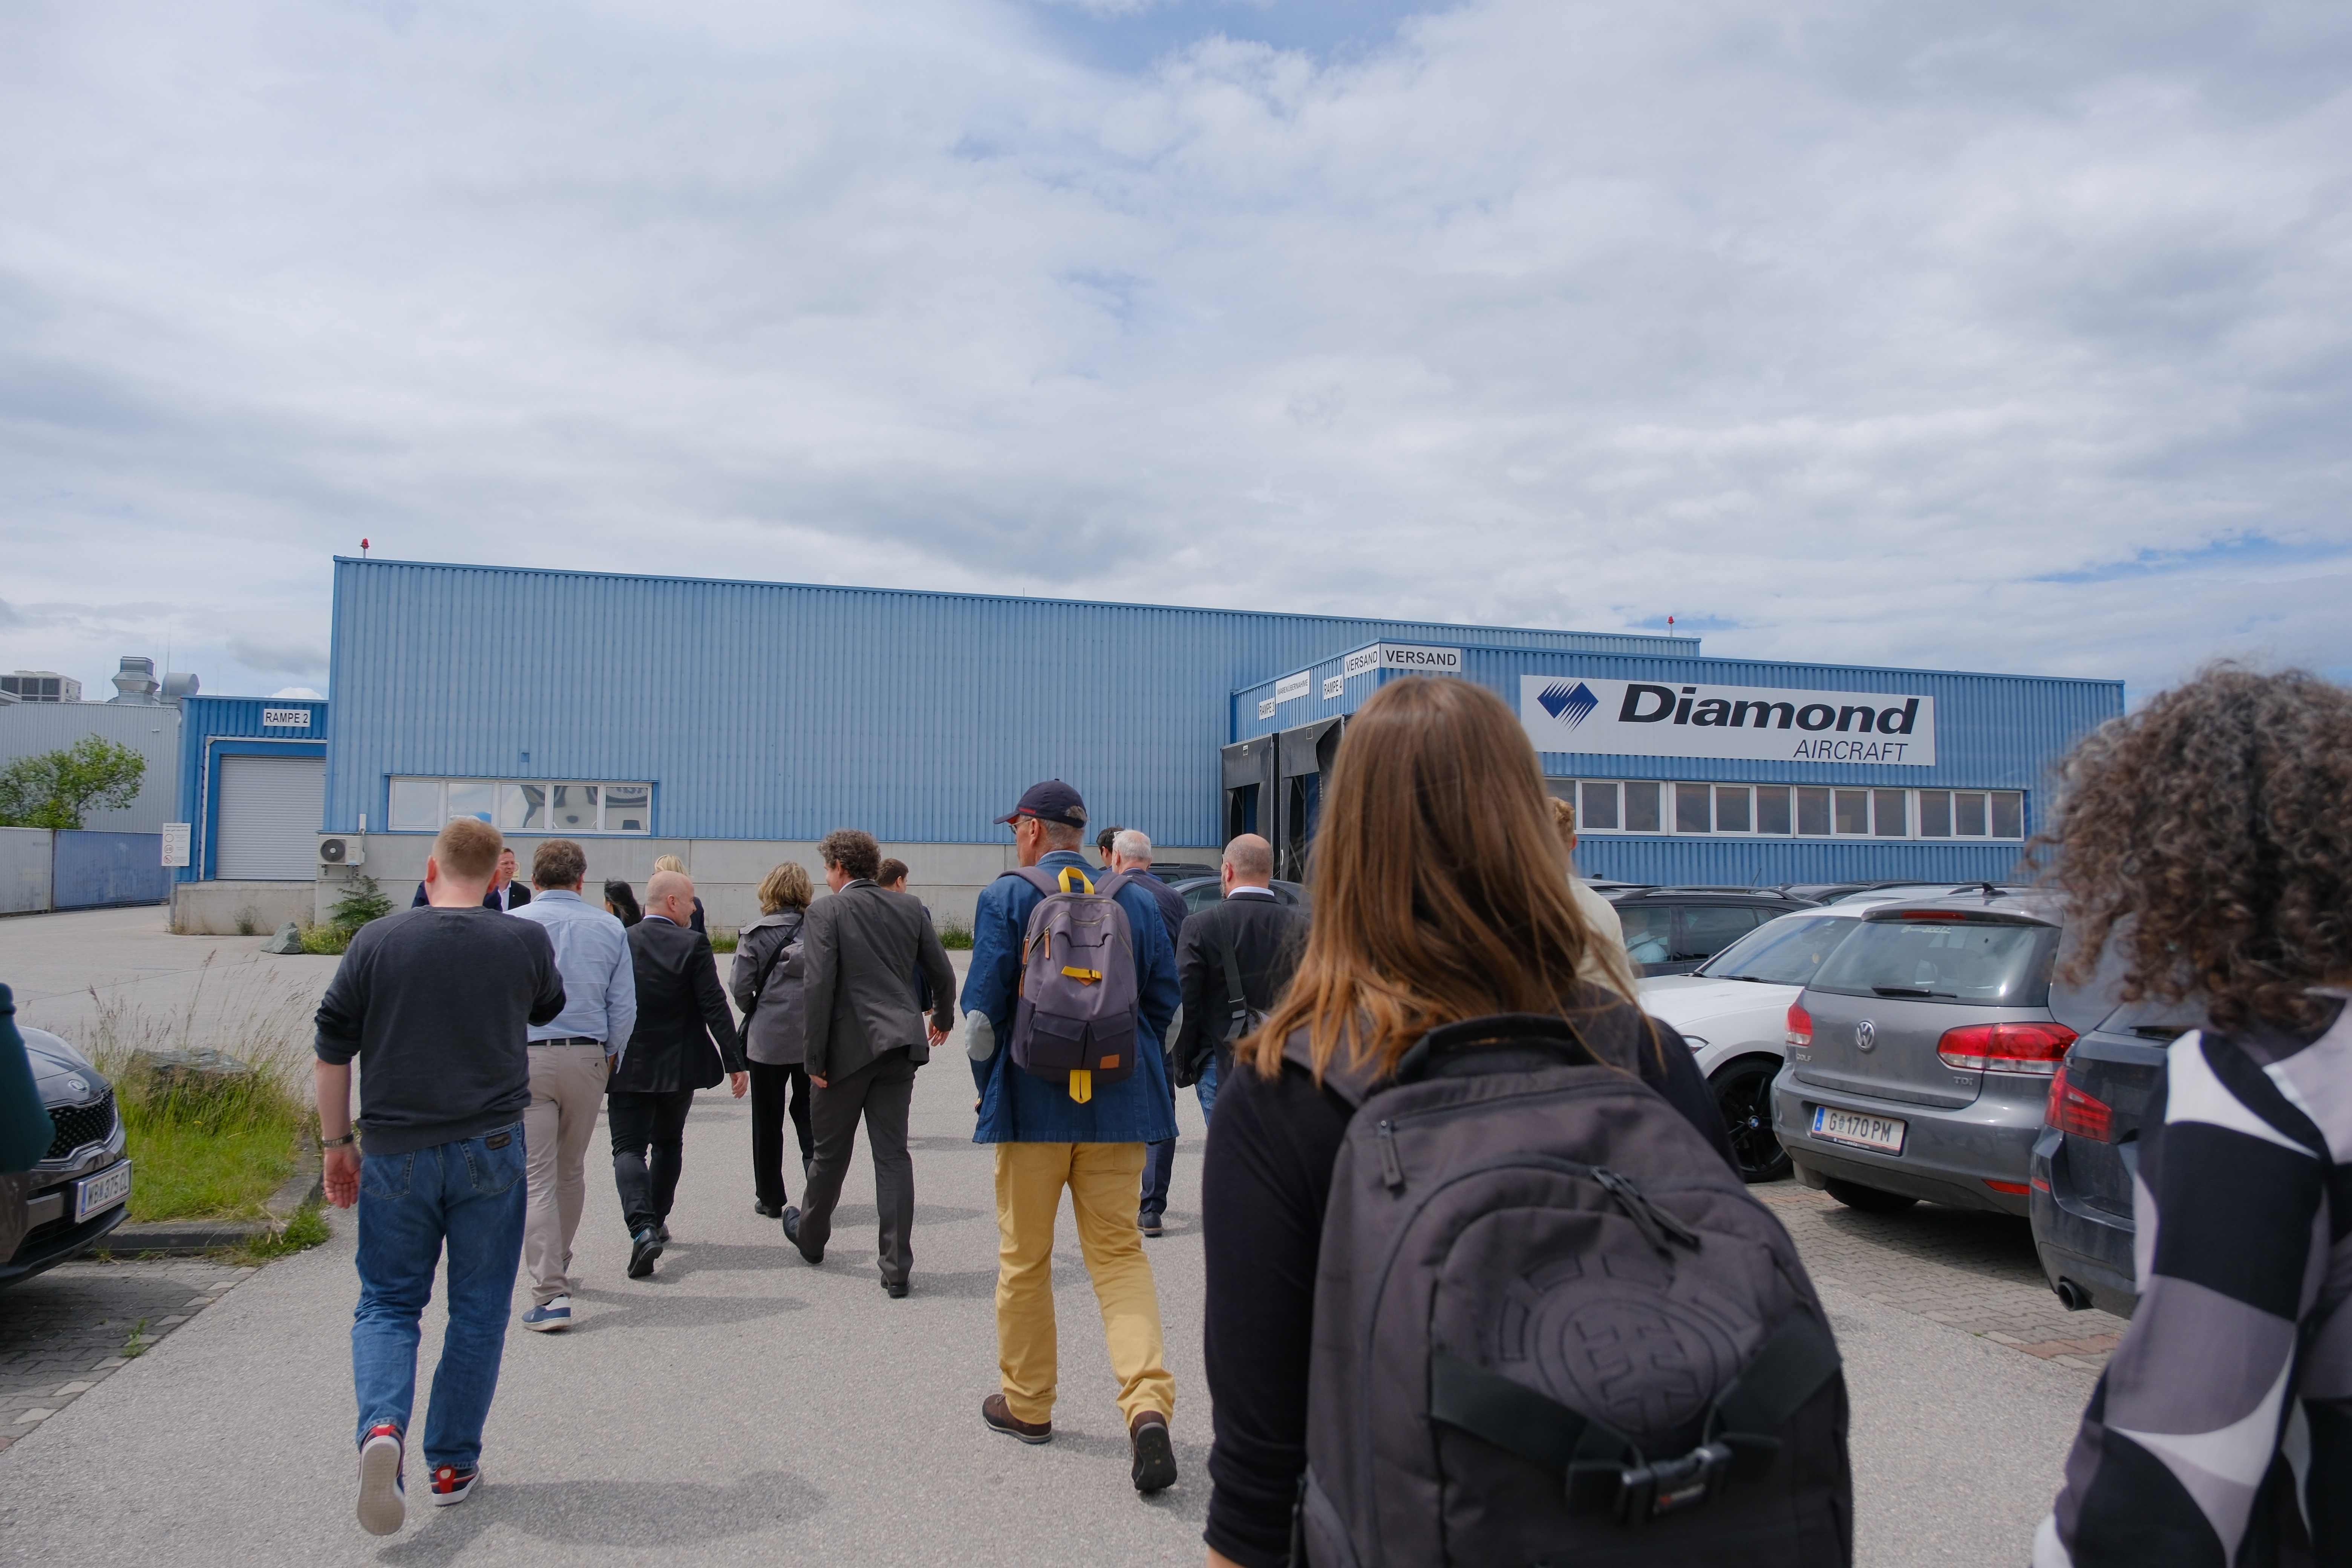
AMF ExCo 69 - Visiting Diamond Aircraft and Austro Engine
Visiting Diamond Aircraft and Austro Engine during AMF ExCO in 2025
Copyright: Sandra Tronigger
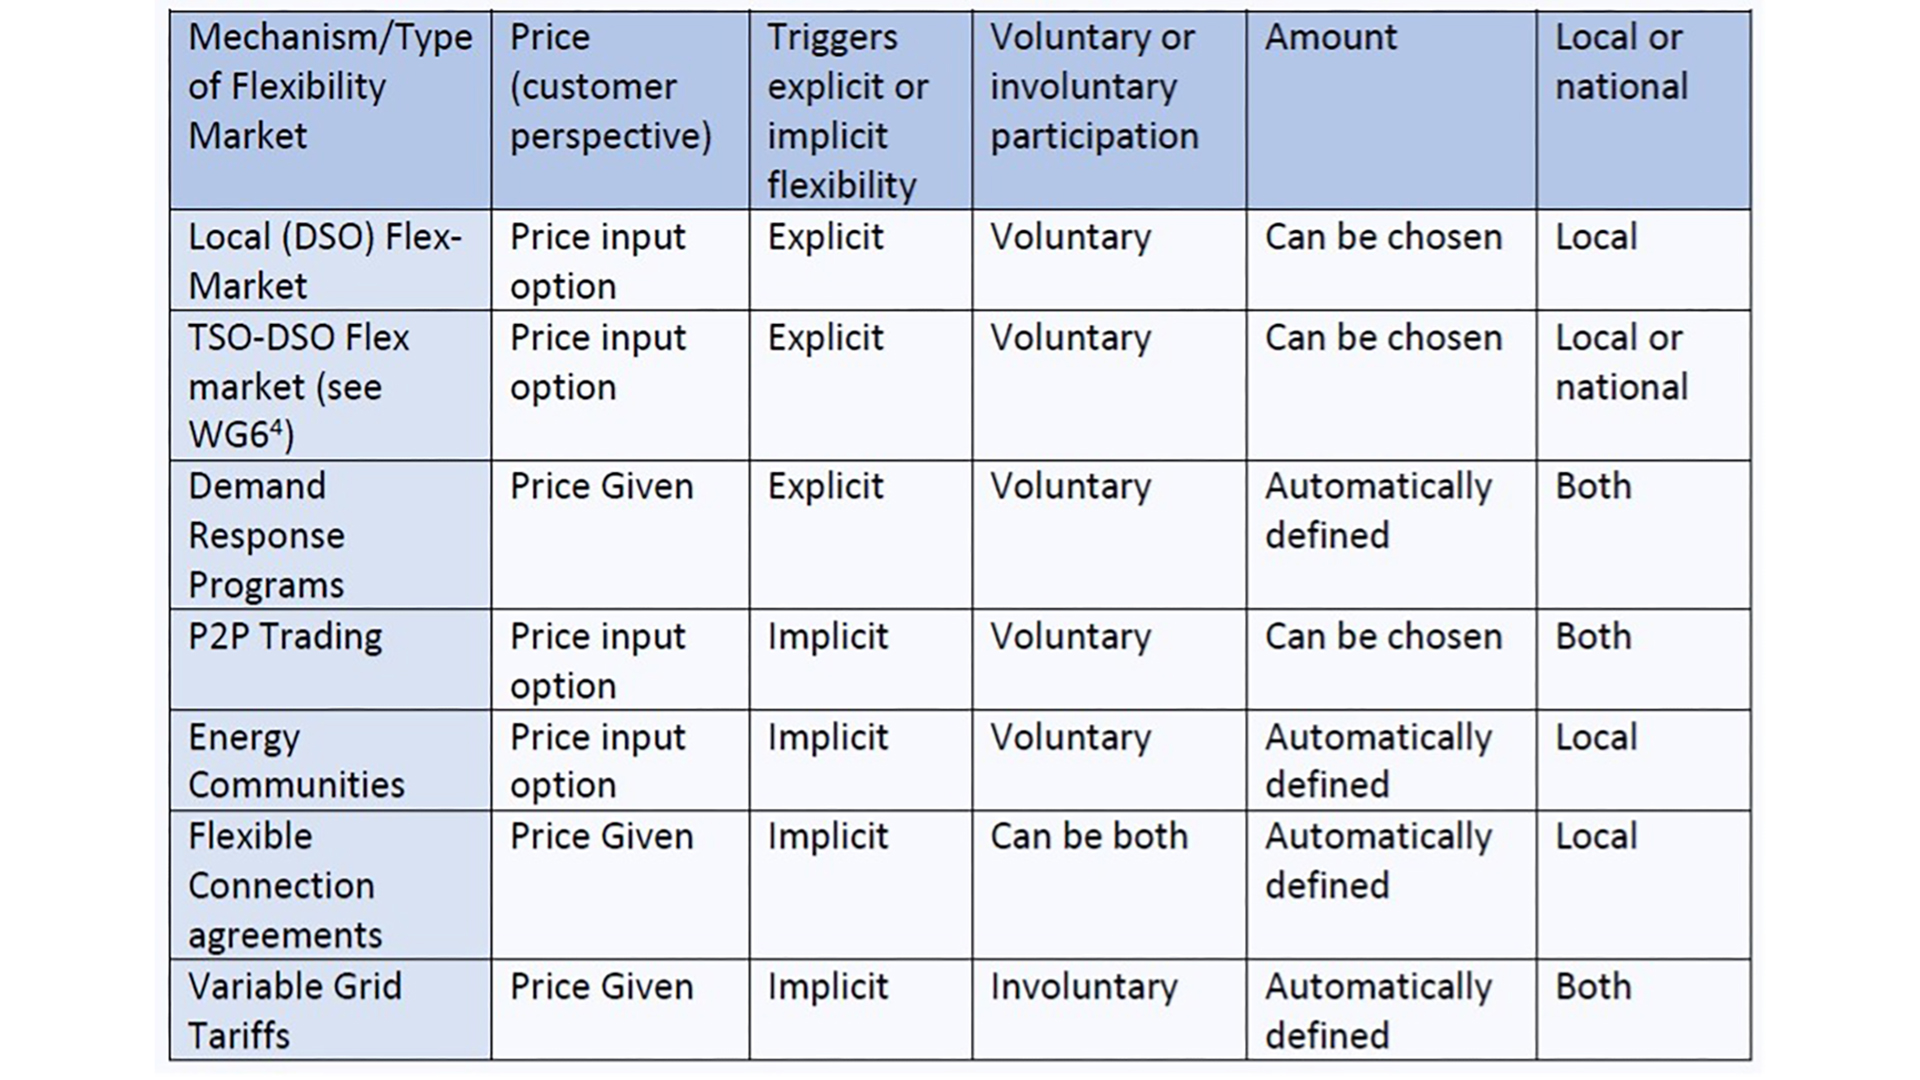
Classification of Flexibility Mechanisms
The table provides an overview and classification of different flexibility mechanisms used in electricity systems, based on key distinguishing characteristics such as pricing structure, activation triggers, participation mode, quantity determination, and spatial scope. It illustrates how diverse approaches—ranging from local flexibility markets and demand response programs to peer-to-peer trading, energy communities, flexible connection agreements, and variable grid tariffs—can be systematically compared. Each mechanism is categorized according to whether participants can actively set prices (price input option) or are subject to predefined tariffs (price given), and whether flexibility is activated explicitly through defined products or implicitly via incentive-based signals. Furthermore, the table differentiates between voluntary and involuntary participation, as well as whether the amount of flexibility can be freely chosen or is predetermined by the system design. Finally, it distinguishes between local and national implementations, reflecting the extent to which mechanisms address geographically specific grid constraints or broader system-level needs. Overall, the table highlights the wide spectrum of flexibility provision concepts and underscores the increasing importance of both market-based and regulatory instruments in enabling grid stability, integrating distributed energy resources, and supporting the transition toward more adaptive and decentralized energy systems.
Copyright: AIT Austrian Institute of Technology
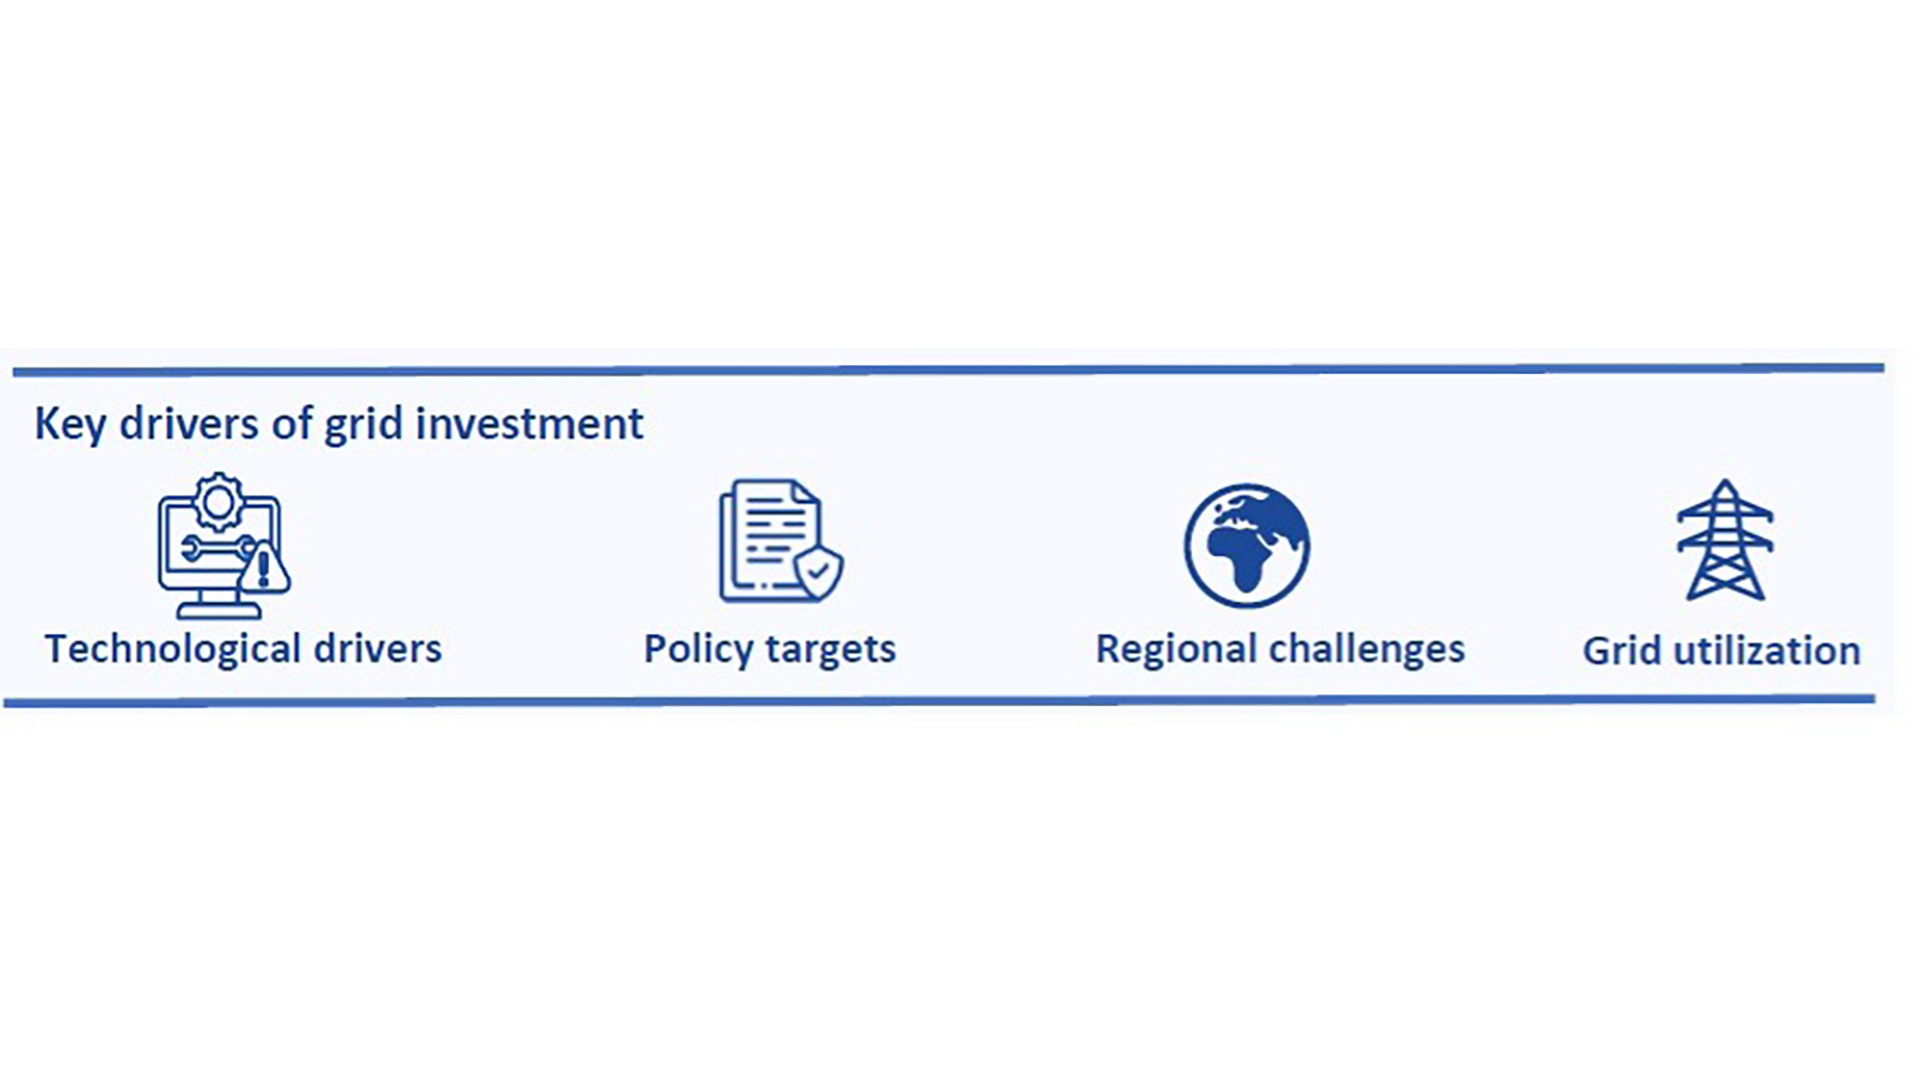
Key drivers for Grid Investment
The graphic illustrates the four key drivers for grid flexibility and reinforcement: technological developments, particularly injection peaks from PV generation and electric vehicles; policy targets for renewable energy and EV adoption, which strongly influence investment decisions; regional challenges, as grid violations occur differently depending on location, grid design, and the distribution of generation and demand; and grid utilization, which allows for higher median loading of cables and transformers. Together, these factors determine where, when, and to what extent flexibility and grid reinforcement are needed.
Copyright: AIT Austrian Institute of Technology
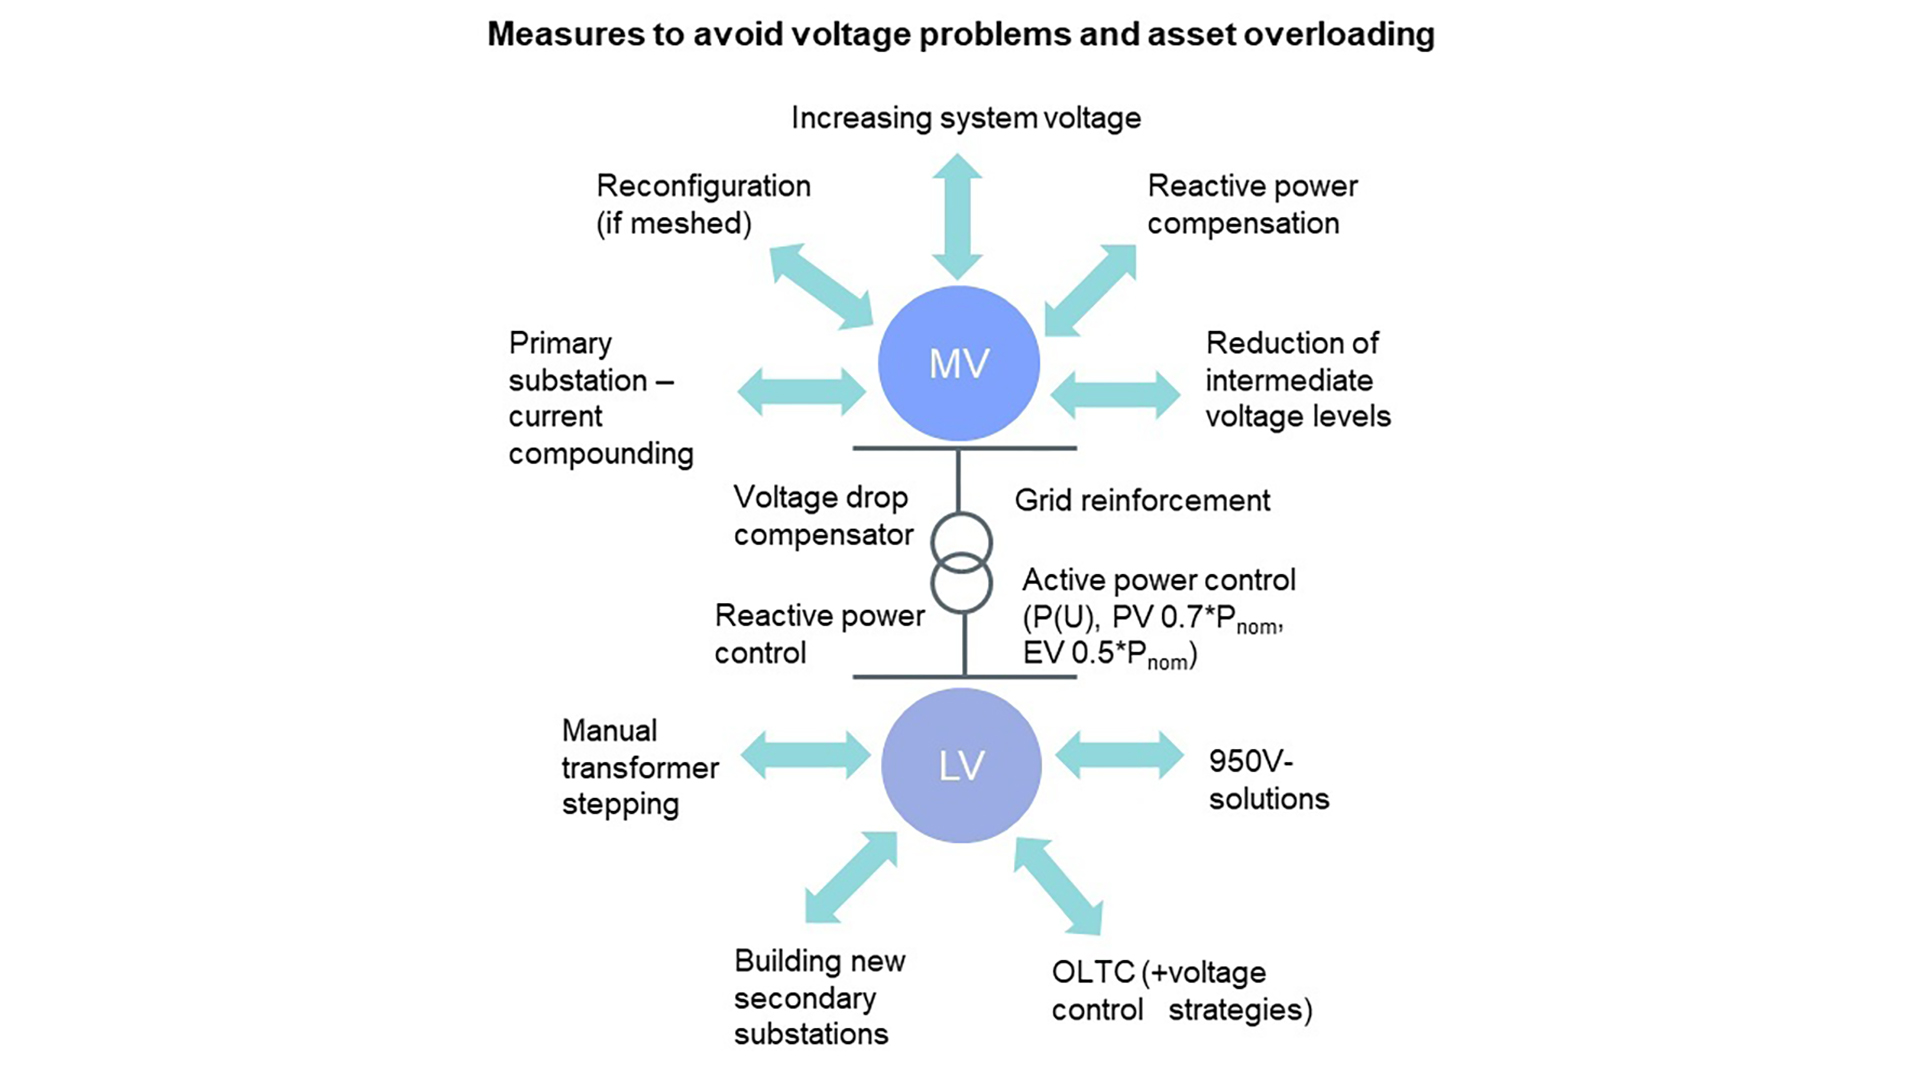
Measures to avoid voltage problems
One of the key challenges in managing decentralized energy systems is preventing network violations. Network violations arise not only from exceeding the thermal limits of cables and transformers, a challenge typically managed through conventional congestion management, but also significantly from overvoltage or undervoltage, particularly in low-voltage (LV) networks. Possible measures to avoid these violations are shown in this figure.
Copyright: AIT Austrian Institute of Technology
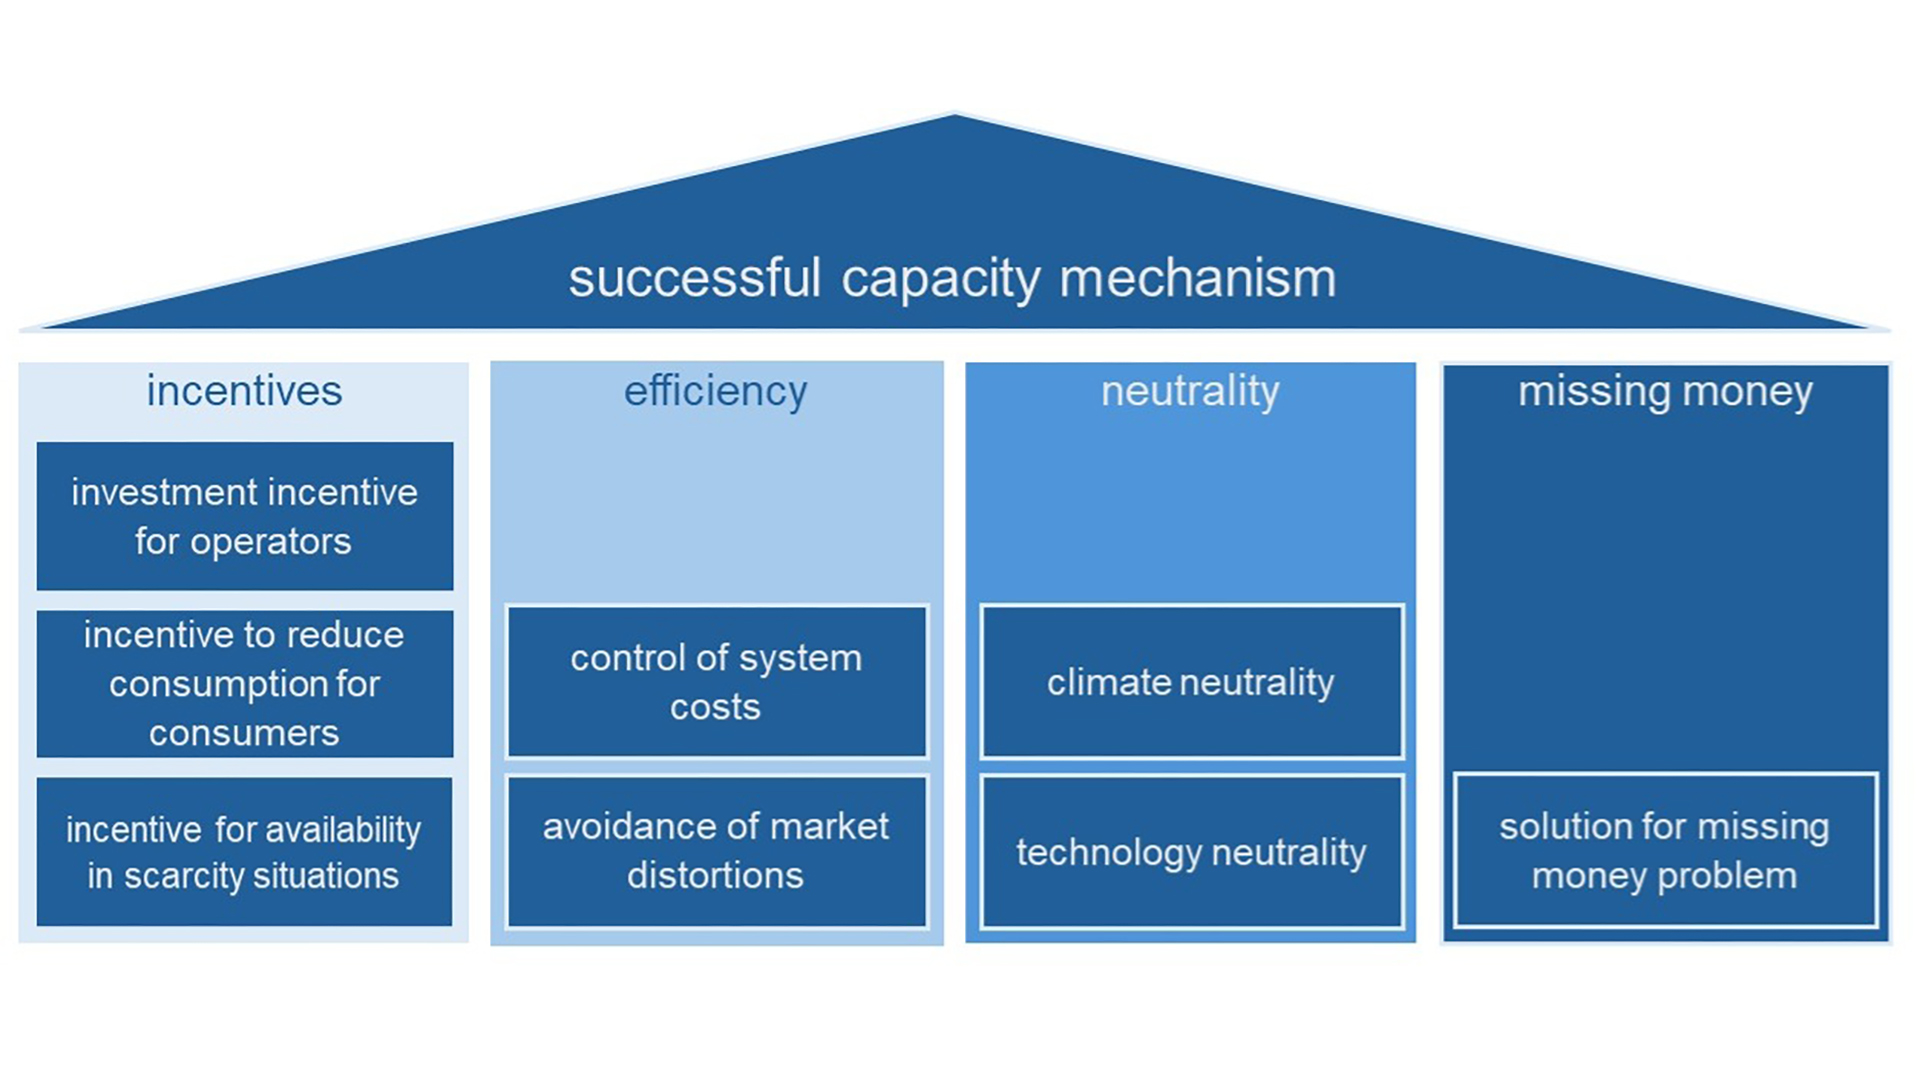
Main pillars to form a successful capacity mechanism
The figure illustrates the key design principles of an effective Capacity Mechanism (CM), structured around four main dimensions: Incentives, Efficiency, Neutrality, and Missing Money. The Incentives pillar highlights the importance of creating appropriate signals for both producers and consumers, including investment security, stable revenue mechanisms, demand-side flexibility, and ensuring availability during scarcity situations. The Efficiency dimension emphasizes the need to control overall system costs while avoiding market distortions through well-designed market mechanisms and competitive structures. Under Neutrality, the figure stresses the importance of a technology- and climate-neutral approach that maintains a level playing field while enabling the participation of low-emission technologies. Finally, the Missing Money pillar addresses the issue of insufficient market revenues by introducing additional income streams and risk-mitigation mechanisms to ensure the financial viability of energy producers and long-term security of supply.
Copyright: AIT Austrian Institute of Technology
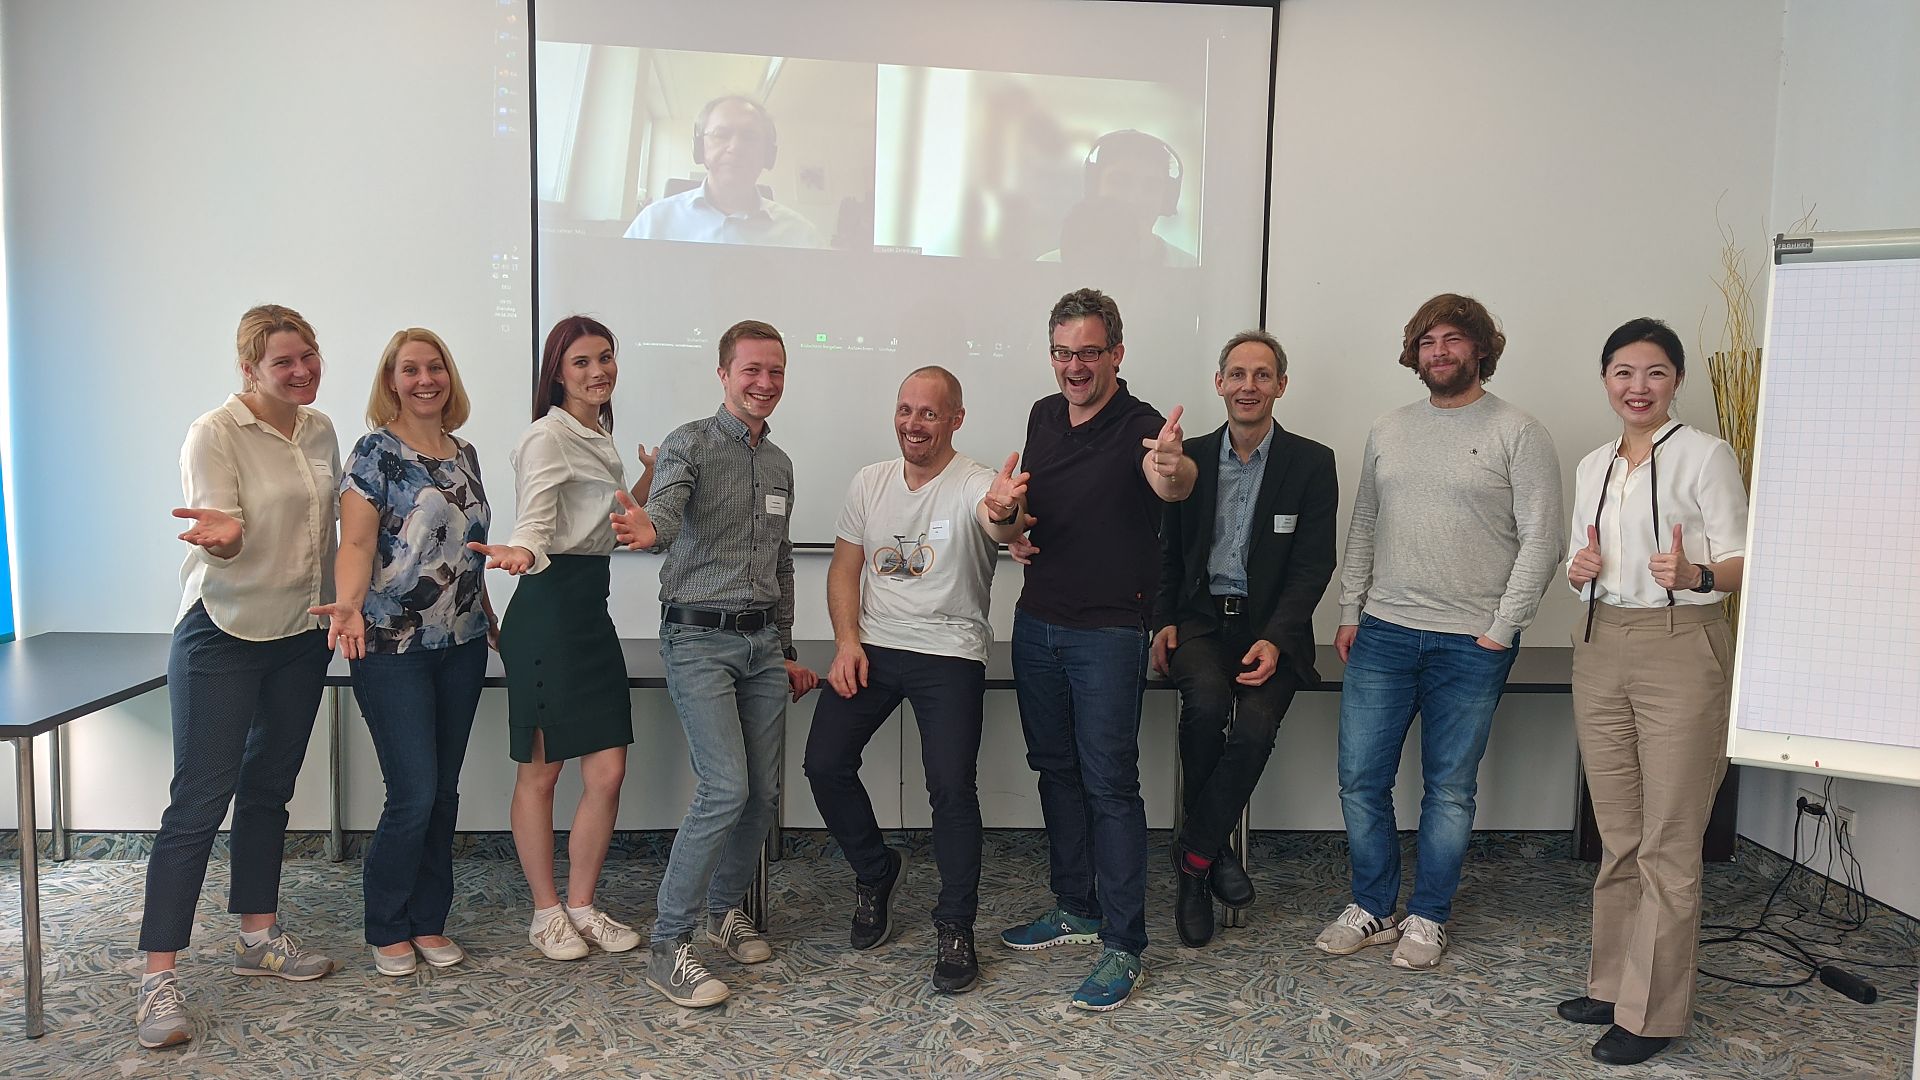
Gruppenfoto IETS Task 21 Consortium Meeting in Graz
On April 9, 2024, a full-day meeting of IETS Task 21 took place in Graz. The meeting provided a valuable platform for exchanging insights and planning further steps for the successful implementation of the tasks within Task 21.
Copyright: Gahleitner
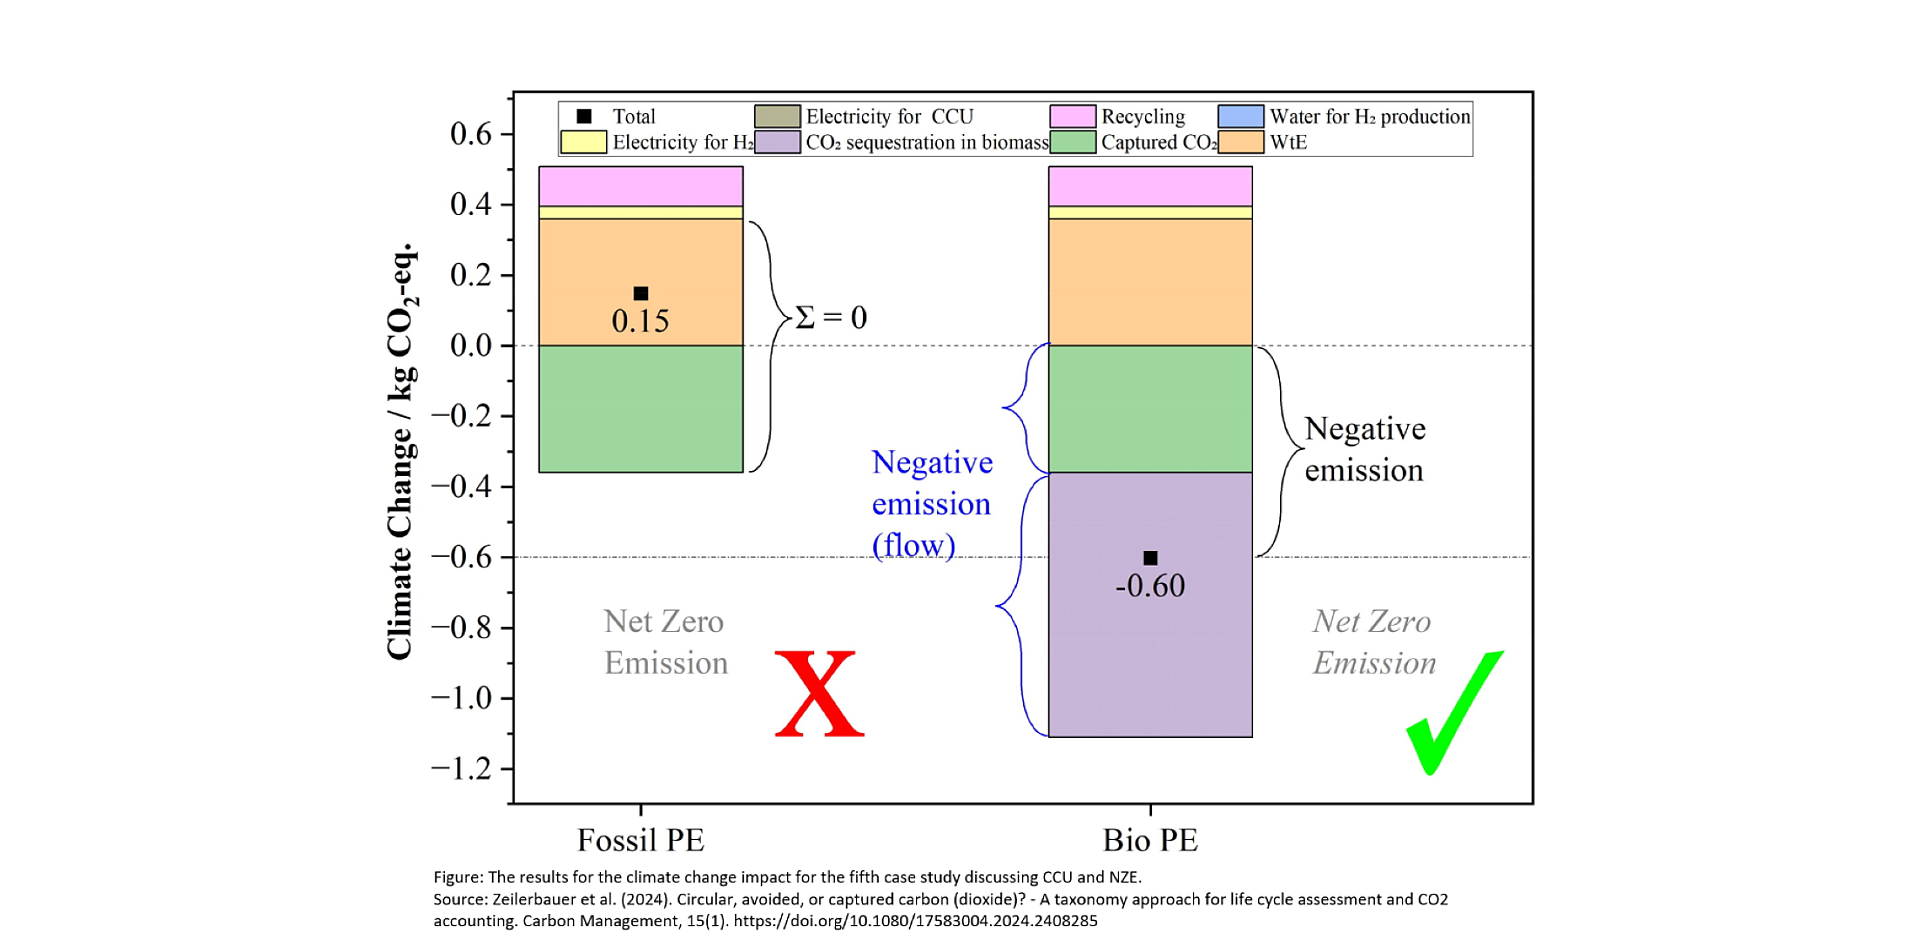
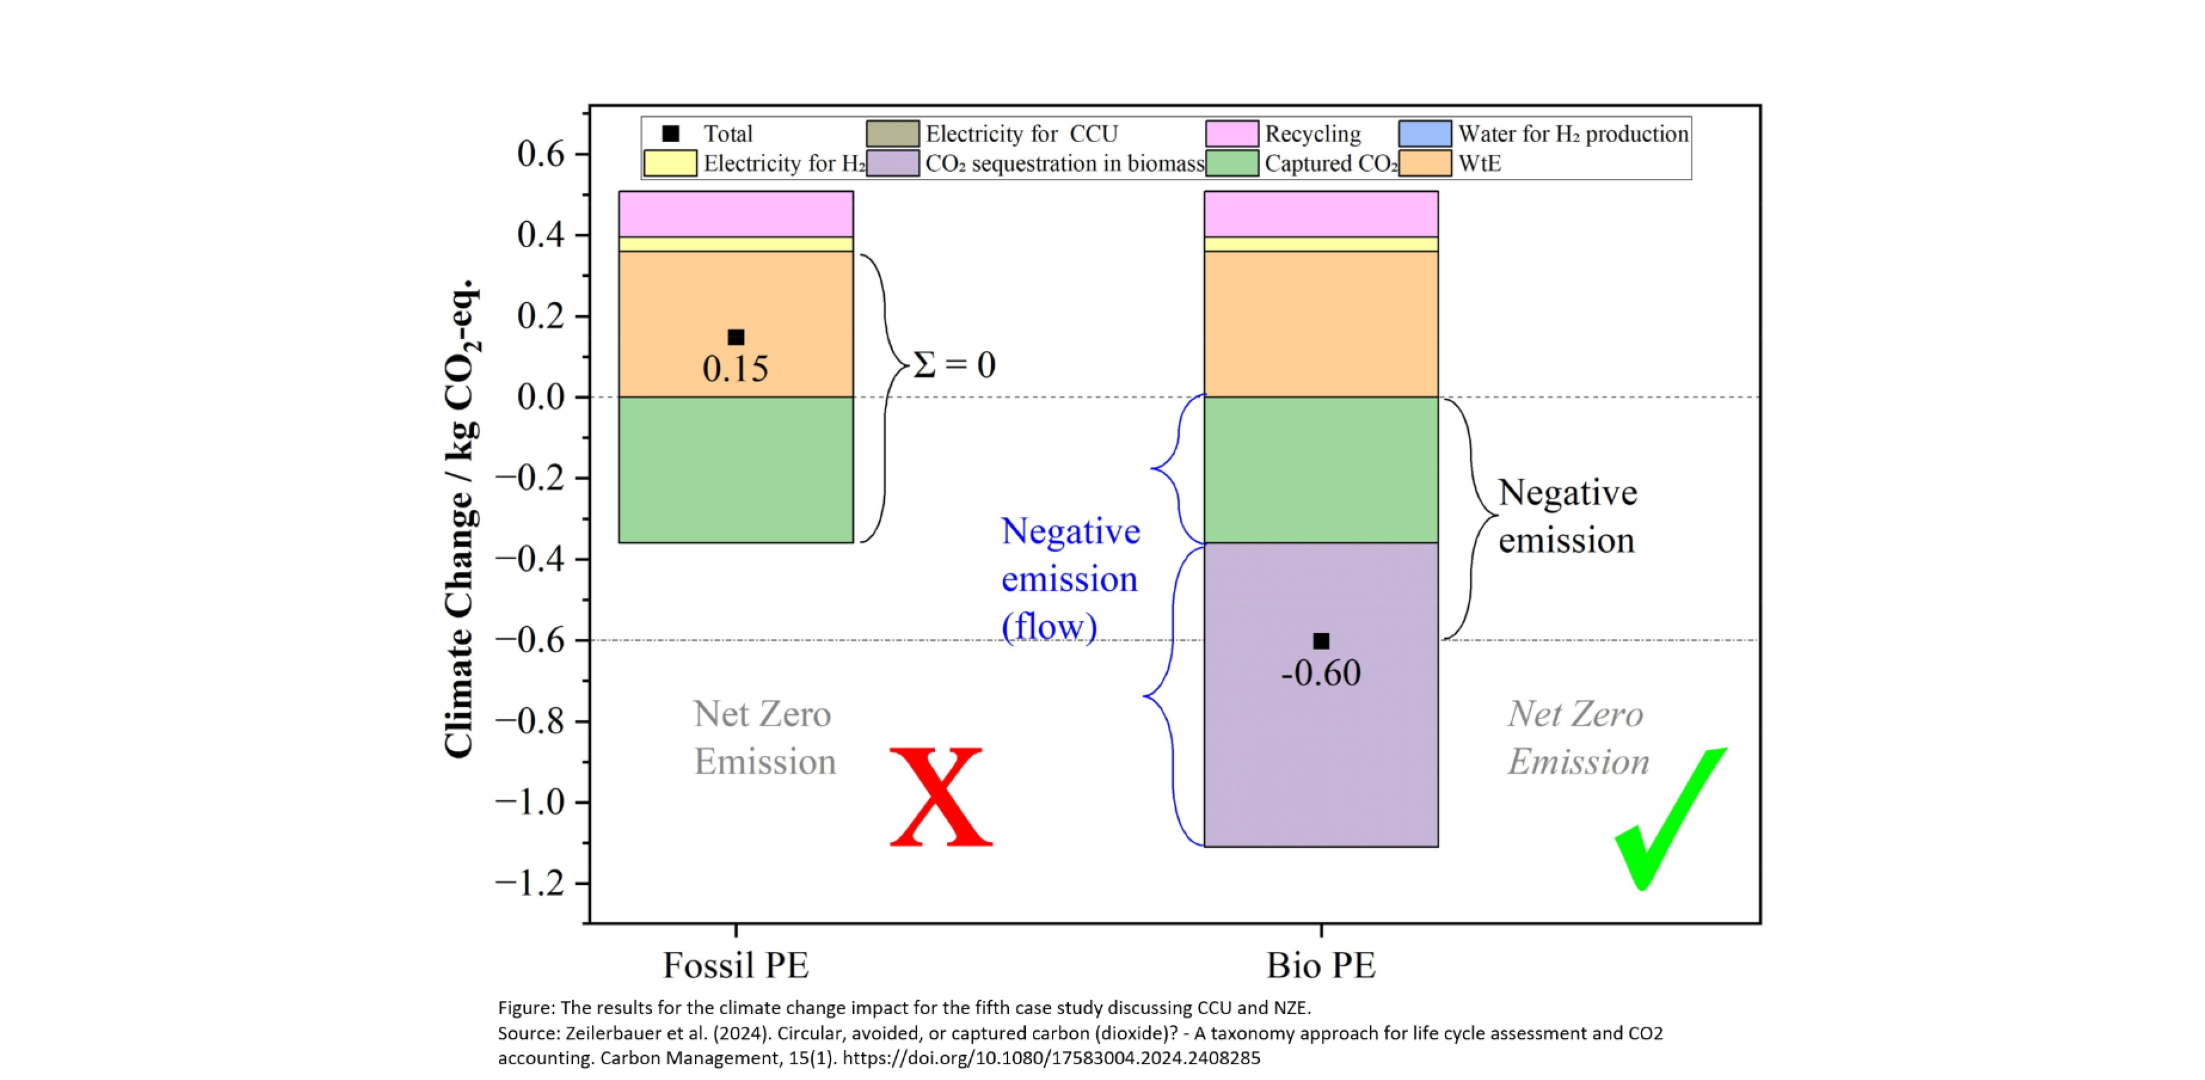
Graphic illustration of different terms from Zeilerbauer et al. (2024)
Figure from Zeilerbauer et al. (2024) (https://doi.org/10.1080/17583004.2024.2408285), which uses a use case to discuss different terms from the area of Circular Carbon.
Copyright: Zeilerbauer et al. (2024)
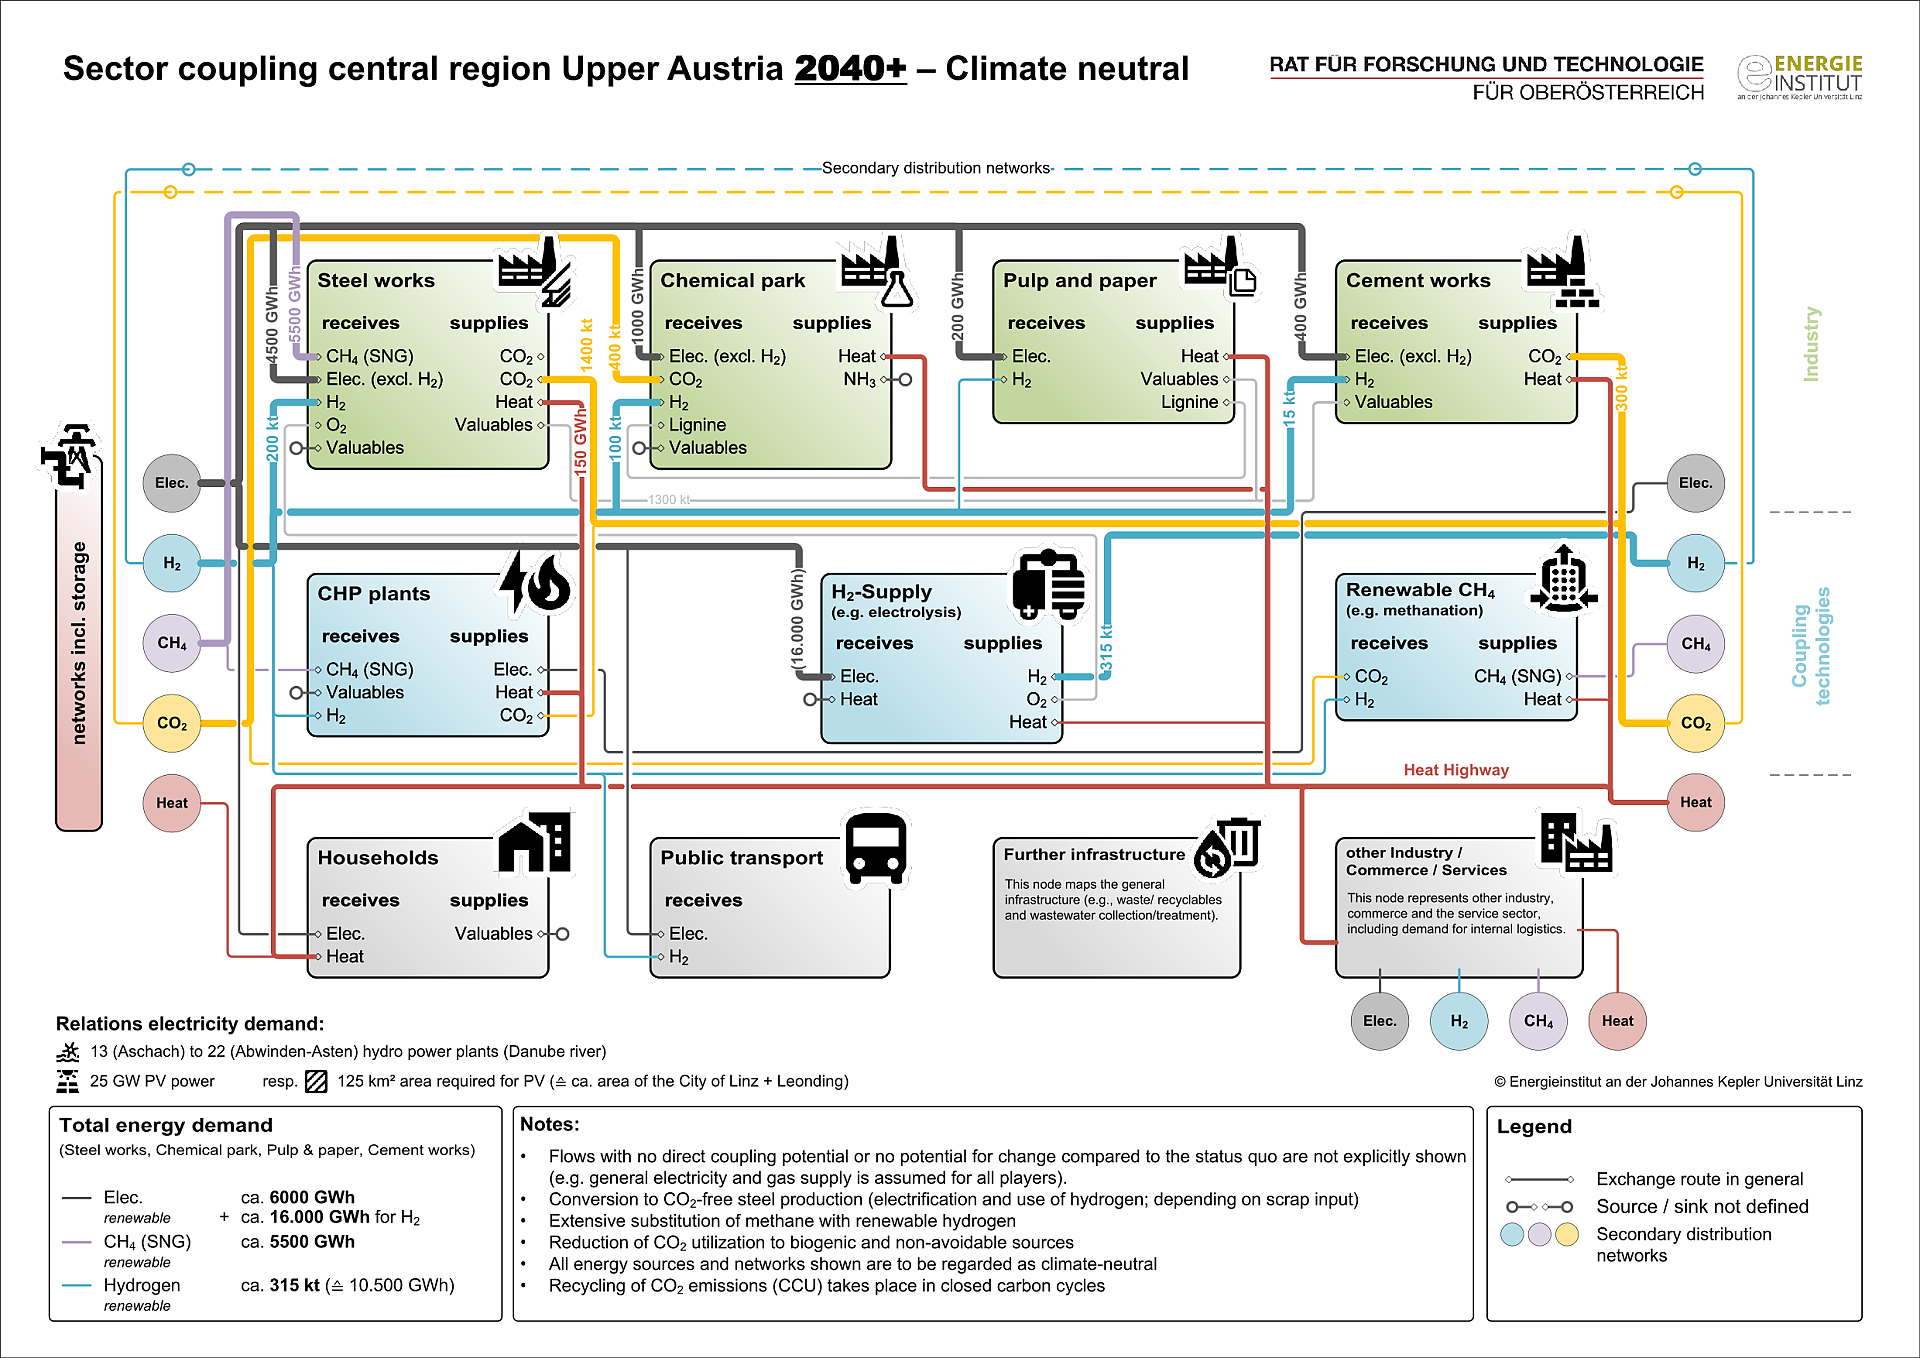
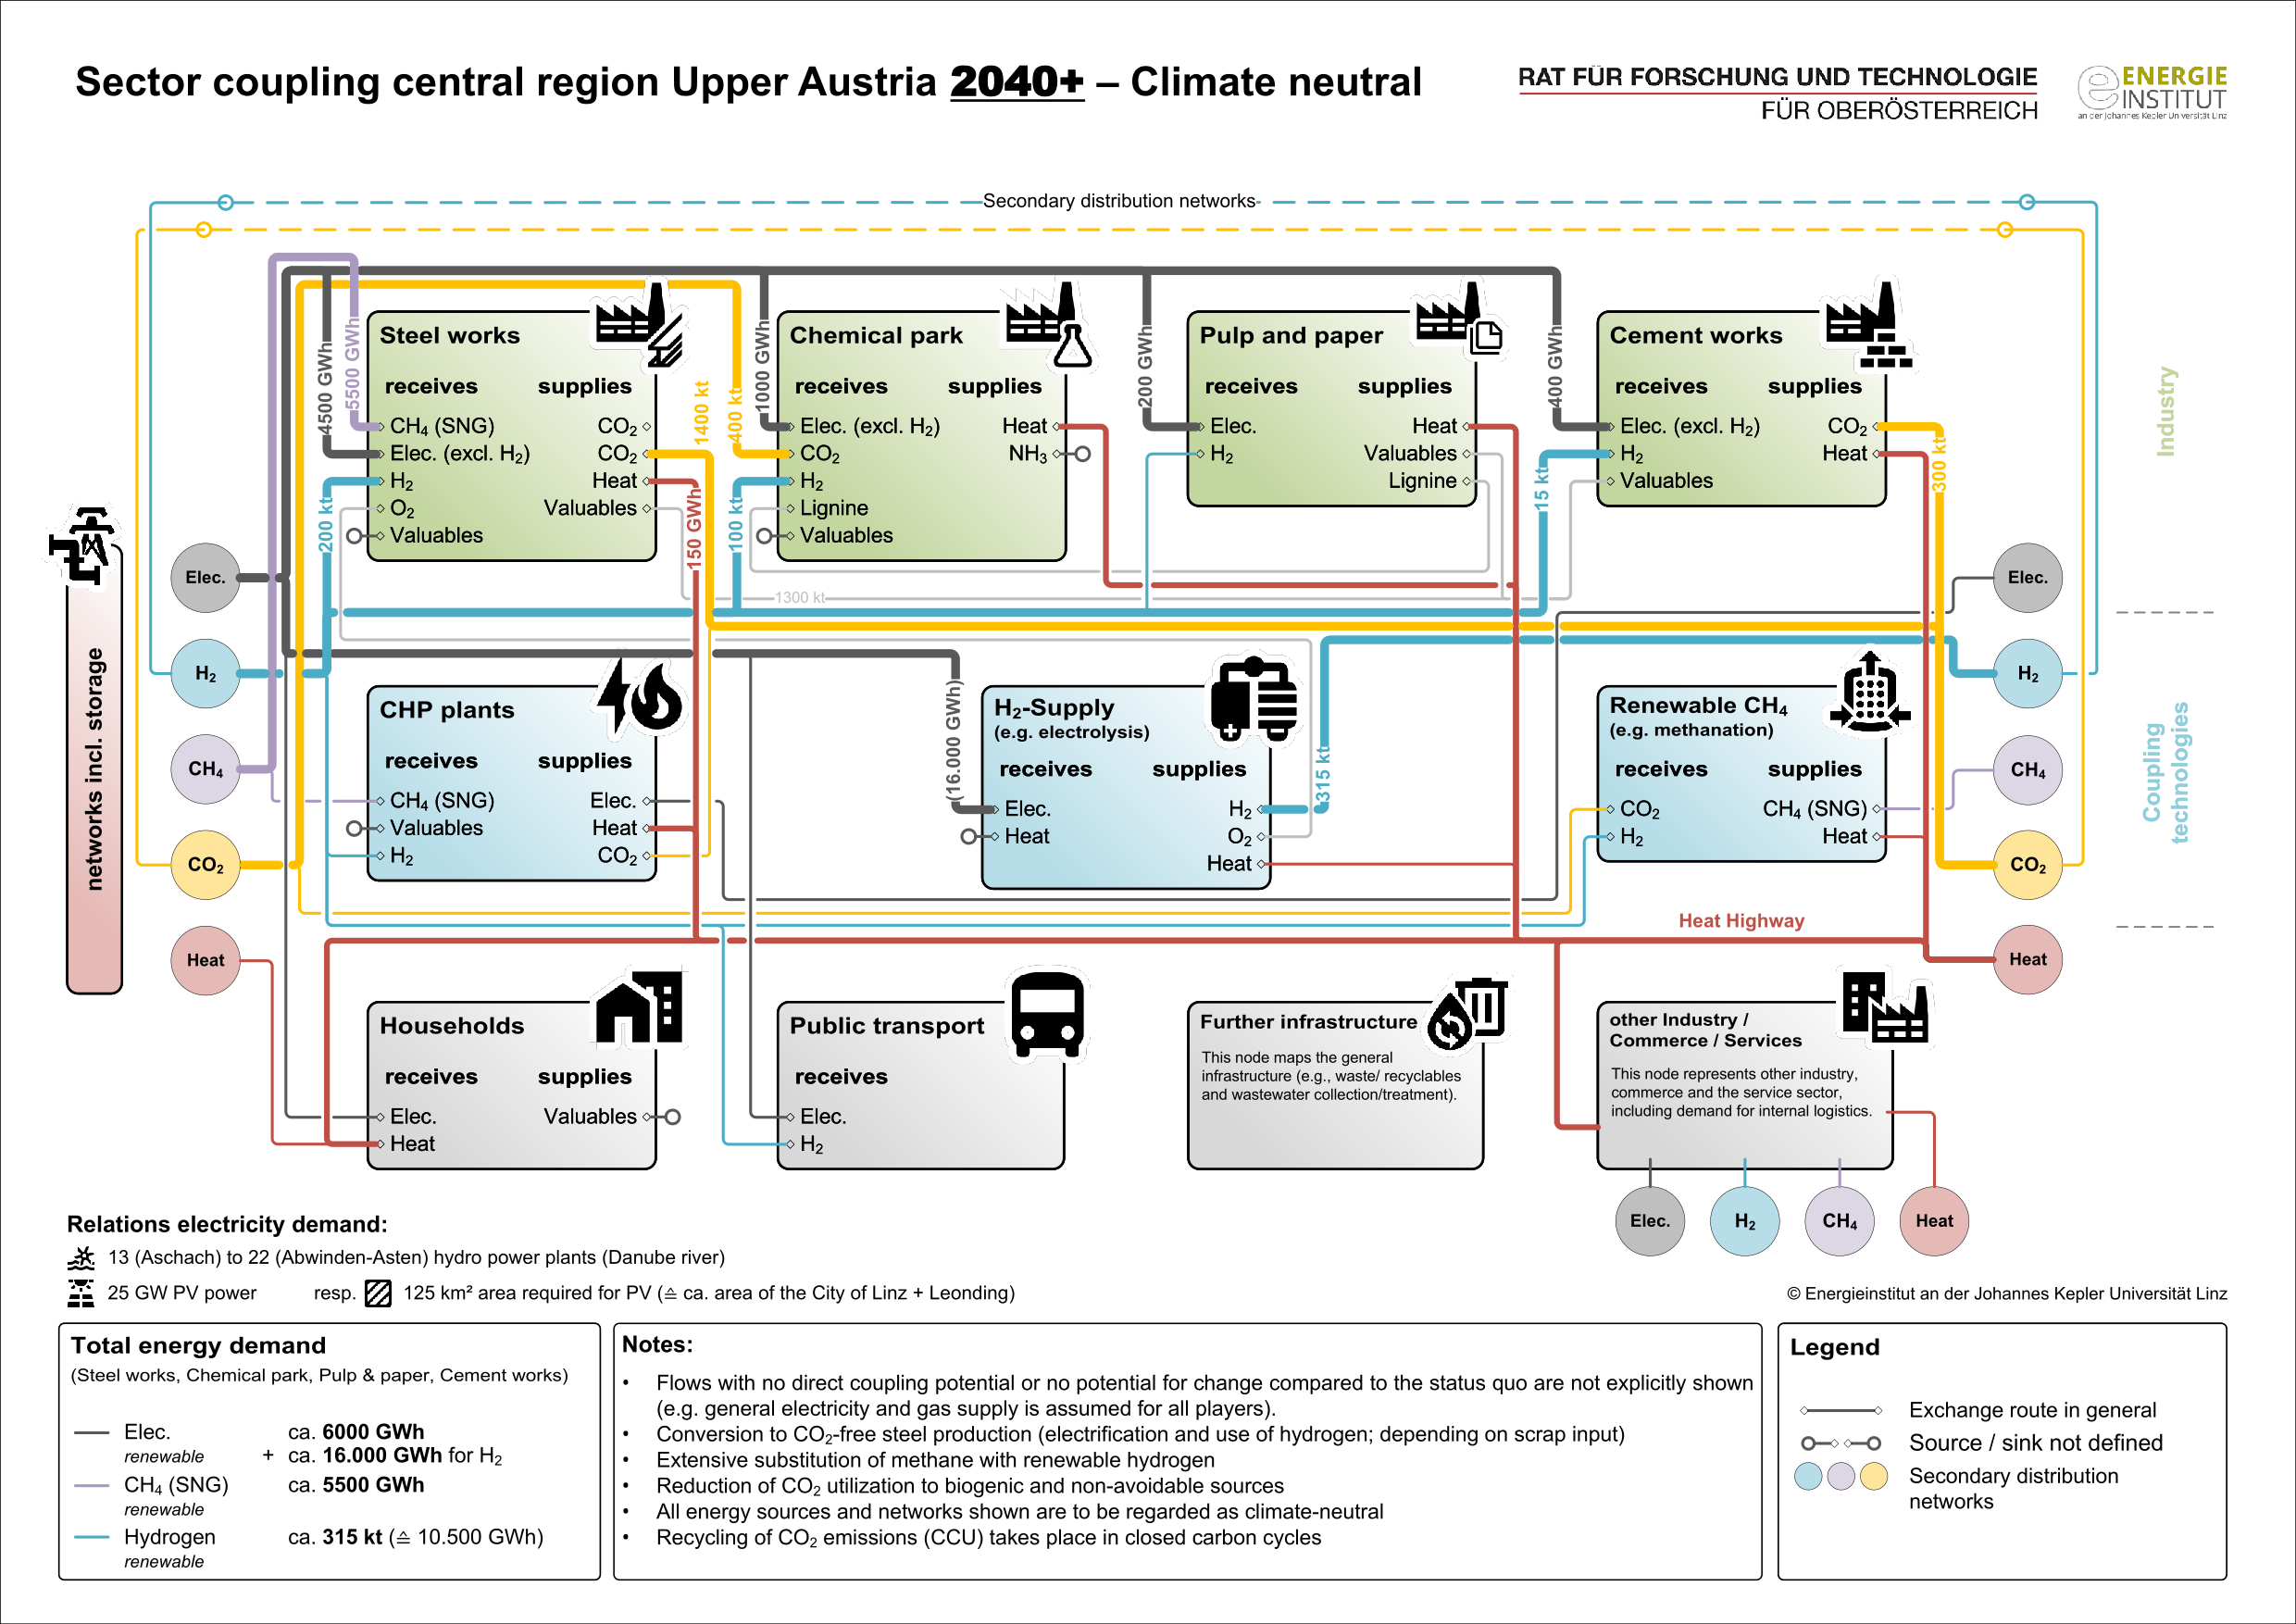
Vision of the Energy/Carbon Future of Upper Austria 2040
The figure shows the visualized vision developed by the Energy Institute at the JKU in coordination with the stakeholders, which represents possible energy and resource exchanges in 2040 in annual quantities.
Copyright: Energieinstitut an der Johannes Kepler Universität Linz

Group picture of IETS Task 21 at the IETS Conference 2023
At the IETS conference from May 9-11, 2023 in Gothenburg, the subtasks and activities of IETS Task 21 were presented, and two key note presentations and two elevator pitches on the task were given.
Copyright: Rodin
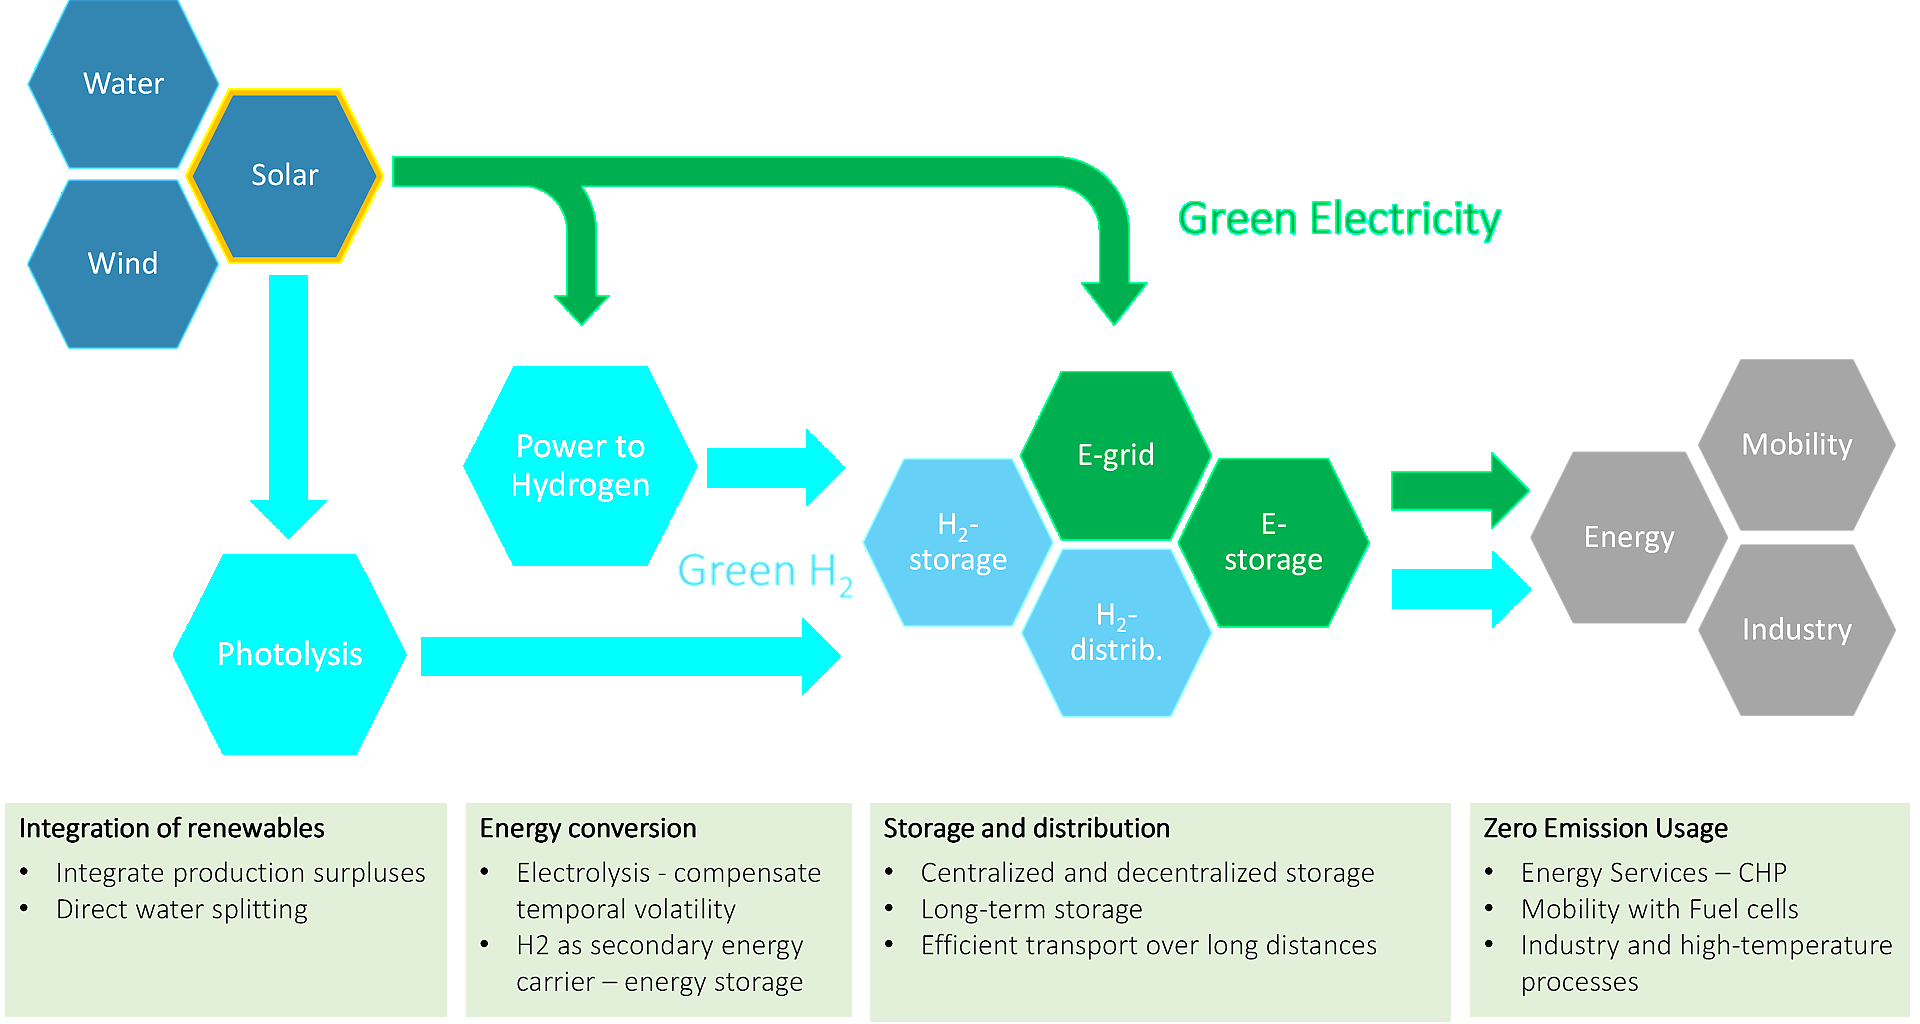
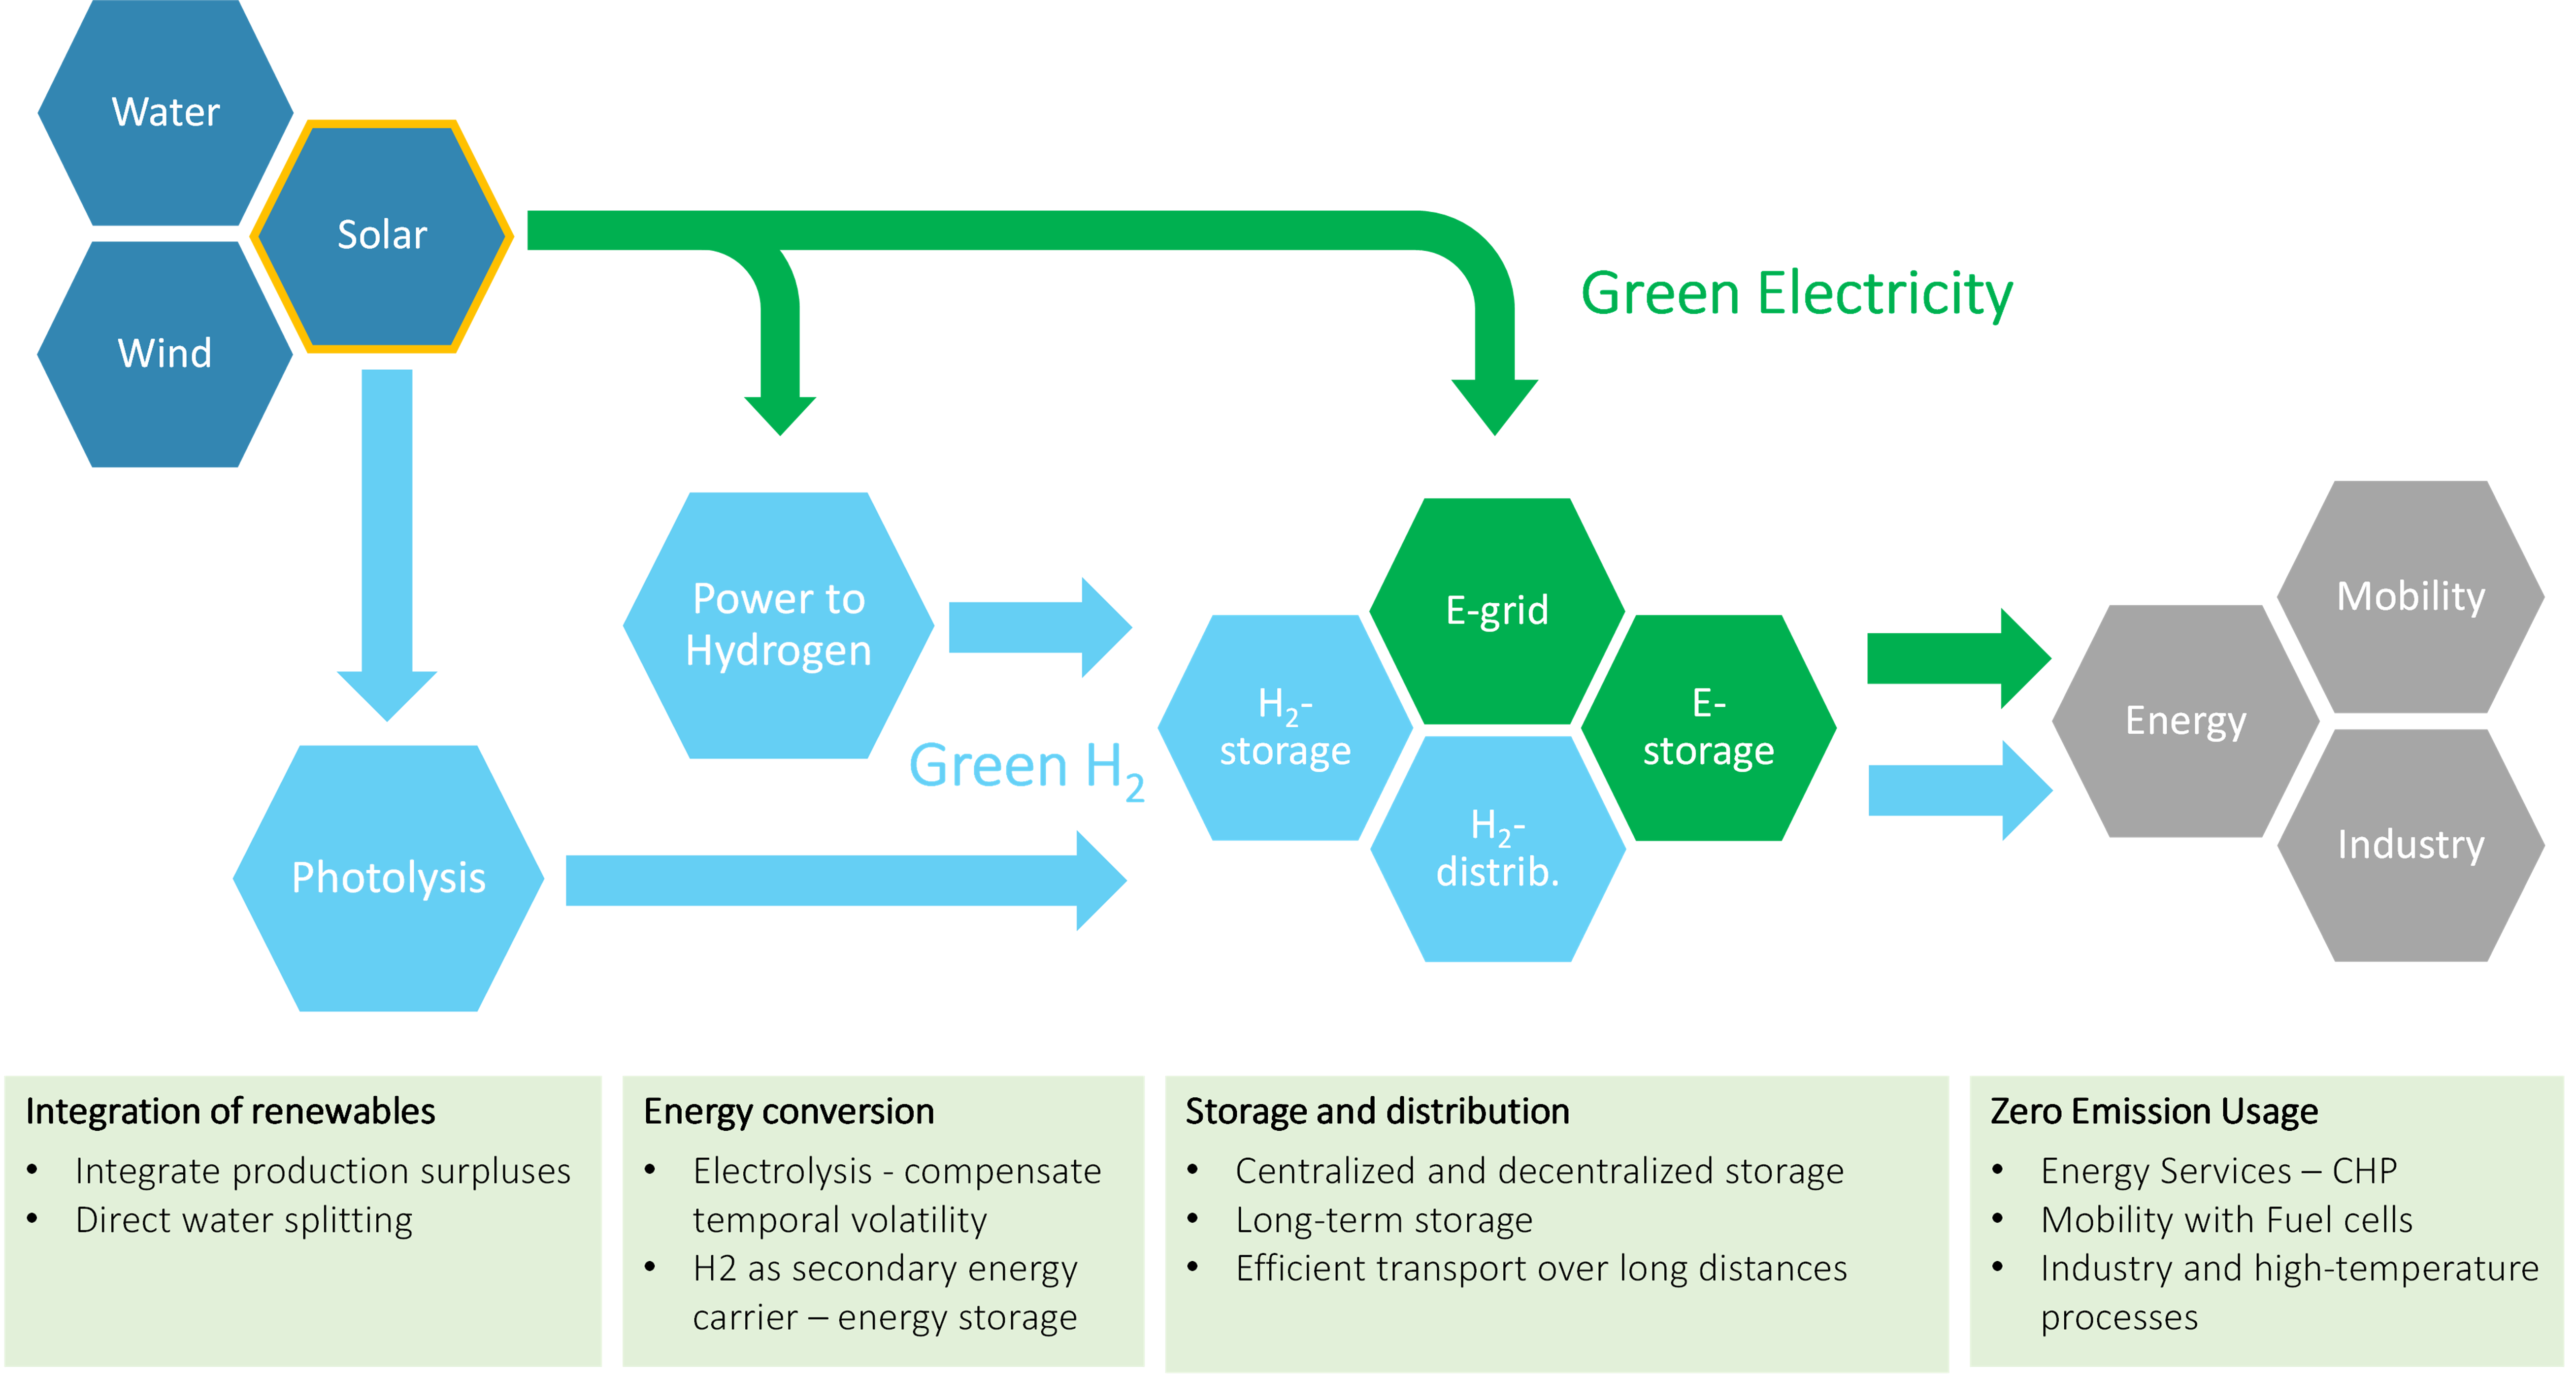
Vision of a sustainable hydrogen economy
Green electricity from wind, water and solar power should primarily be fed directly into the electricity grid. Surpluses can be converted into H2 using power-to-hydrogen processes, distributed via suitable transport routes and stored using storage technologies. Green electricity and H2 are then supplied to industry, mobility and households for use.
Copyright: HyCentA Research GmbH

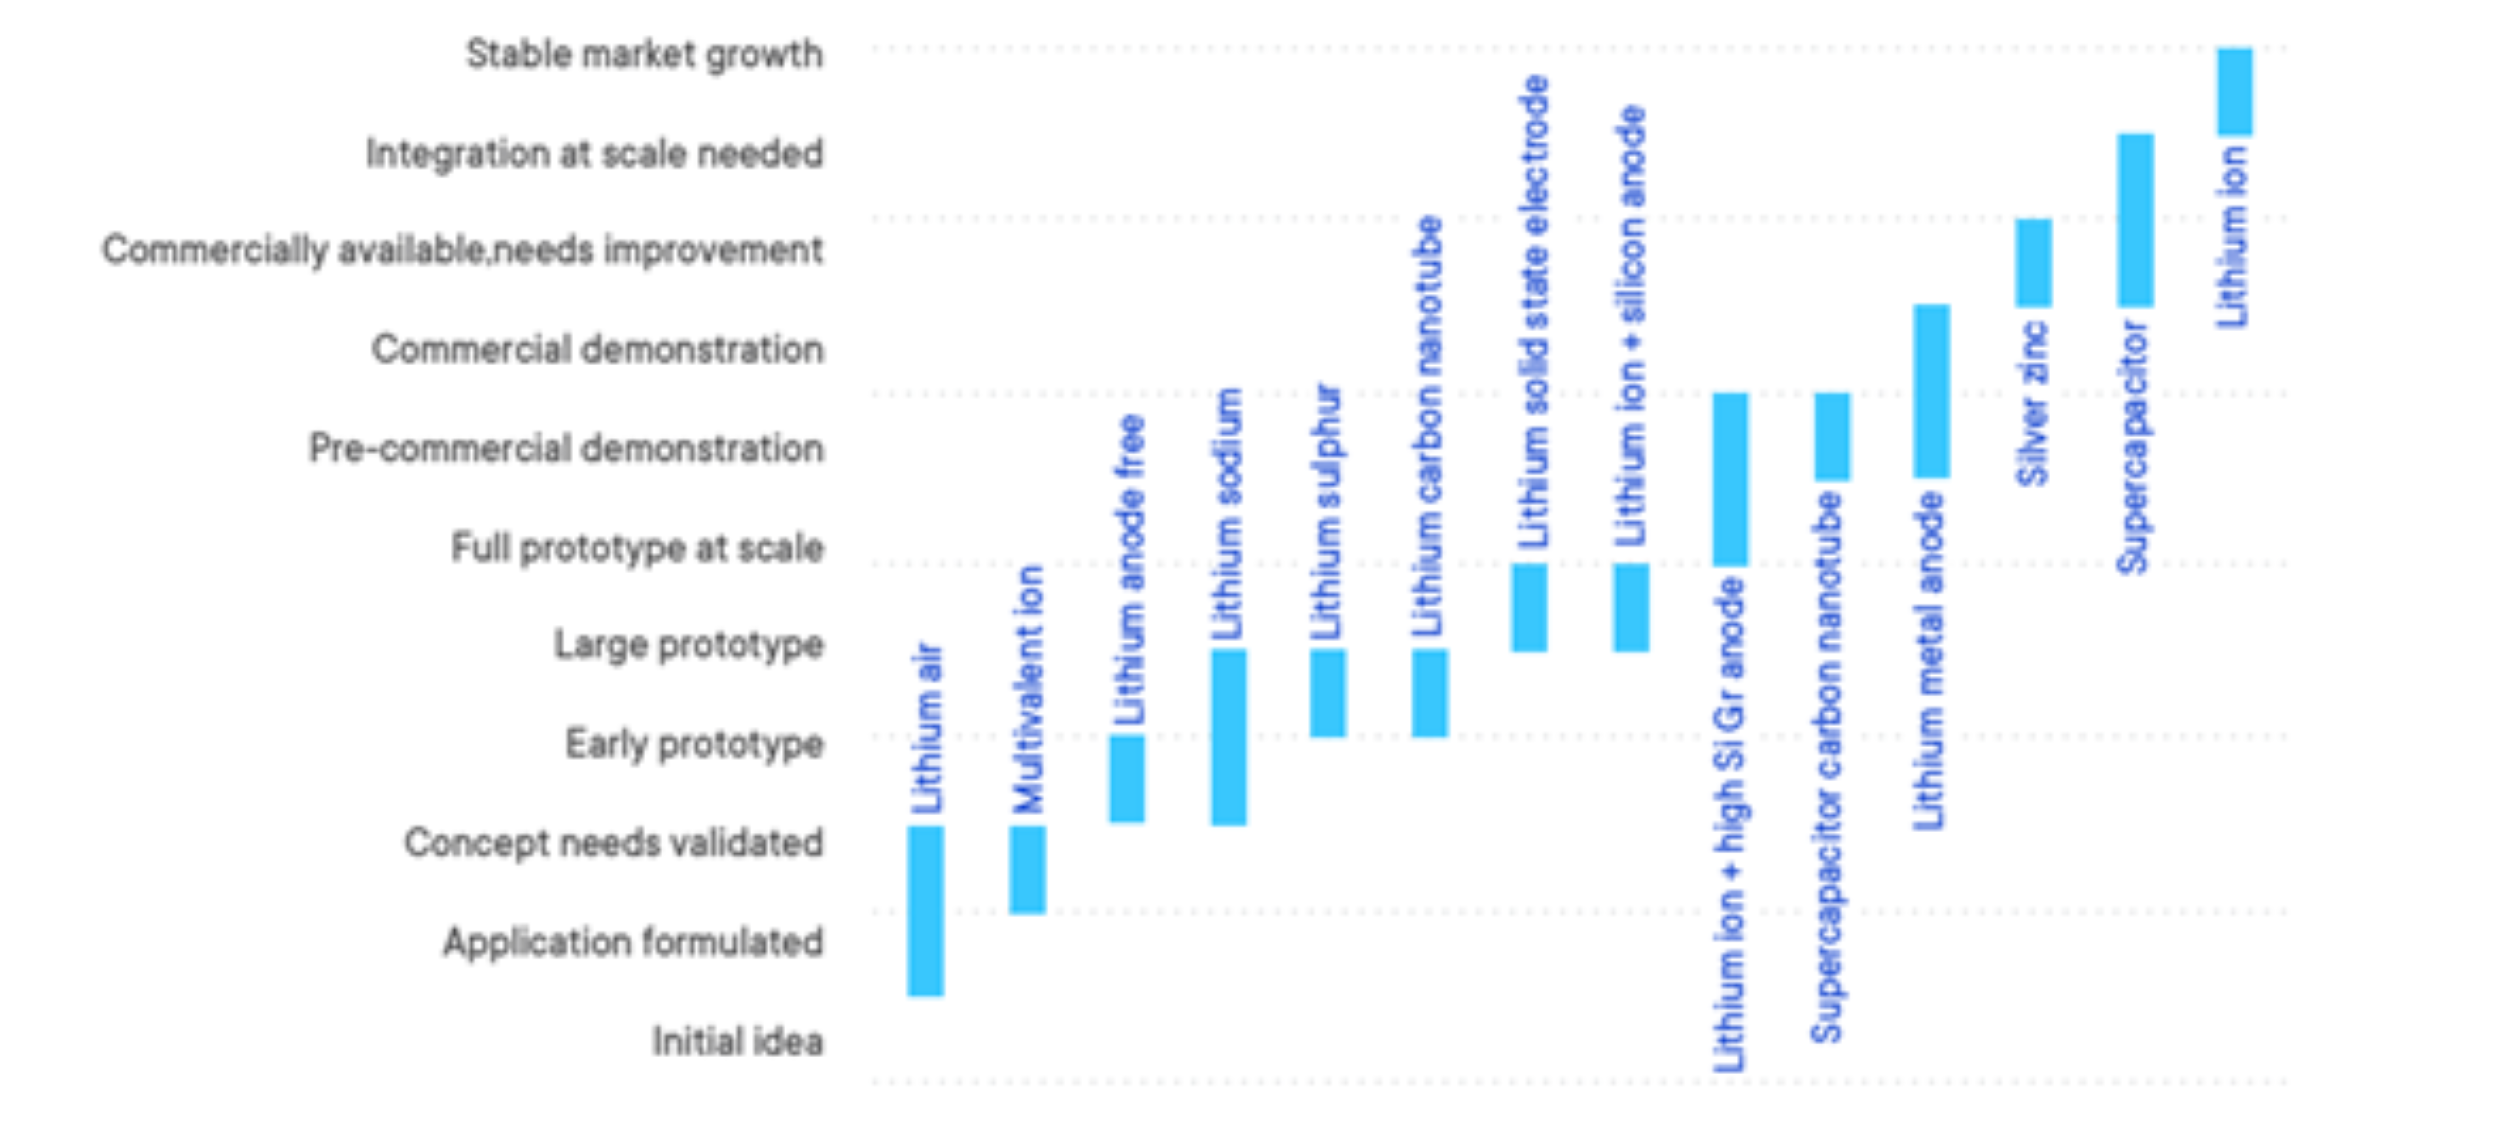
Stand of the different baterry technologies (IEA 4E EDNA Task on Batteries).
This graphic shows the state of the art of different battery technologies. 14 types are organized according to their state of development. 10 are lithium-based batteries, the other 4 use various chemistry compositions (Zinc or carbon nano-tubes), or use new concepts to increase their capacity.
Copyright: 4E EDNA
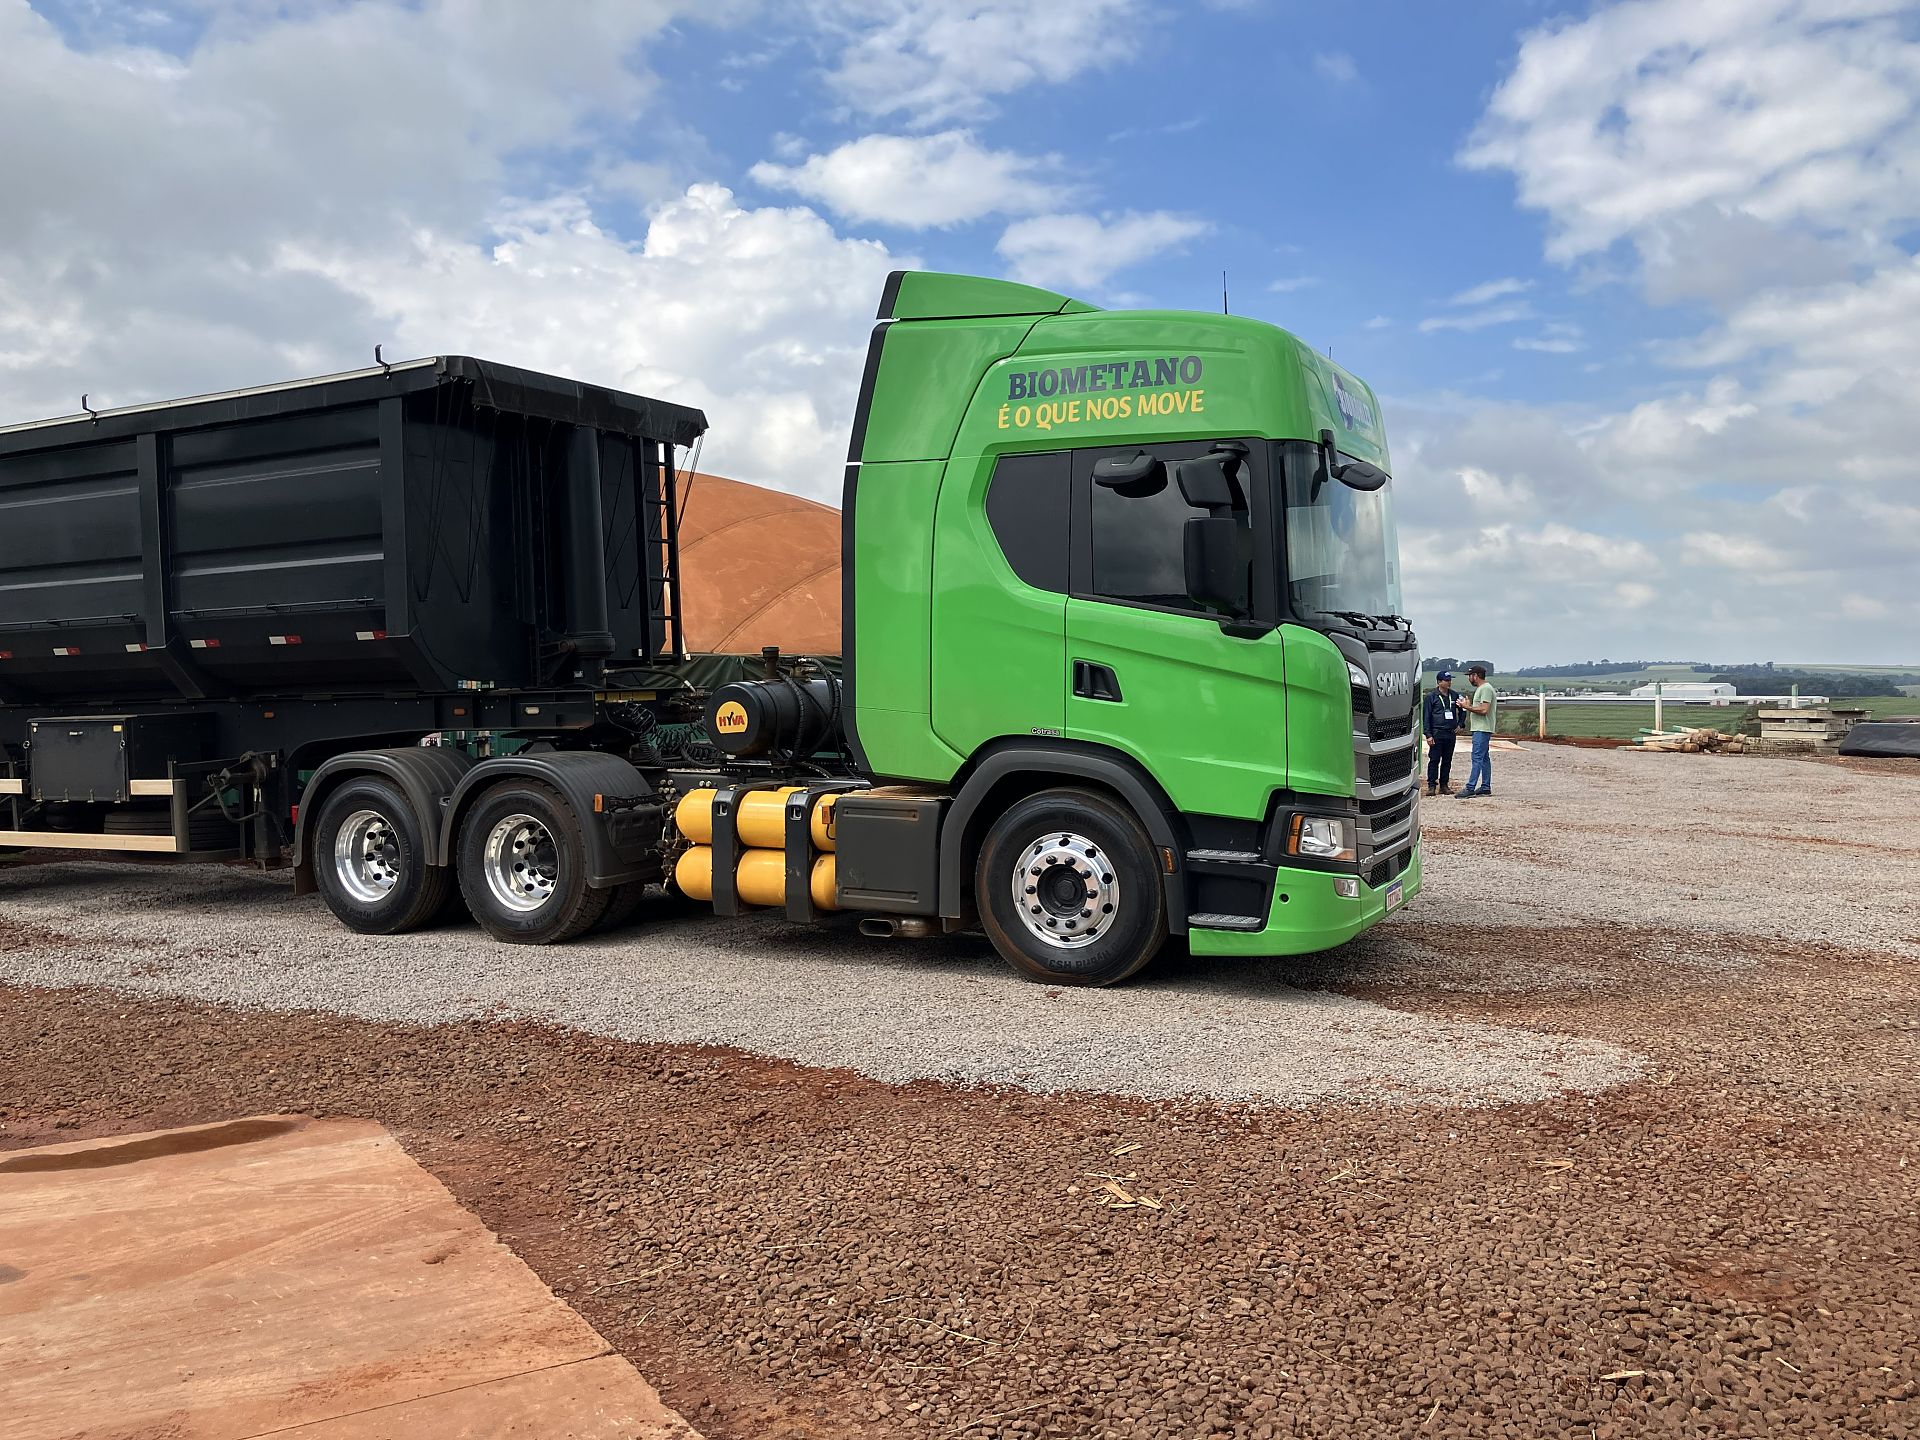
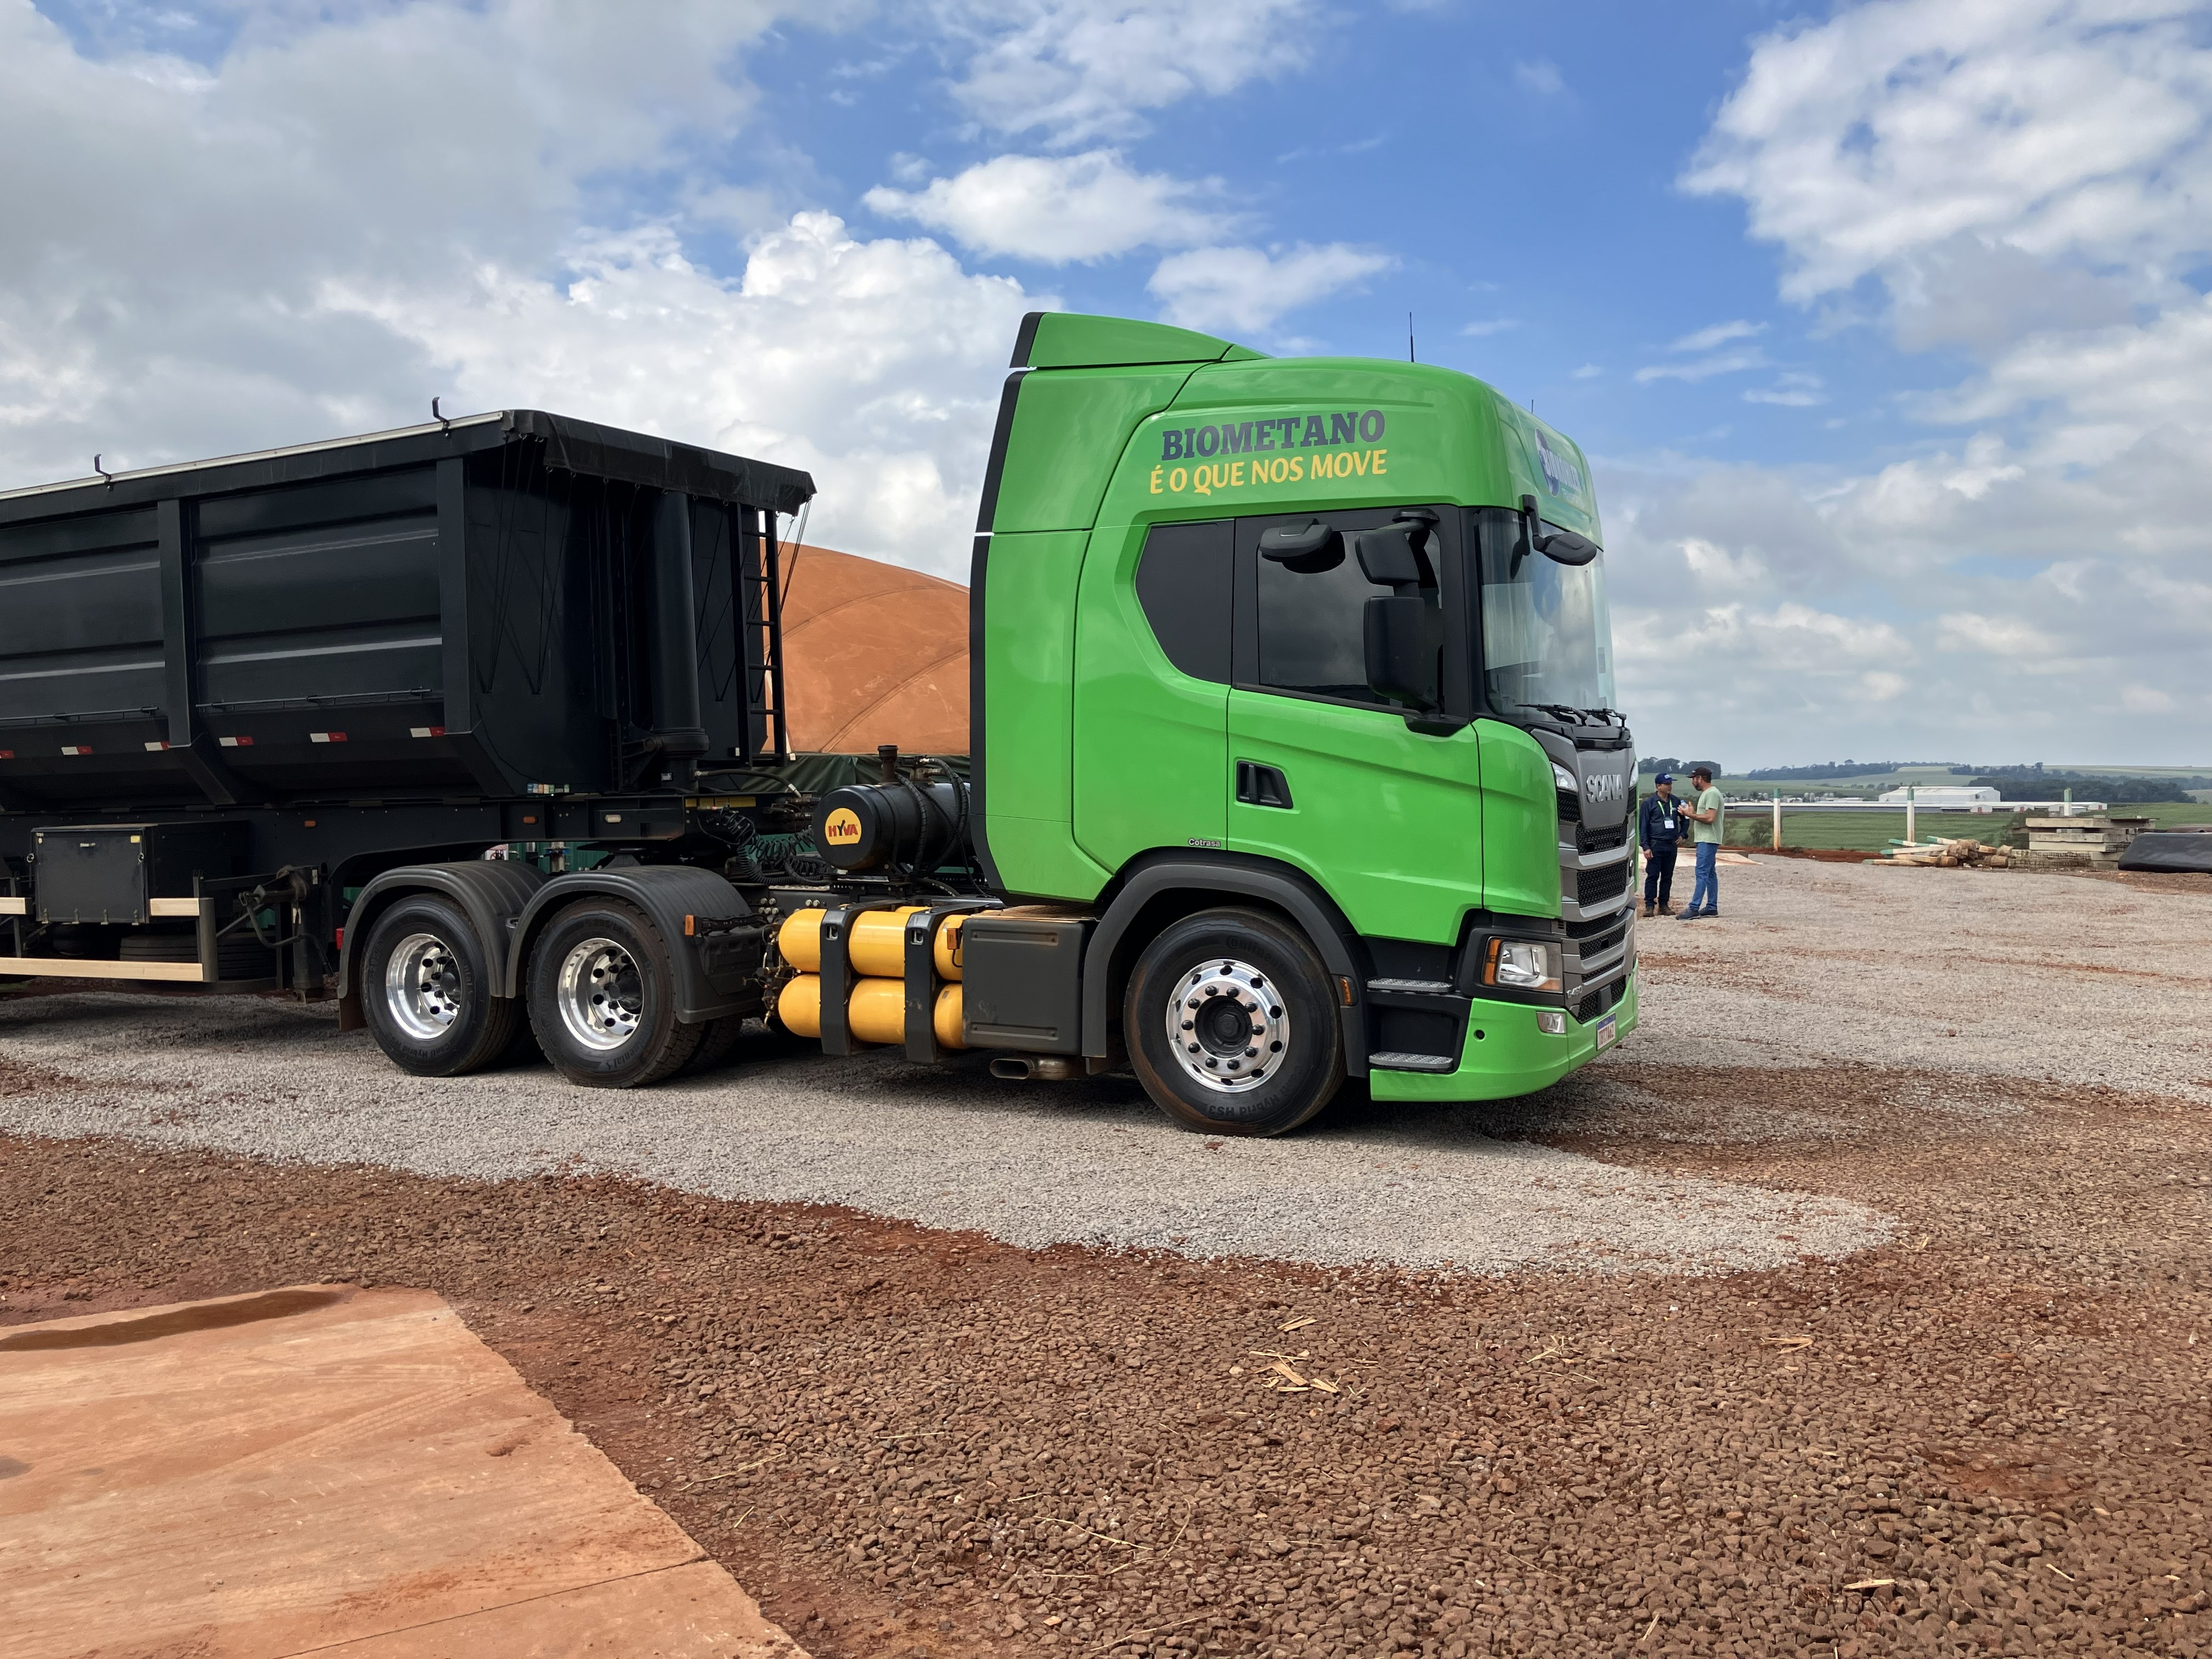
Biomethane Truck
Truck using biomethane as fuel in a Brazilian farm
Copyright: Bernhard Drosg

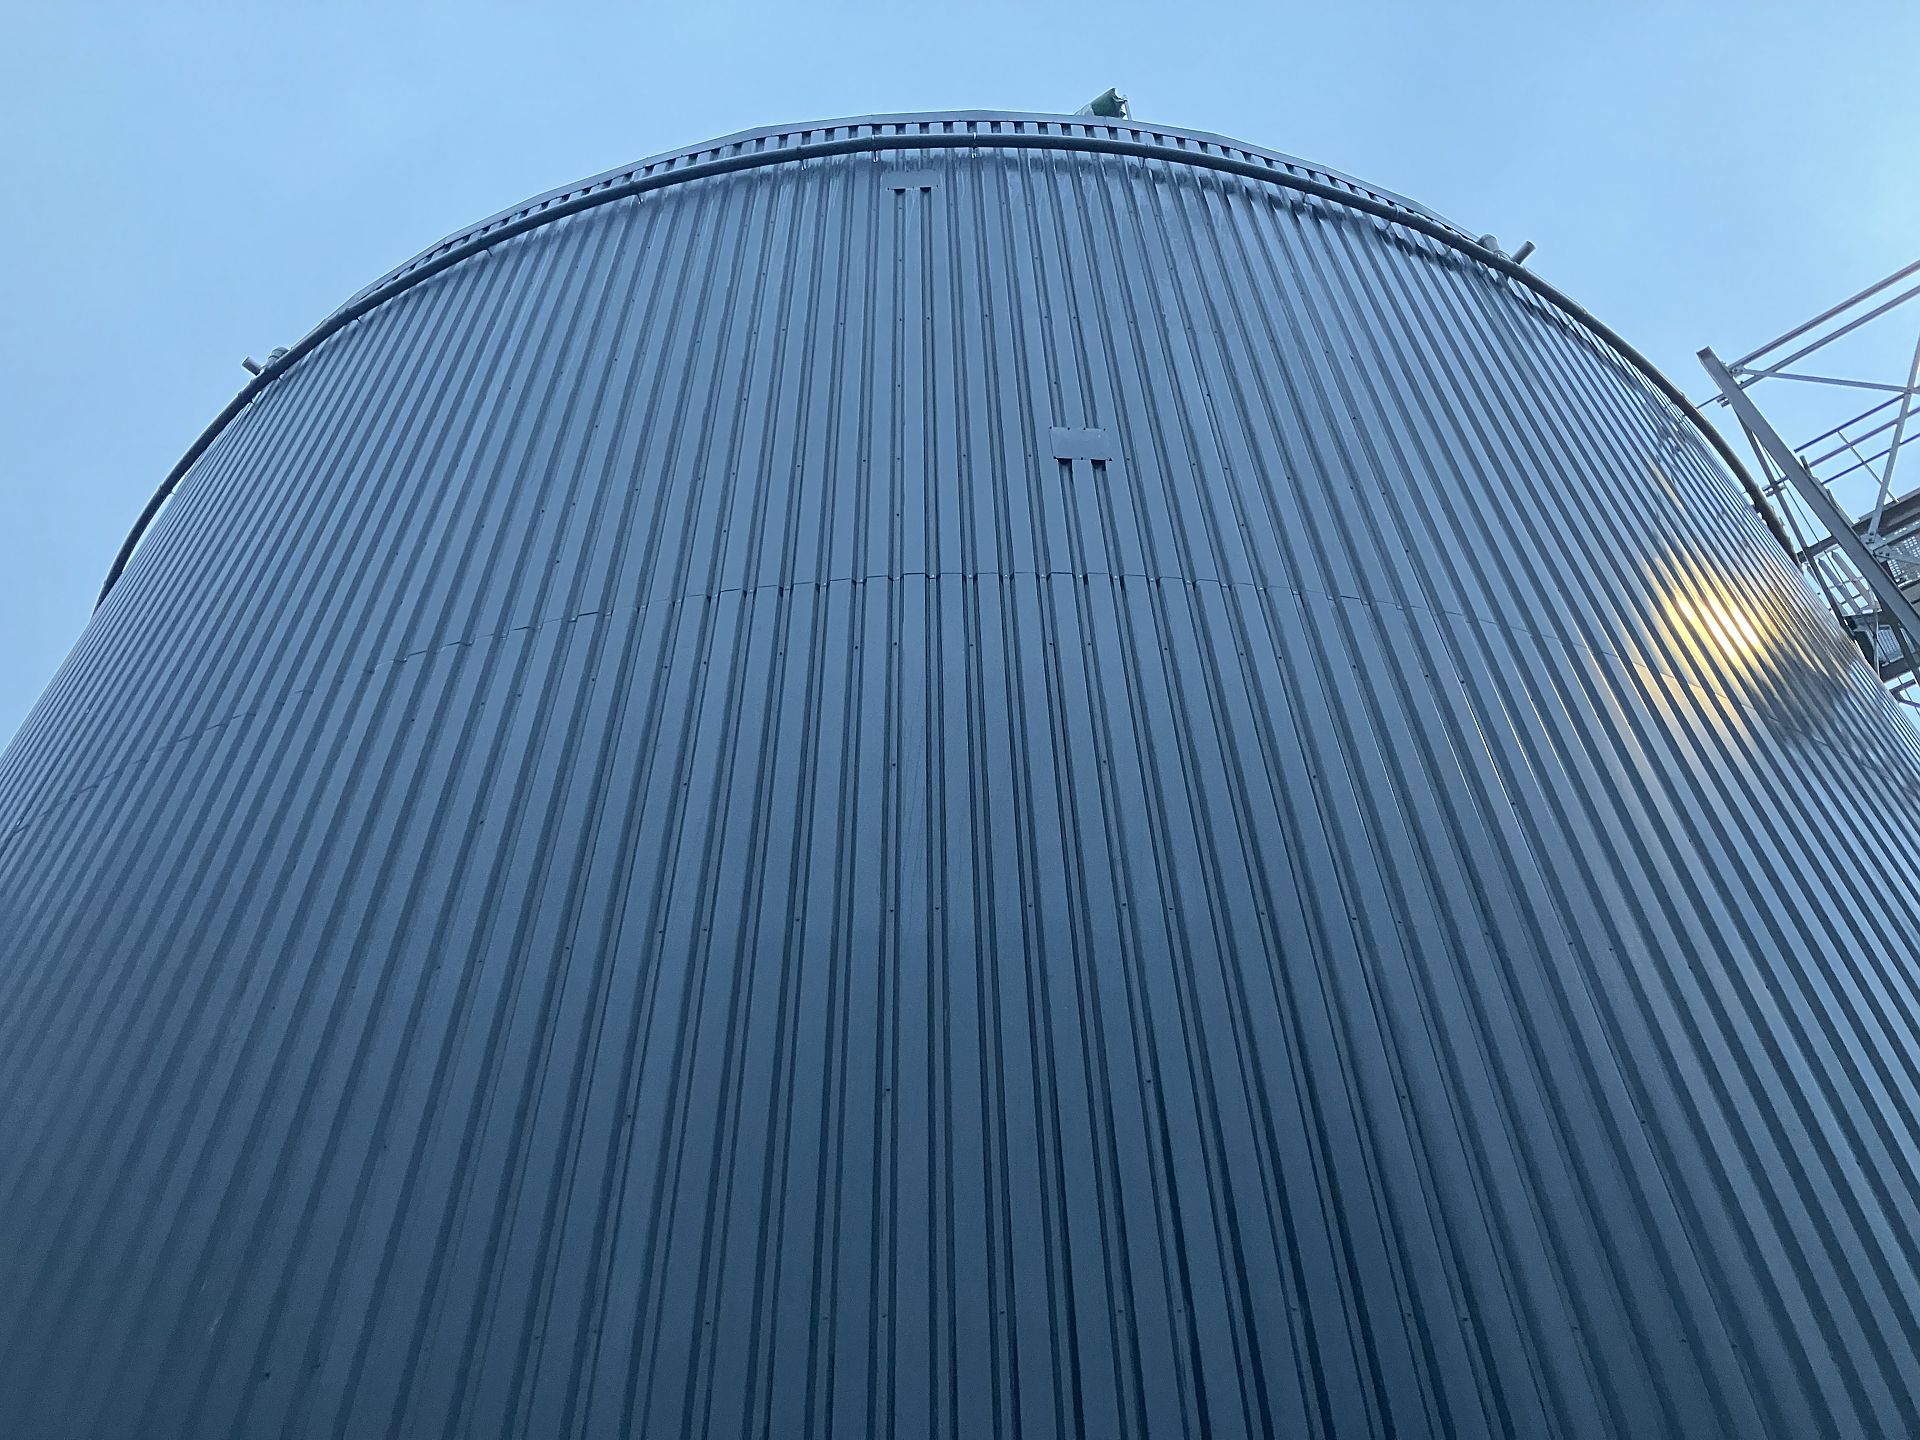
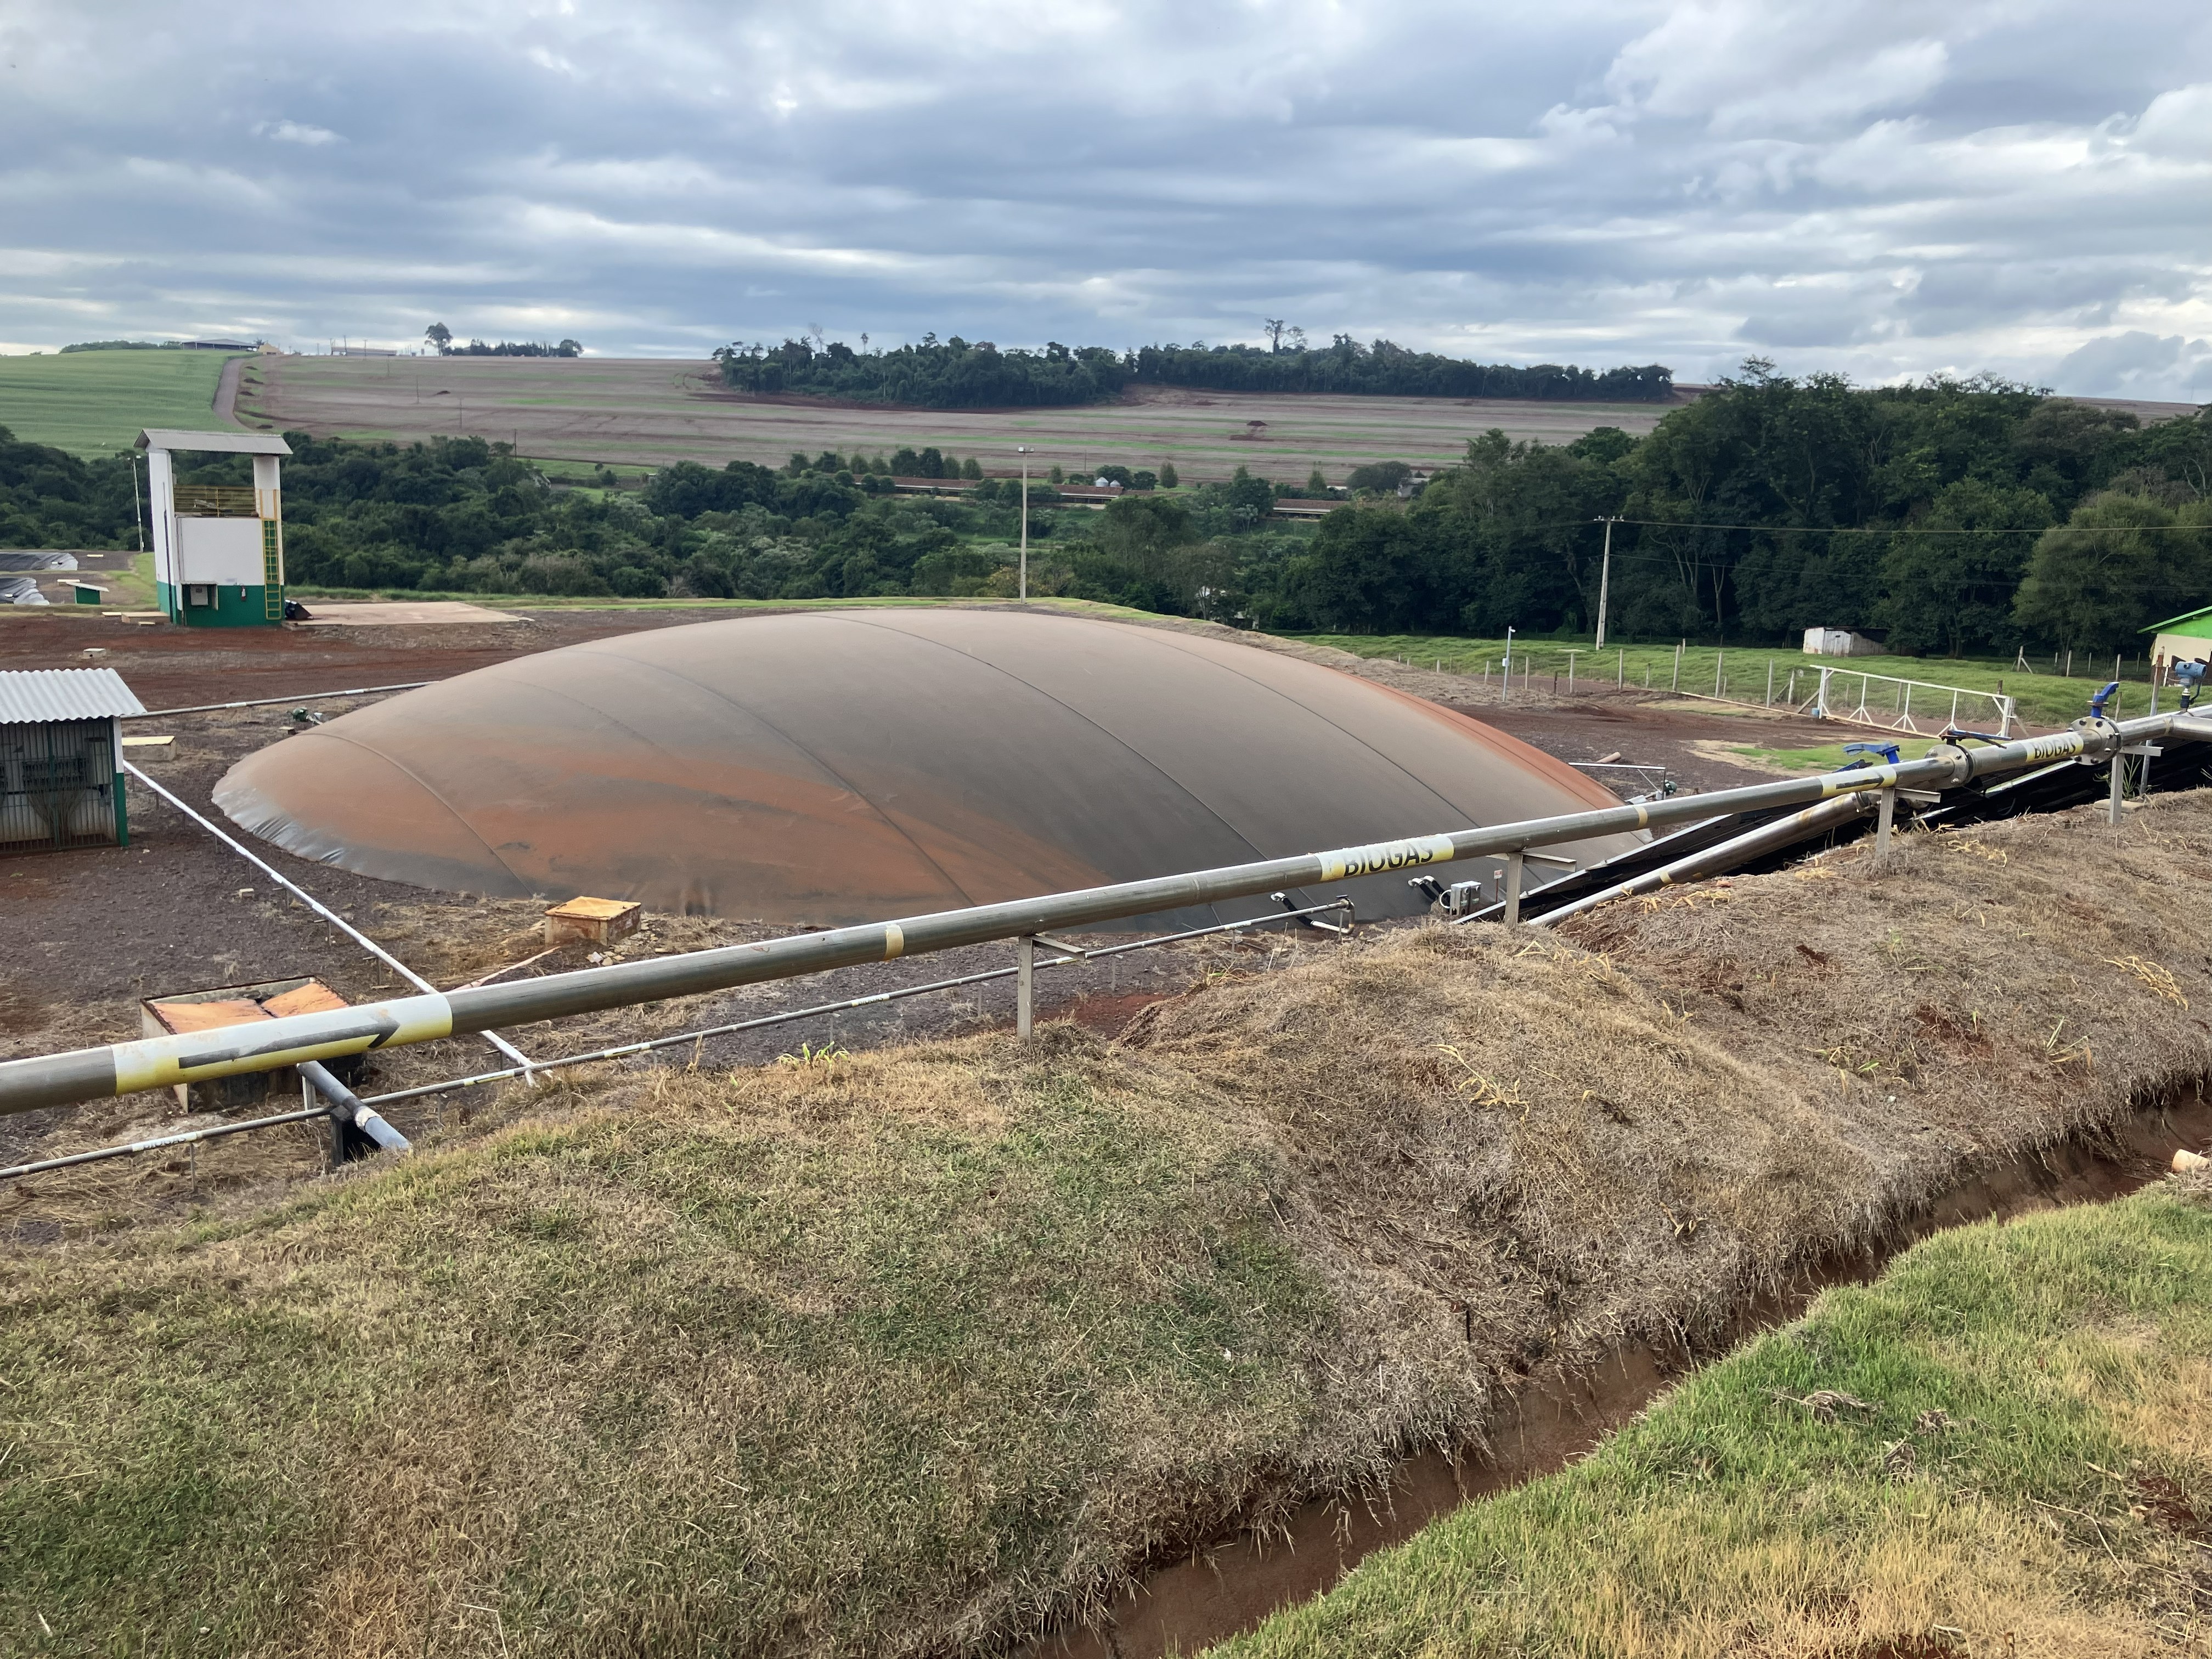
Lagoon-style biogas reactor
Biogas reactor as covered lagoon
Copyright: Bernhard Drosg
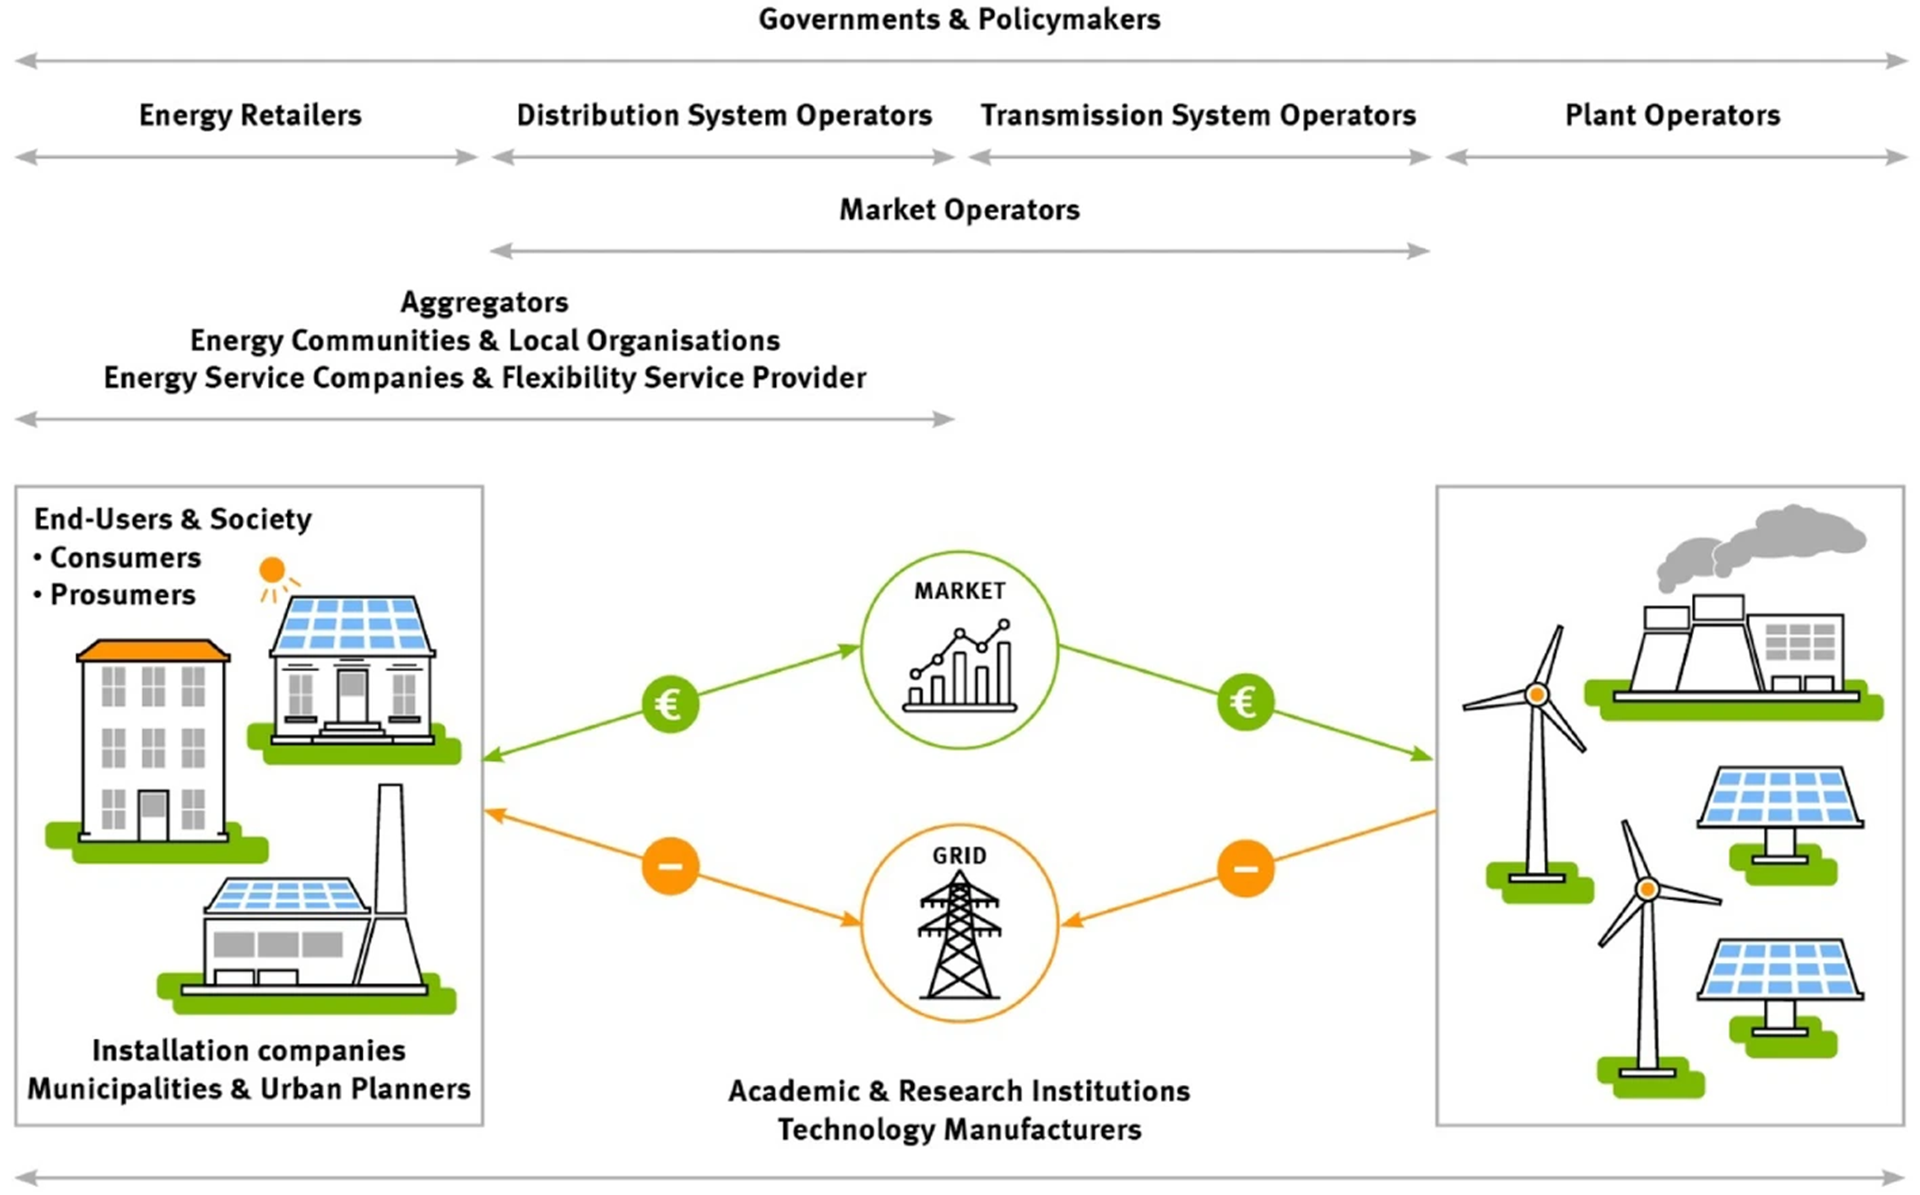
Stakeholder overview for decentralized building mass storage
Overview graphic of all stakeholders relevant for the active use of decentralized building masses as flexible energy storage.