Project Image Pool
There are 172 results.
Terms of use: The pictures on this site originate from the projects in the frame of the programmes City of Tomorrow, Building of Tomorrow and the IEA Research Cooperation. They may be used credited for non-commercial purposes under the Creative Commons License Attribution-NonCommercial (CC BY-NC).
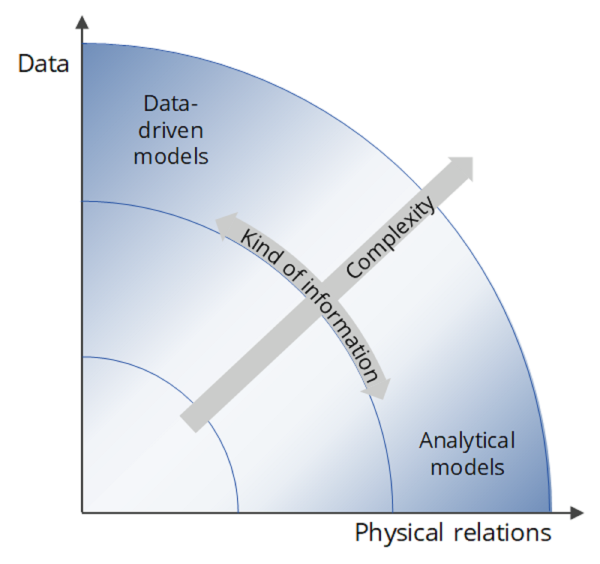
Models for IoT heat pumps
The graphic shows different types of models that are relevant for IoT heat pumps. Physical models are based on physical relationships, data-driven models are created using only data. Hybrid models are based on both data and physical relationships.
Copyright: Danish Technological Institute
Carbon supported PdNiBi catalysts
Carbon supported PdNiBi catalysts for the alkaline ethanol oxidation reaction (EOR).
Copyright: TU Graz
Participants of the Annex Meeting of 16 May 2017
The meeting on Annex 31 was held on 16 May in the rooms of the Institute of Chemical Engineering and Environmental Technology. Hideo Inoue, Alexander Dyck and Werner Lehnert gave technical presentations on the research activities at their respective facilities.
Copyright: TU Graz
Start-up und Shutdown of PEFCs
Most common low temperature (T<0 °C) start-up and shutdown strategies for polymer electrolyte fuel cells (according to literature study).
Copyright: TU Graz
Specific resistance towards proton conduction of Pt based fuel cell components
Specific resistance towards proton conduction at various degrees of relative humidity of Pt based catalysts (Pt/C and PtCu/C) and the corresponding membrane materials.
Copyright: TU Graz
AMF Task 63: National networking workshop
Audience at the national networking workshop "Sustainable aviation fuels for Austria"
Copyright: Doris Matschegg
AMF Task 63: Development of SAF in Austria
Scenario regarding the development of SAF in Austria until 2050
Copyright: Doris Matschegg
E-truck on country road
Electric Truck Prototype (26 to) during overland field test at Austrian Logistics company, member of Council of Sustainable Logistics.
Copyright: CNL/EVN/Vouillarmet 2021
TCO of the various drive technologies compared
Total cost of ownership (TCO) of Diesel, electric and FCEV trucks under different energy price assumptions. Use case: Retail in one-shift operation.
Copyright: CNL (2022)
DSM Interaction and acceptance model
This figure shows the DSM interaction and acceptance model developed within the project framework, the central trust-building interaction features as well as their changing relevance for the building of trust and acceptance depending on the automation level.
Copyright: AIT Austrian Institute of Technology GmbH
Business models
This figure gives an overview of the business models that were considered in the context of the project on various issues related to Demand Side Management (DSM). A more detailed description of the individual models can be found in the final report.
Copyright: AIT Austrian Institute of Technology GmbH
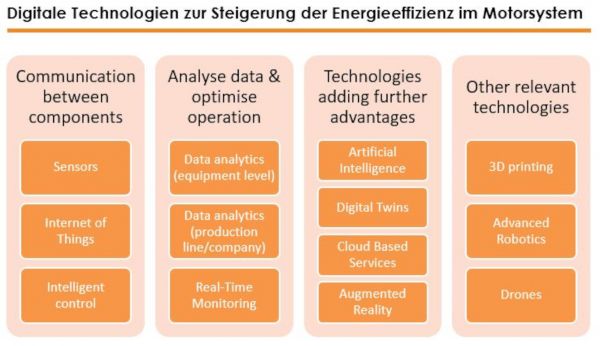
Digital Technologies to Increase the Energyefficiency in Electric Motor Systems
This figure gives an overview of the technologies that were identified as relevant for energy efficiency in electric motor systems in several workshops, in the survey and interviews. Starting on the left-hand side, technologies listed are smart sensors, advanced control on the level of machines and the Internet of things enabling communication between the different levels and components (in dark blue). Furthermore, the next level is the use of possibilities to analyse data and optimize operation (in green): data analytics on both the level of motor systems and on the level of production lines or even the whole company. Continuous monitoring of the different appliances is also significant. Technologies adding advantages to these applications (in grey) are digital twins, cloud-based services and artificial intelligence. Augmented reality can help to implement the suggested measures. Three technologies that are not directly related to the optimization of motor driven systems, but are of further interest include drones, 3D printing and advanced robotics.
Copyright: Österreichische Energieagentur, impact energy
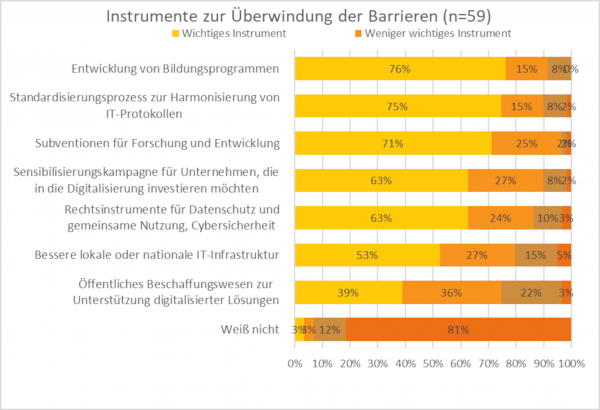
Important instruments to overcome barriers to using digital production technologies
Around three quarters of the respondents consider the development of education programmes and the standardisation process to harmonise protocols, as well as subsidies for research as important policy instruments to overcome these barriers.
Copyright: Österreichische Energieagentur
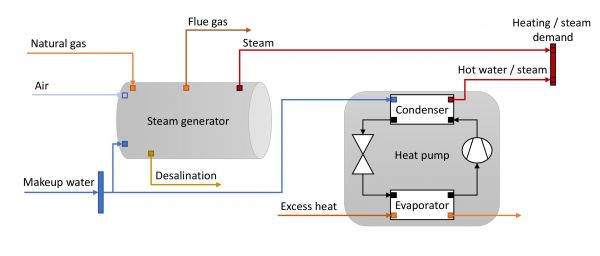
Steam boiler and Heat Pump
The figure shows energy flows in a system consisting of a steam generator and a heat pump for process steam and hot water supply.
Copyright: Austrian Institute of Technology GmbH
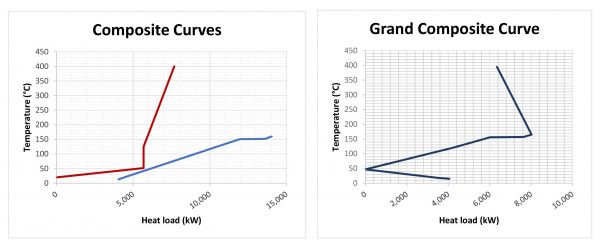
Composite Curves for an Example Case
The figure shows Composite Curves from Pinch Analysis for an Example Case that was evaluated within the project.
Copyright: Austrian Institute of Technology GmbH
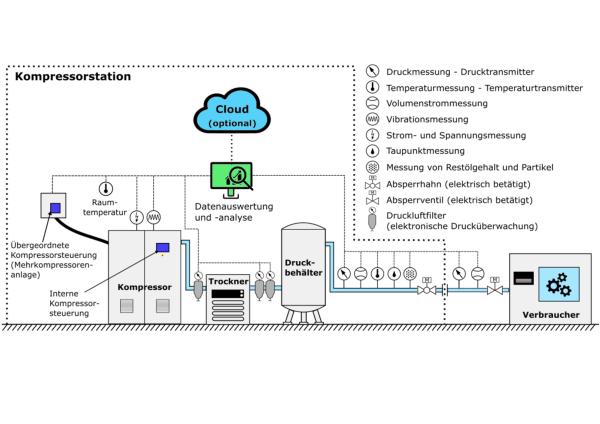
Overview of possible measuring points for the digitalization of compressed air systems
The diagram shows a compressor in the form of a larger square. Virbration measurement and current and voltage measurement are added here as small circles. There is a small rectangle on the square with the note: Internal compressor control. There is also a thick connection to another rectangle for higher-level control. Nearby is a small circle for the room temperature. A line comes out of the compressor to a compressed air filter with electronic pressure monitoring and on to a larger rectangle, the dryer. After two more compressed air filters, the line runs to the pressure tank, a larger oval with three feet. The line continues out of the pressure tank. The small circles with the designations for pressure measurement, volume flow measurement, temperature measurement, wobble point measurement and measurement for residual oil content and particles are then shown here one after the other, and an electrically operated stopcock is also drawn in. A dotted line in the form of a rectangle is drawn around these components for the compressor station. The pipe runs further out of this rectangle. Pressure measurement and volume flow measurement as well as an electrically operated shut-off valve are also drawn. At the end of the line, another rectangle is drawn with the label: Consumer. Within the dotted rectangle above the components mentioned are two symbols, one in the form of a computer screen labeled: Data evaluation and analysis, above it a blue cloud labeled: Cloud (optional). All the measurements mentioned are connected to the data evaluation via a dotted line.
Copyright: Österreichische Energieagentur
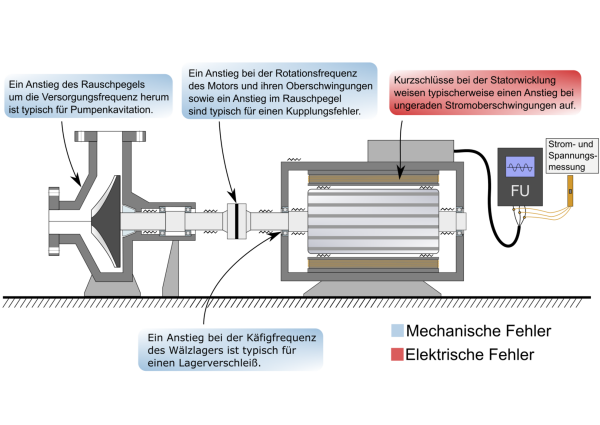
Options for detecting pump and motor malfunctions through current and voltage analysis
This diagram shows the cross-section of a radial pump on the left. This is connected via an axle to a coupling with the cross-section of an electric motor. This motor has a connection to a rectangle labeled FU for frequency converter, the thicker connection splits into three lines just before it, representing three phases. Three differently colored lines are drawn on these lines with small circles, which represent the three-phase current and voltage measurement and lead to a small upright rectangle. On the far right of the pump is a field with text that points to the pump cross-section with an arrow. The text states the following: An increase in the noise level around the supply frequency is typical of pump cavitation. Another field points to the coupling between pump and motor, a small rectangle as a connection between pump and motor axis. The text reads: An increase in the rotation frequency of the motor and its harmonics as well as an increase in the noise level are typical of a coupling fault. Another field points to the point where the motor axle comes out of the motor housing, where a bearing is marked. The text in this field reads: An increase in the cage frequency of the rolling bearing is typical of bearing wear. The text fields mentioned so far are highlighted in blue. This color indicates mechanical faults. Another field with a red background indicates the inside of the electric motor. The text reads: Short circuits in the stator winding typically show an increase in odd current harmonics. The red color indicates an electrical fault.
Copyright: Österreichische Energieagentur
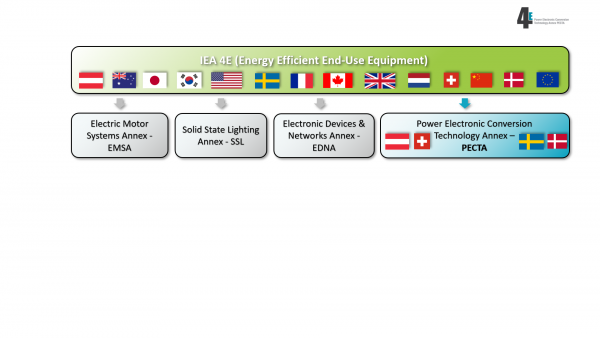
Integration of PECTA within the 4E technology program
Since March 2019, the 4E Technology Program consists of 4 different Annexes: EMSA (Electric Motor Systems Annex), SSL (Solid State Lighting Annex), EDNA (Electronic Devices & Networks Annex) and PECTA (Power Electronic Conversion Technology Annex).
Copyright: 4E PECTA
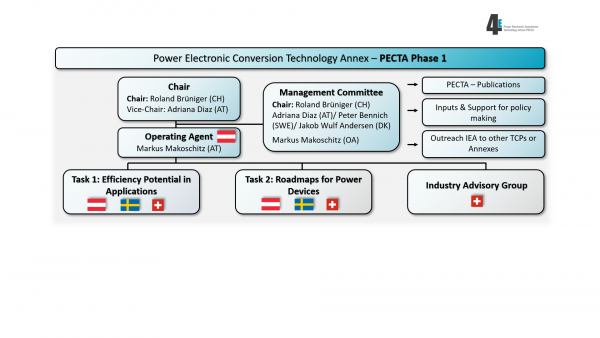
Structure of PECTA during Phase 1
In the course of PECTA's Phase 1, two tasks were processed. Task 1: Efficiency Potential in Applications. Task 2: Roadmaps for Power Devices. The position of the Operating Agent was filled by Austria. Task 1 and Task 2 were carried out with participation from Austria, Sweden and Switzerland. The Industry Advisory Group is coordinated by Switzerland.
Copyright: 4E PECTA
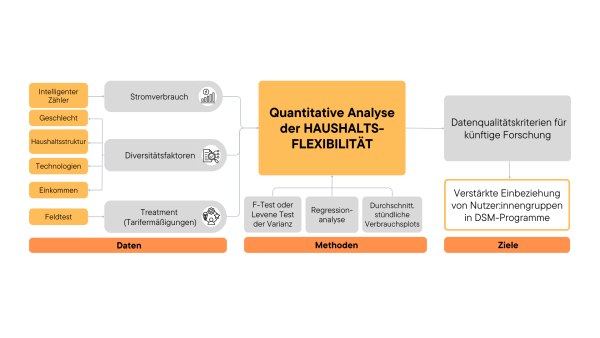
Analysis of Gender and Diversity Factors in Relation to Energy Consumption Flexibility
The graphic provides an overview of the approach to the quantitative analysis of household flexibility and the conclusions derived from it. Electricity consumption, recorded via smart meters, was combined with diversity dimensions and associated aspects such as gender, household structure, income, and available technologies. Treatments implemented during field tests, such as tariff reductions for peak load reductions, were documented in the dataset. Quantitative methods, including F-tests or Levene's test for variance, regression analysis, and plots of average consumption, were used to gain insights into consumption patterns and identify diversity-specific differences. Building on these findings, data quality criteria for future research were formulated, and a stronger inclusion of diverse user groups in demand-side management (DSM) programs was recommended.

