Project Image Pool
There are 413 results.
Terms of use: The pictures on this site originate from the projects in the frame of the programmes City of Tomorrow, Building of Tomorrow and the IEA Research Cooperation. They may be used credited for non-commercial purposes under the Creative Commons License Attribution-NonCommercial (CC BY-NC).
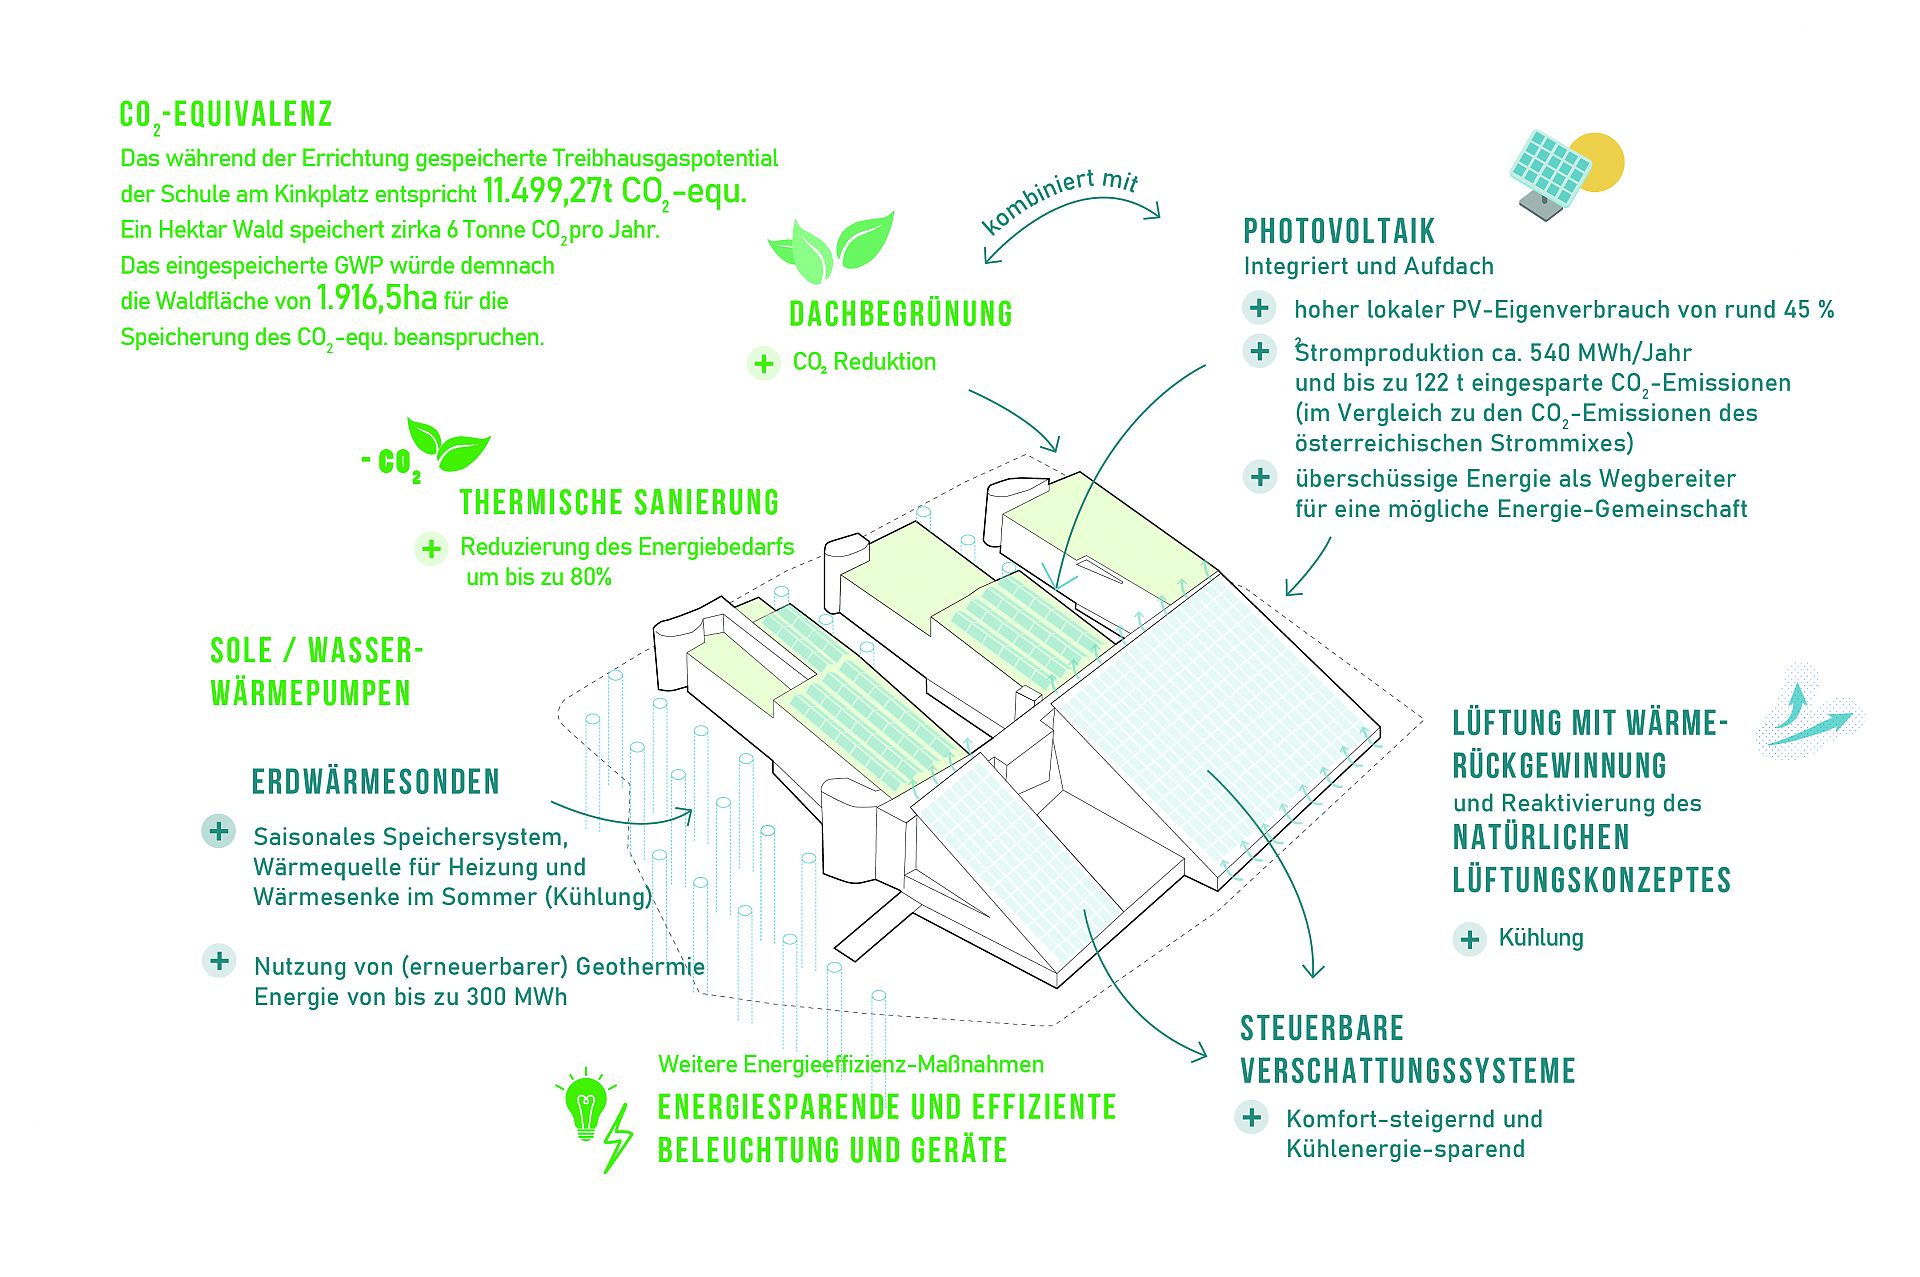
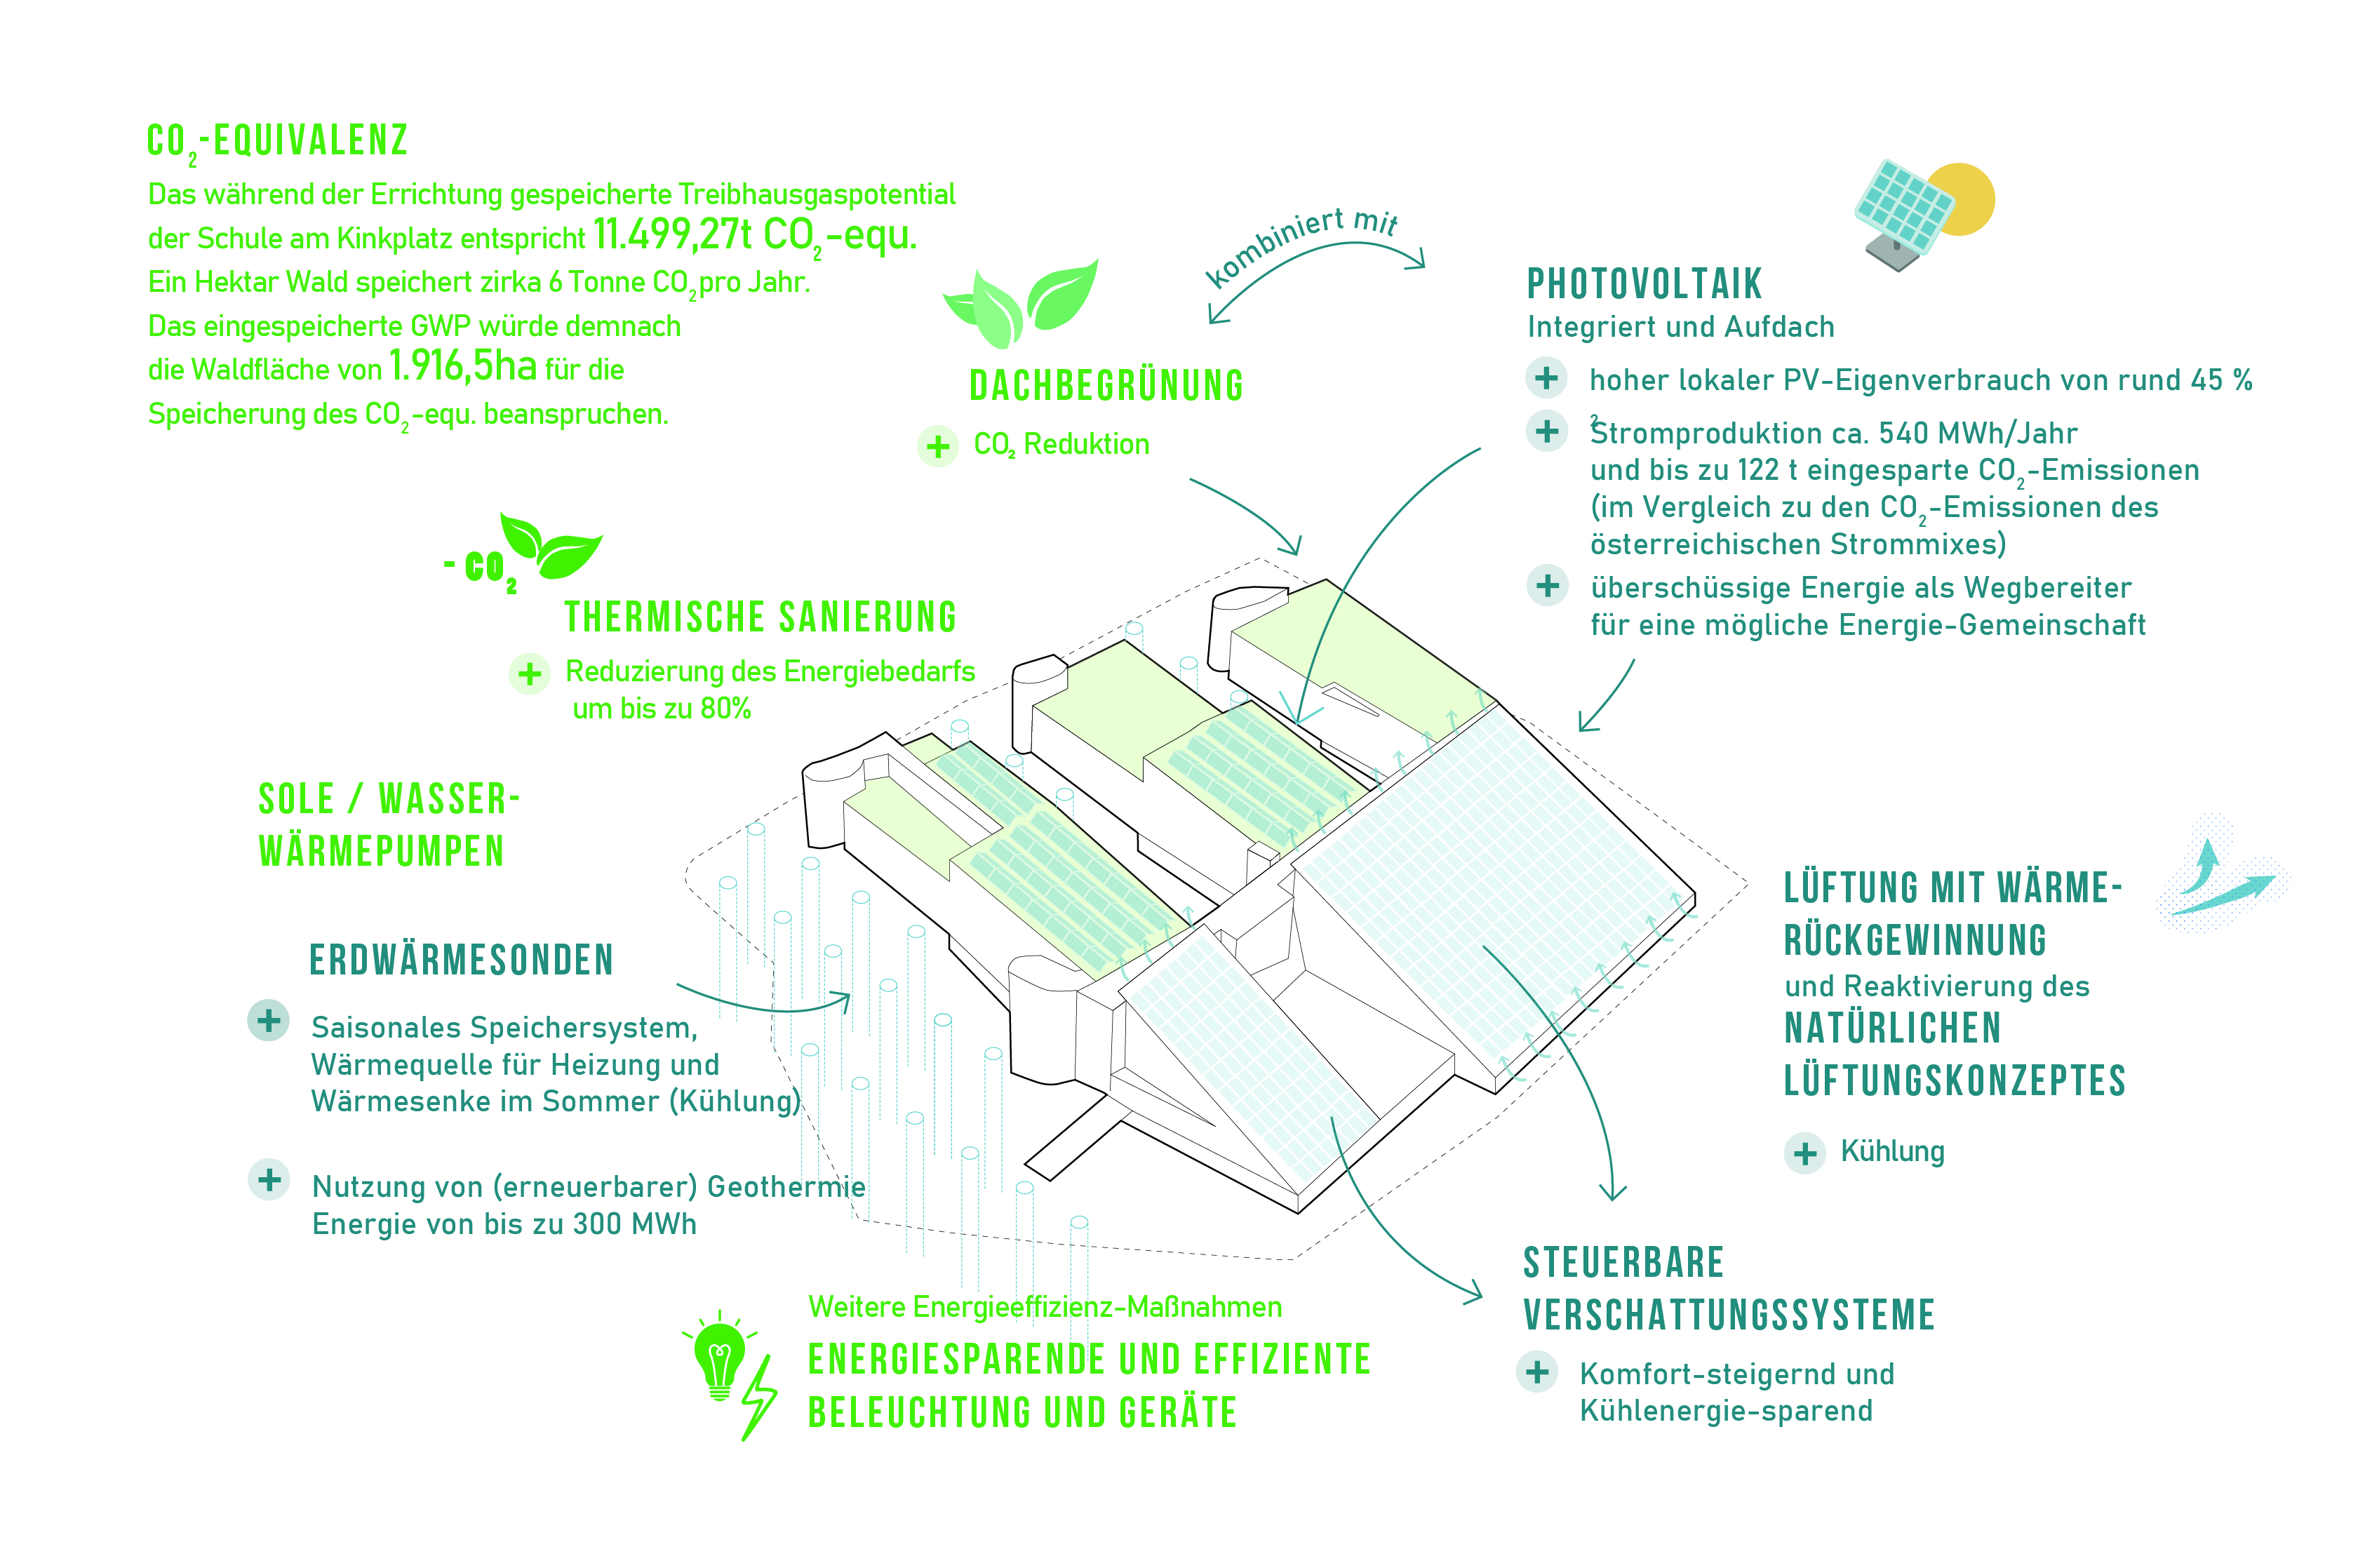
Benefits of energy-efficient refurbishment using the example of the school at Kinkplatz
The transferability of the project helps to accelerate the renovation wave and focuses particularly on difficult buildings with high energy consumption. The strategies and findings from GreenTech-Renovation can be transferred to all buildings dating from the last 70 years with high proportions of glass and with intelligent adaptations even further.
Copyright: GreenTech-Renovation Konsortium
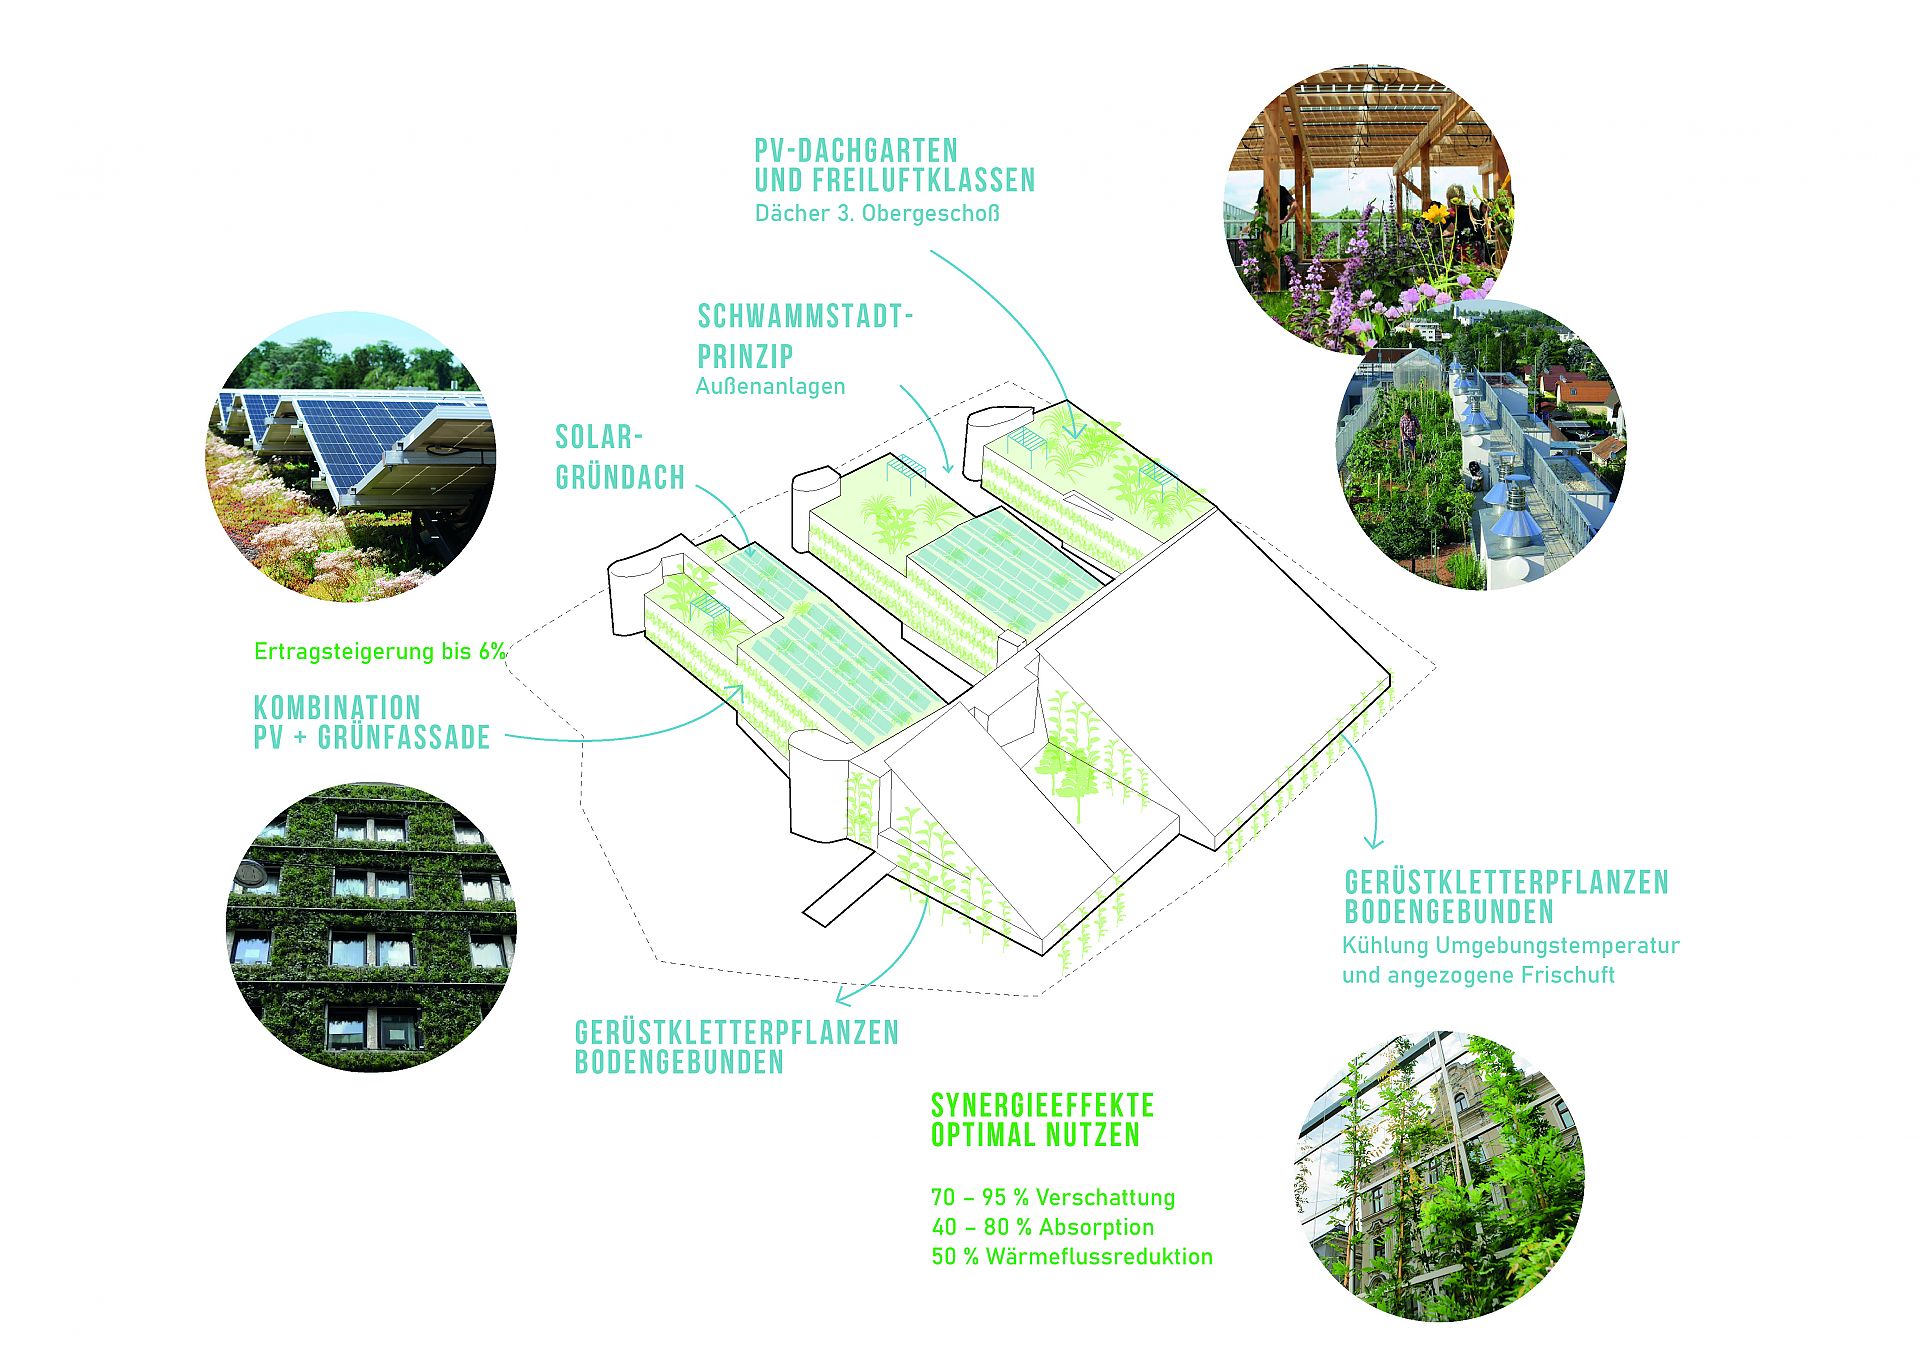
Greening concept of the School at Kinkplatz
In addition to the climate and energy concept and the utilisation concept, effective synergies are created with greening measures on the façade, on the roof and in the interior. With innovative and coordinated integration of vegetation, the performance potential of building optimisation and energy measures can be increased.
Copyright: GreenTech-Renovation Konsortium

Vertical farming concept for the School at Kinkplatz
During the exploratory project, the idea arose to use the school at Kinkplatz as a training centre for future urban farmers or vertical farmers. Special significance is attributed to the possibility of seeing food production as a central component of an overarching typological further development of the existing building as a training centre for urban vertical farming. This gives the school at Kinkplatz a unique selling point worldwide.
Copyright: vertical farm institute
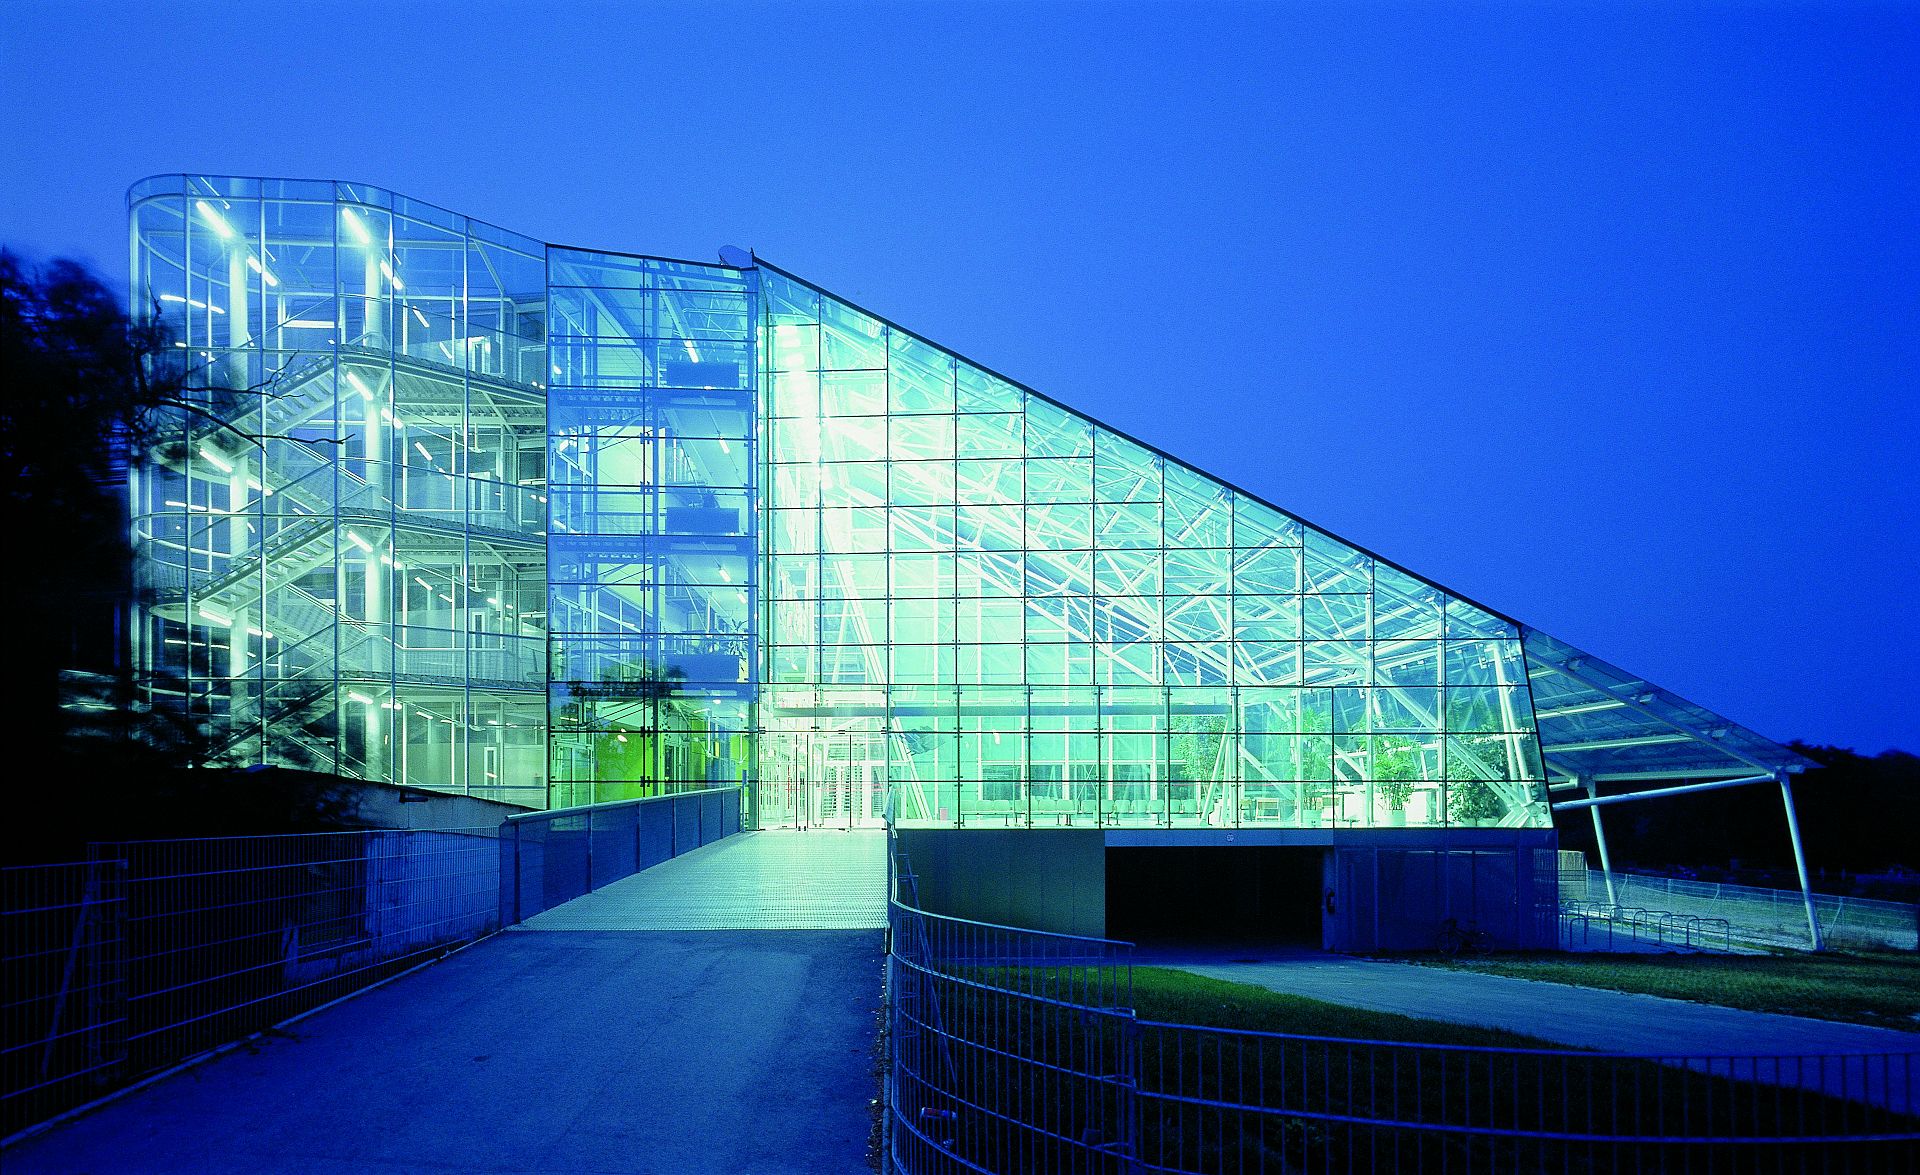
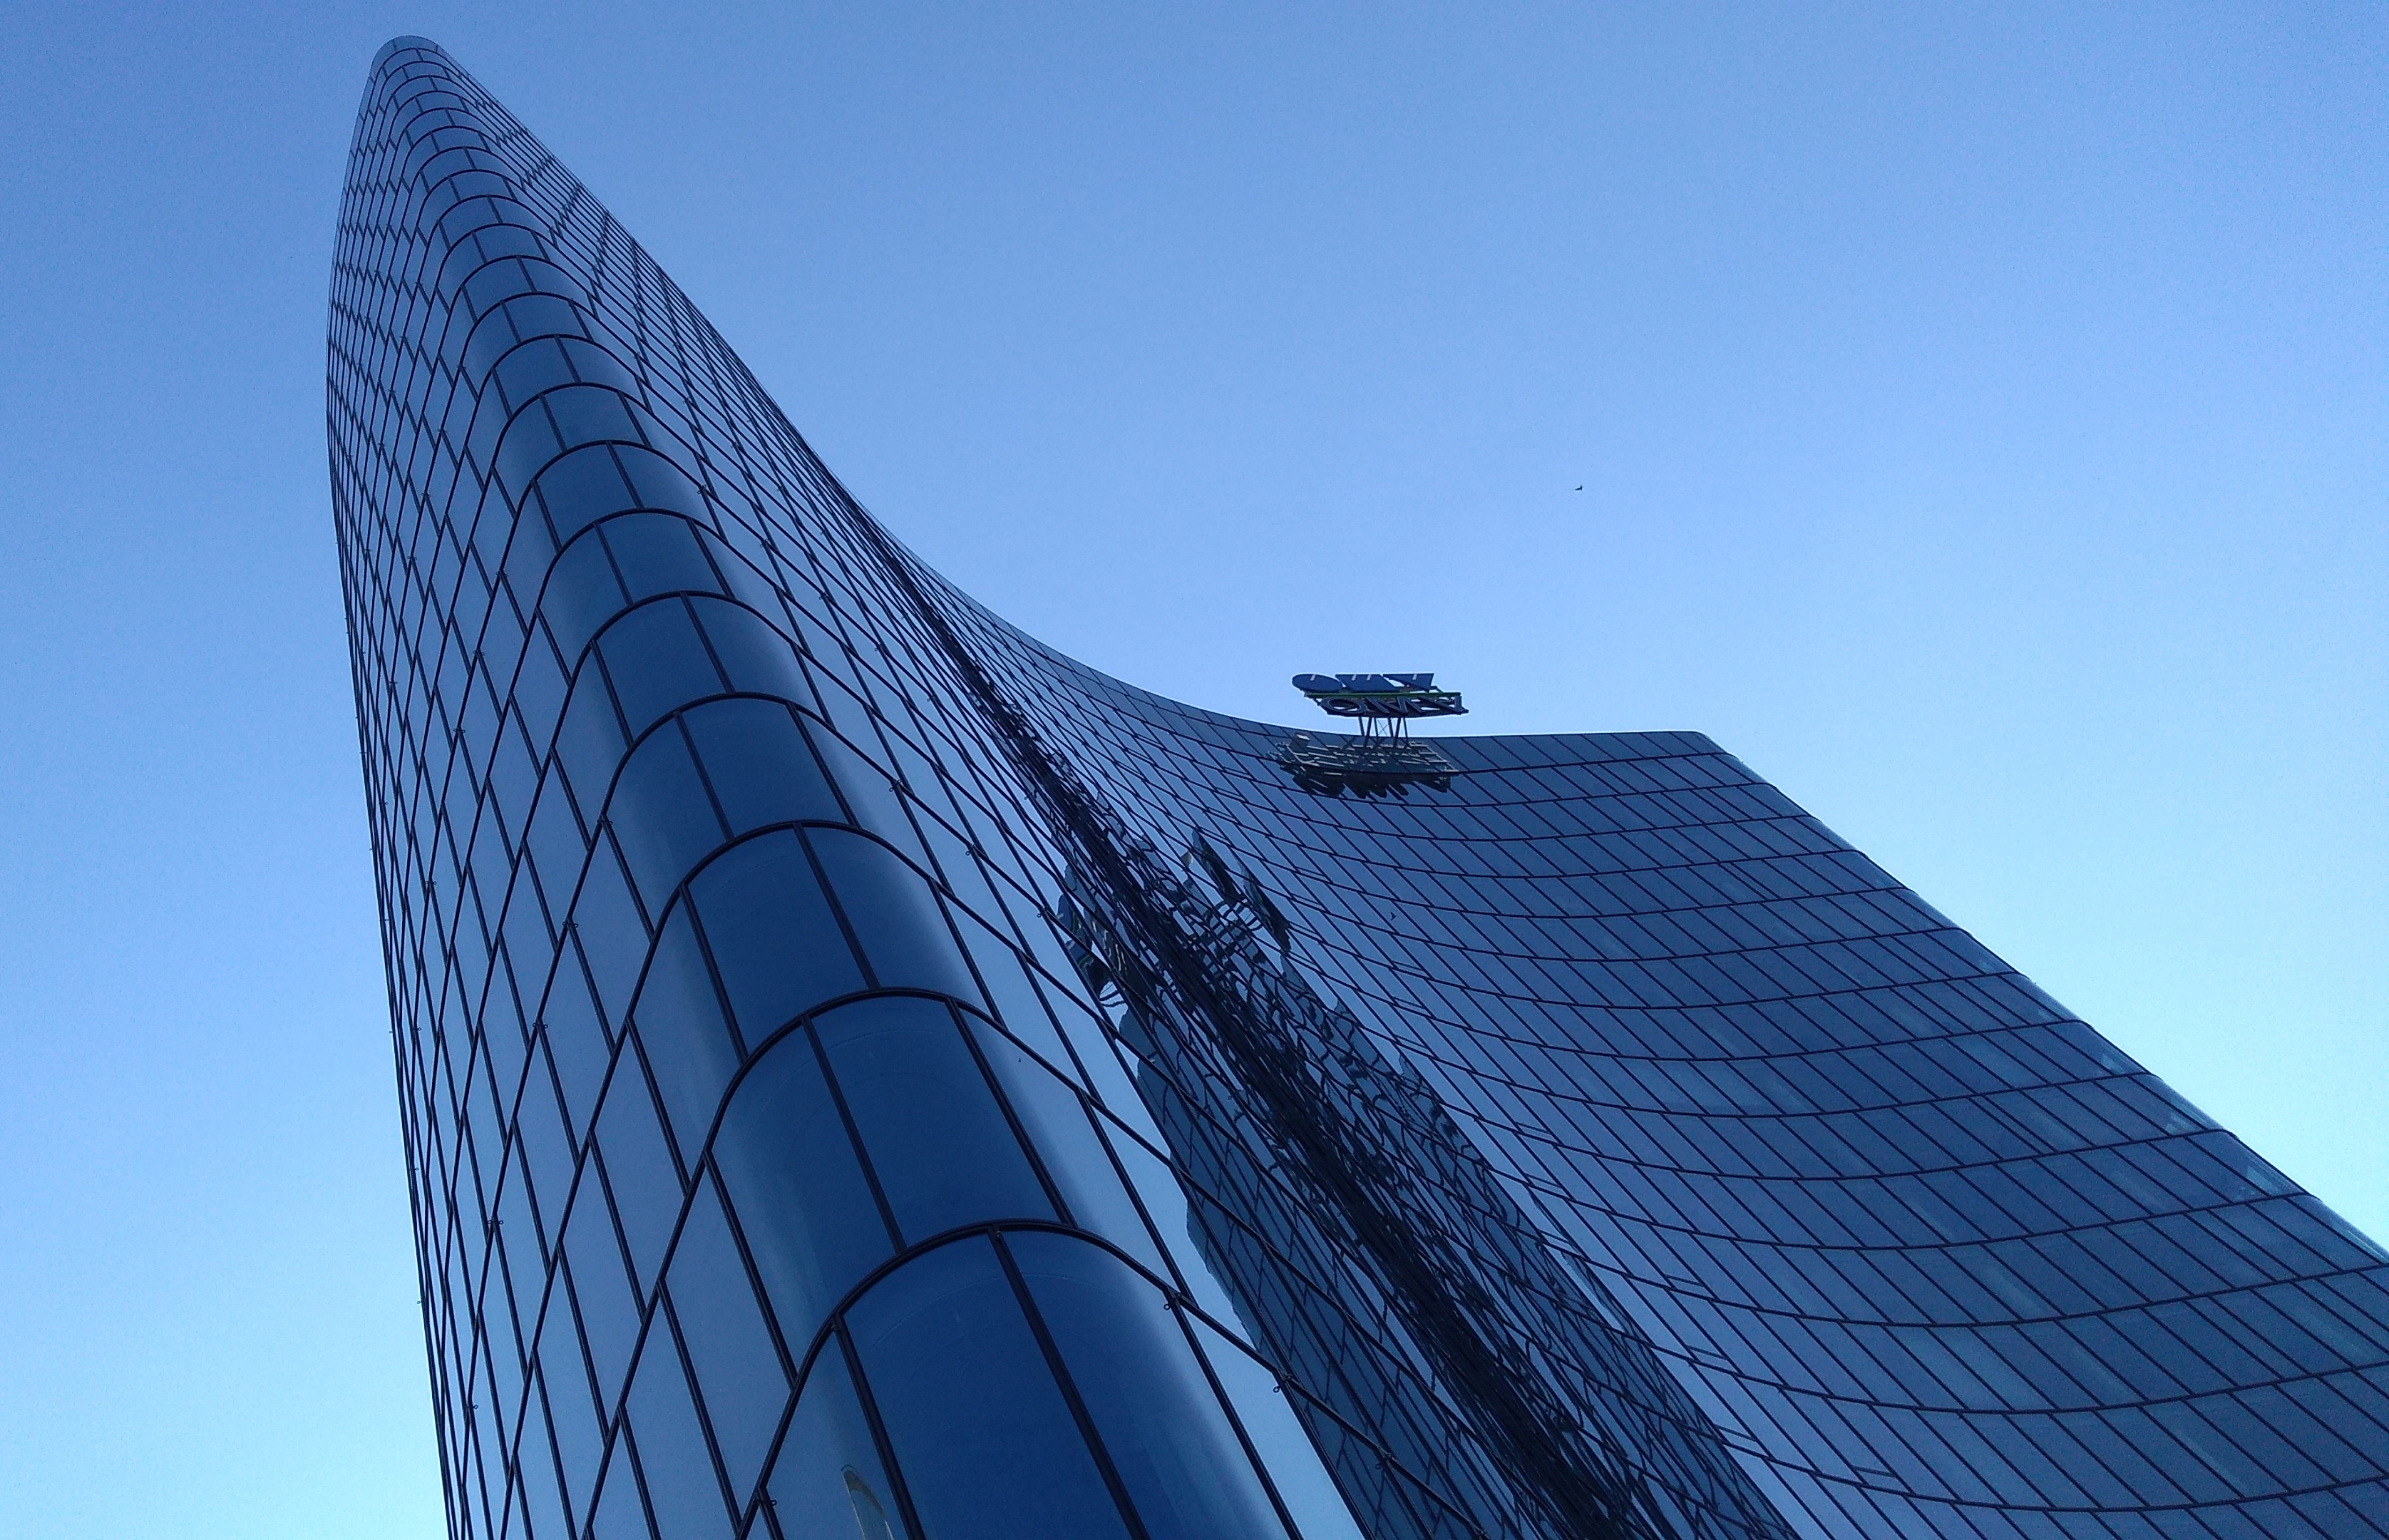
The former School at Kinkplatz at Night
Helmut Richter's school at Kinkplatz serves as a demonstration project for the GreenTech-Renovation exploratory project, as this building is a prime example of how topics can be dealt with in terms of sensible energy renovation.
Copyright: Mischa Erben

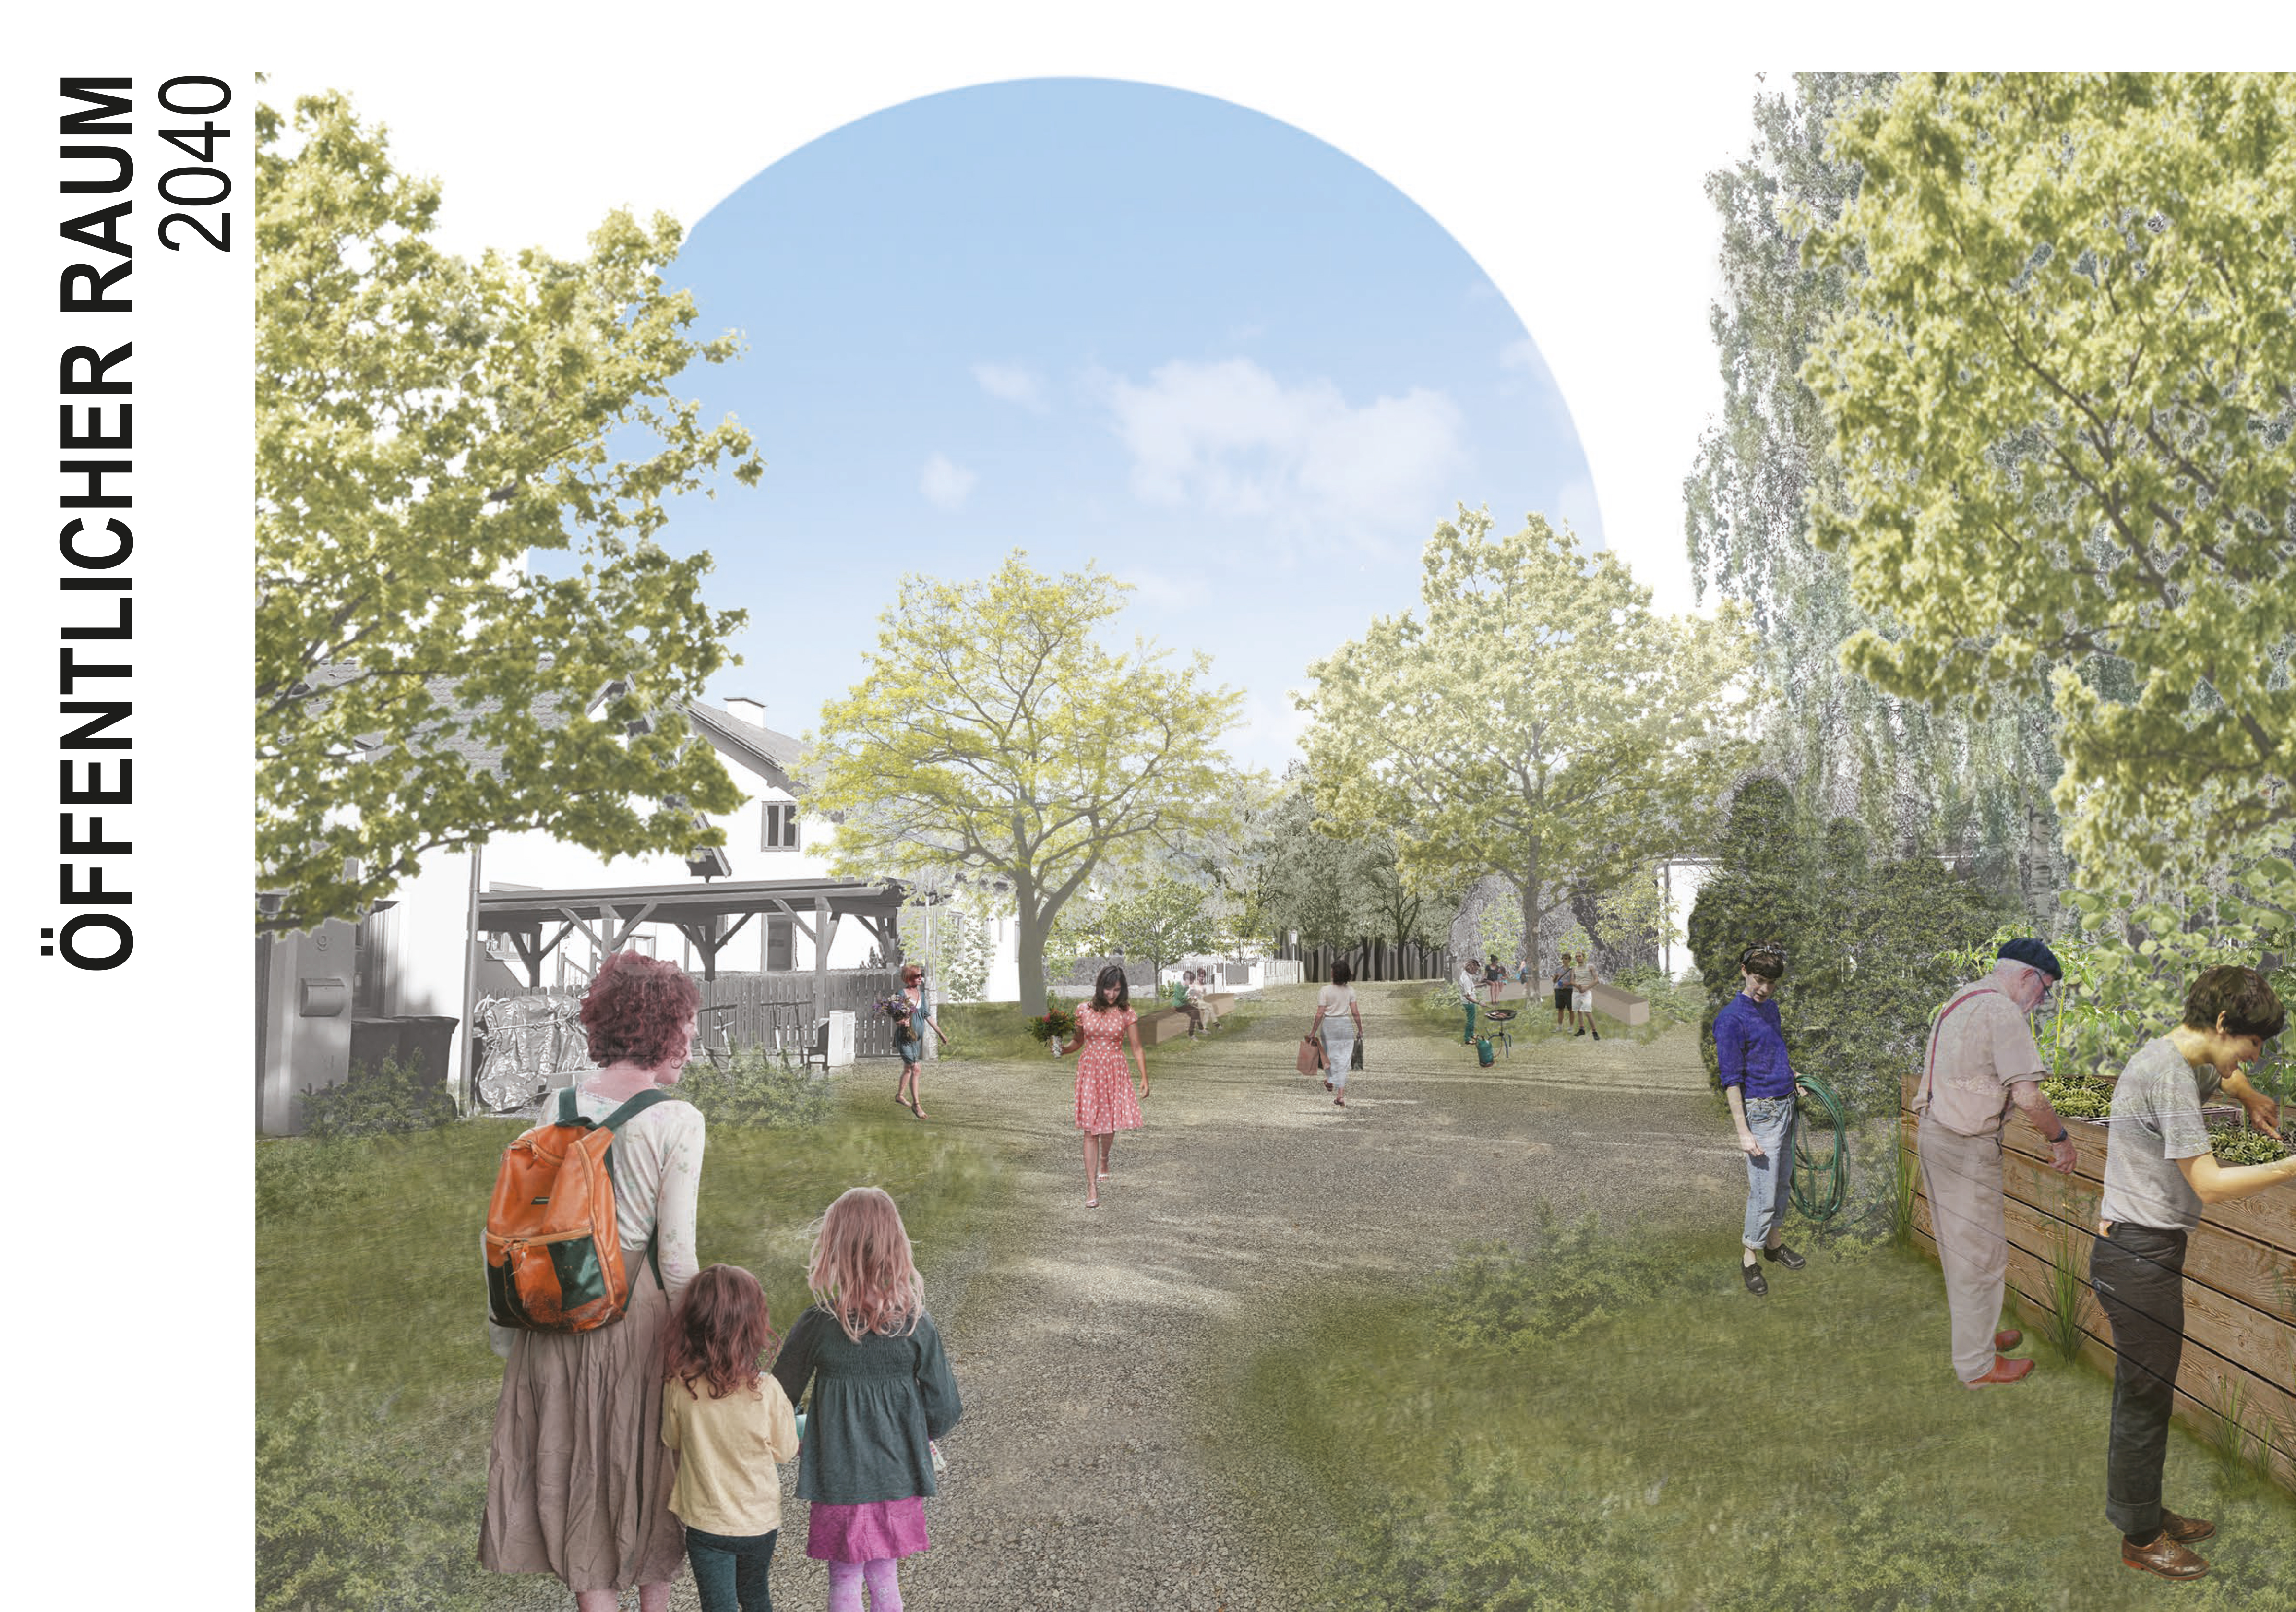
Collage_Vision 2040
Visualization of a public space with more quality of stay and unsealed ground
Copyright: ©ReHABITAT-Siedlung

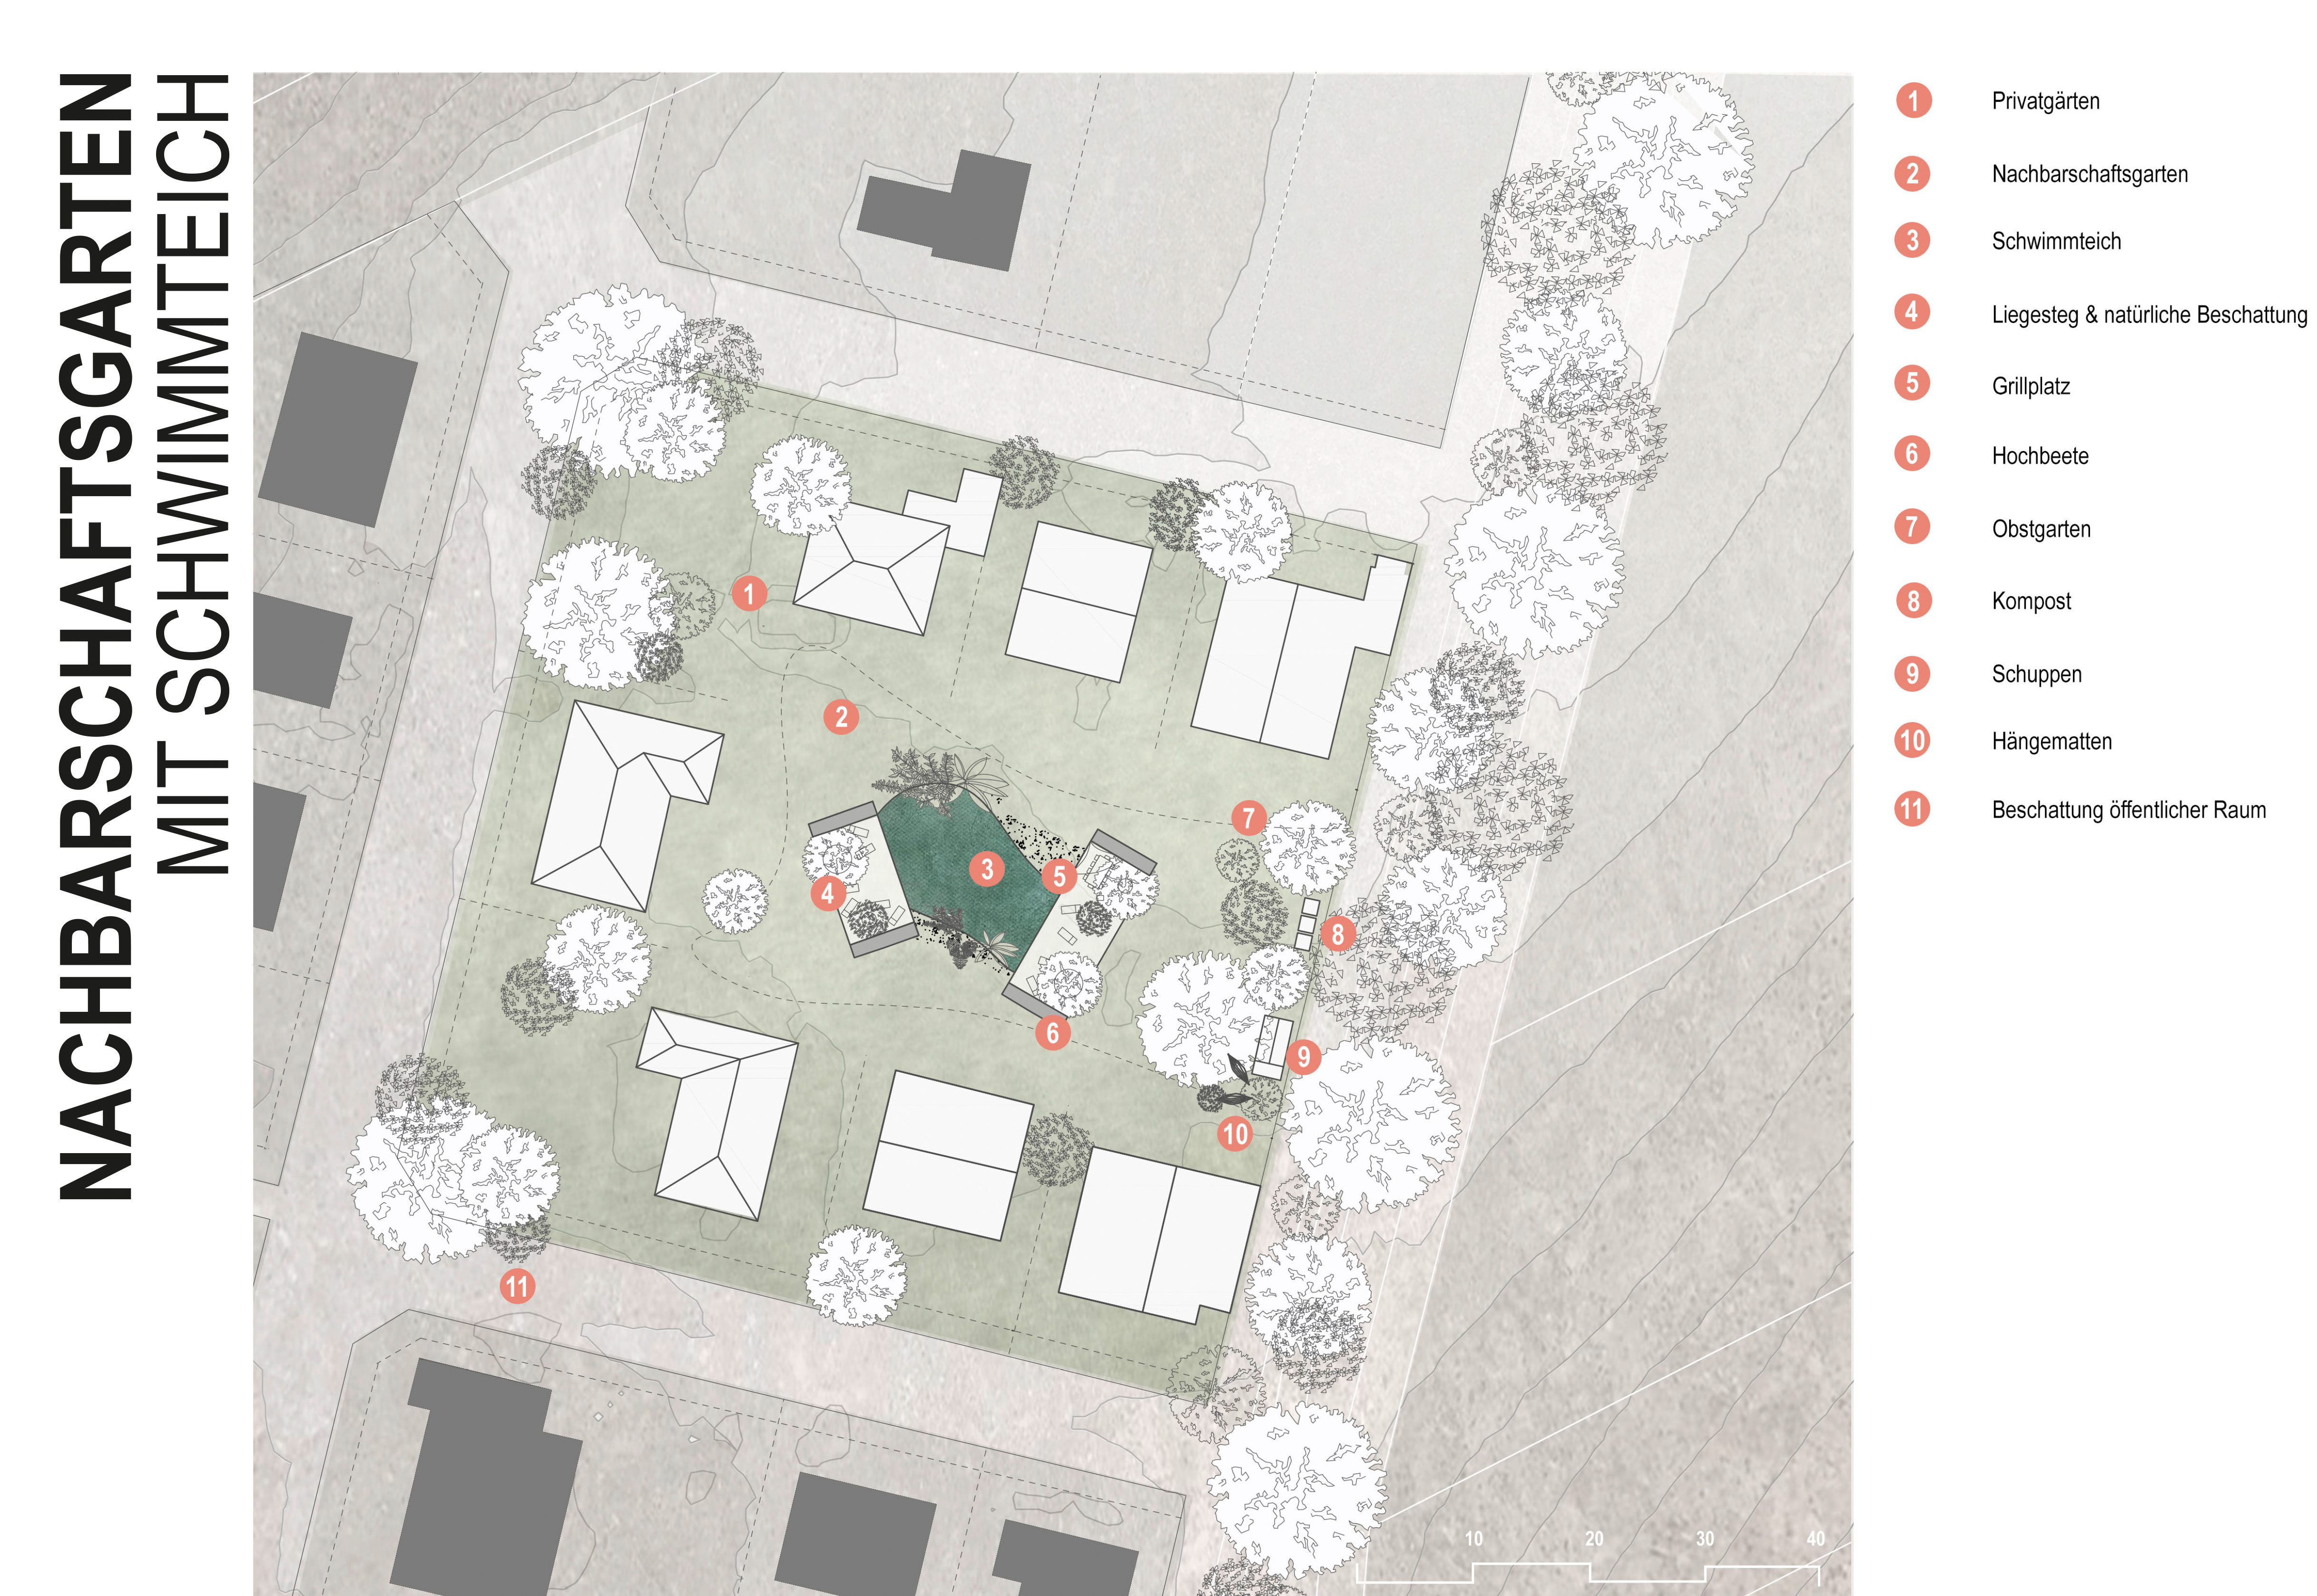
Neighborhood garden plan
Within the framework of a building association consisting of about 6-8 properties, the existing gardens could be interconnected to form a neighborhood garden in which countless design and usage possibilities of the green center could be realized. Here is an example with swimming pond
Copyright: ©ReHABITAT-Siedlung
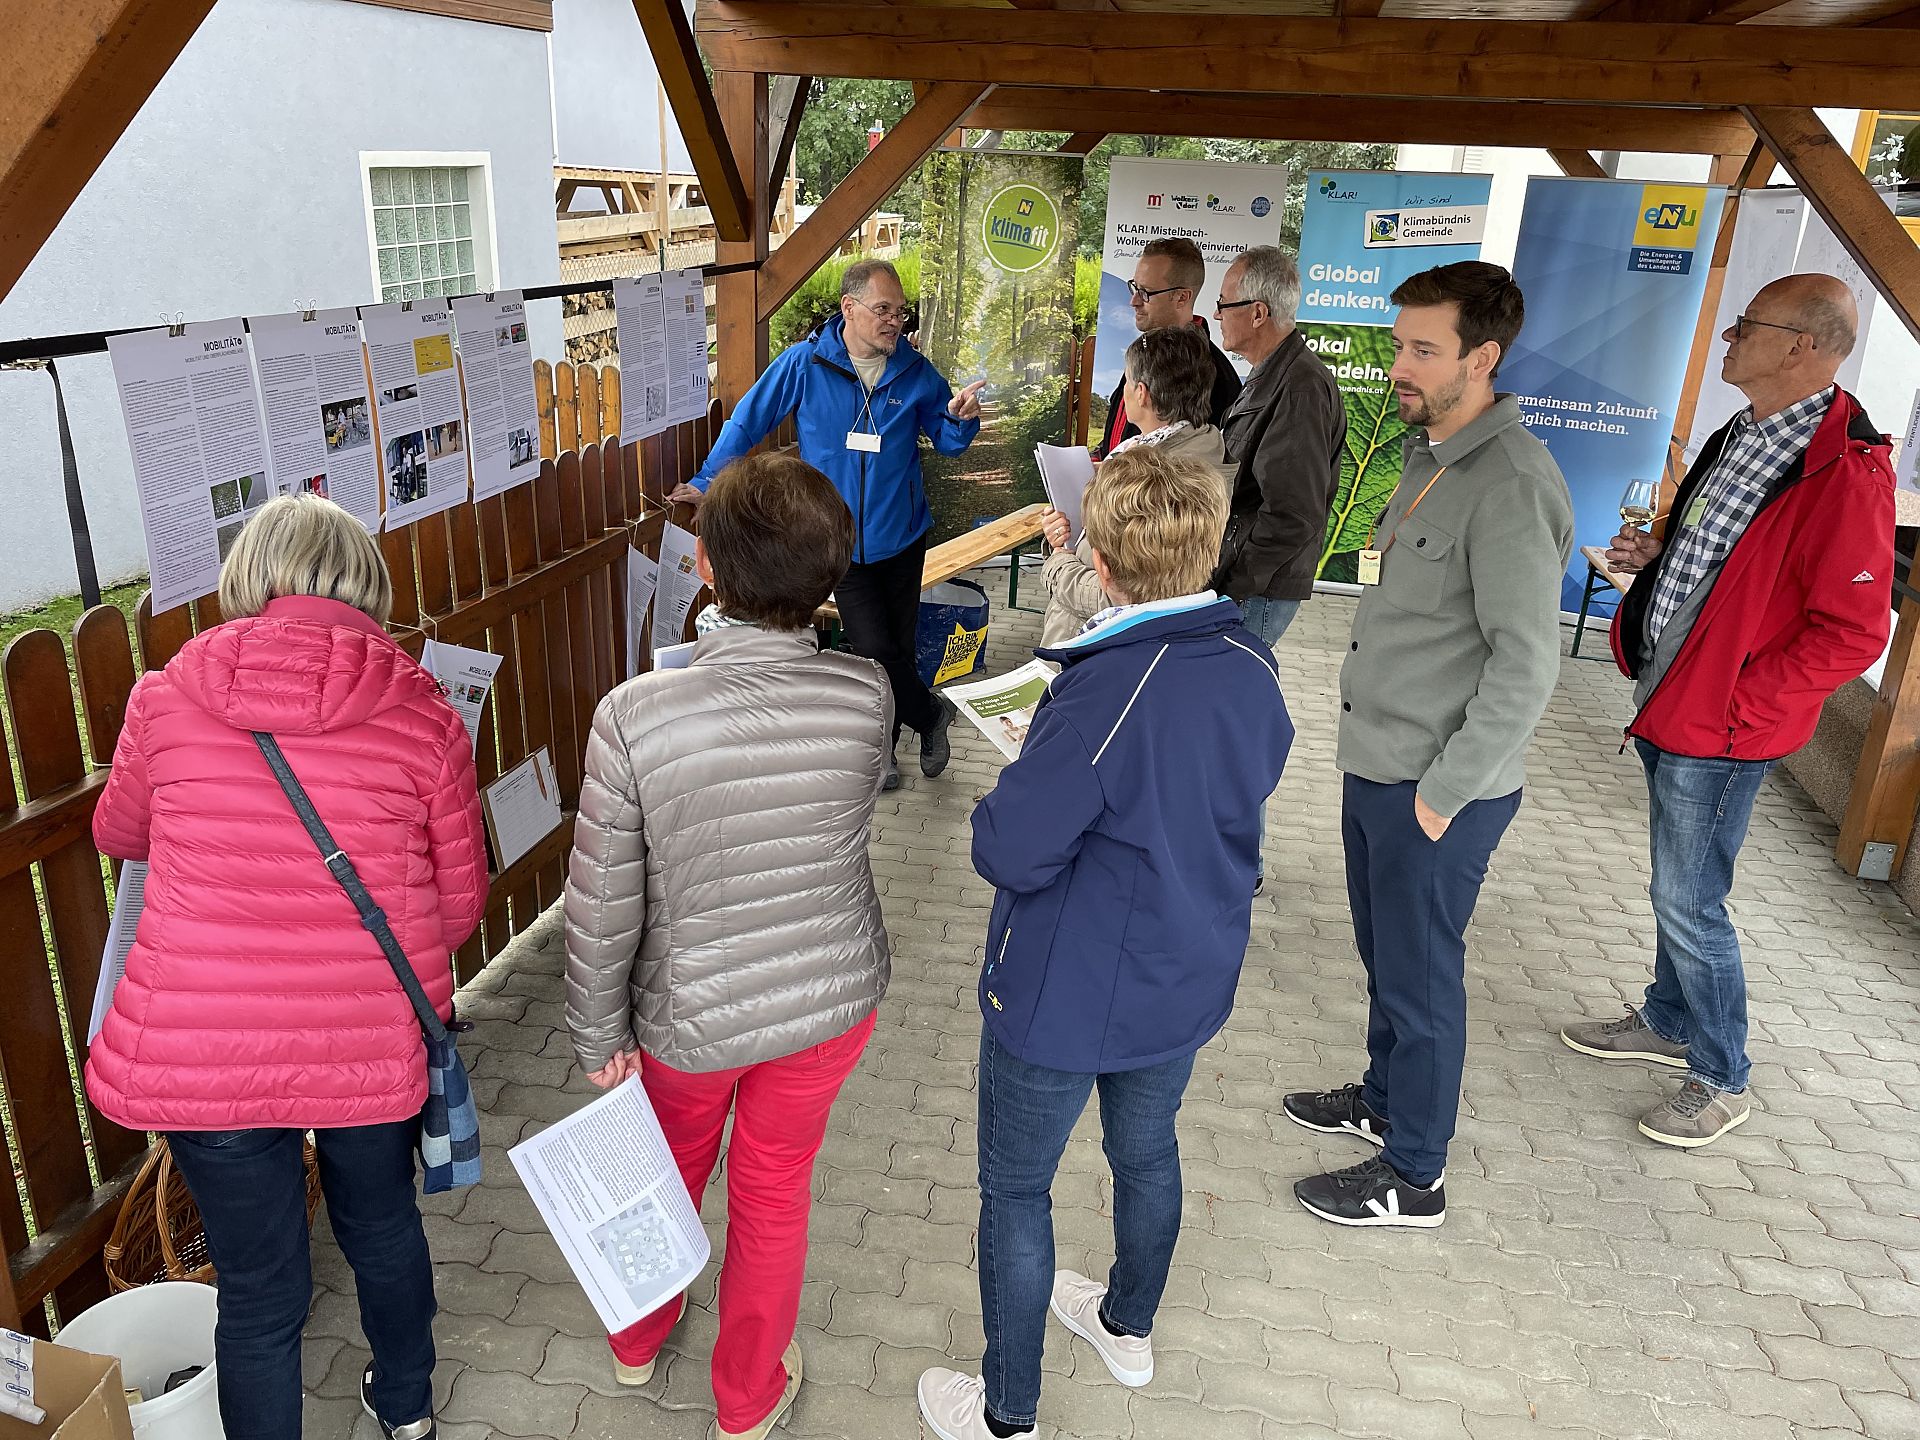
Energy- and Mobility Carport
Information in the Energy and Mobility Carport during the closing event.
Copyright: ©ReHABITAT-Siedlung

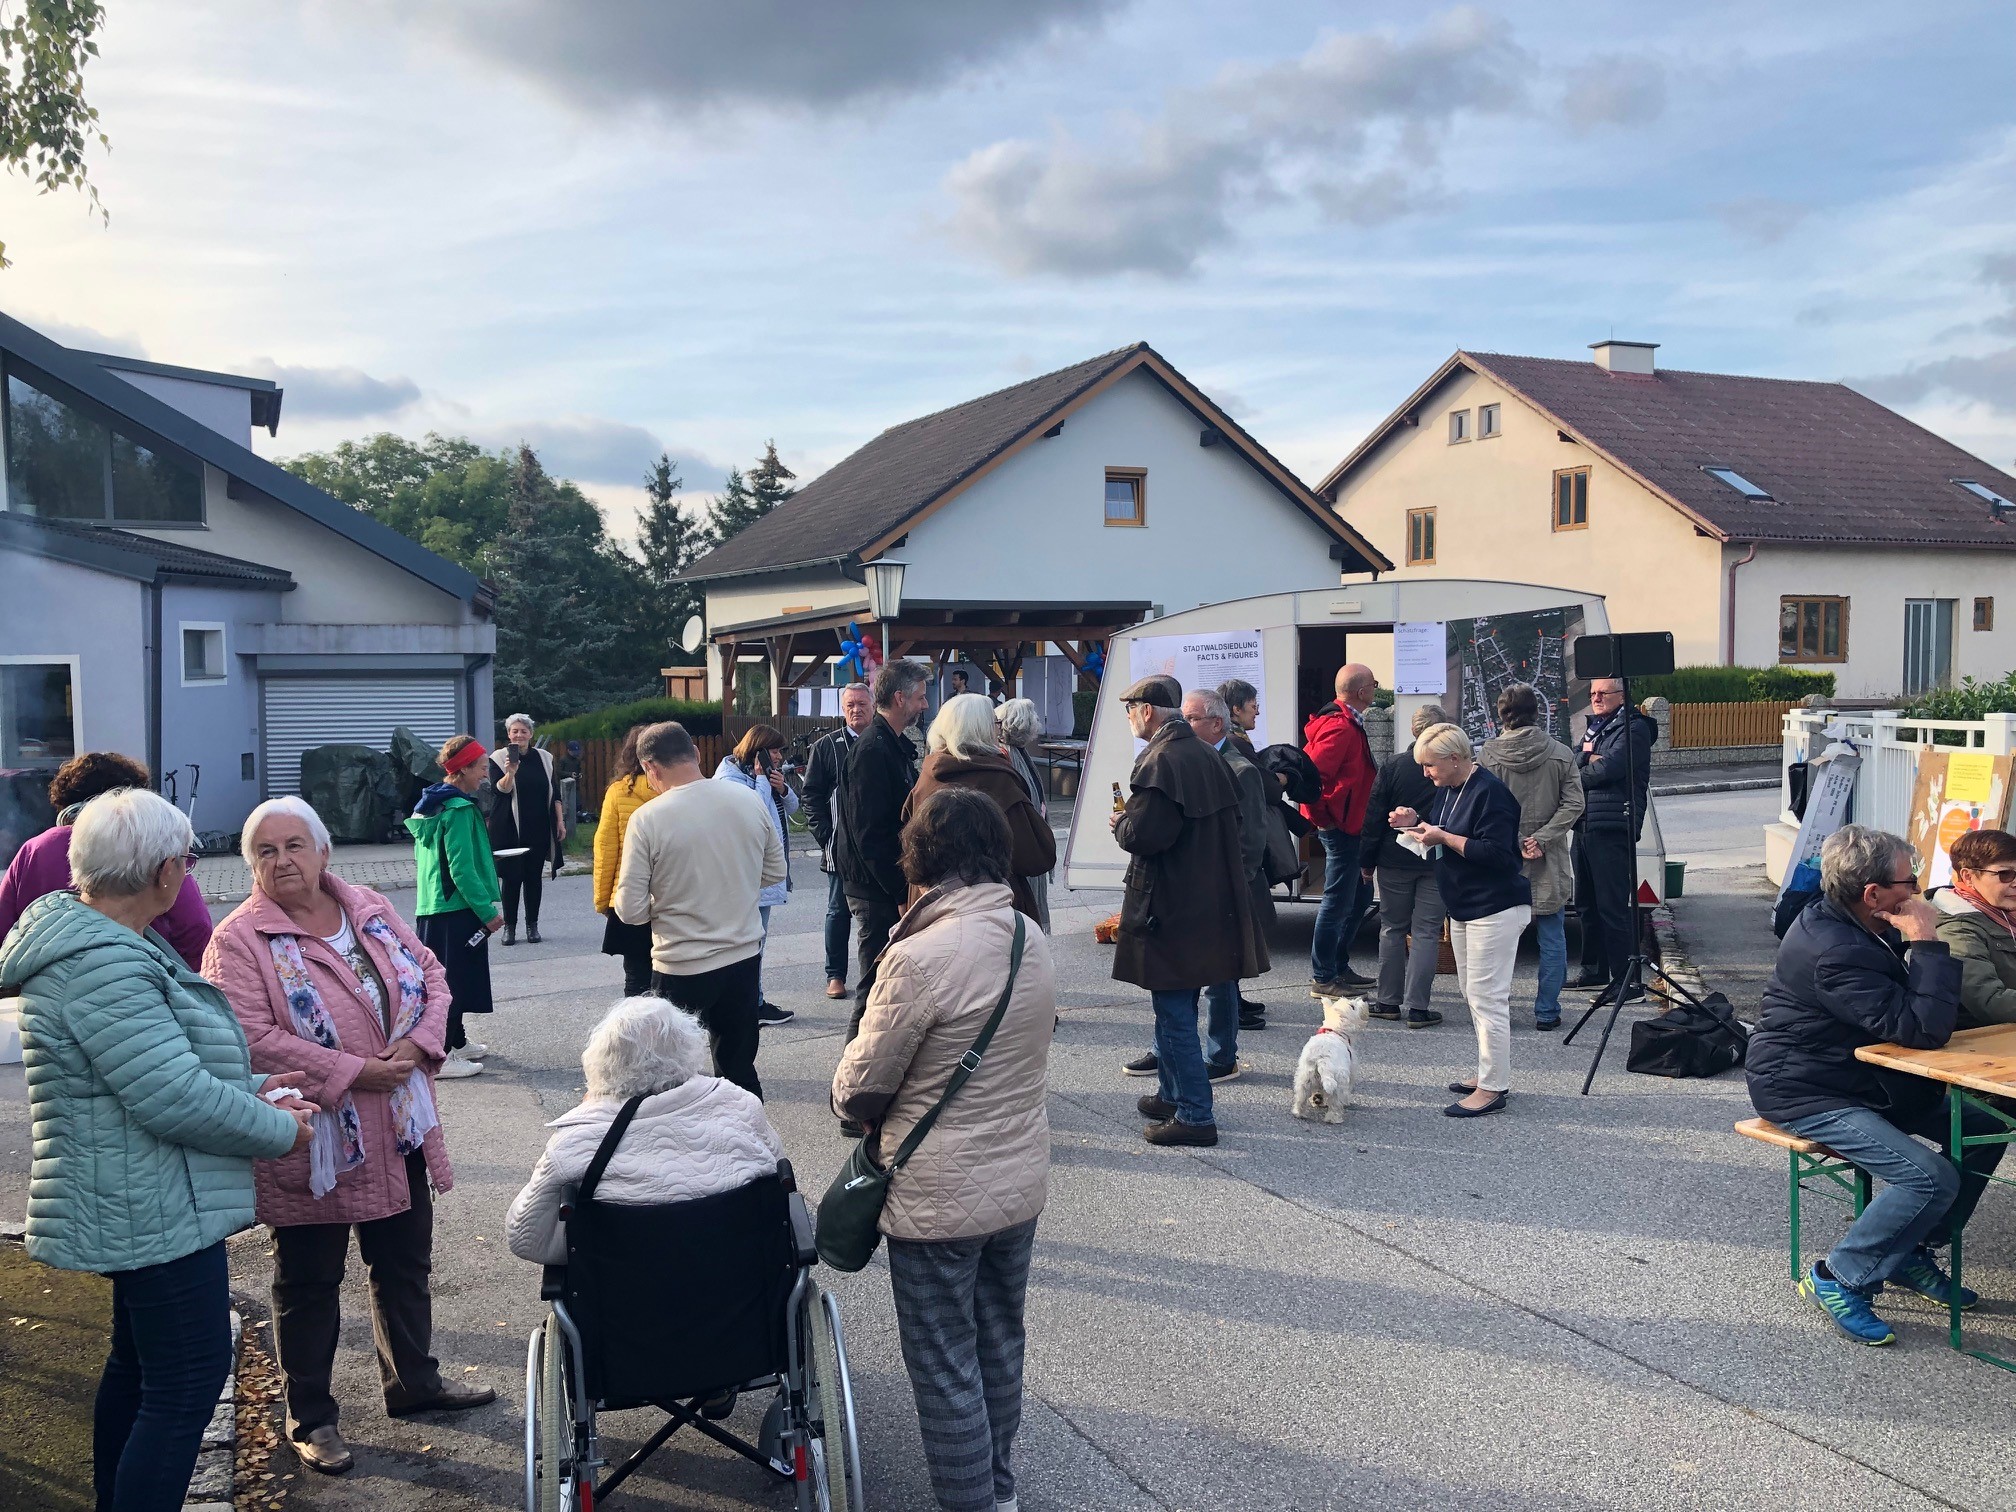
Closing Event
Many interested people at the project closing event in the settlement
Copyright: ©ReHABITAT-Siedlung

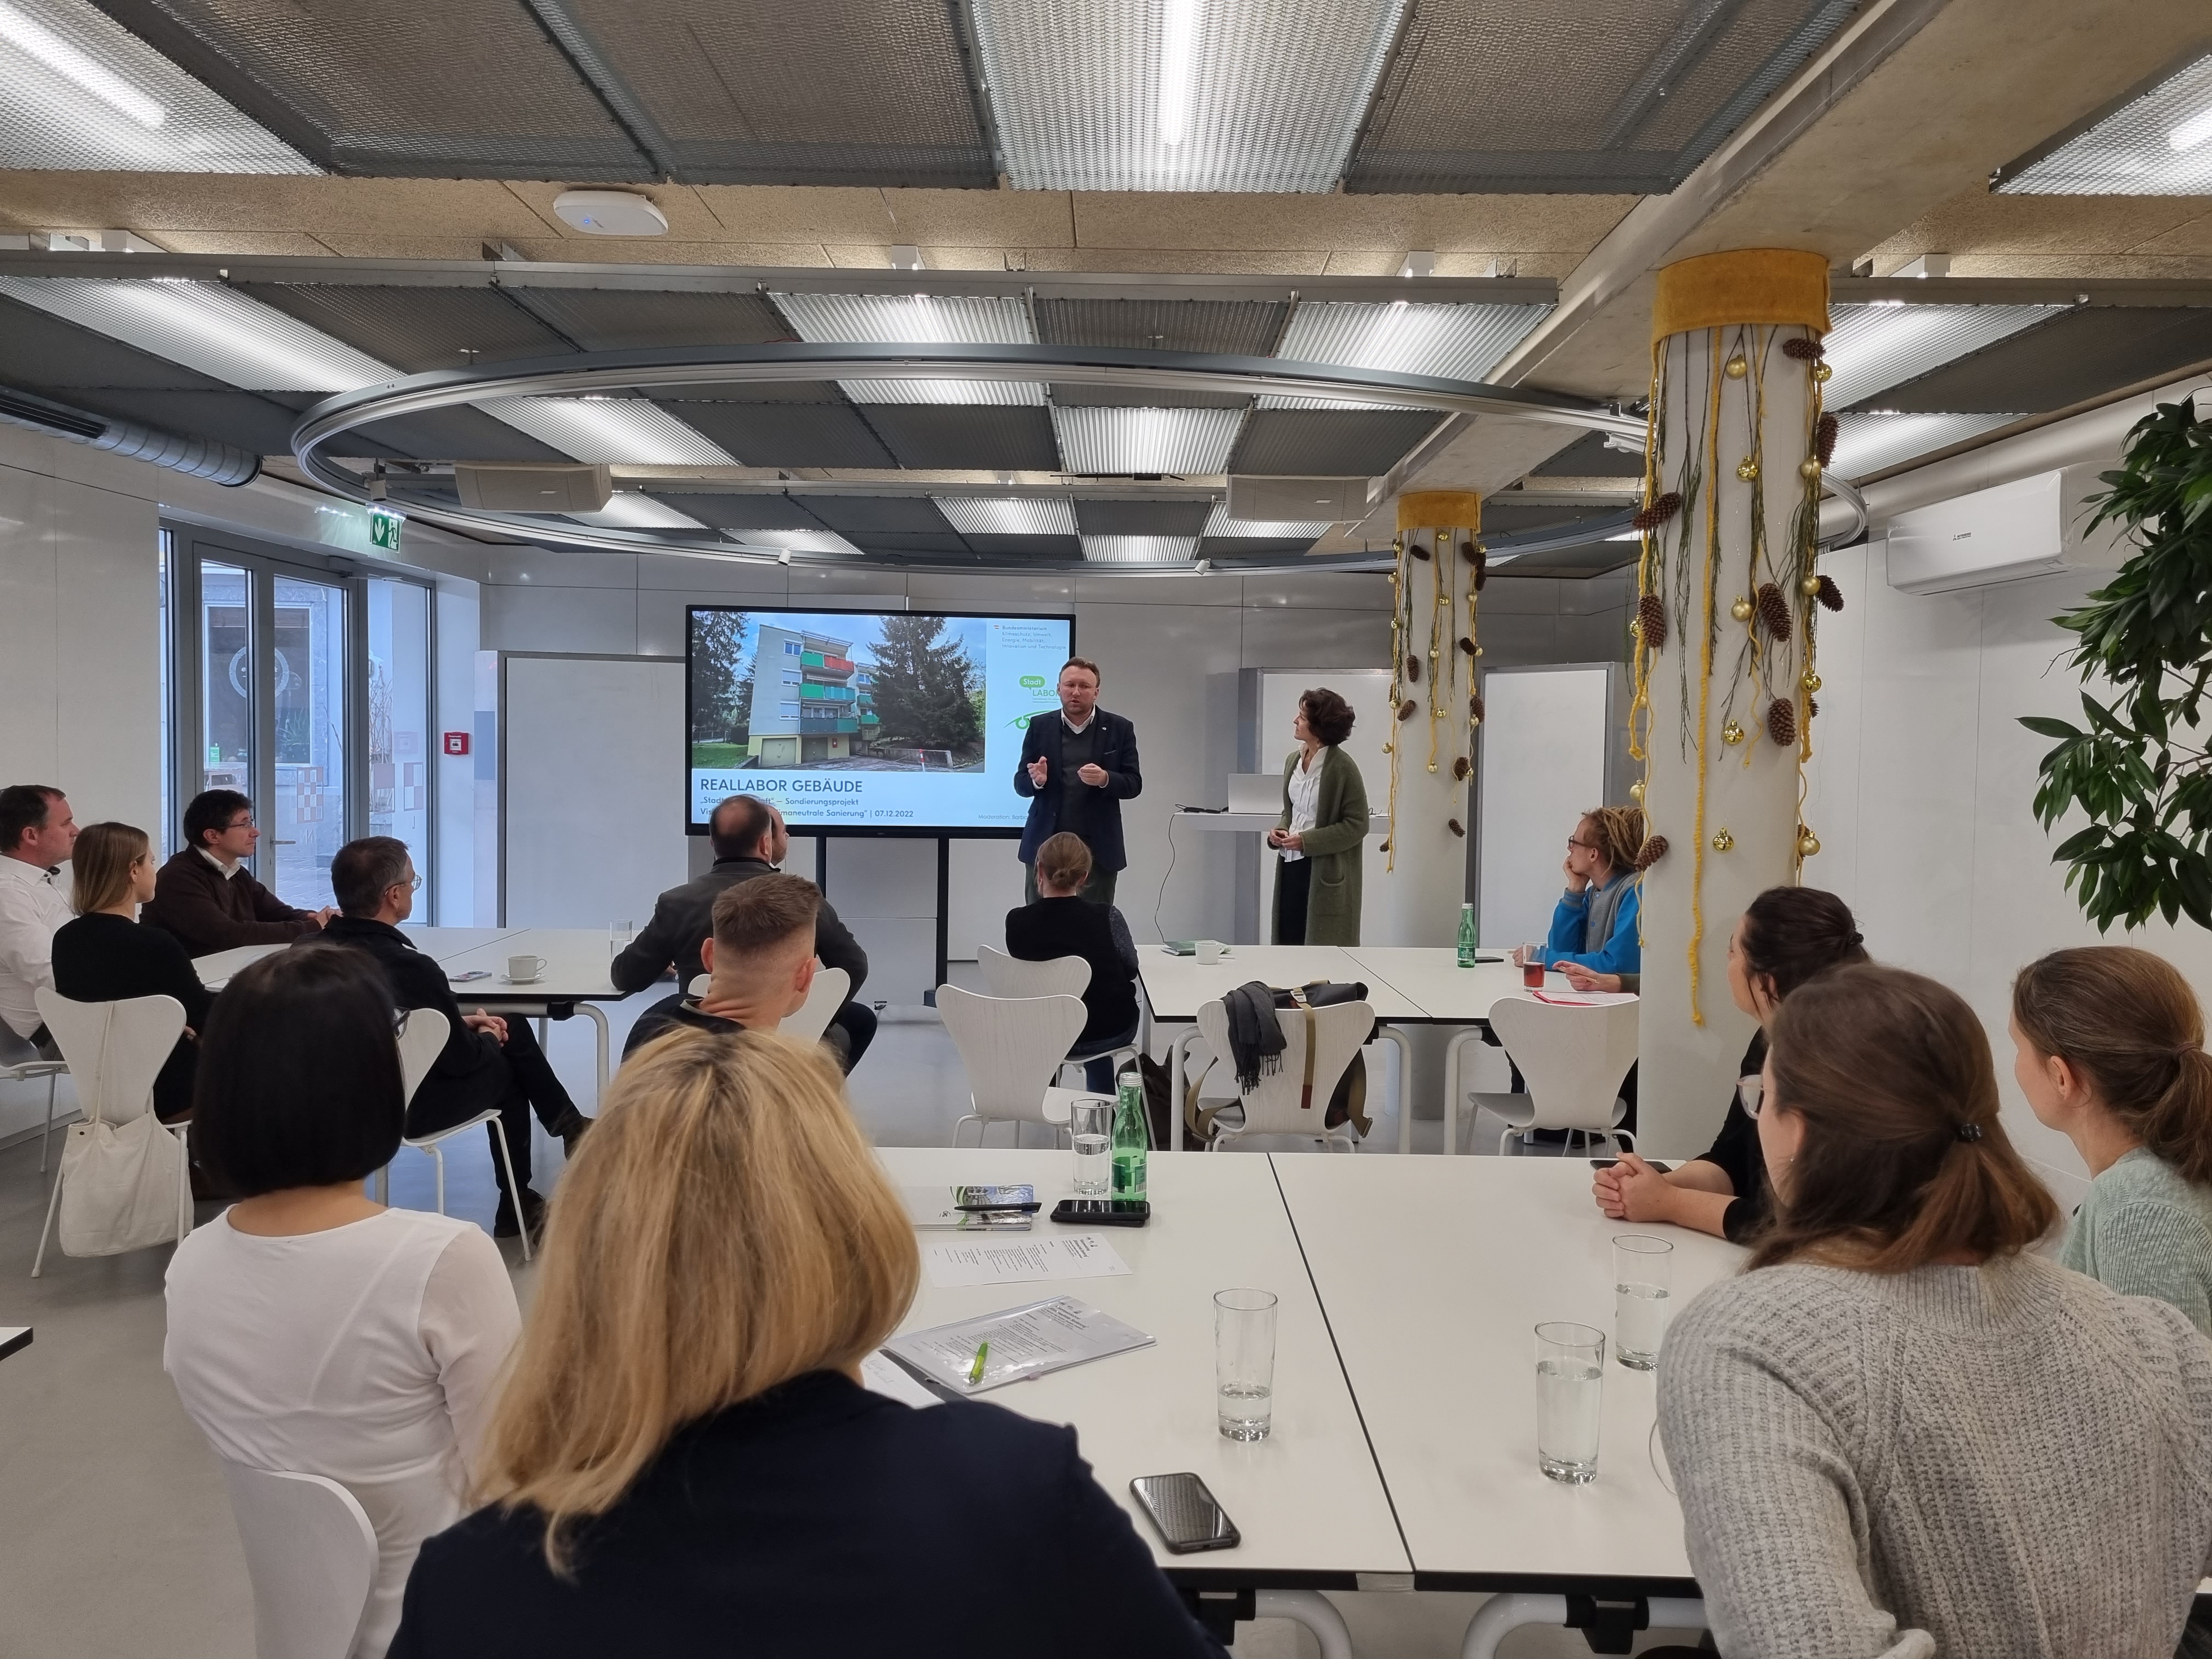
Vision workshop as part of the "Reallabor Gebäude" project
The illustration shows co-creation with stakeholders from business and society, which was carried out as part of a vision workshop in the project "Reallabor Gebäude - Gebäude als Reallabor für klimaneutrales, bedarfsgerechtes und leistbares Wohnen" in December 2022 at Lendhafen, Graz.
Copyright: StadtLABOR Innovationen für urbane Lebensqualität GmbH
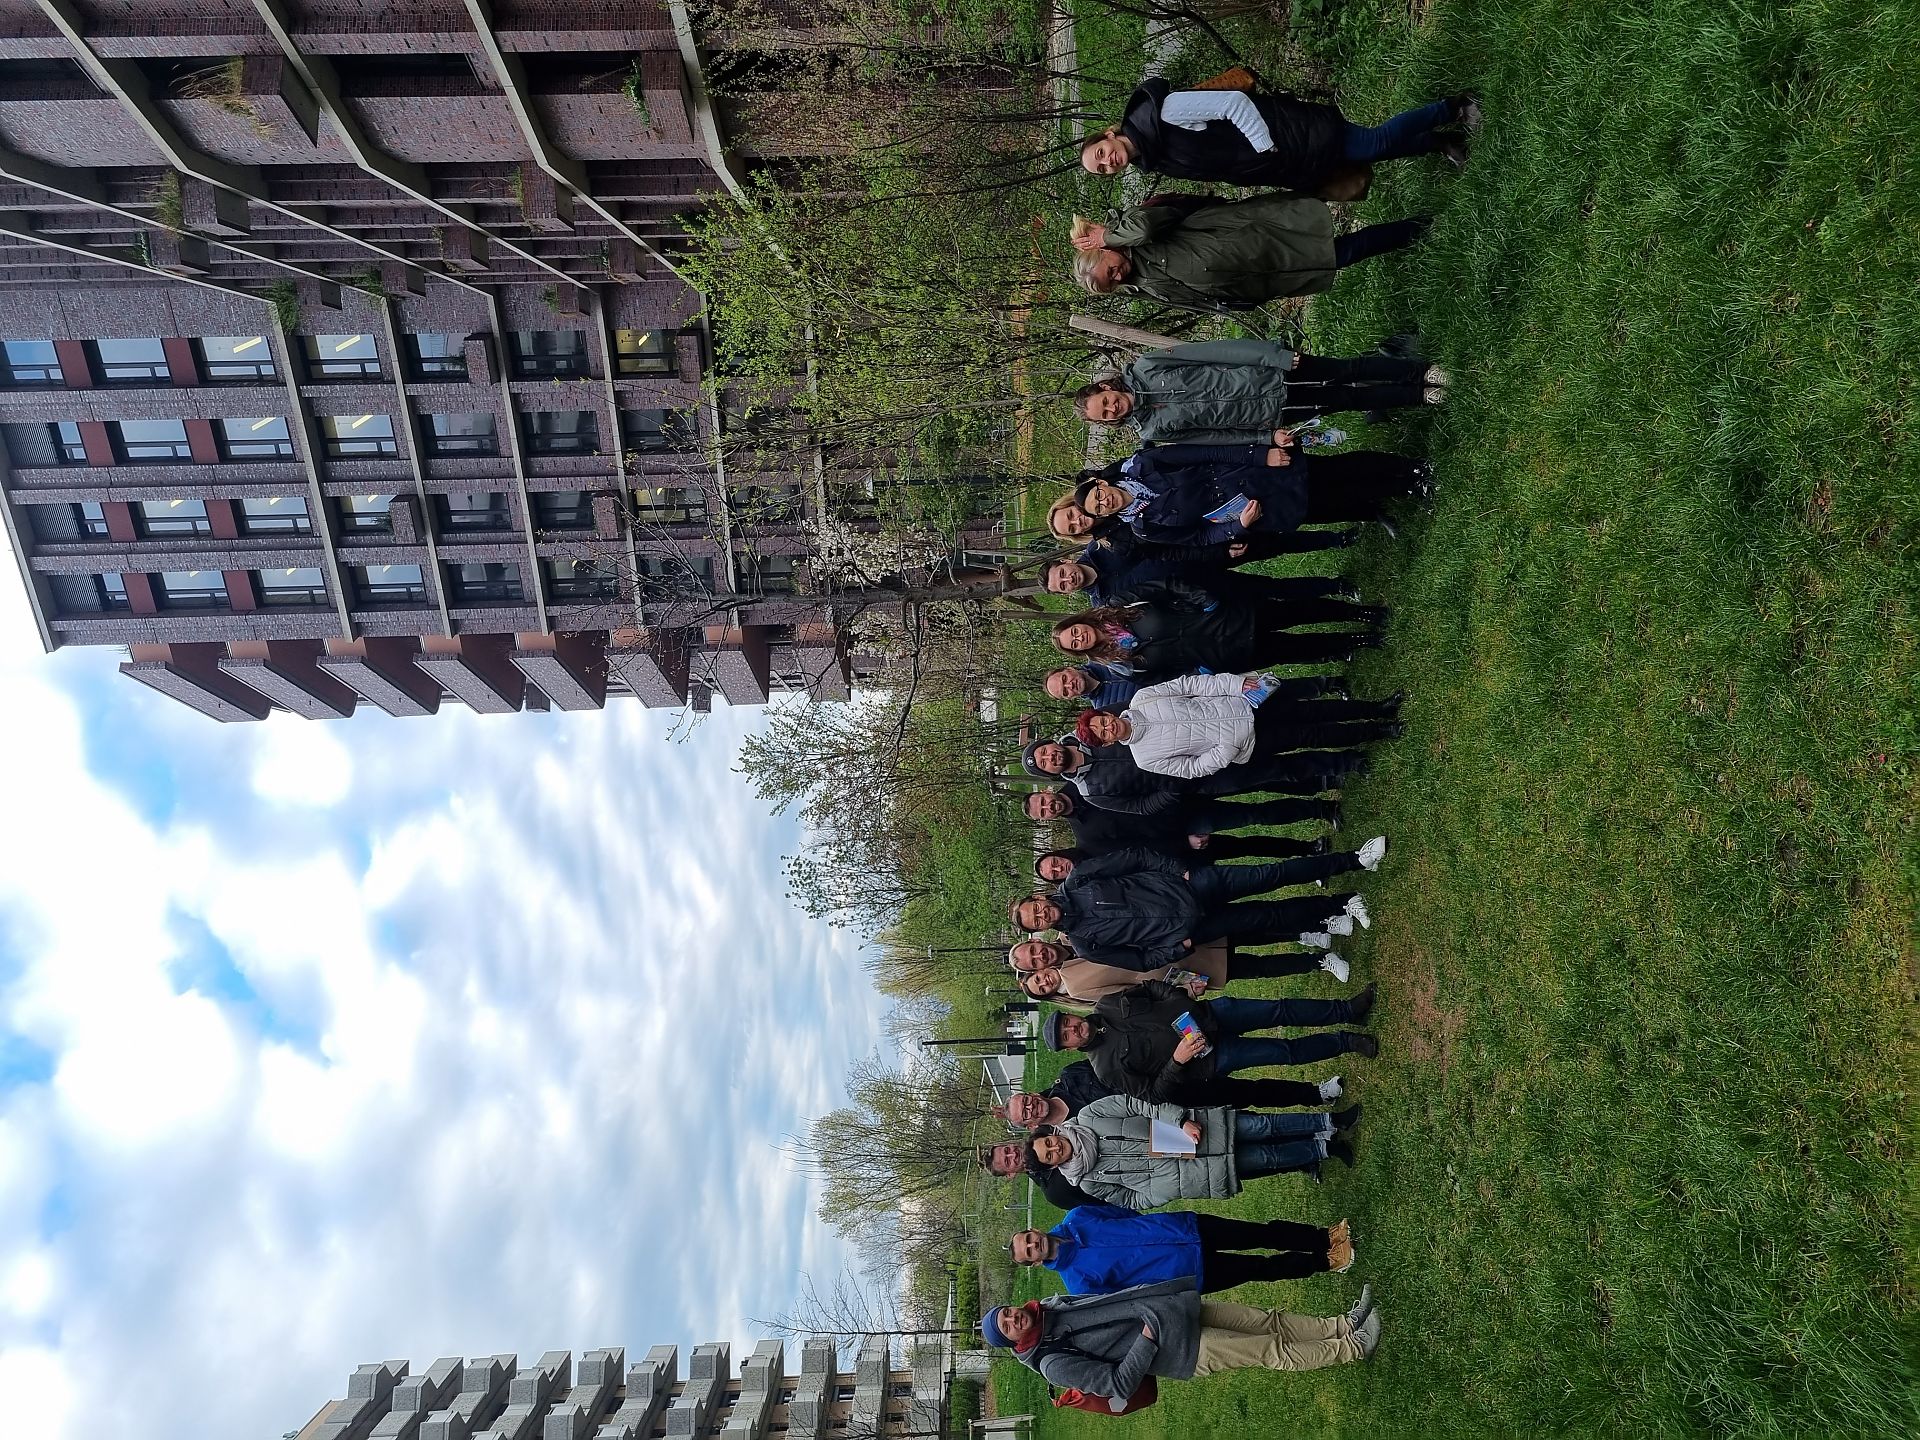
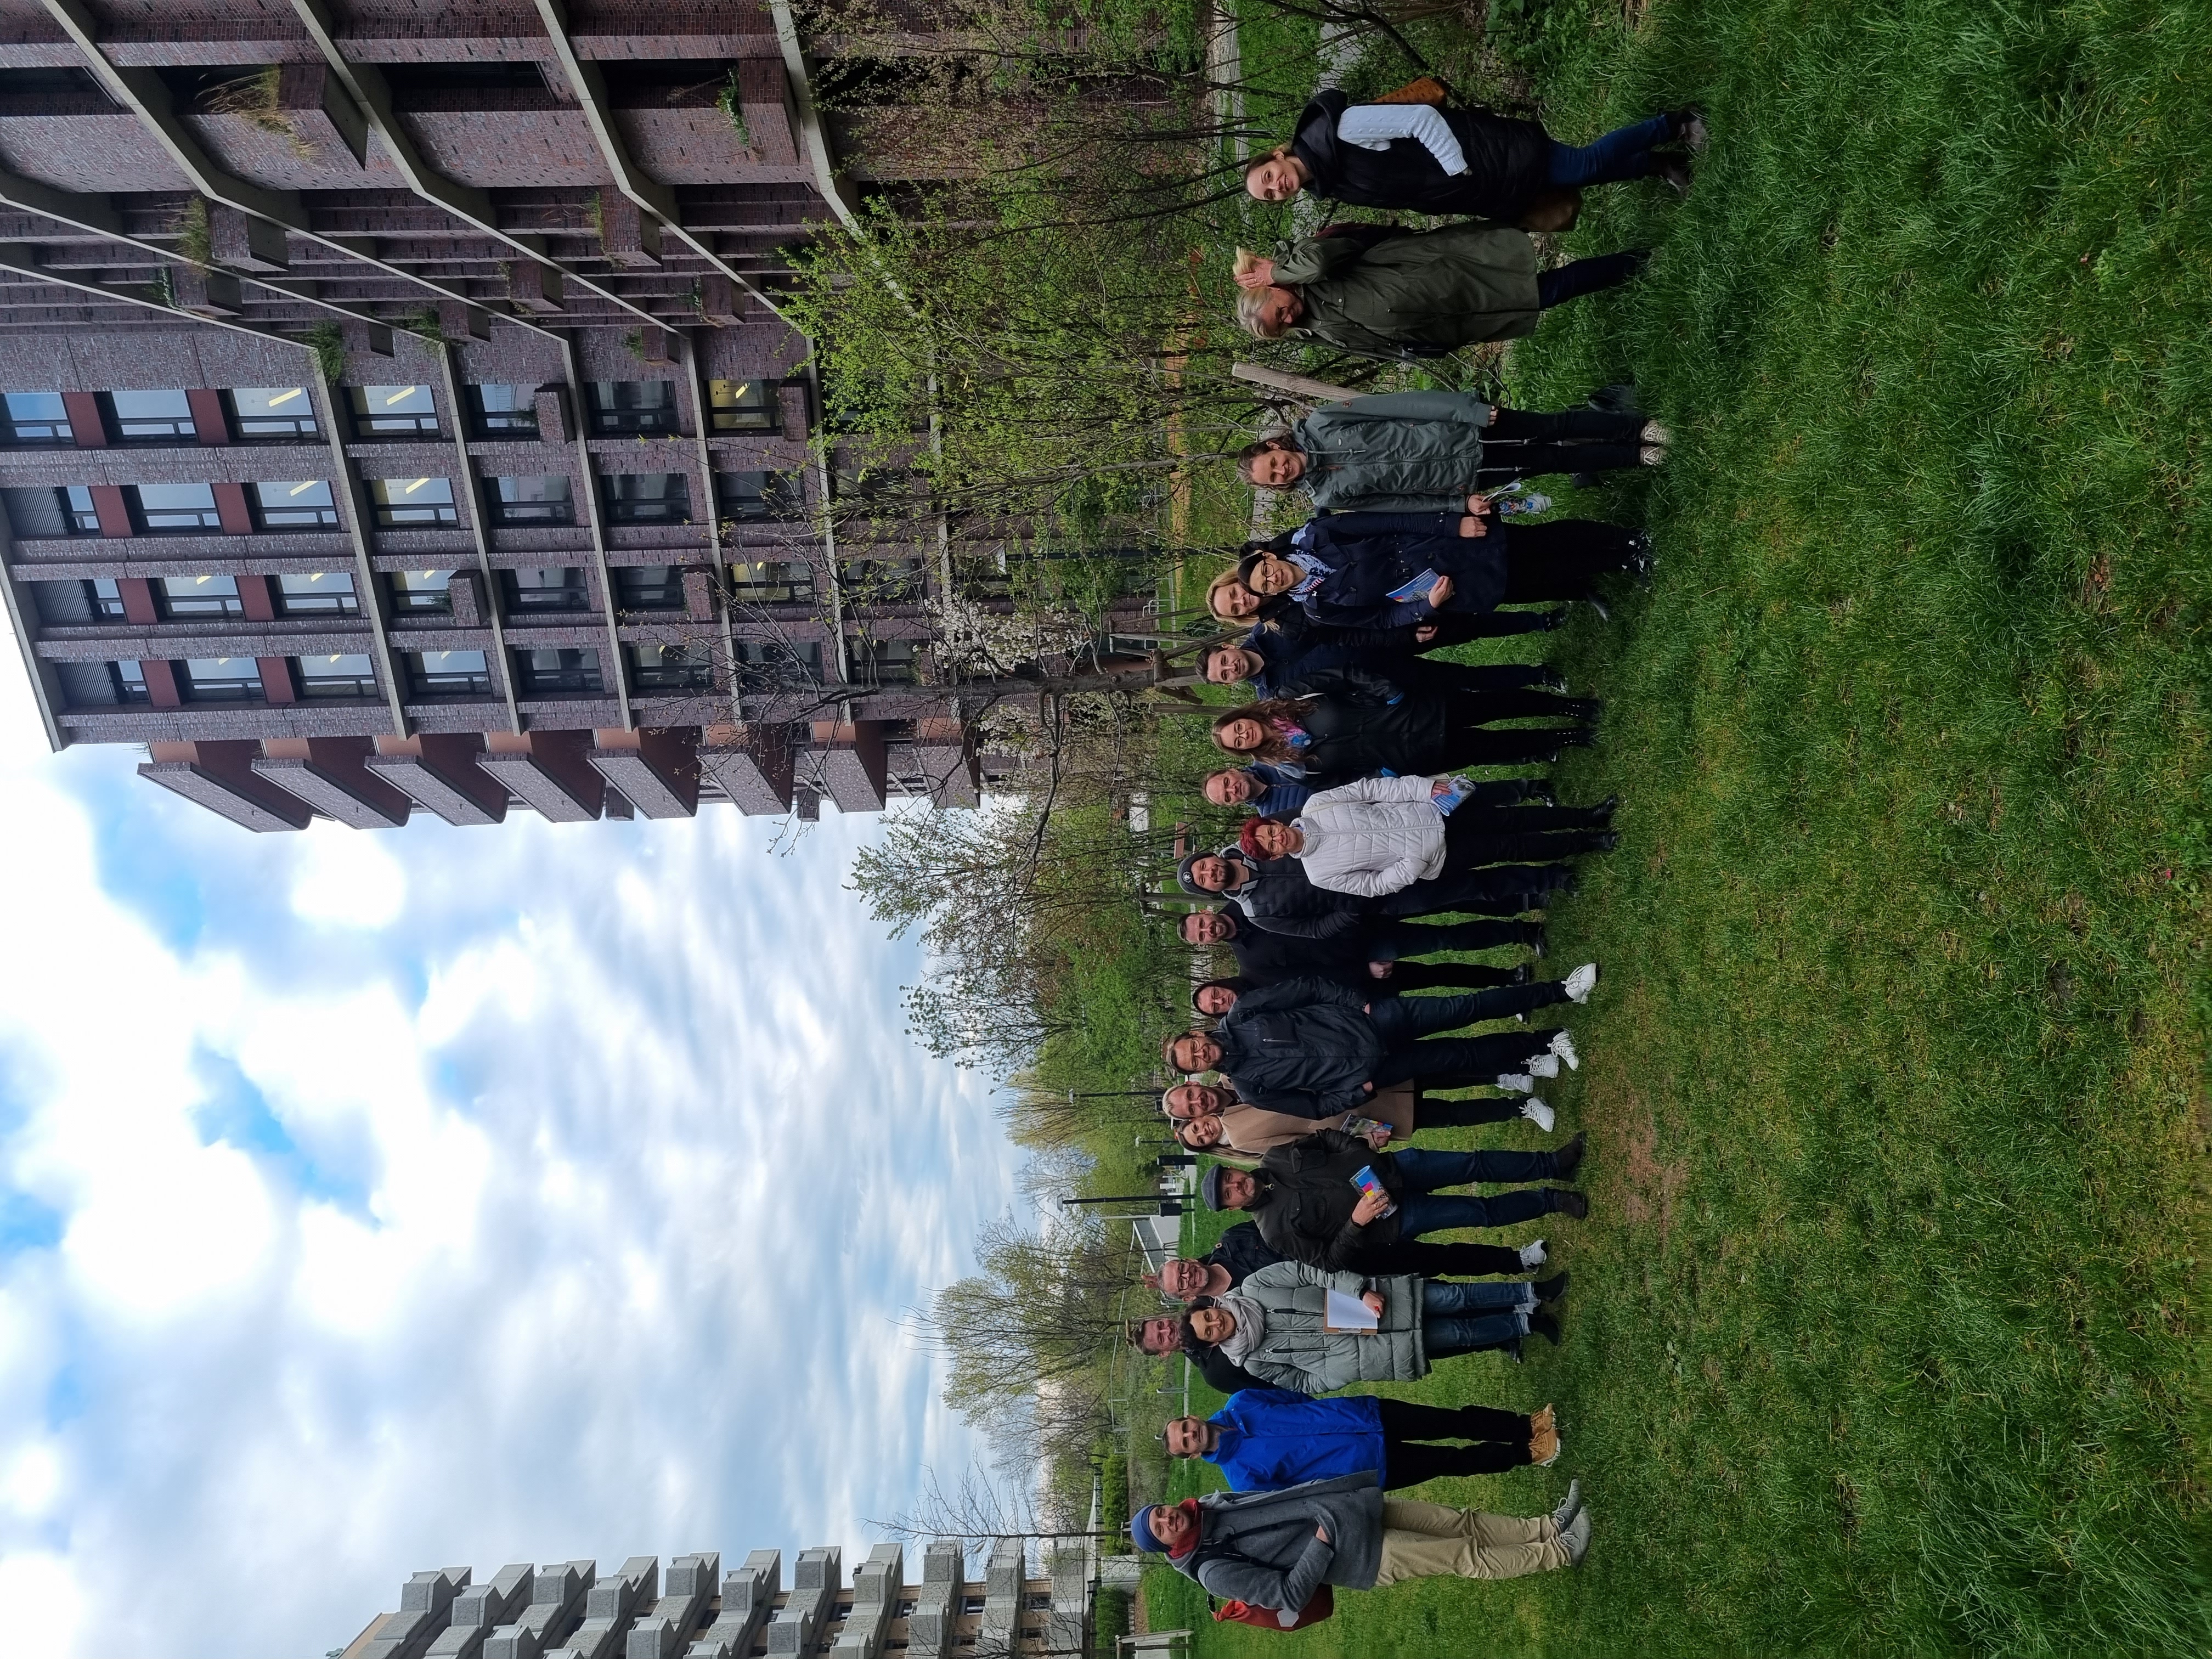
Group photo Study tour on urban greening and renovation projects in Vienna
The picture shows the participants of the study tour to Vienna, which was carried out as part of the project "Reallabor Gebäude - Gebäude als Reallabor für klimaneutrales, bedarfsgerechtes und leistbares Wohnen".
Copyright: StadtLABOR Innovationen für urbane Lebensqualität GmbH
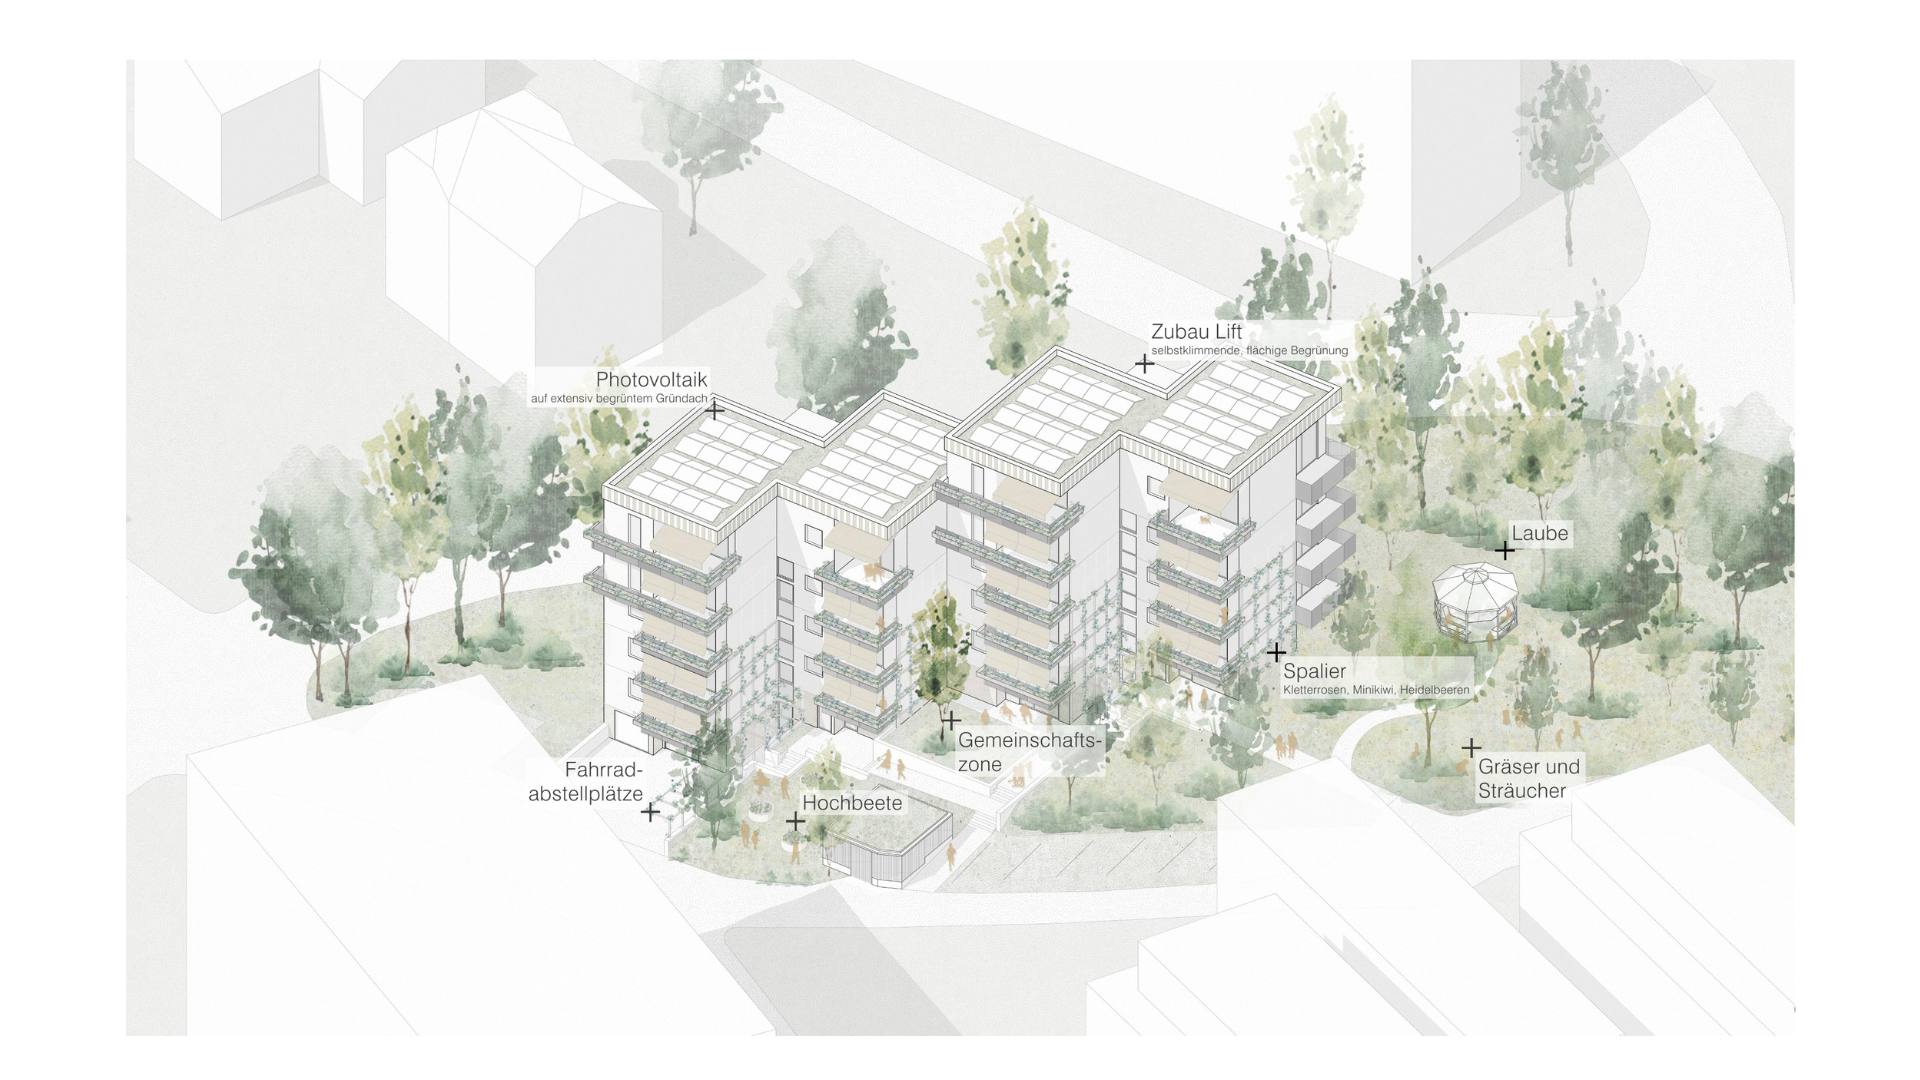
Axonometry architectural study in the project "Reallabor Gebäude - Gebäude als Reallabor für klimaneutrales, bedarfsgerechtes und leistbares Wohnen"
The illustration shows an excerpt from the architectural study that was carried out as part of the project "Reallabor Gebäude - Gebäude als Reallabor für klimaneutrales, bedarfsgerechtes und leistbares Wohnen". This is a refurbishment project including an extension.
Copyright: Gangoly & Kristiner Architekten ZT GmbH
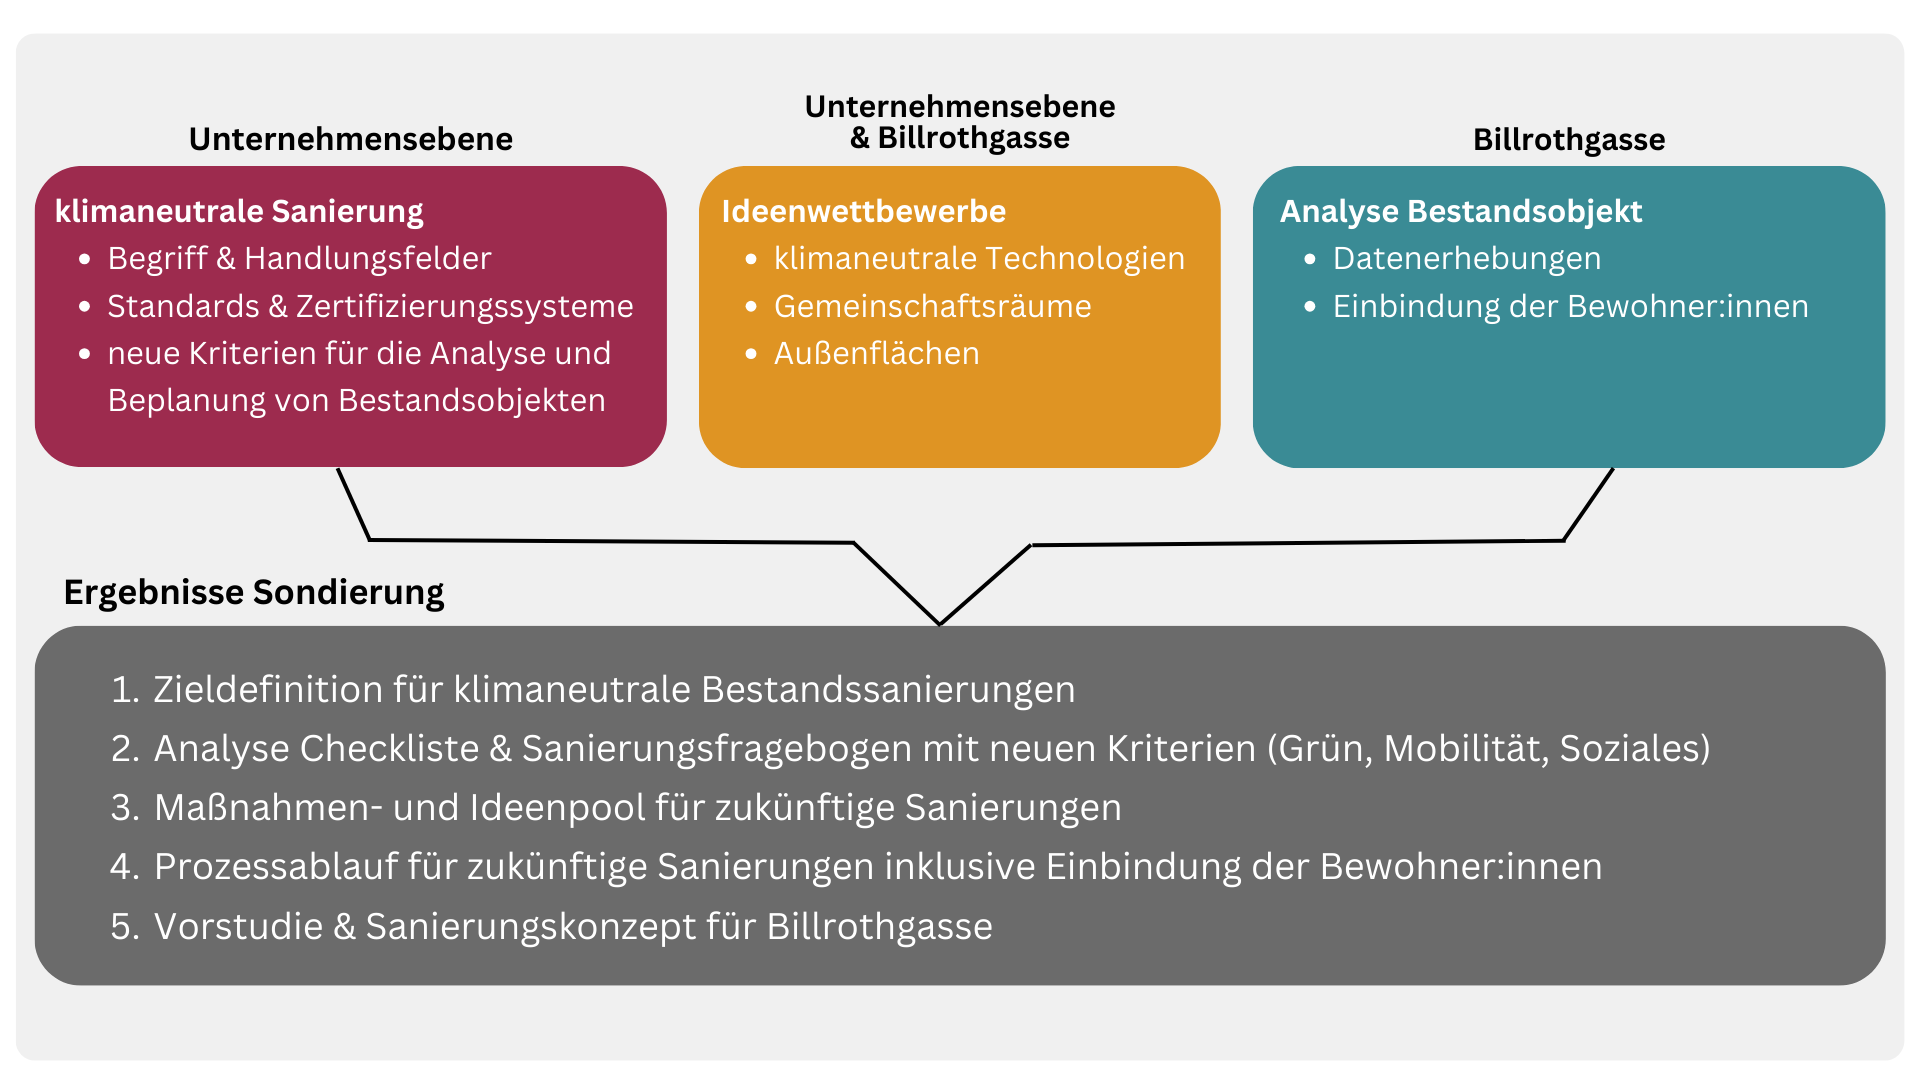
Big picture exploratory project "Gebäude als Reallabor für klimaneutrales, bedarfsgerechtes und leistbares Wohnen"
The illustration shows a big picture of the exploratory project "Gebäude als Reallabor für klimaneutrales, bedarfsgerechtes und leistbares Wohnen". The graphic shows the objectives and planned results of the exploratory project.
Copyright: StadtLABOR Innovationen für urbane Lebensqualität GmbH
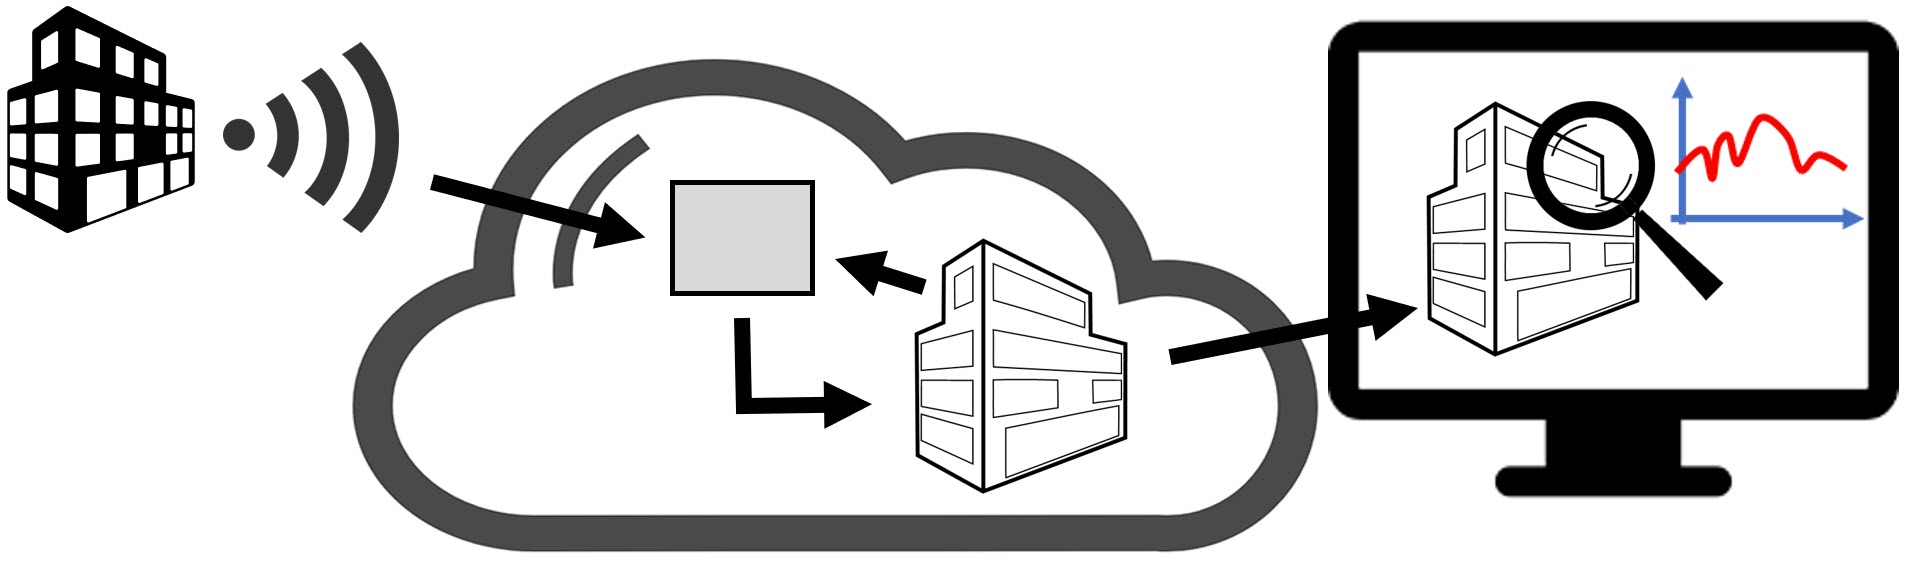
Graphic representation of a digital twin
Graphic representation of a digital twin connected to real-time metering data from a building. The digital twin runs in a cloud. With the so-called State Estimator, the simulation model is continuously adapted to the current measurement data from the building.
Copyright: EQUA
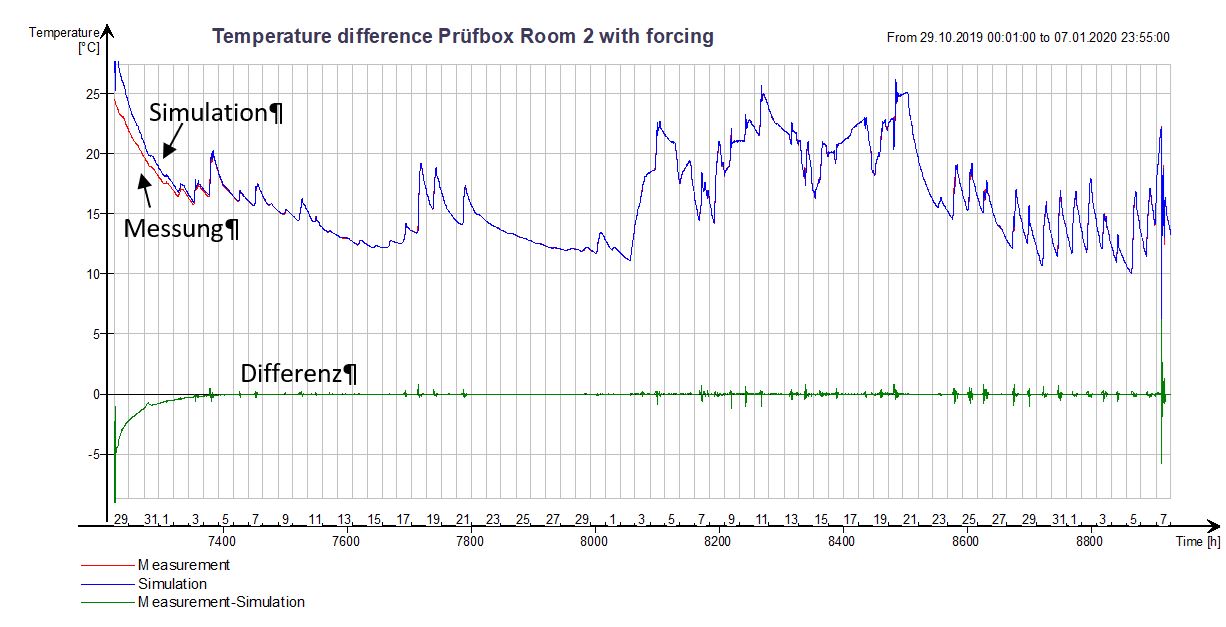
Time series with forcing terms
Time series of an experiment where the digital twin was adapted to the measurement data using forcing terms. At the beginning of the experiment, the measured and simulated temperatures do not yet match. After that, the differences between the two values are very small. See also other image showing the heat sources and sinks needed for this.
Copyright: EQUA
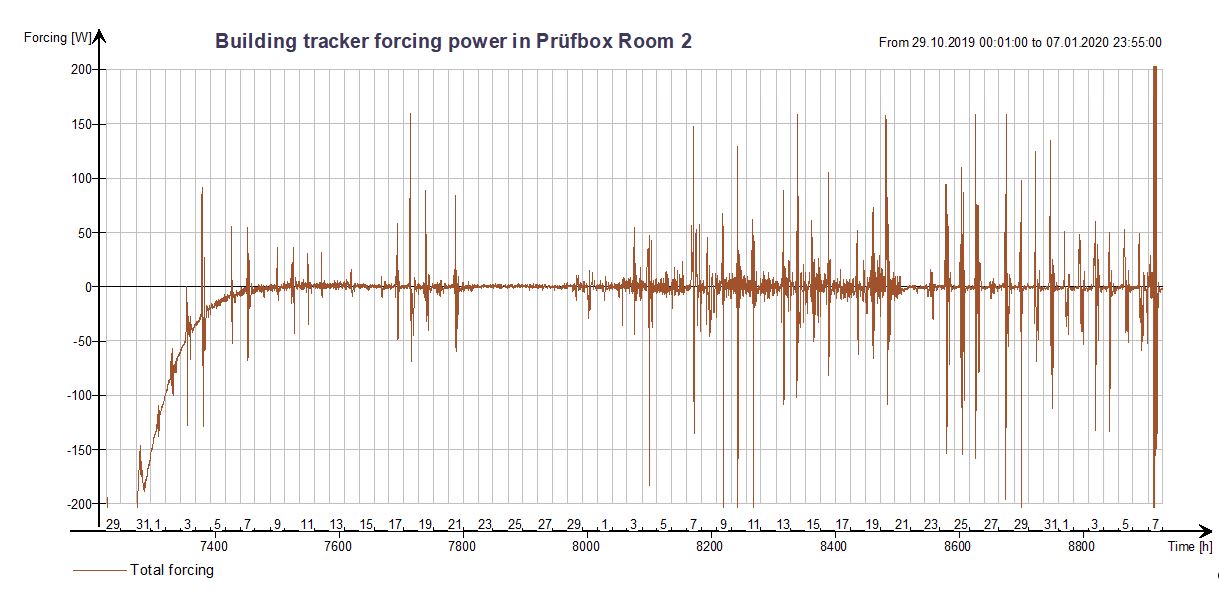
Calculated heat sources and sinks for the digital twin
Time series of an experiment where the digital twin was fitted to the measurement data using forcing terms. The graphic shows the required "Forcing Terms" = heat sources and sinks. See also the other graph with the associated measured and simulated temperatures during the experiment.
Copyright: EQUA

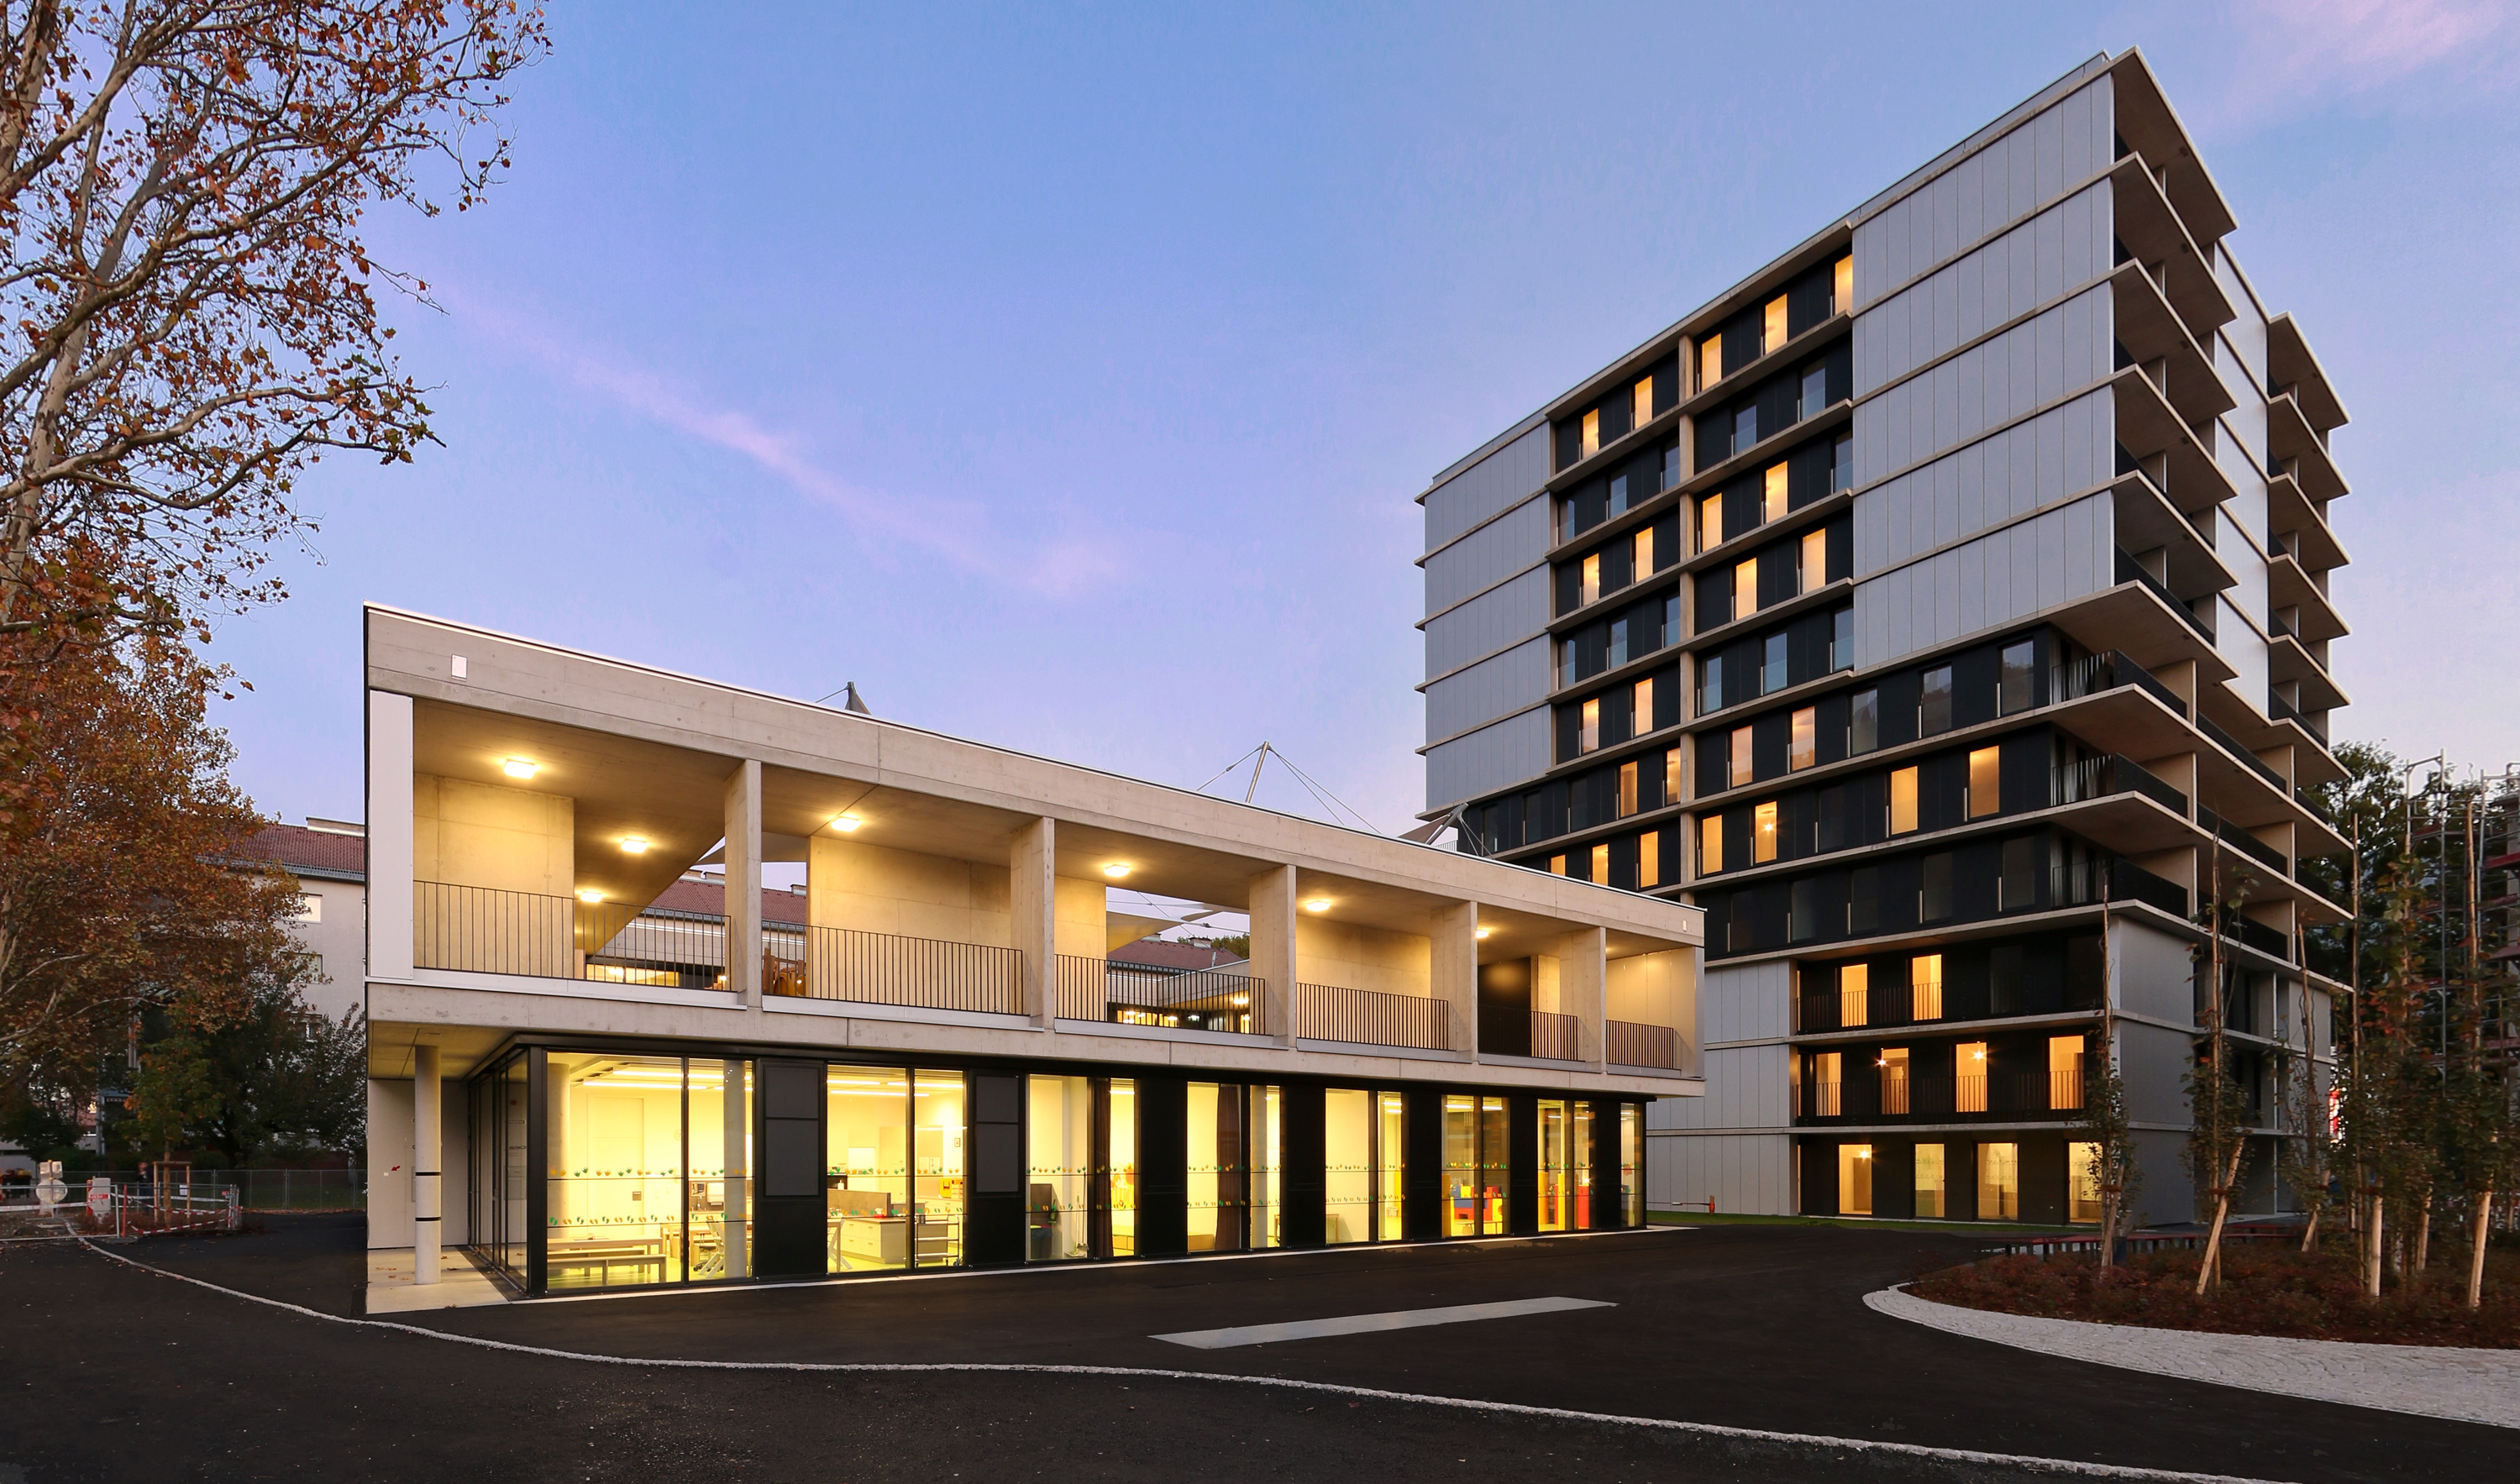
Façade office building H2
View of the facade of the H2 office building in Vienna, where a digital twin of a cooling system and a model floor was tested.
Copyright: AEE INTEC

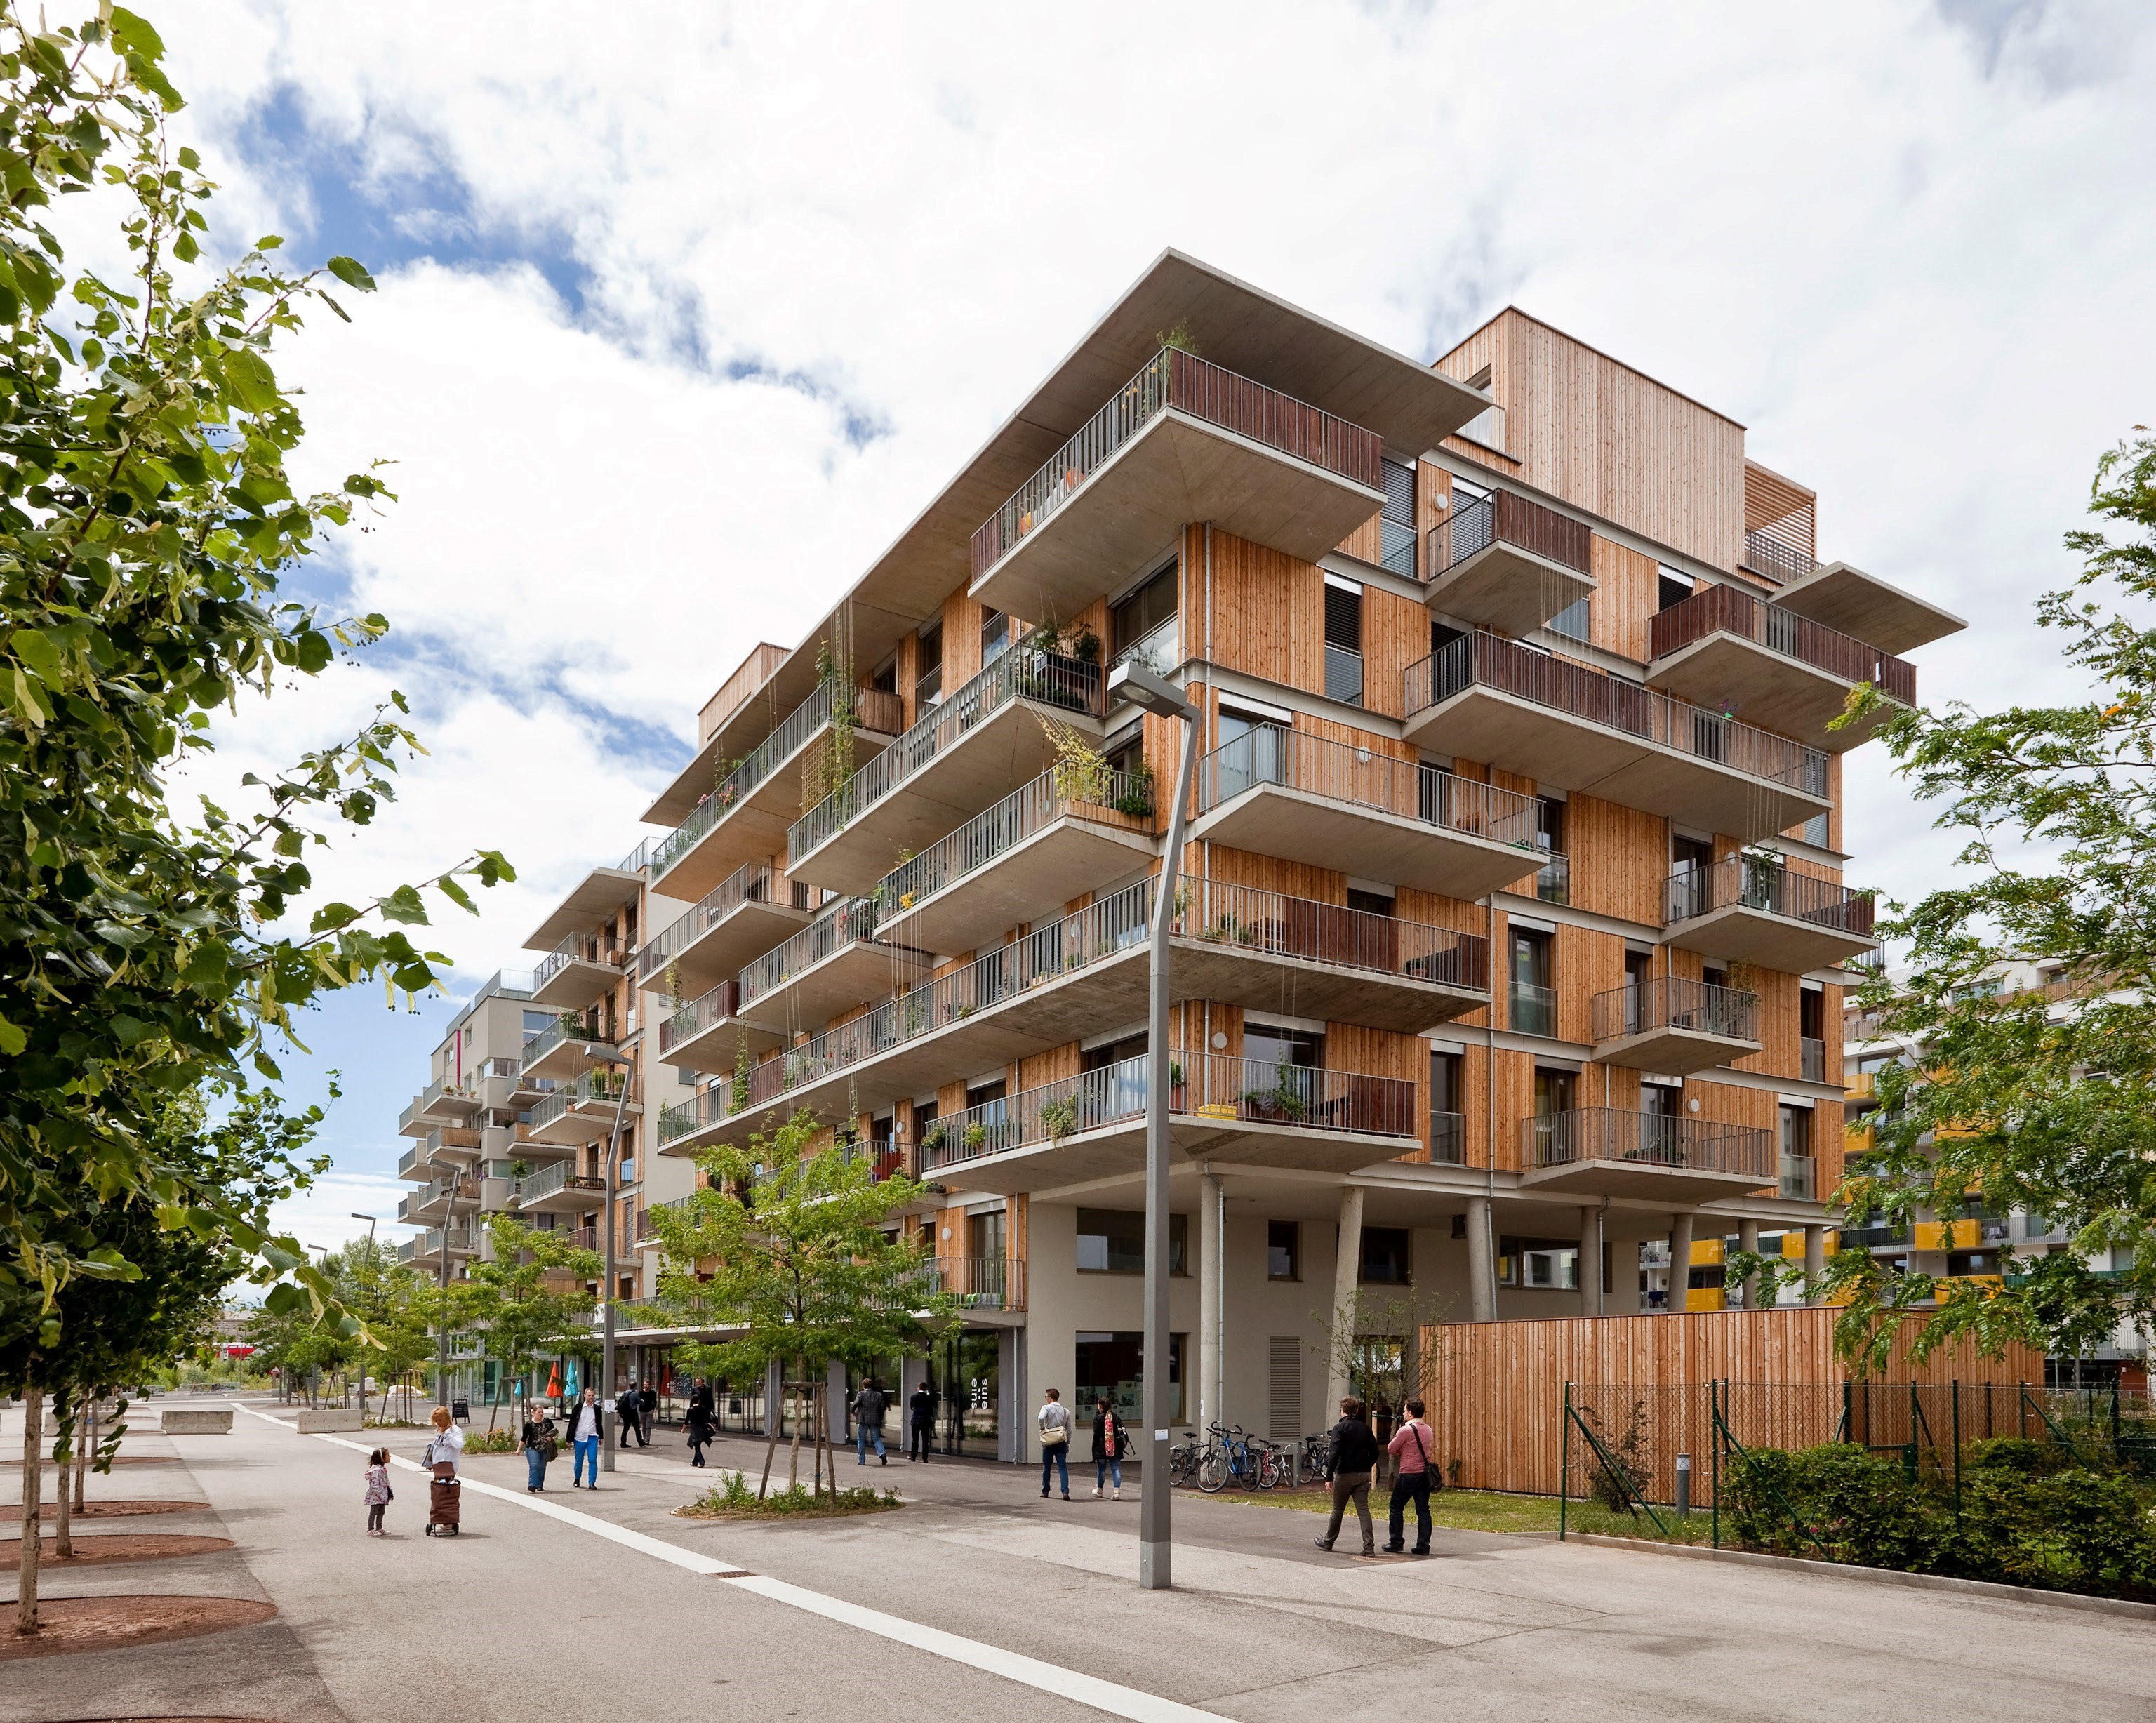
residential building St. Paulus
residential building St. Paulus
Copyright: NEUE HEIMAT TIROL Gemeinnützige WohnungsGmbH

residential building St. Paulus, northwest view
residential building St. Paulus, northwest view
Copyright: NEUE HEIMAT TIROL Gemeinnützige WohnungsGmbH

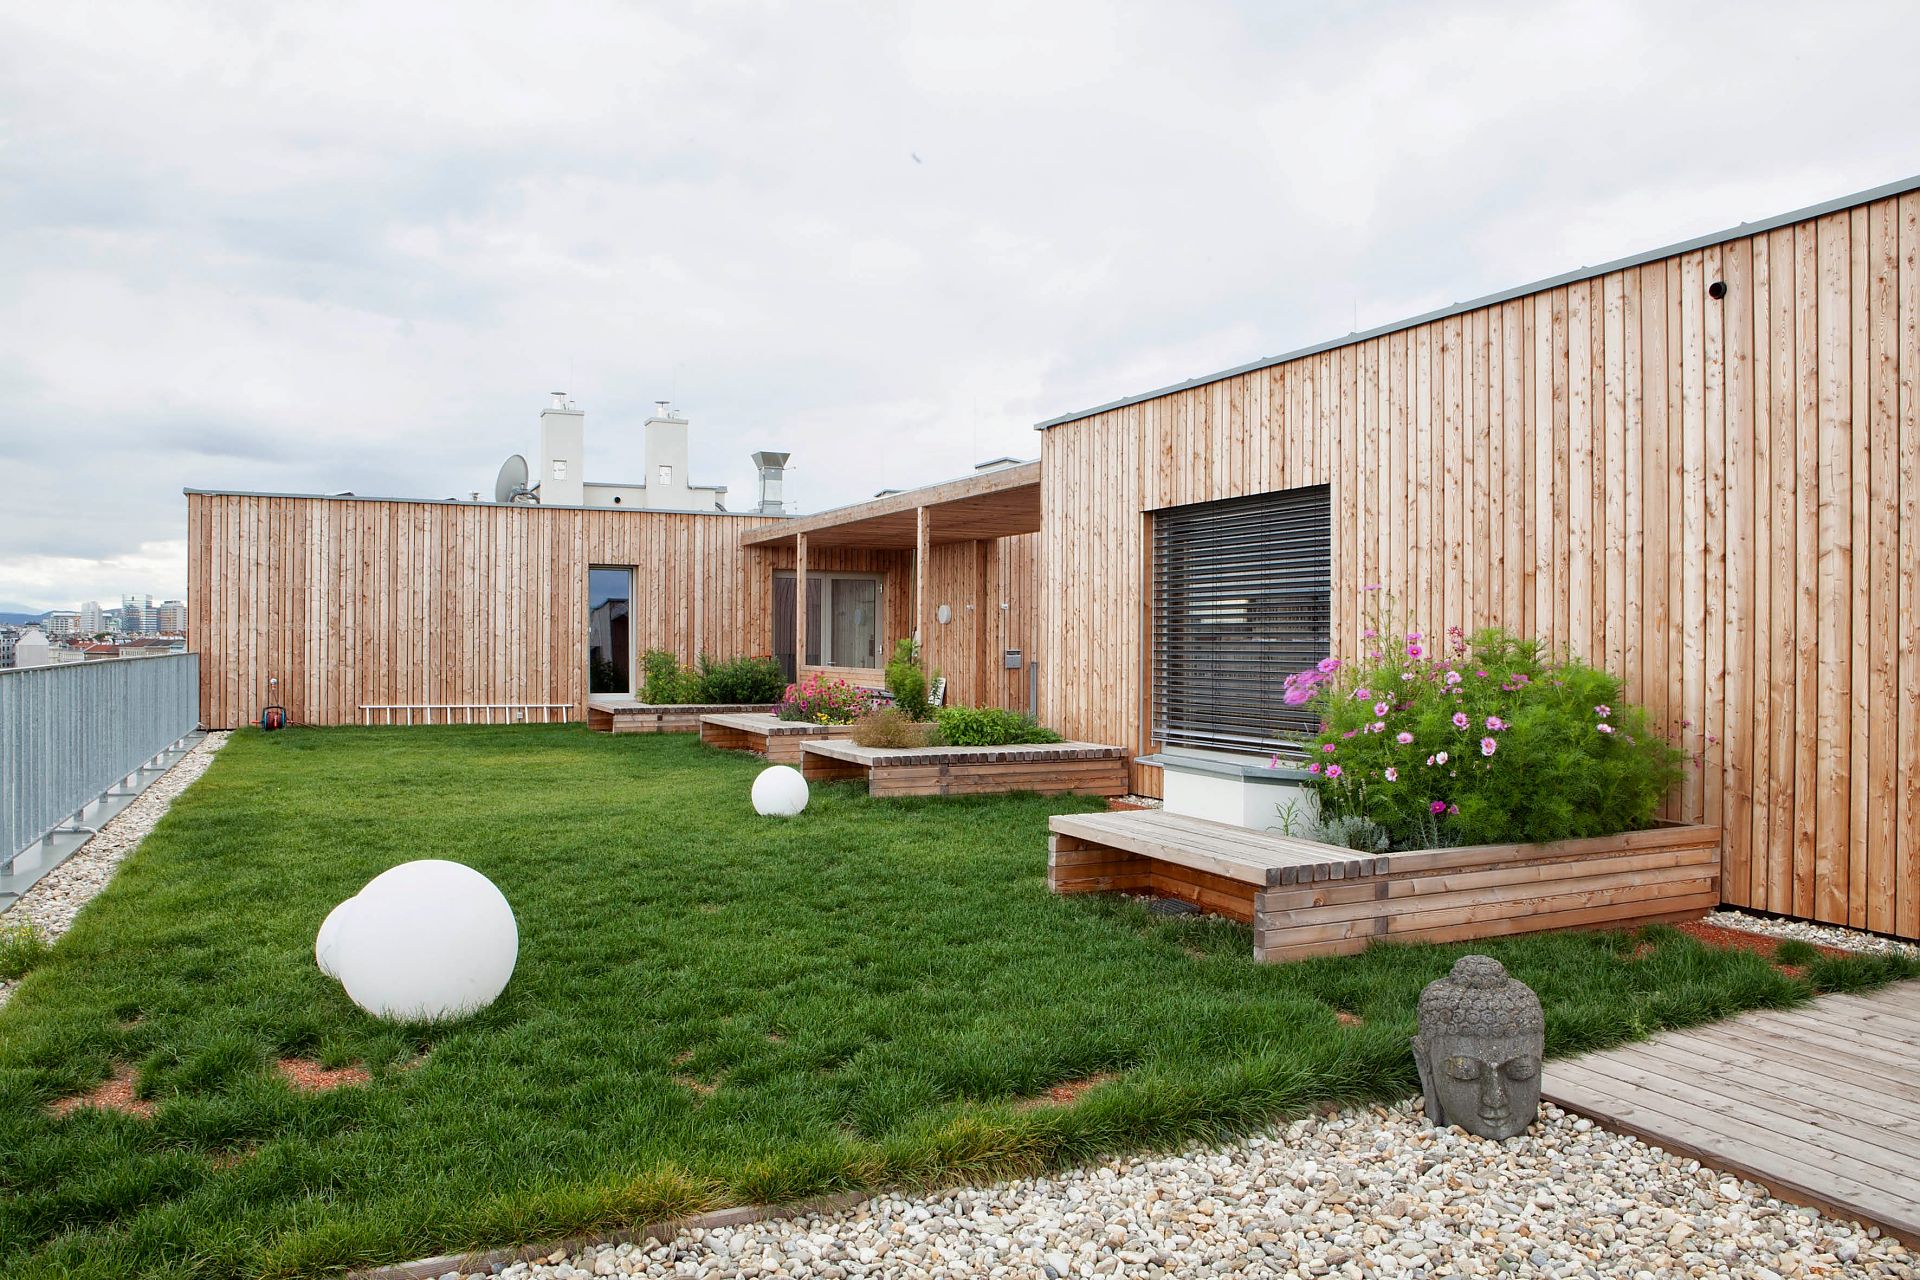
view from the roof terrace, north-east view
view from the roof terrace, north-east view