Project Image Pool
There are 414 results.
Terms of use: The pictures on this site originate from the projects in the frame of the programmes City of Tomorrow, Building of Tomorrow and the IEA Research Cooperation. They may be used credited for non-commercial purposes under the Creative Commons License Attribution-NonCommercial (CC BY-NC).
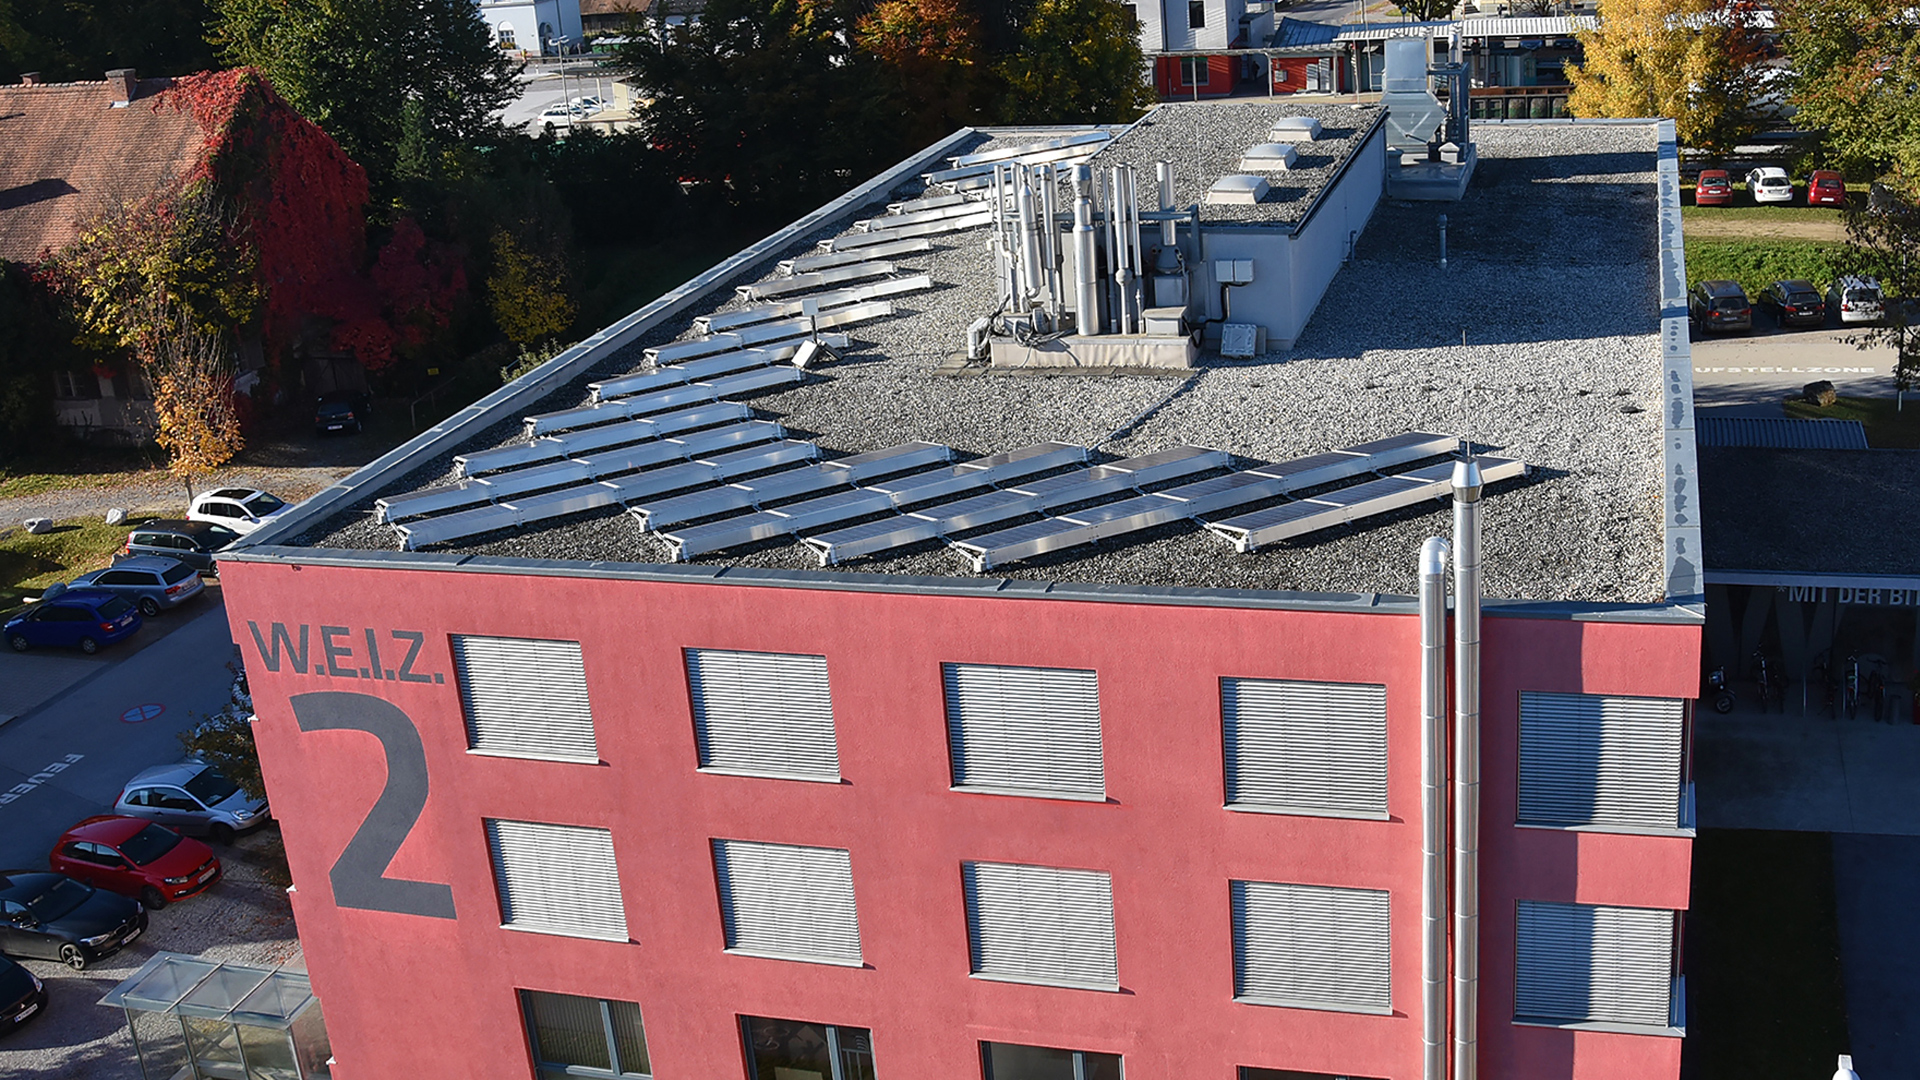
Photovoltaic on the roof of the building W.E.I.Z. 2
20kWp PV-plant on the roof of the building W.E.I.Z. 2.
Copyright: Innovationszentrum W.E.I.Z.


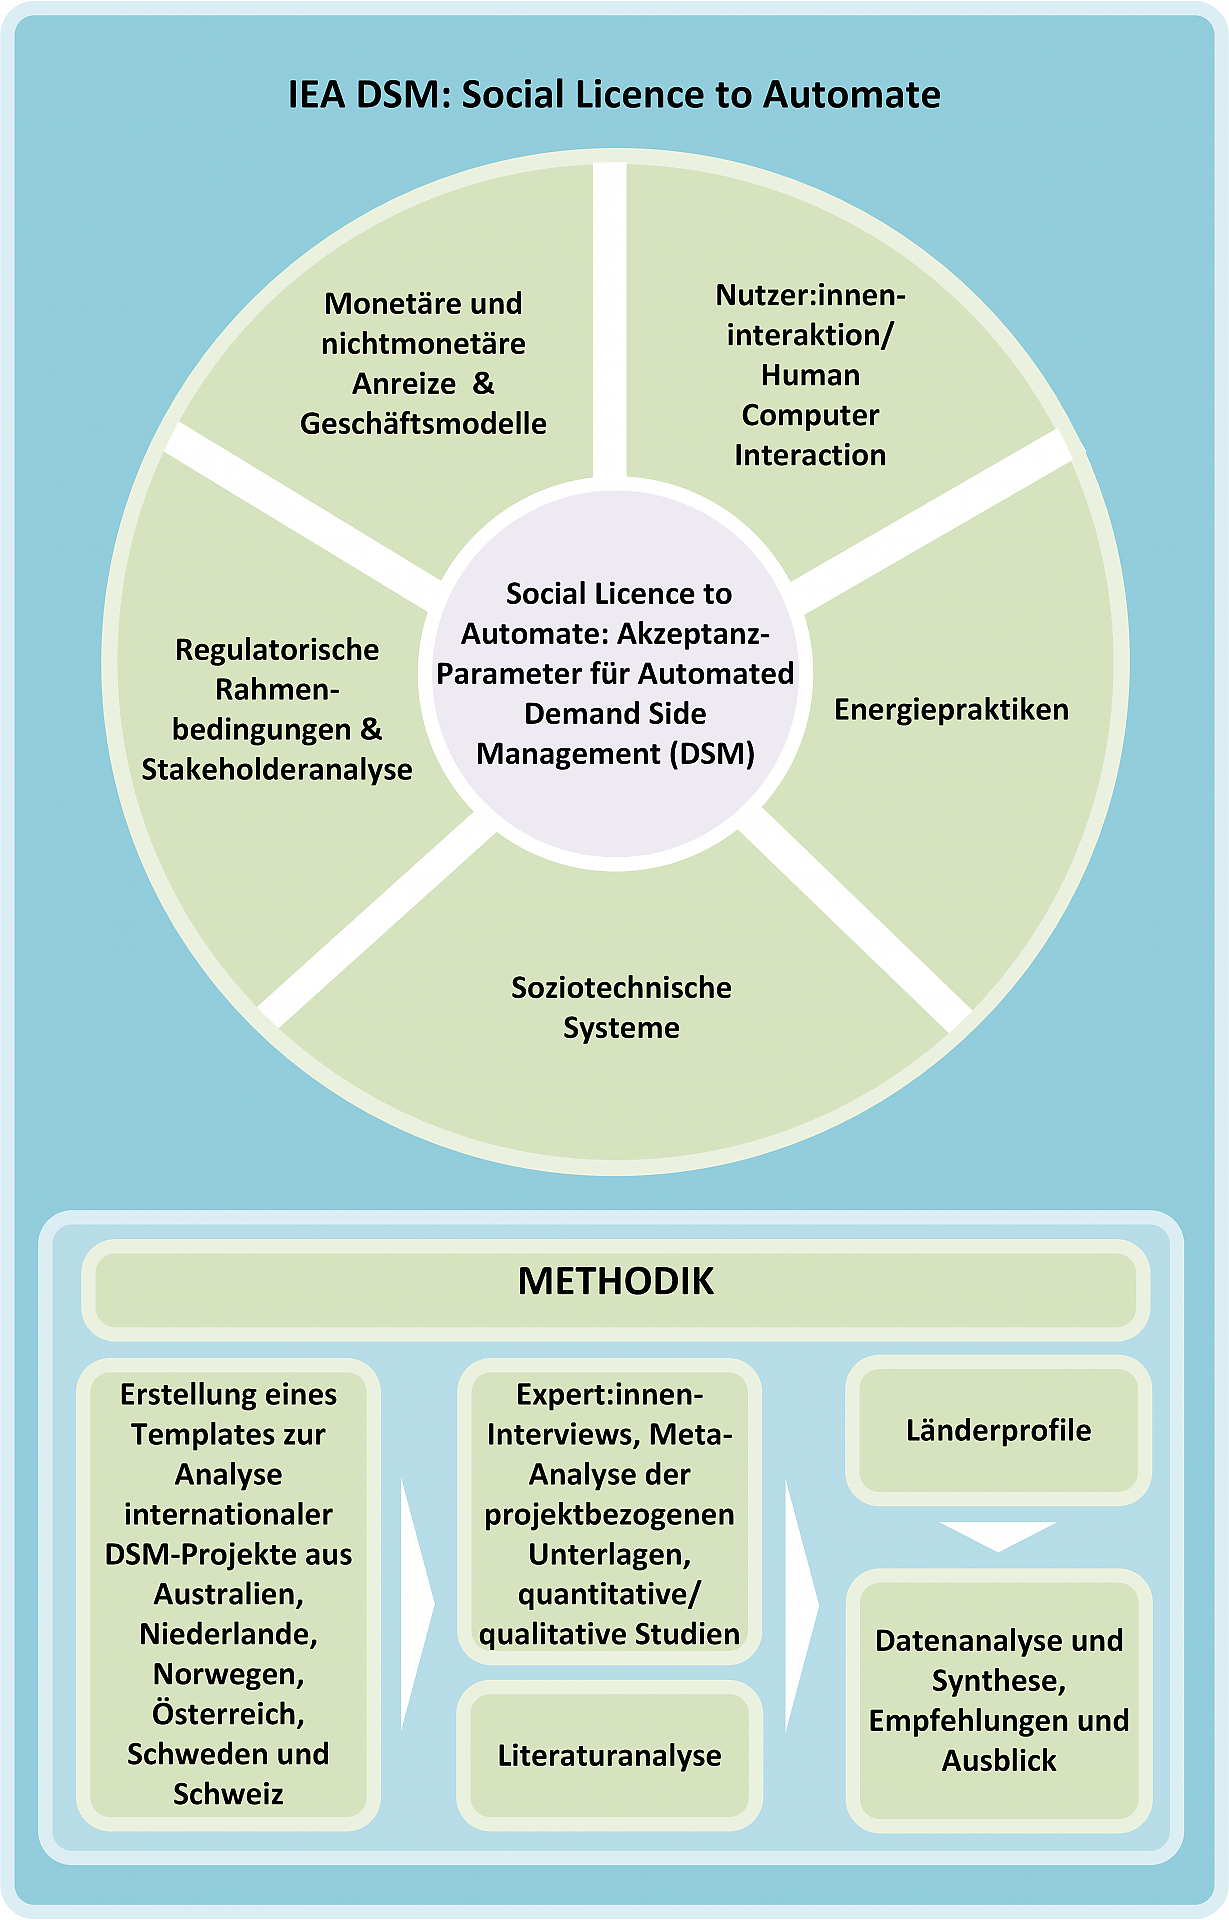
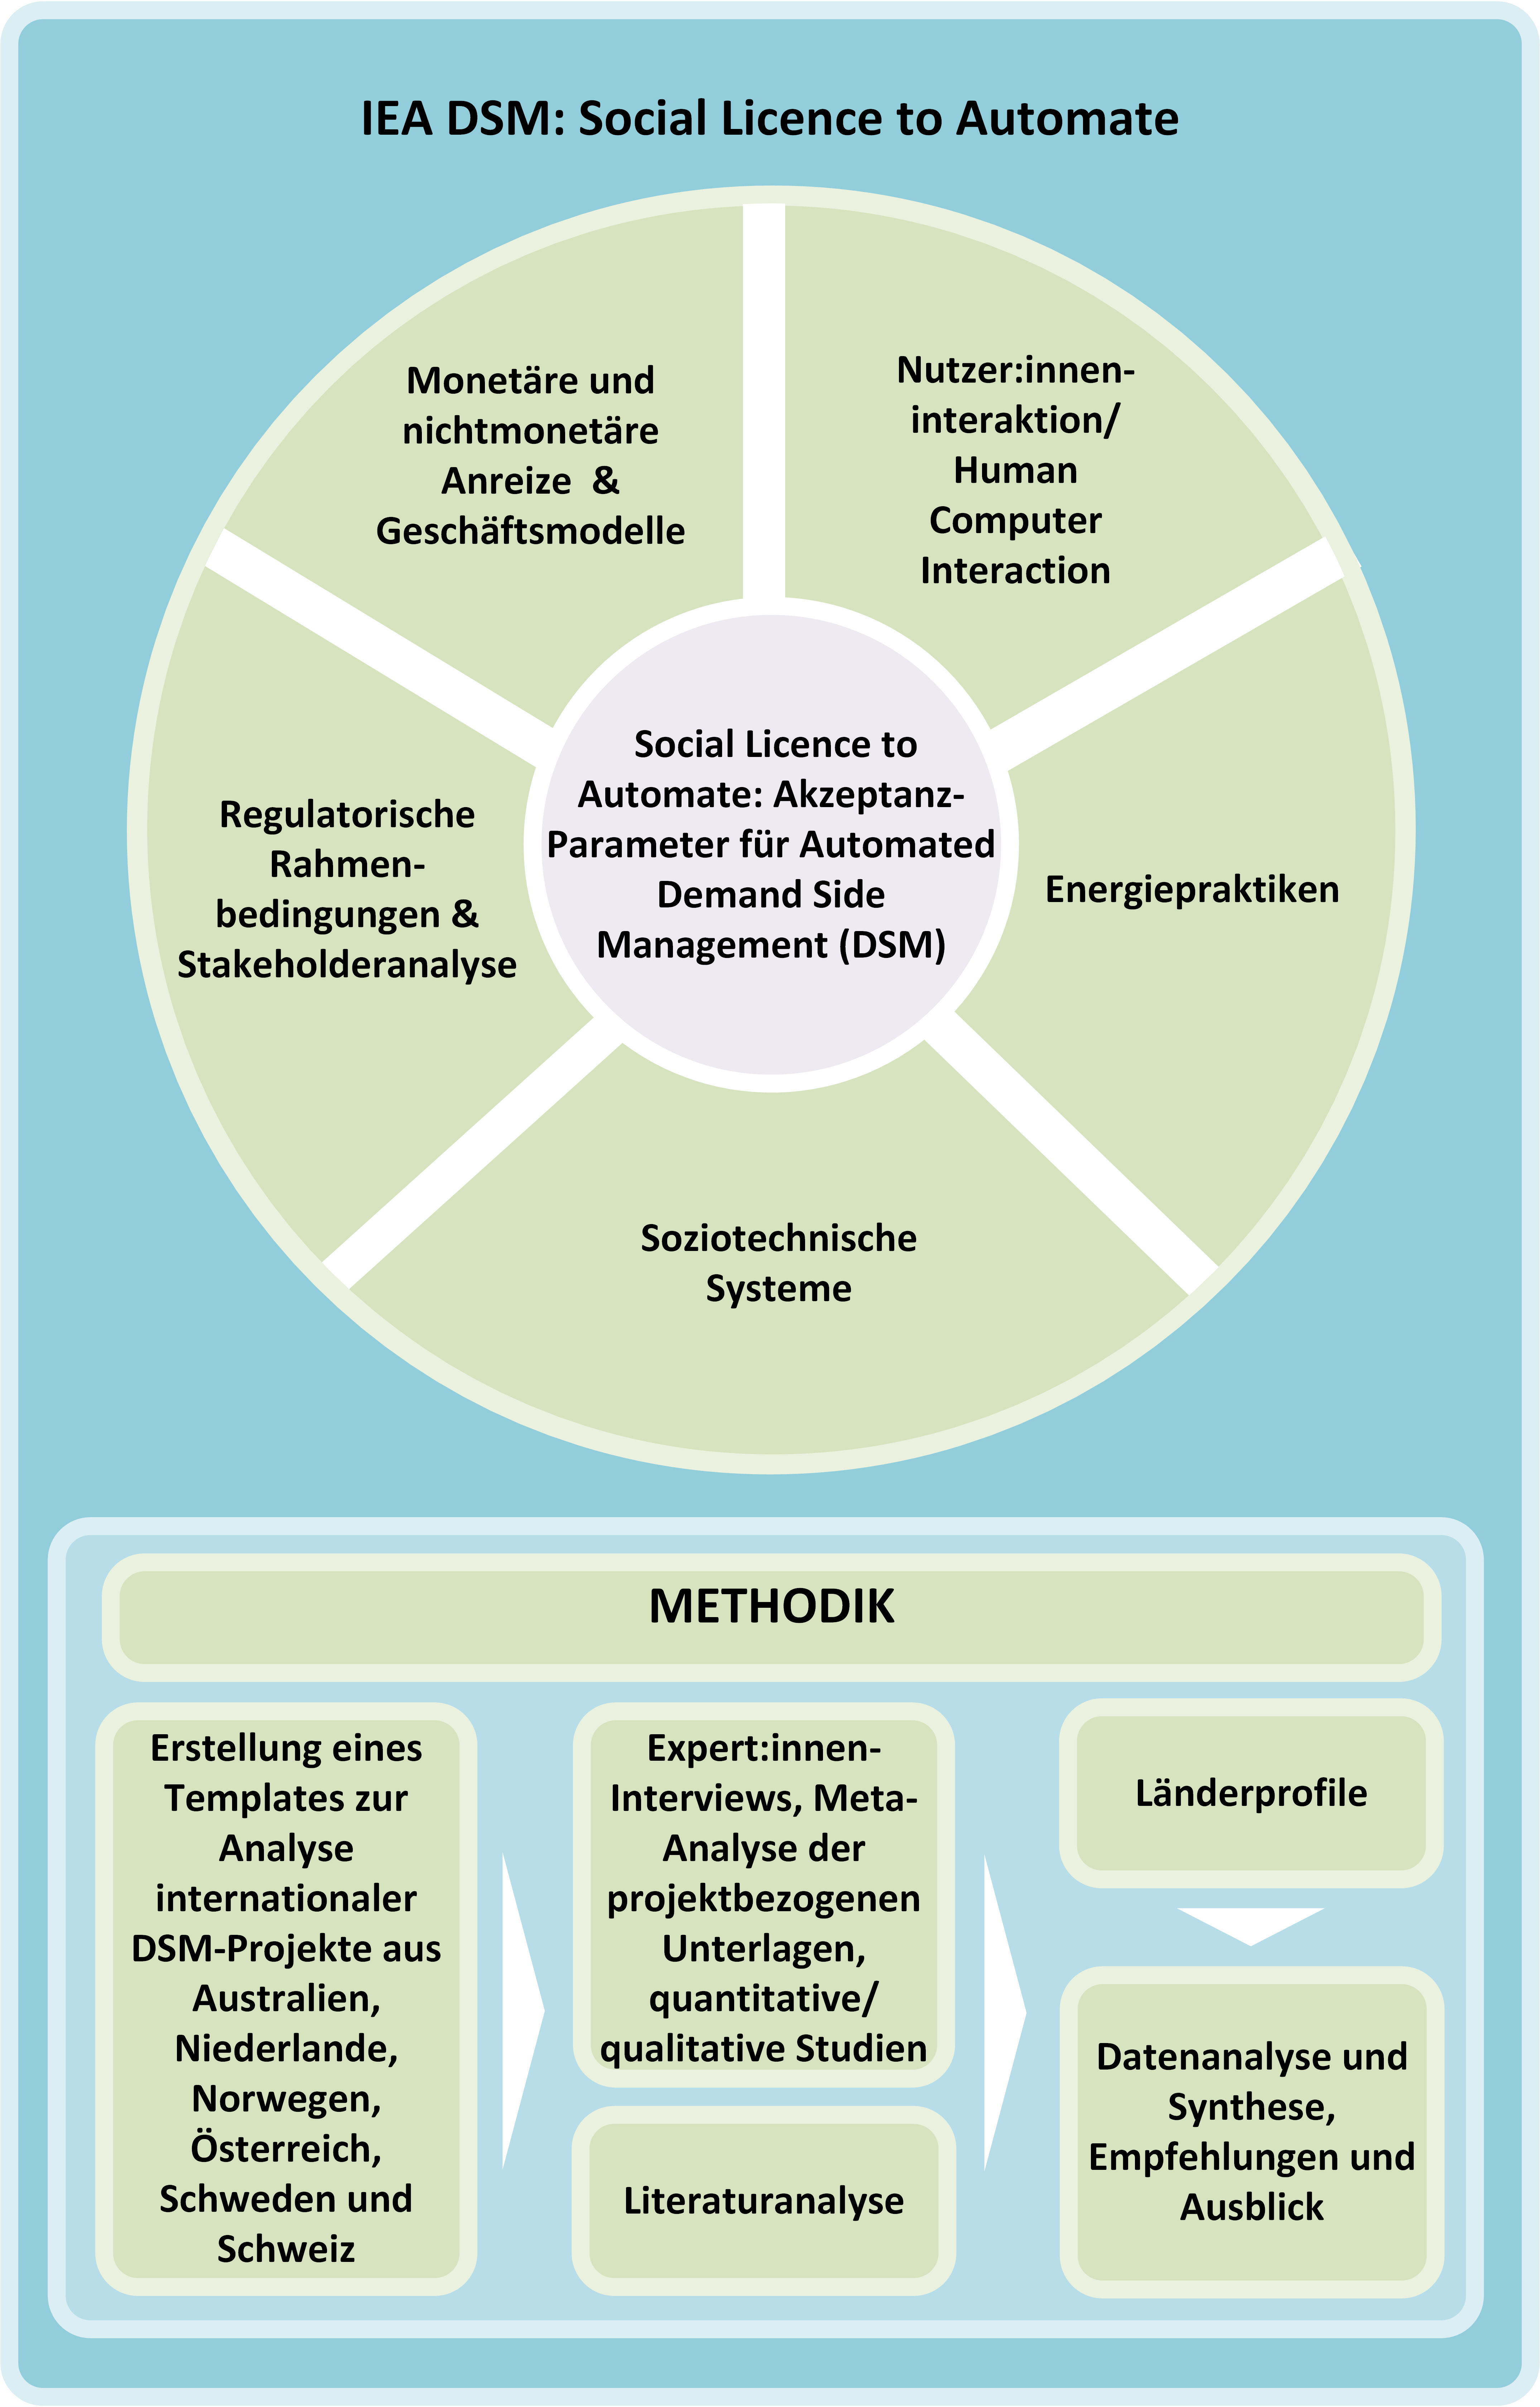
Project Overview
This diagram shows the topics that were considered in the context of the project "Social License to Automate". Furthermore, an overview of the methodology is given.
Copyright: AIT Austrian Institute of Technology GmbH

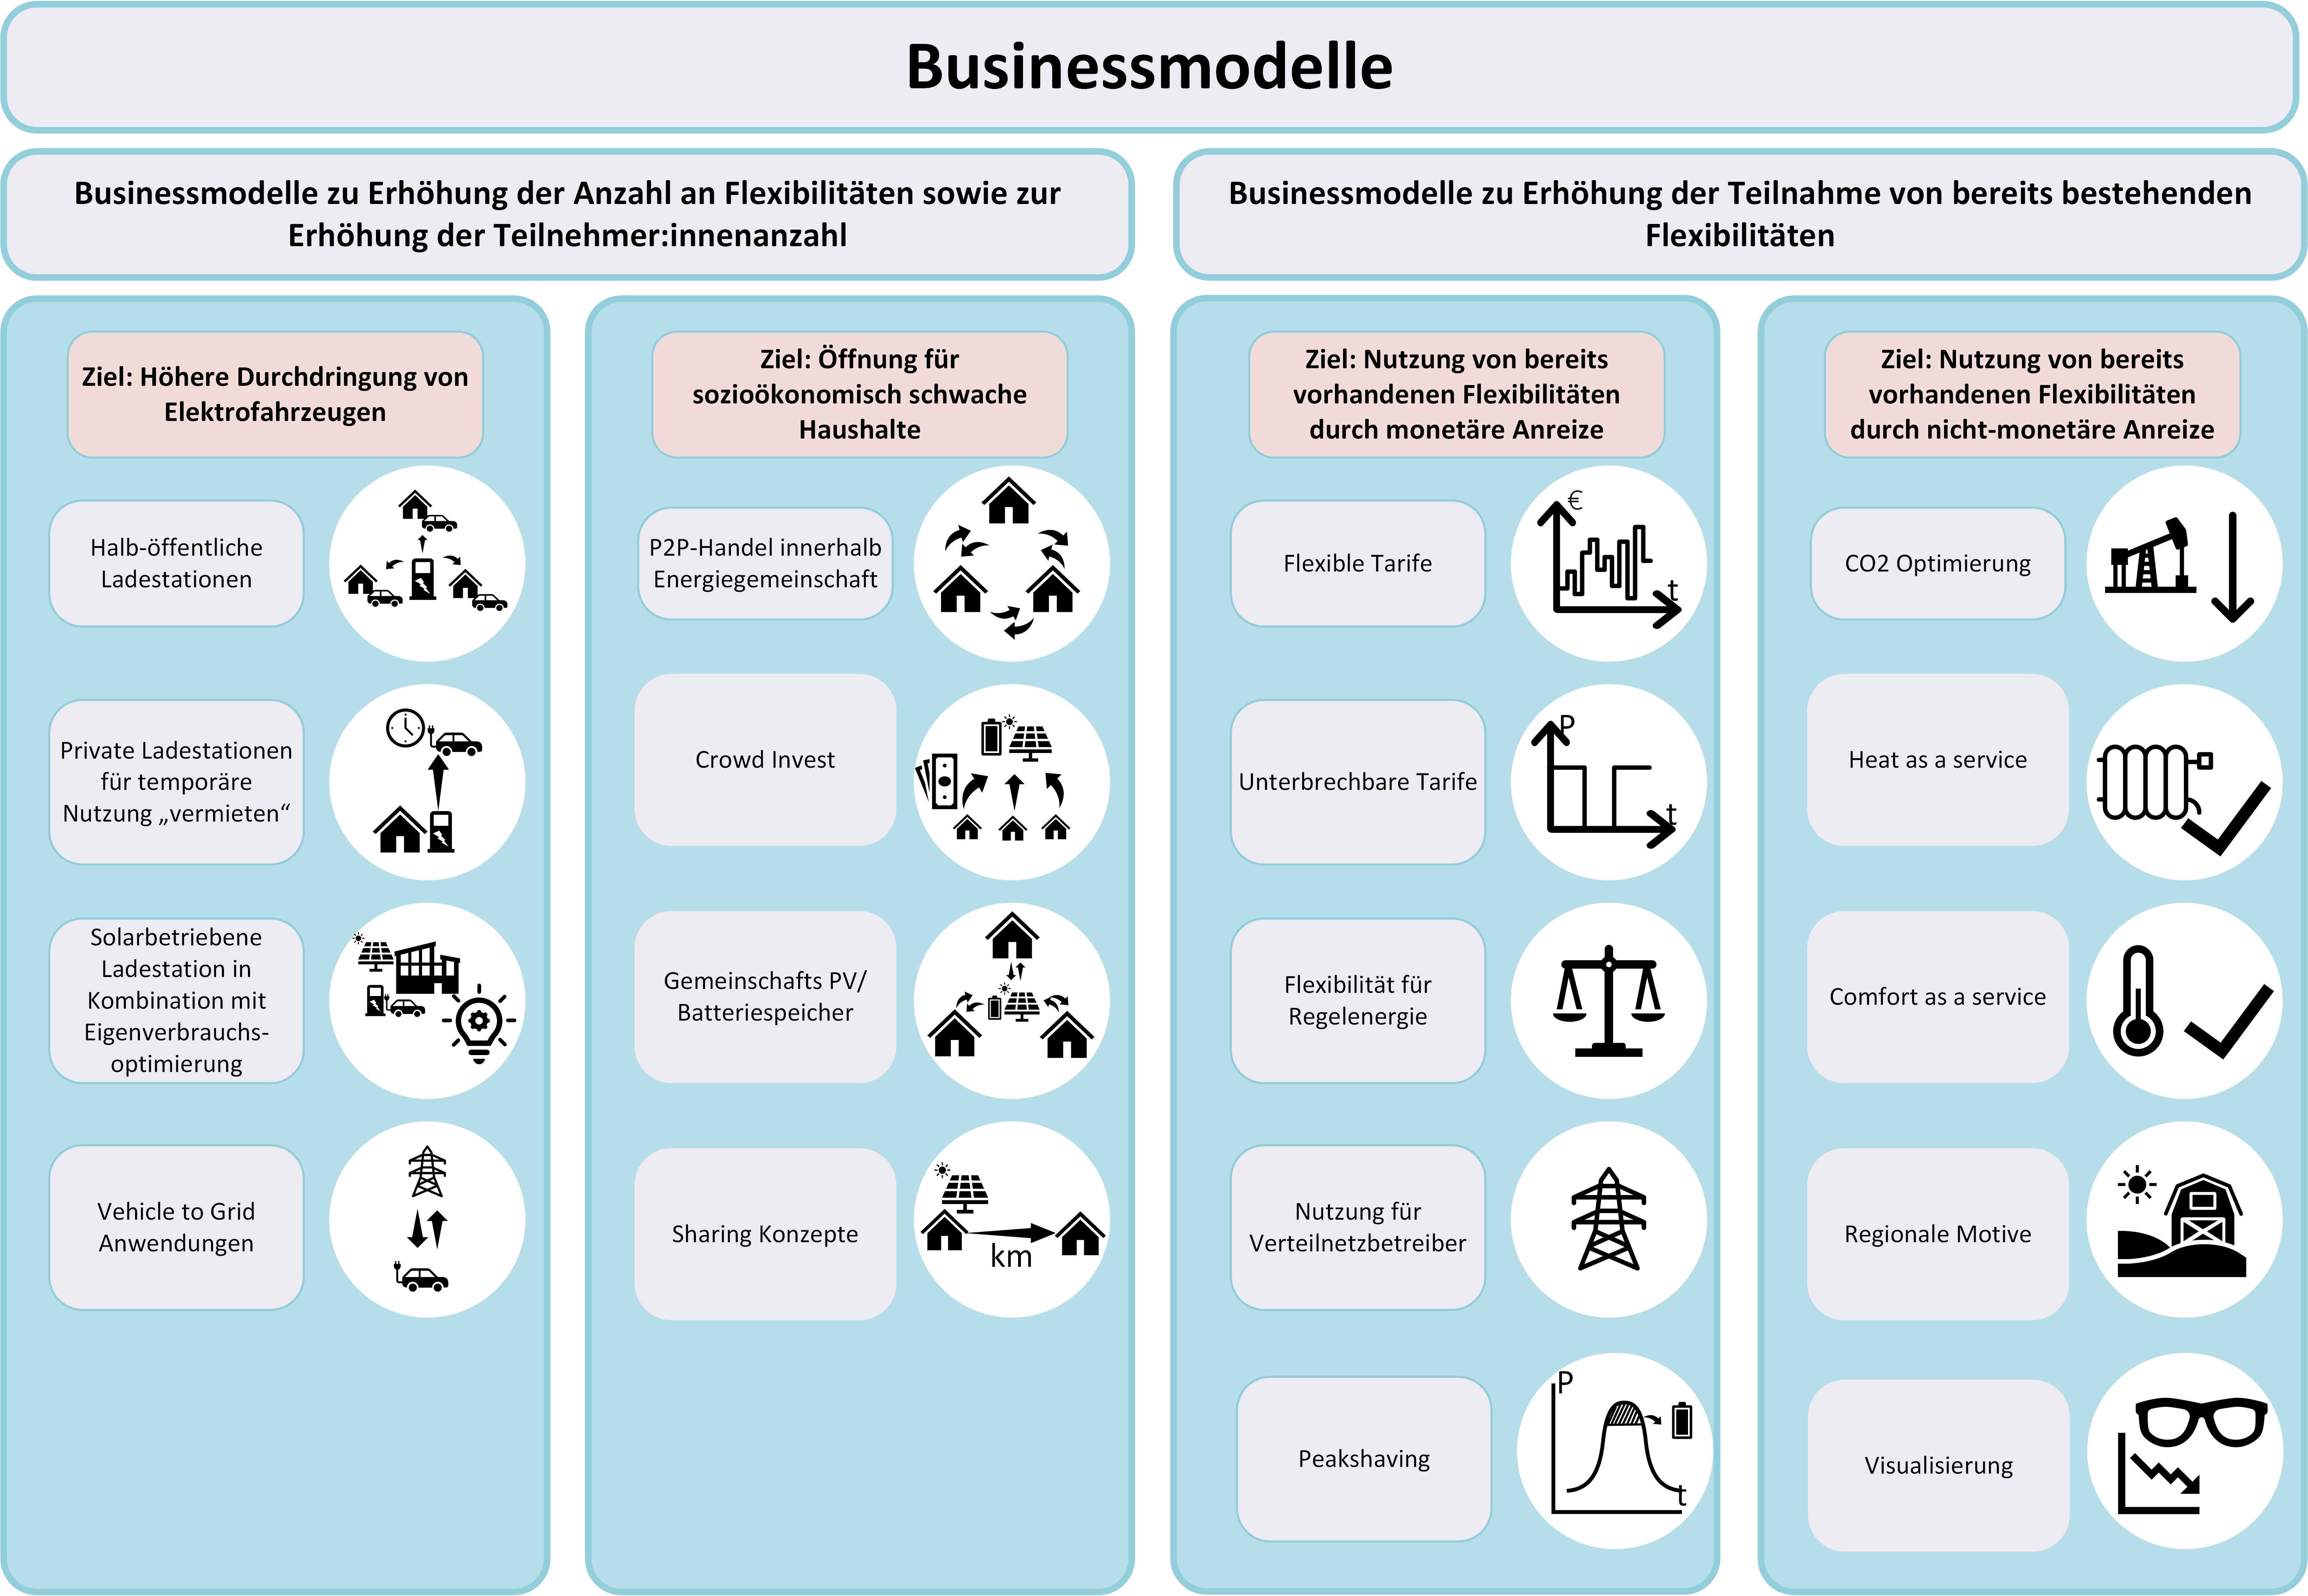
Business models
This figure gives an overview of the business models that were considered in the context of the project on various issues related to Demand Side Management (DSM). A more detailed description of the individual models can be found in the final report.
Copyright: AIT Austrian Institute of Technology GmbH
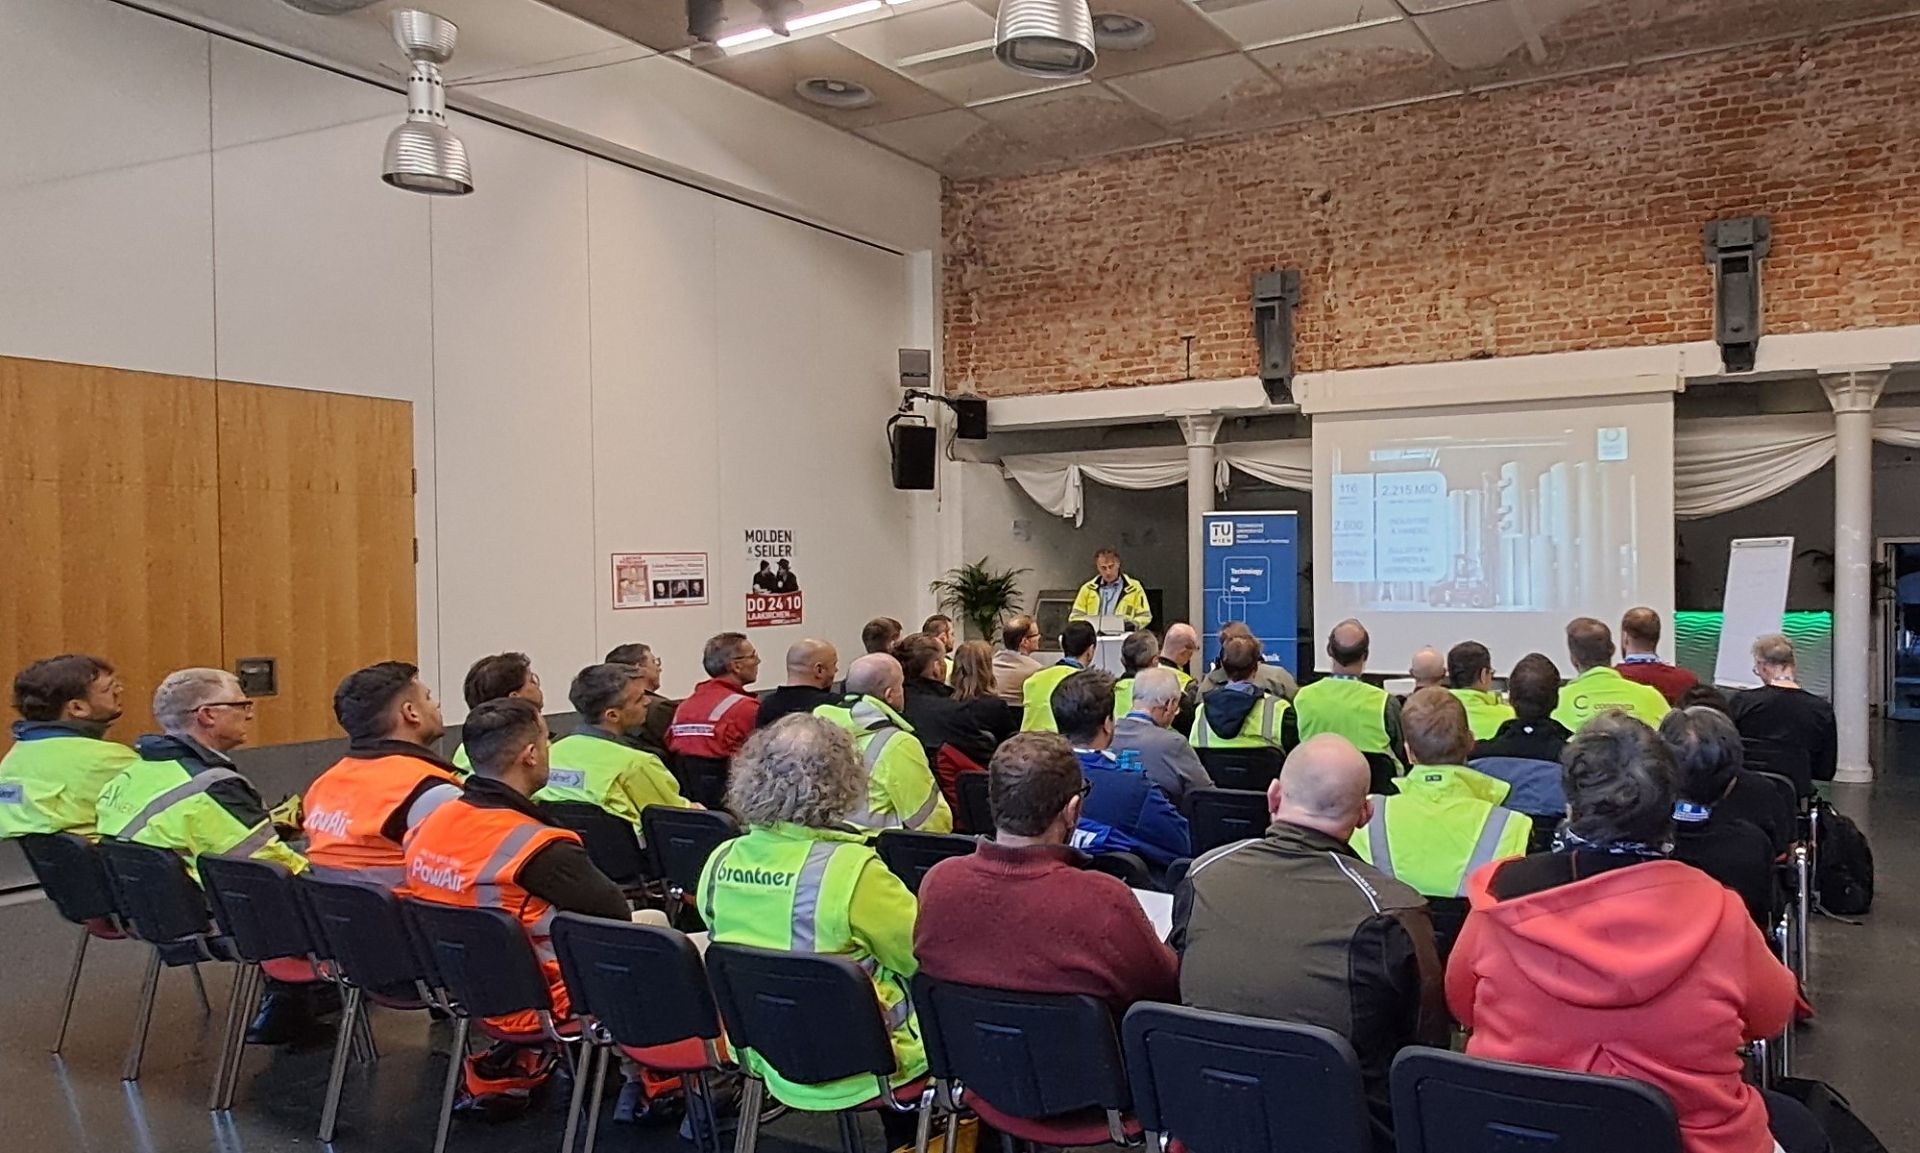
Information exchange before the visit of the fluidized bed unit
Information exchange before visiting the fluidized bed unit of heinzelpaper during the 14th Austrian IEA Fluidized Bed Meeting.
Copyright: TU Wien

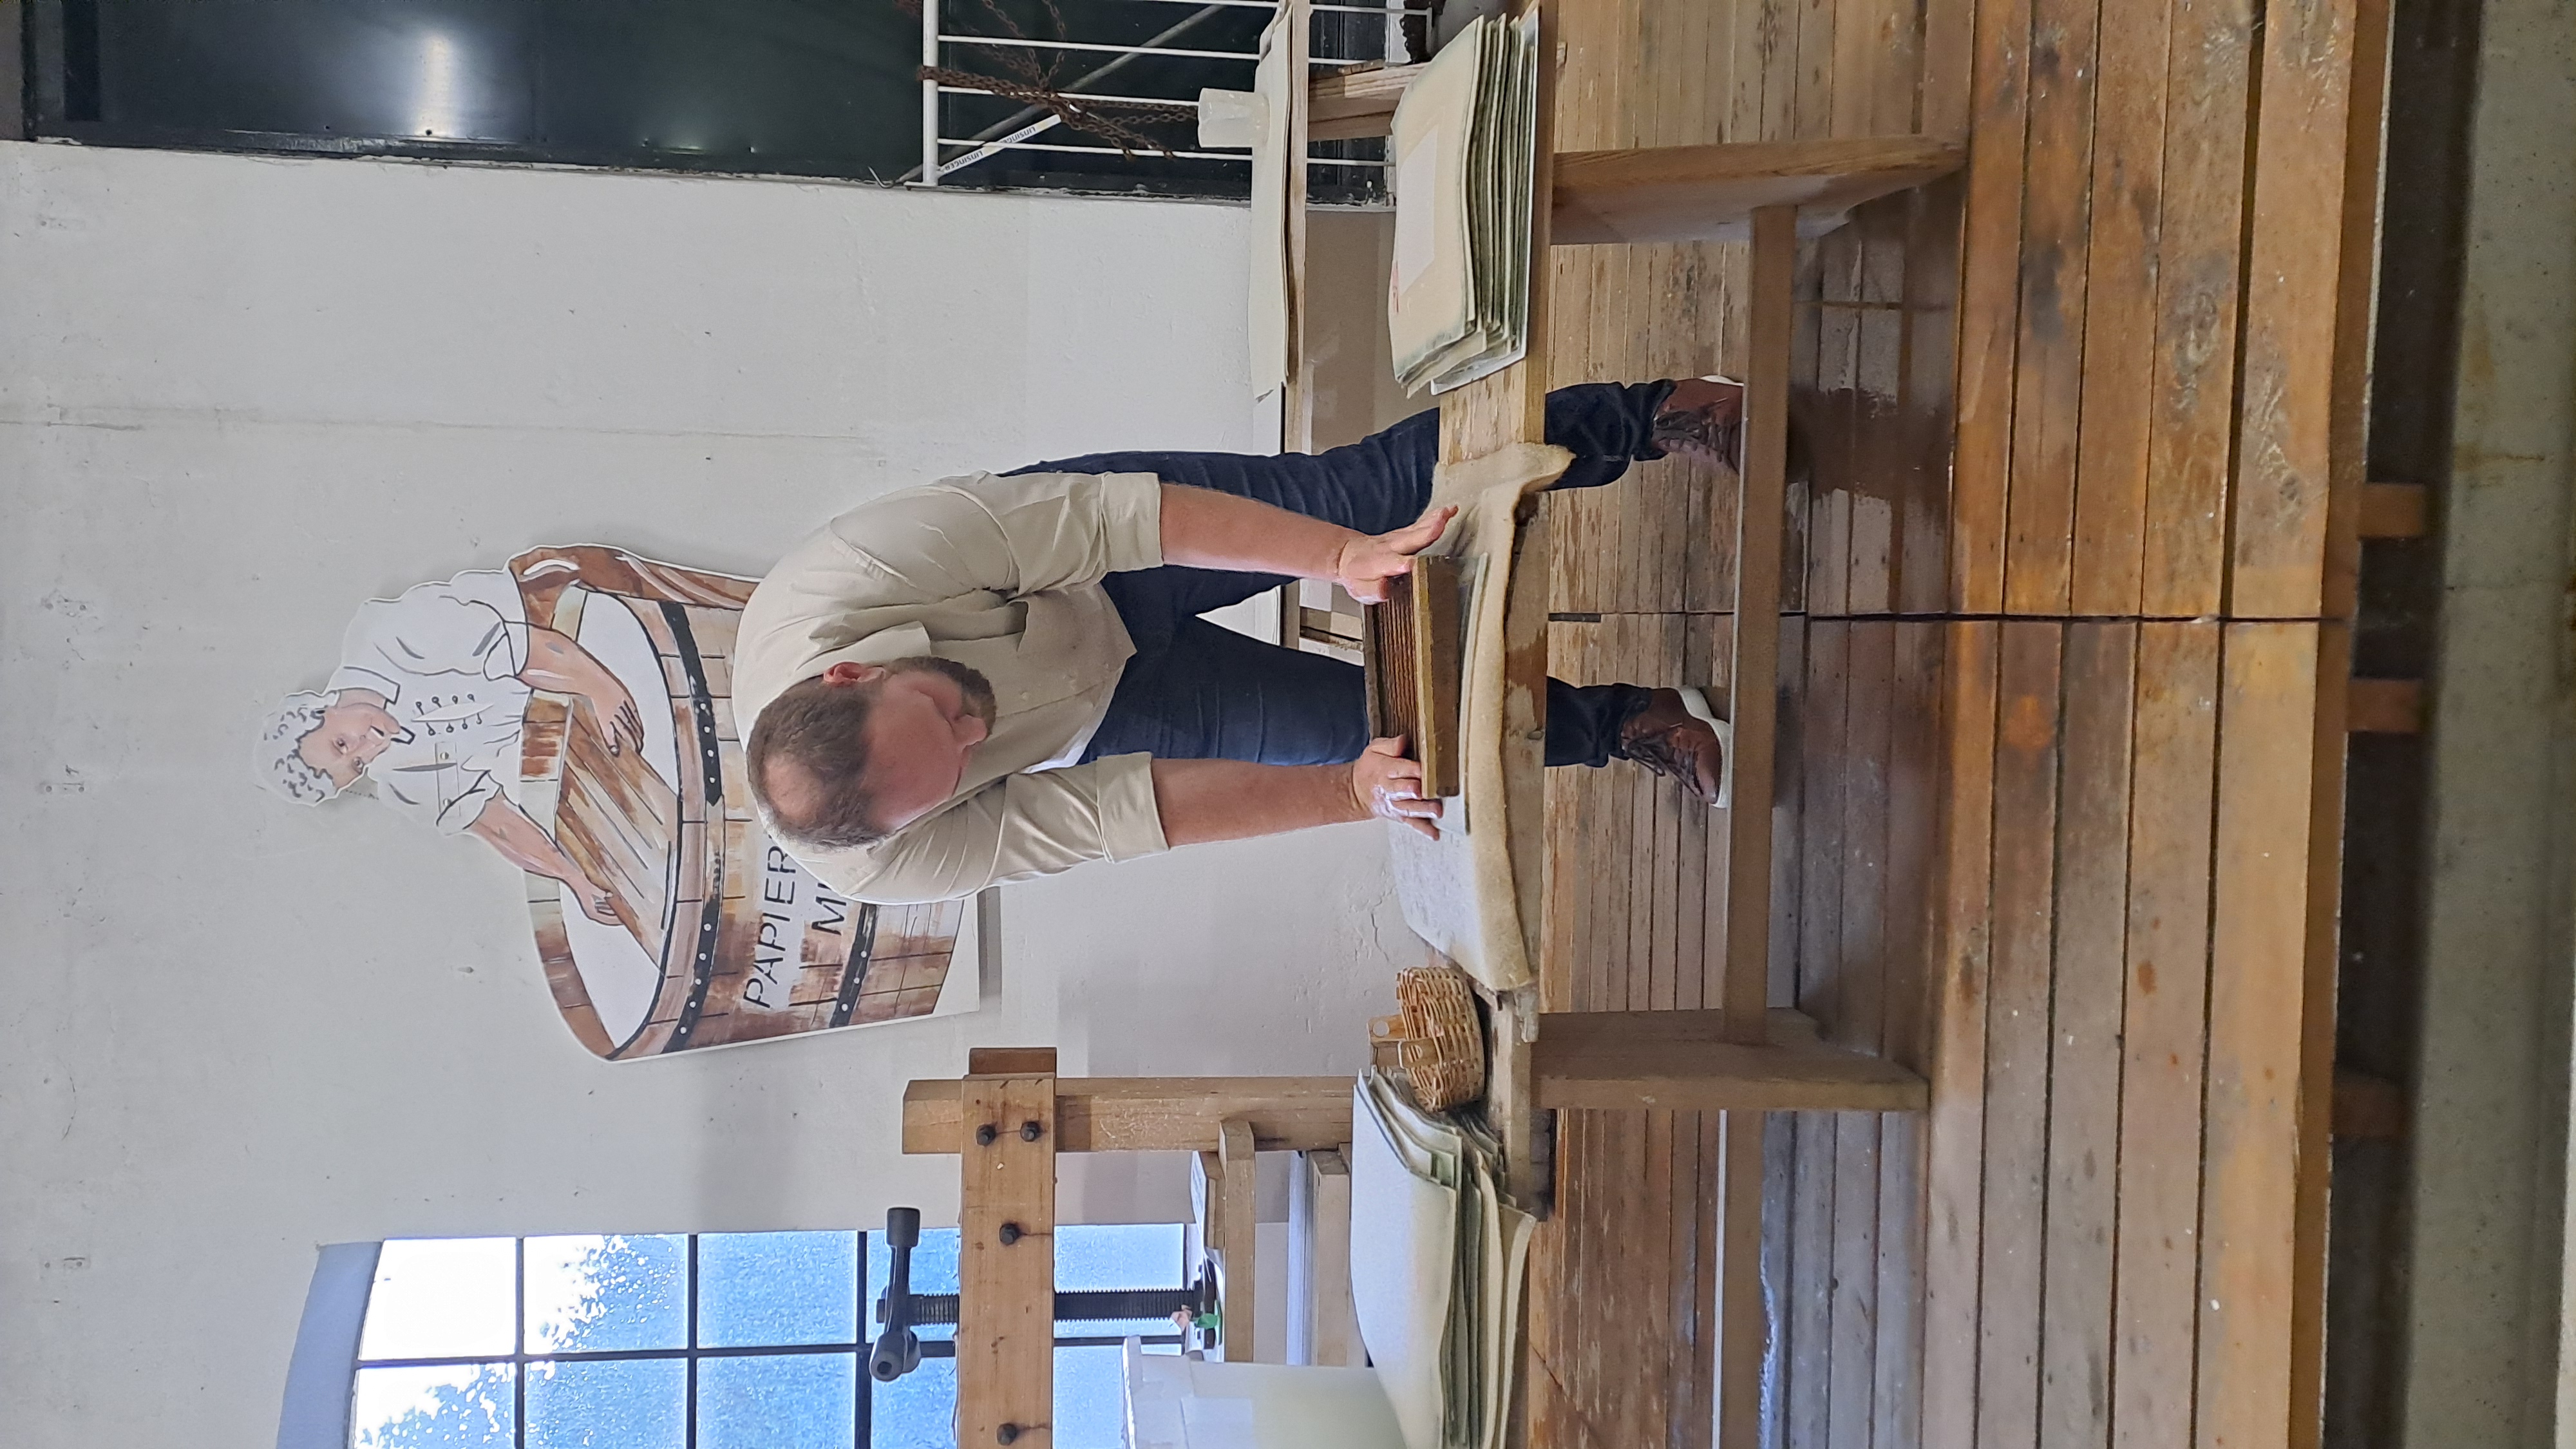
Visit of the museum for paper production
Visit of the museum for paper production Laakirchen during the 14th Austrian IEA Fluidized Bed Meeting and the manuel production of paper.
Copyright: TU Wien
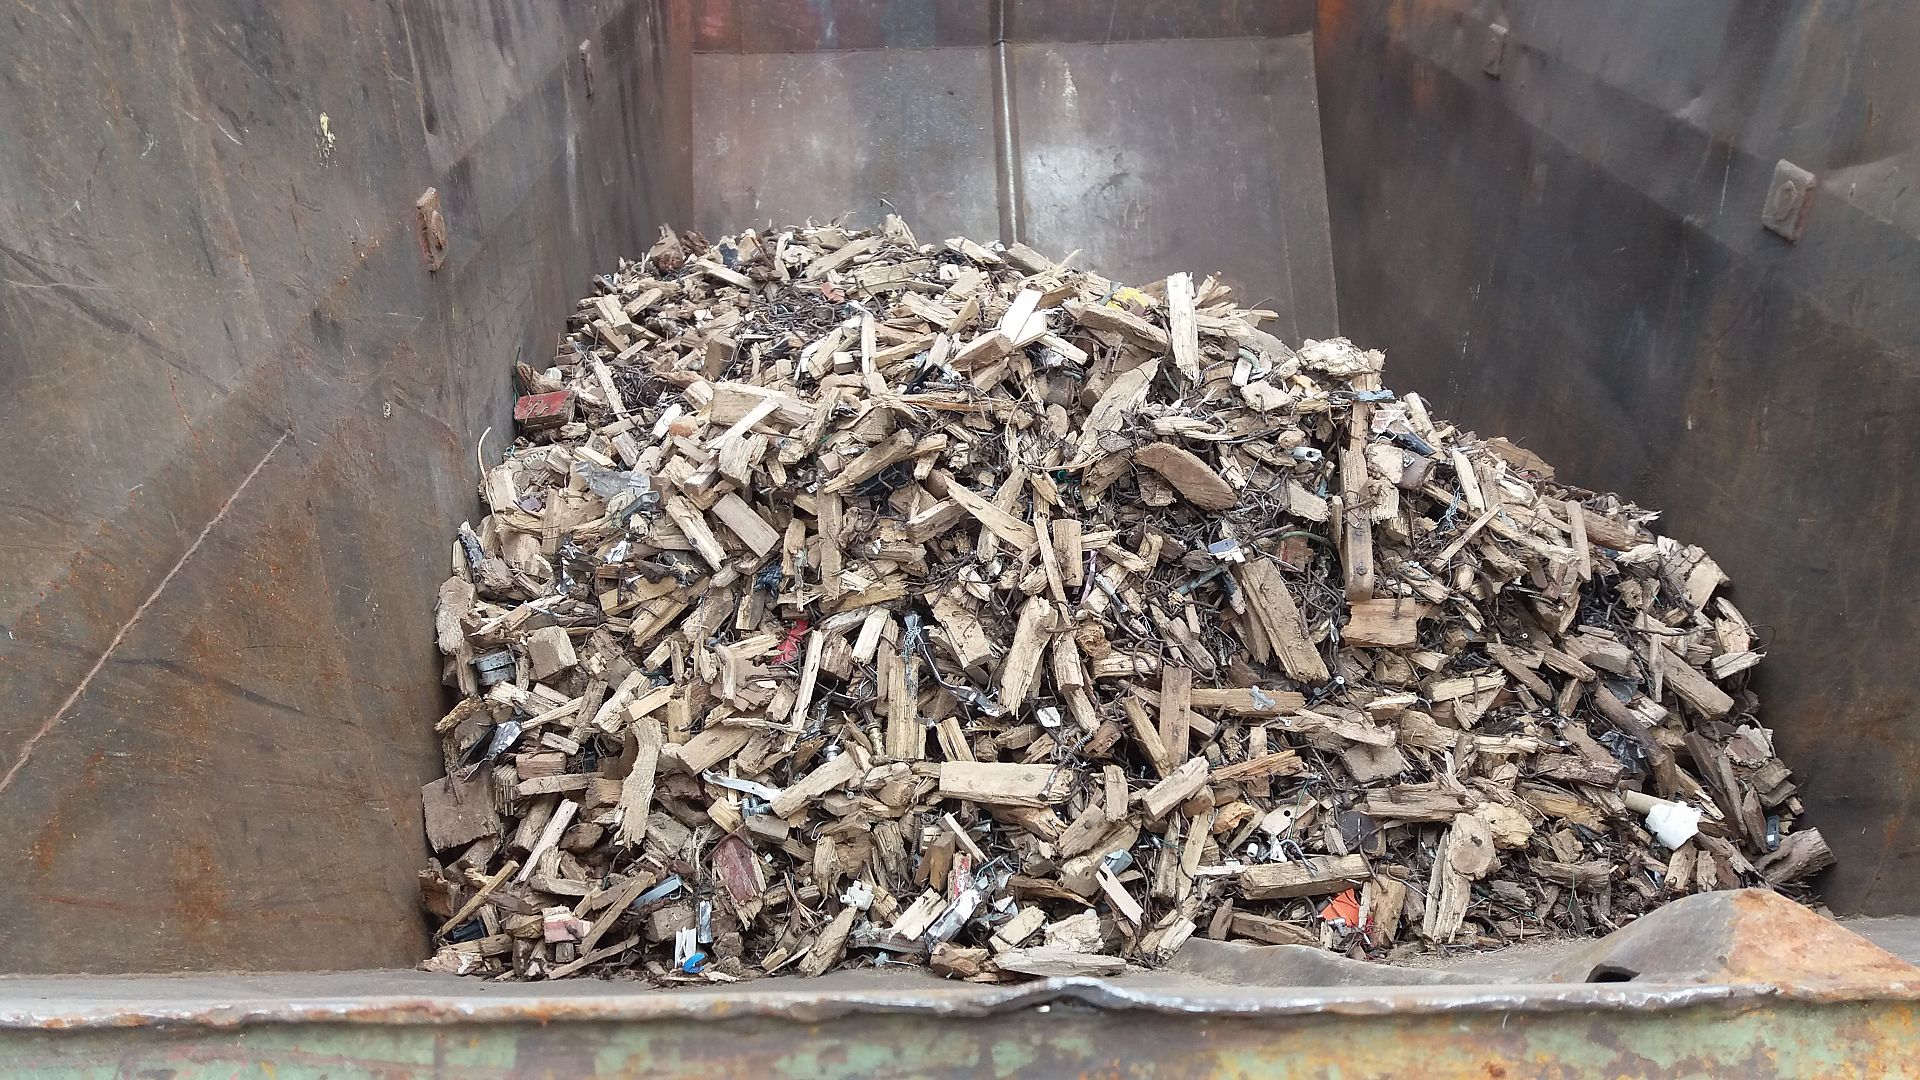
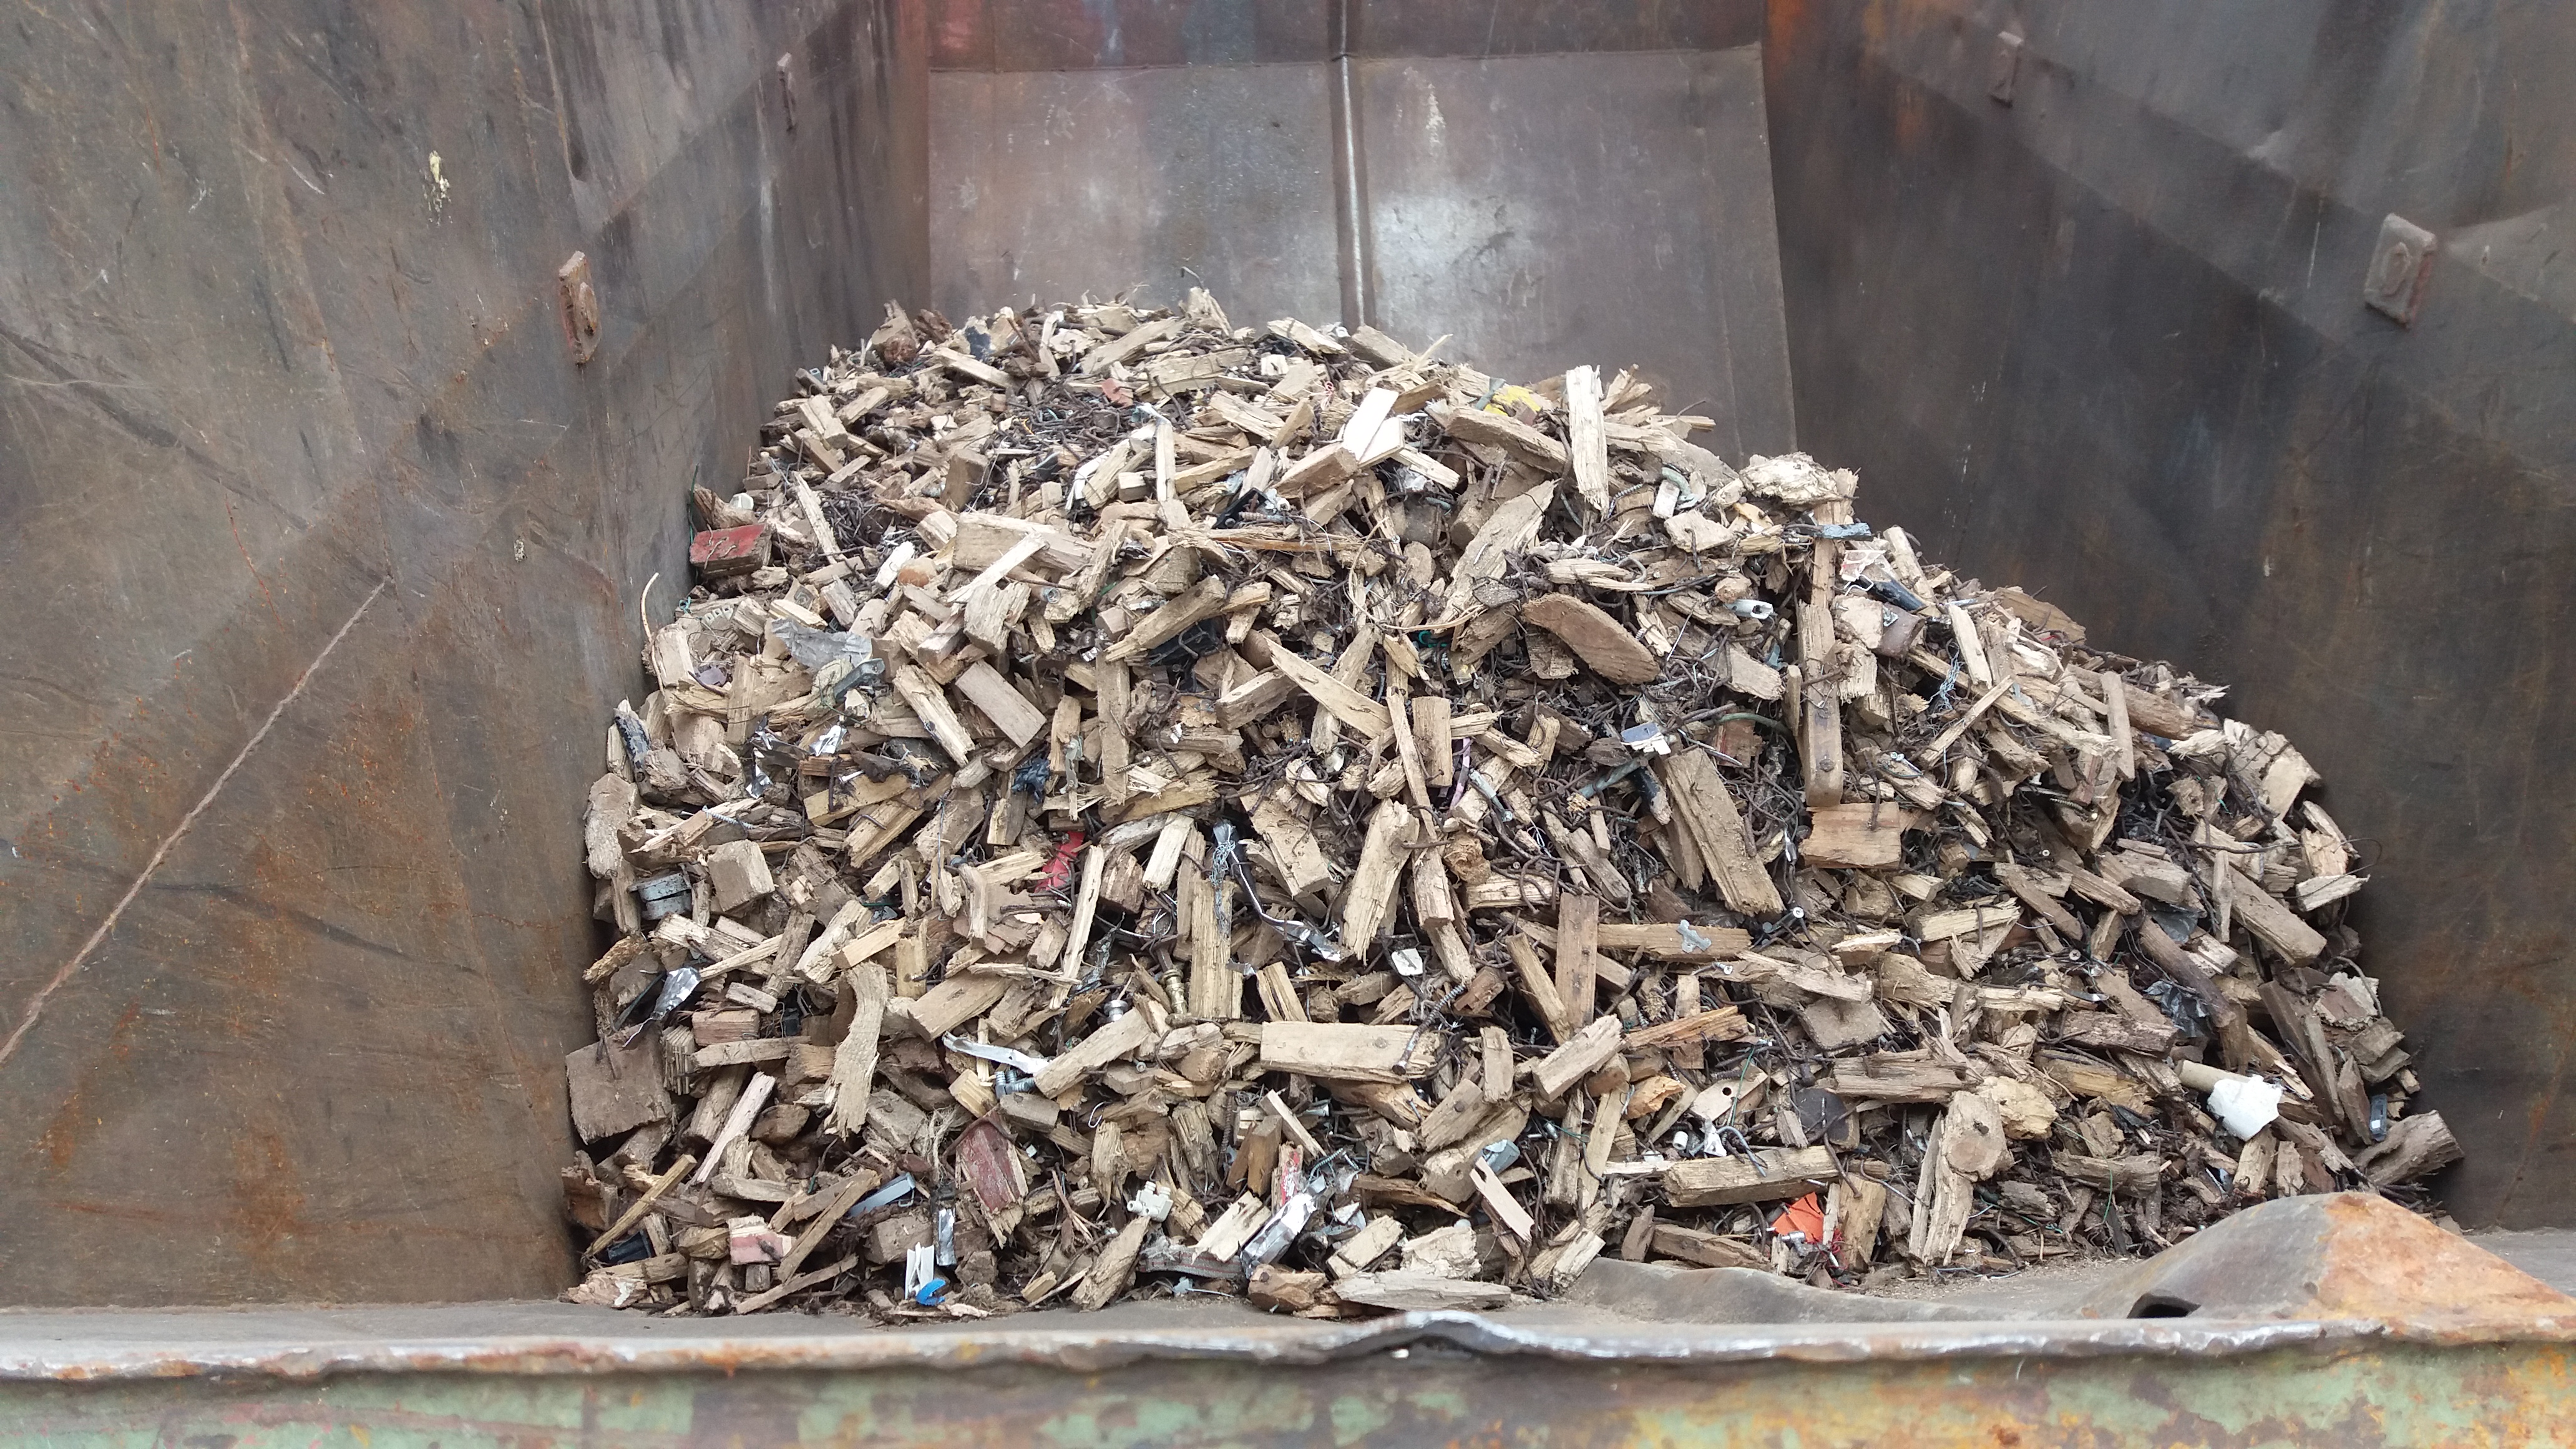
Challenging Fuels
Metal fraction sorted out from the fuel material of a circulating fluidized bed system. Metal residues and wood with nails are sorted out and not burned.
Copyright: IEA-FBC (Franz Winter)
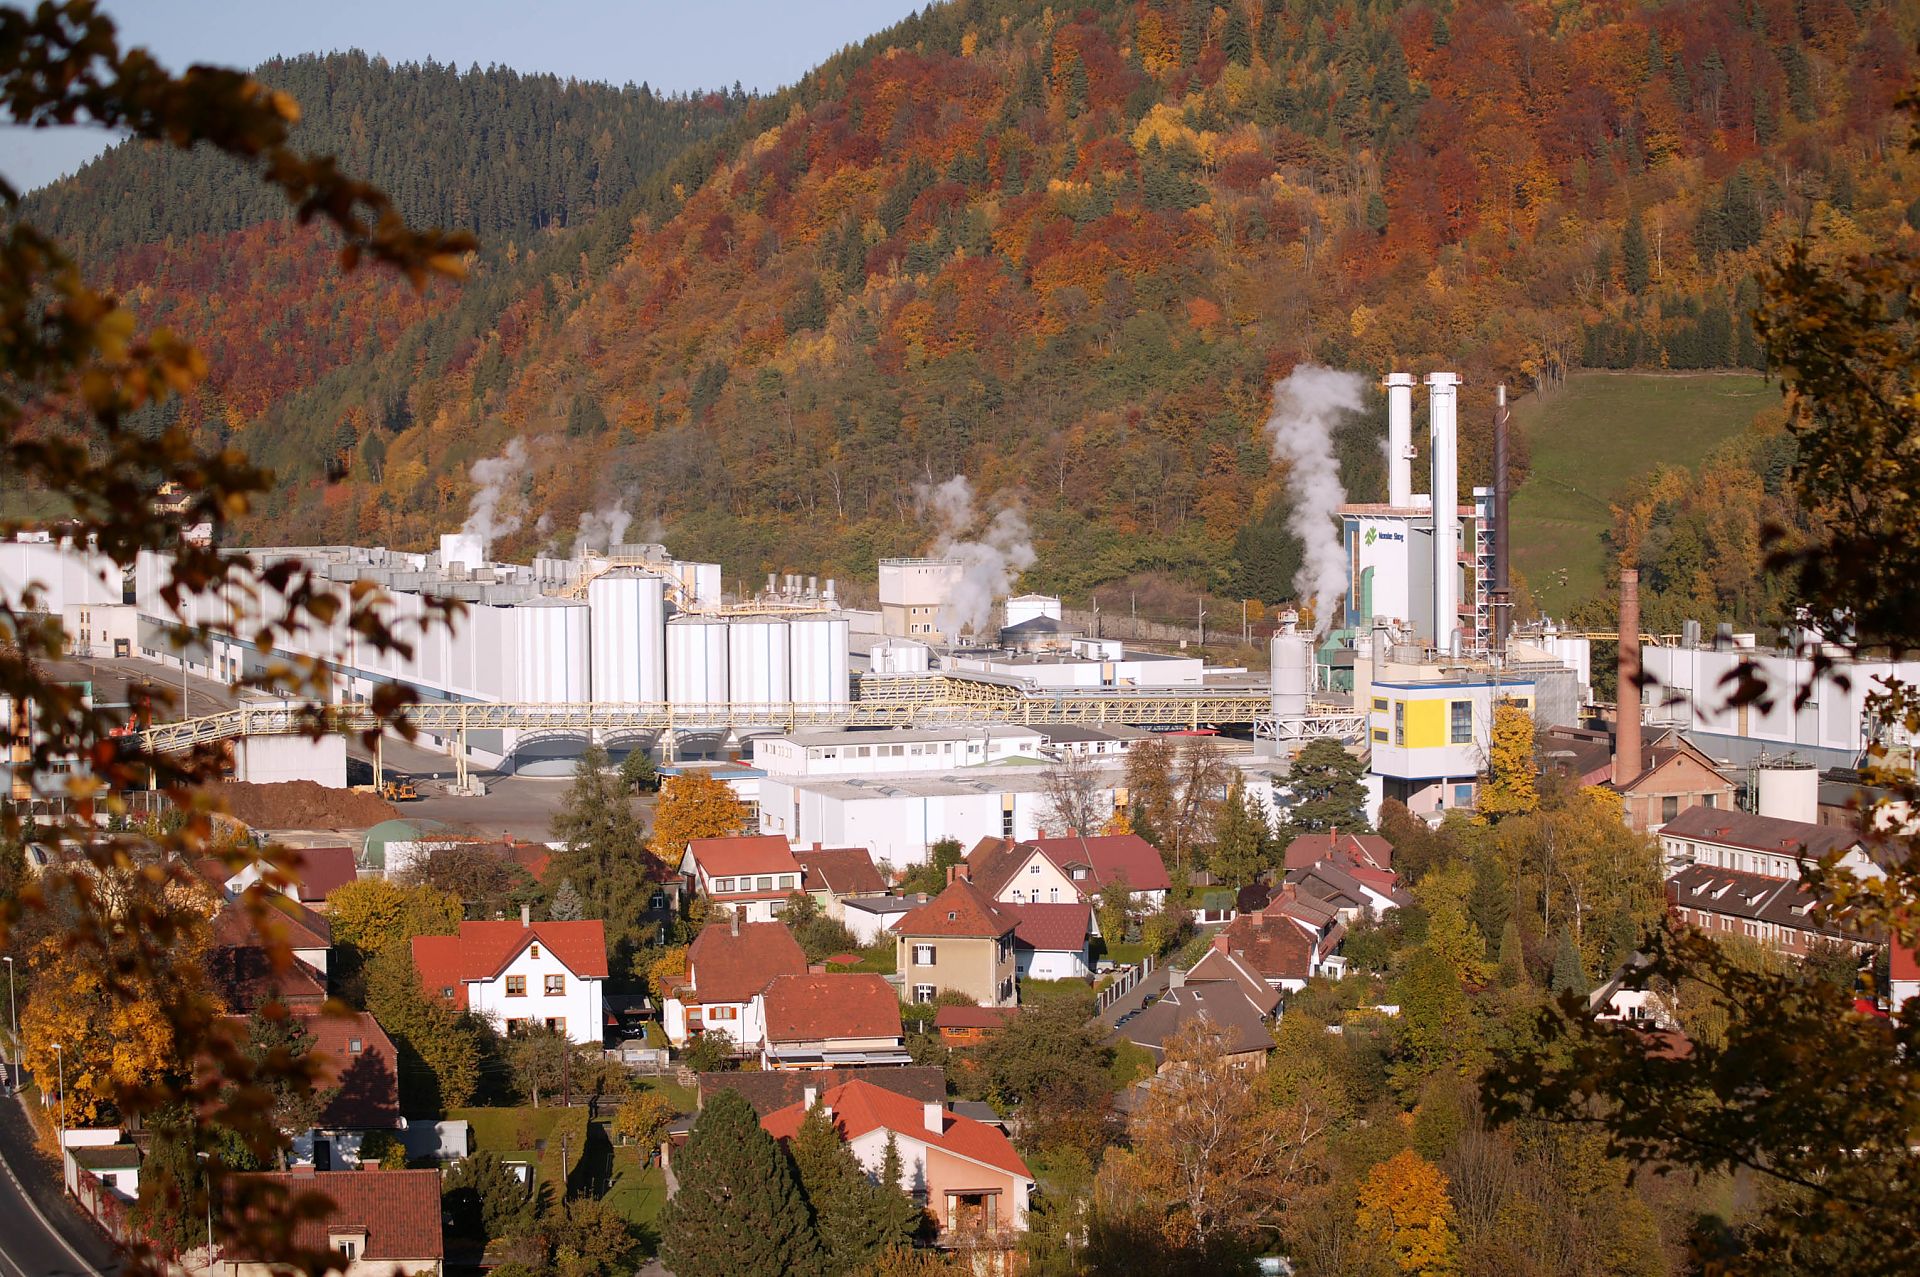
Aerial view of the Norske Skog paper mill in Bruck an der Mur
A residual-matter power plant resumed operation on the paper mill site in March 2022. The power plant is a fluidized bed unit that will enable Norske Skog to reduce CO2 emissions by up to 150,000 tons per year.
Copyright: Norske Skog Bruck GmbH

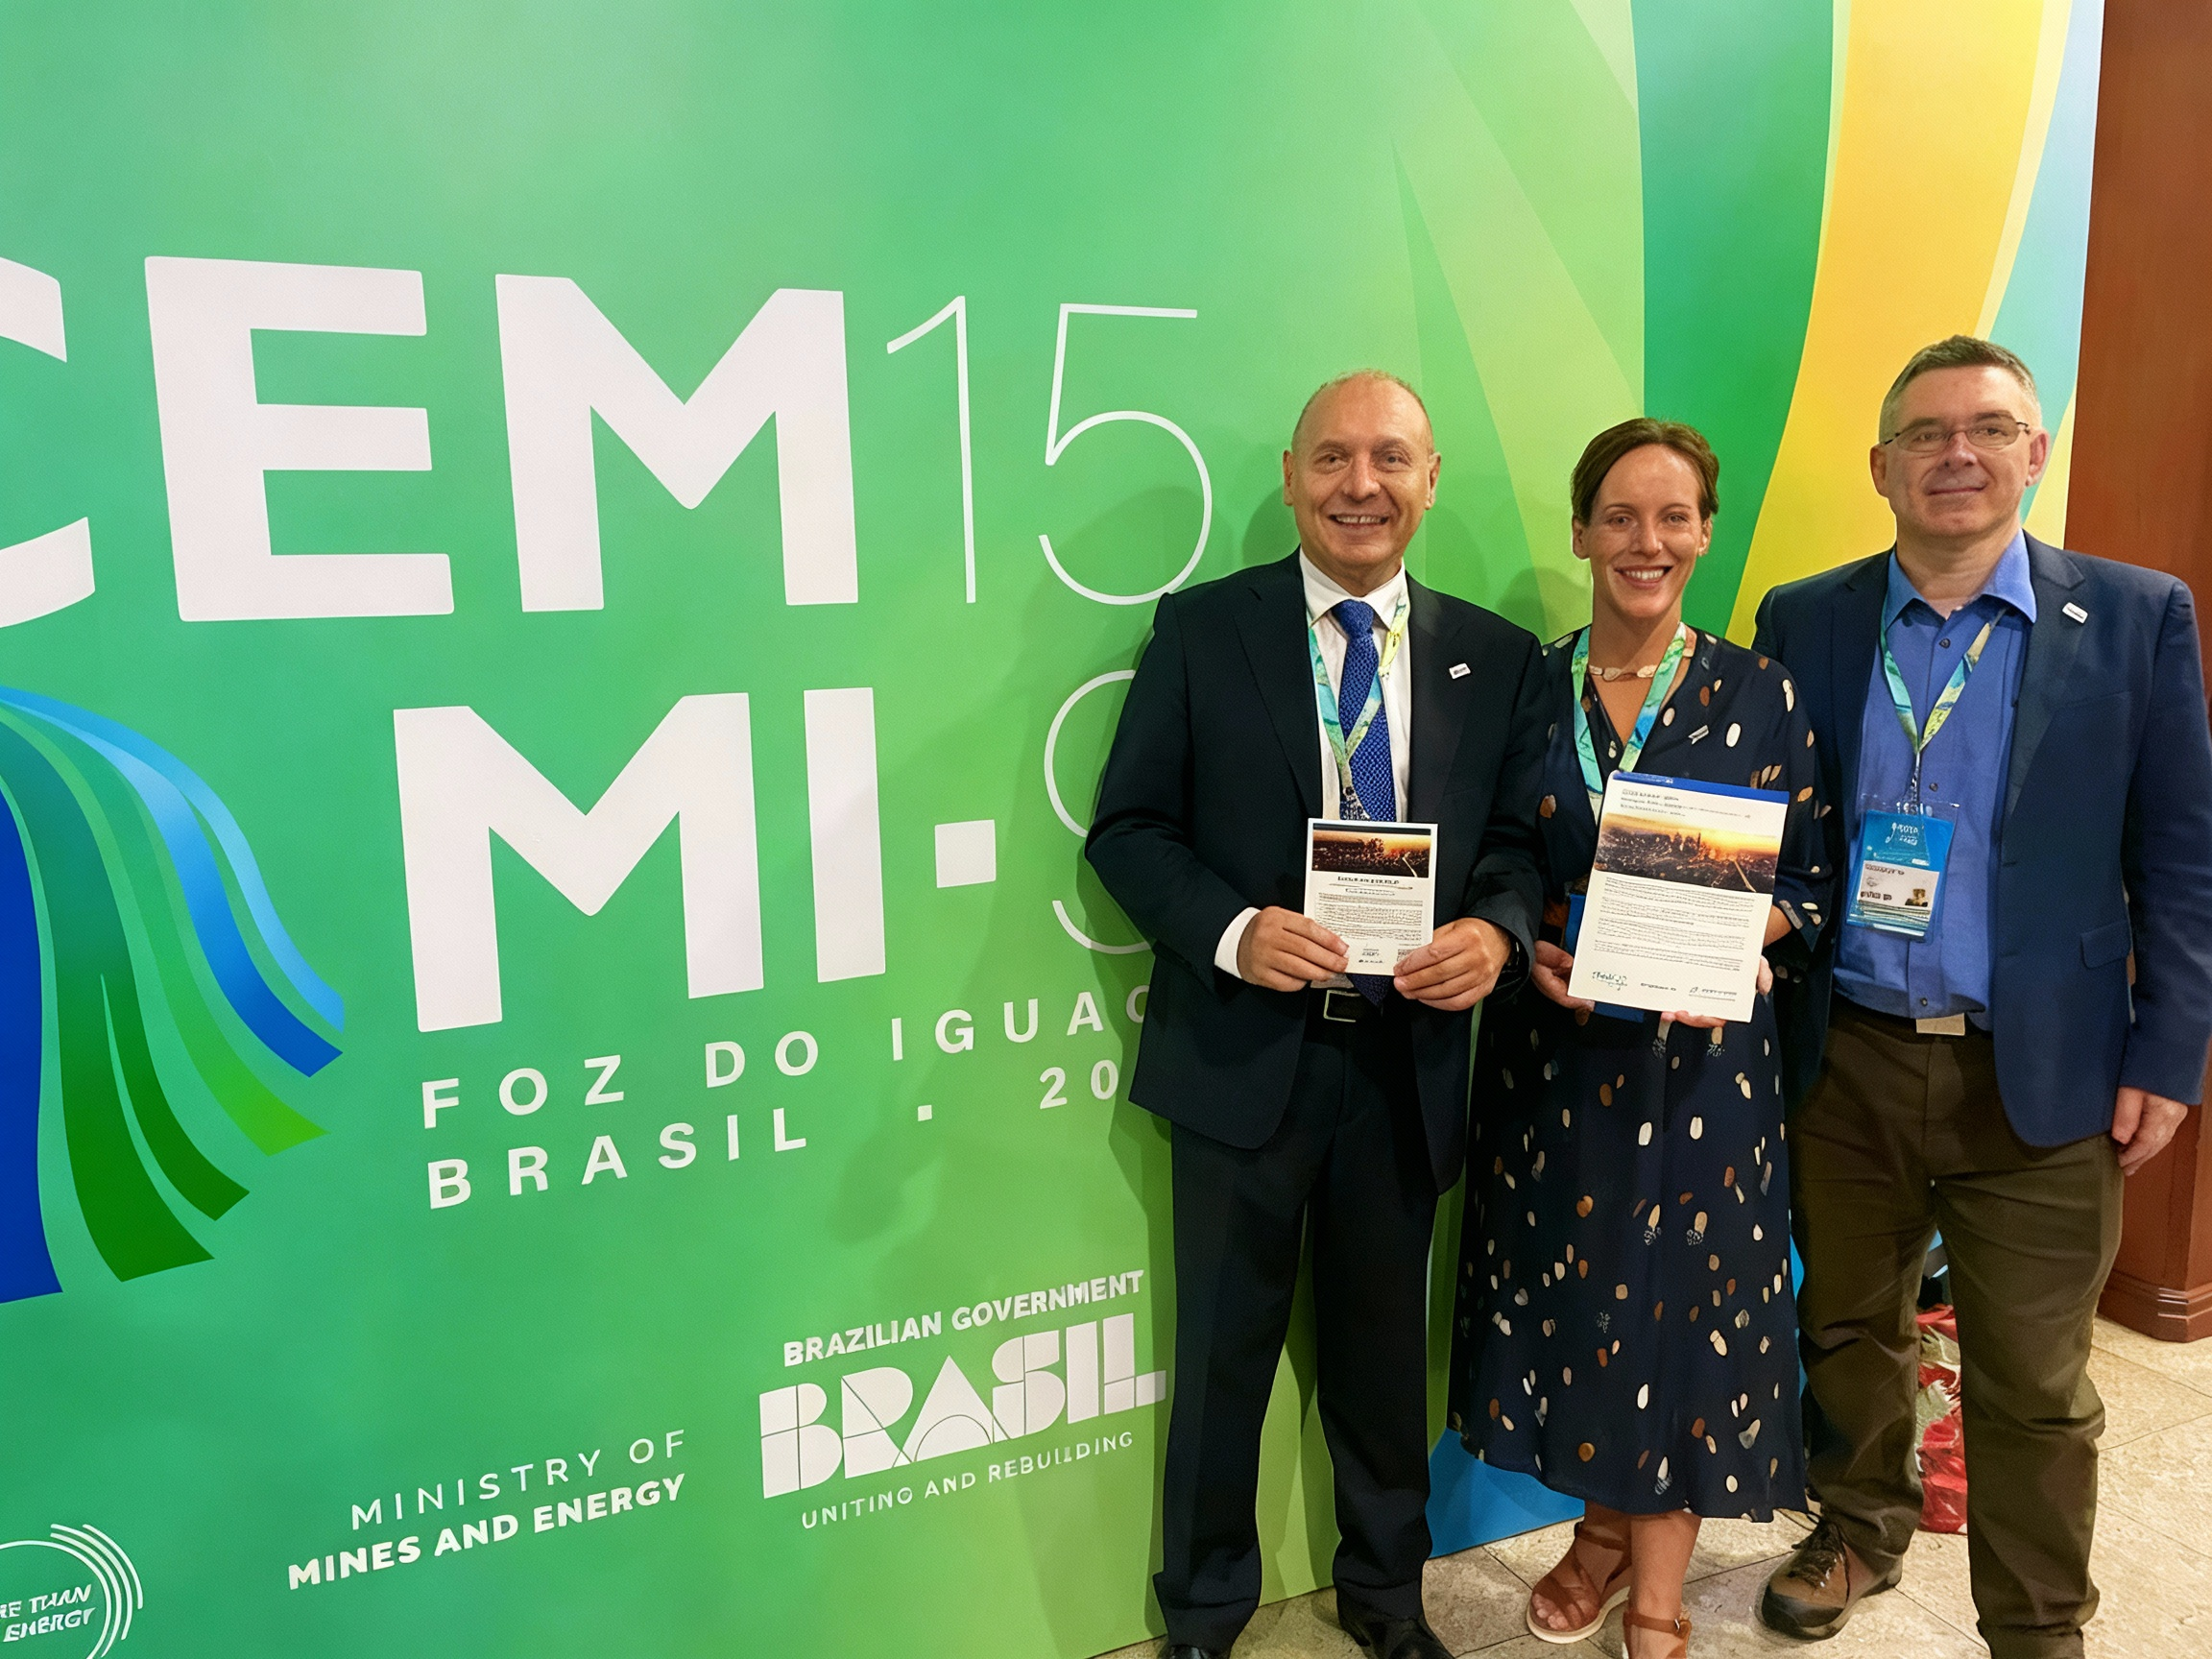
Policy Brief 2024
Policy Brief: presentation at CEM15/MI-9
Copyright: Helena Lindquist

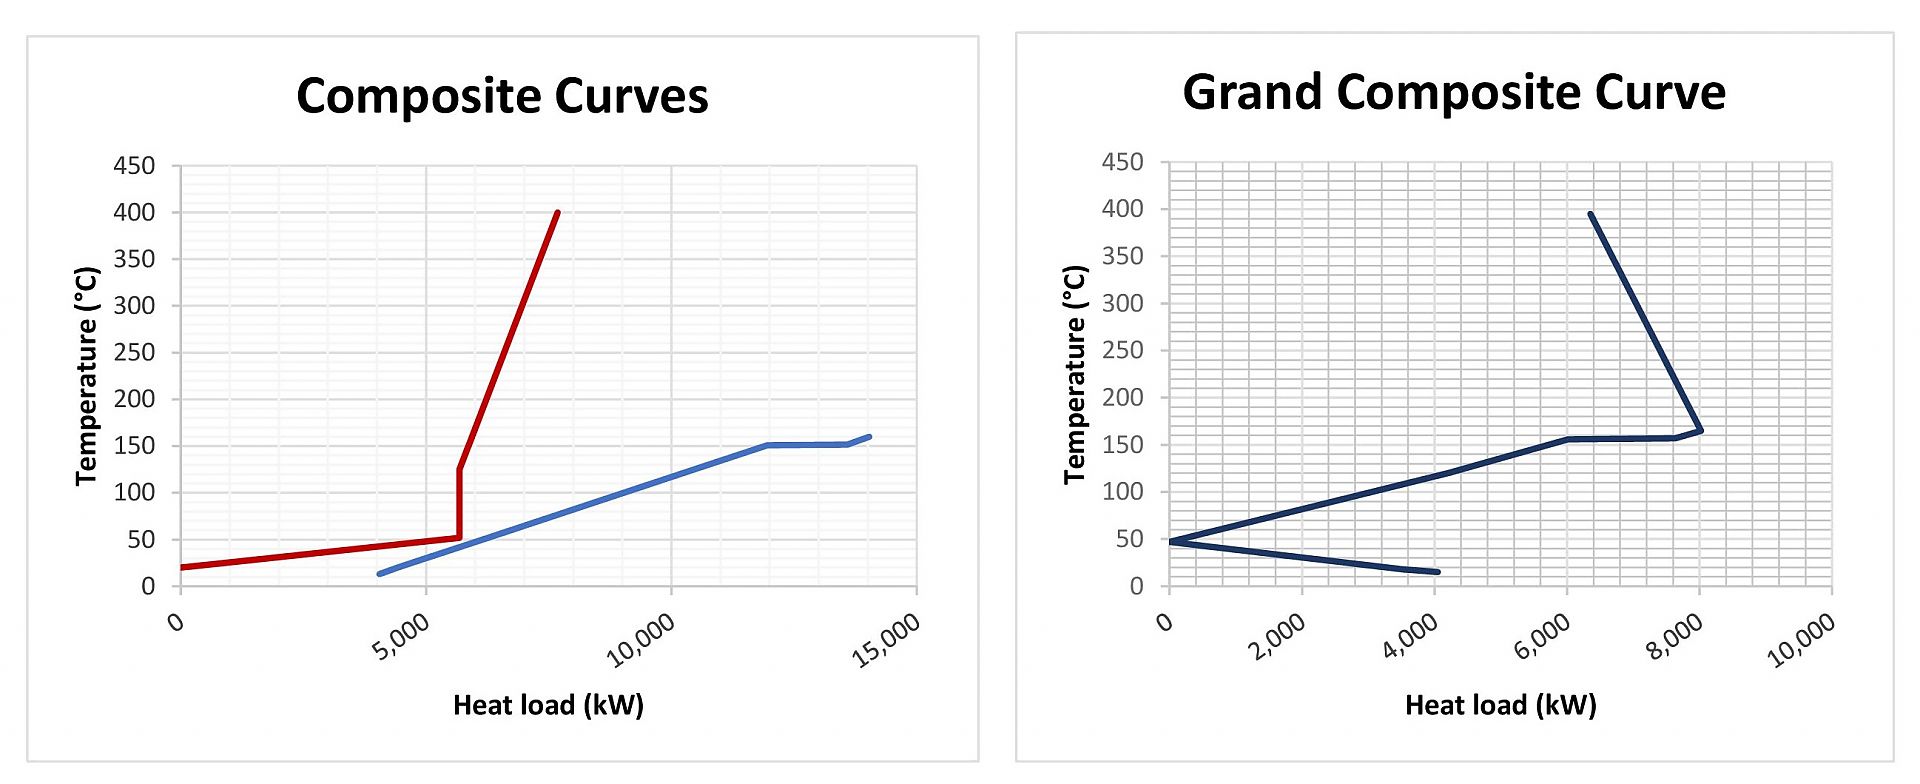
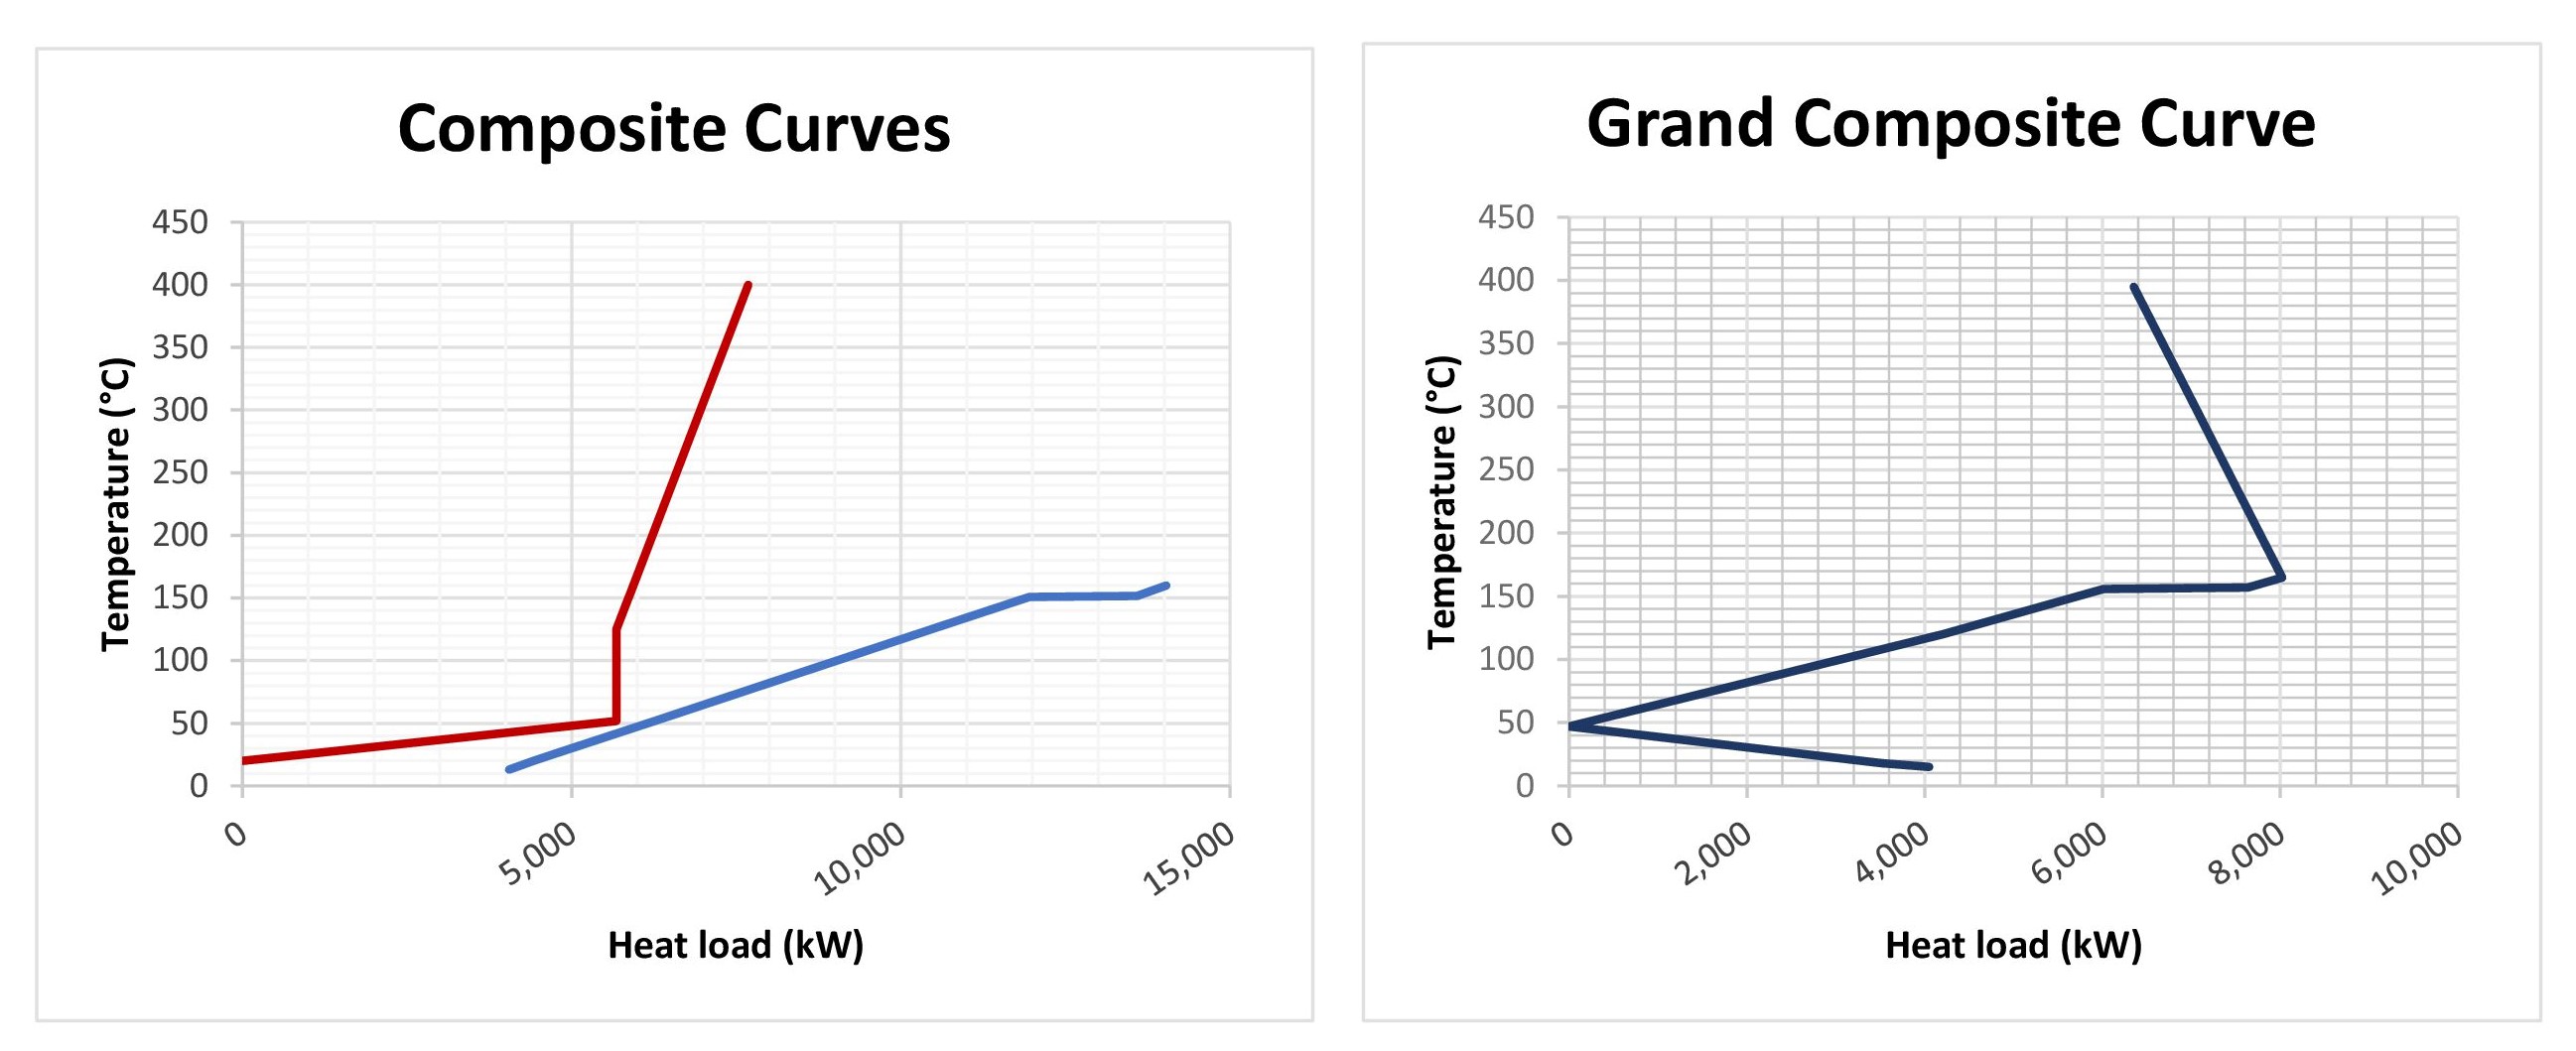
Composite Curves for an Example Case
The figure shows Composite Curves from Pinch Analysis for an Example Case that was evaluated within the project.
Copyright: Austrian Institute of Technology GmbH
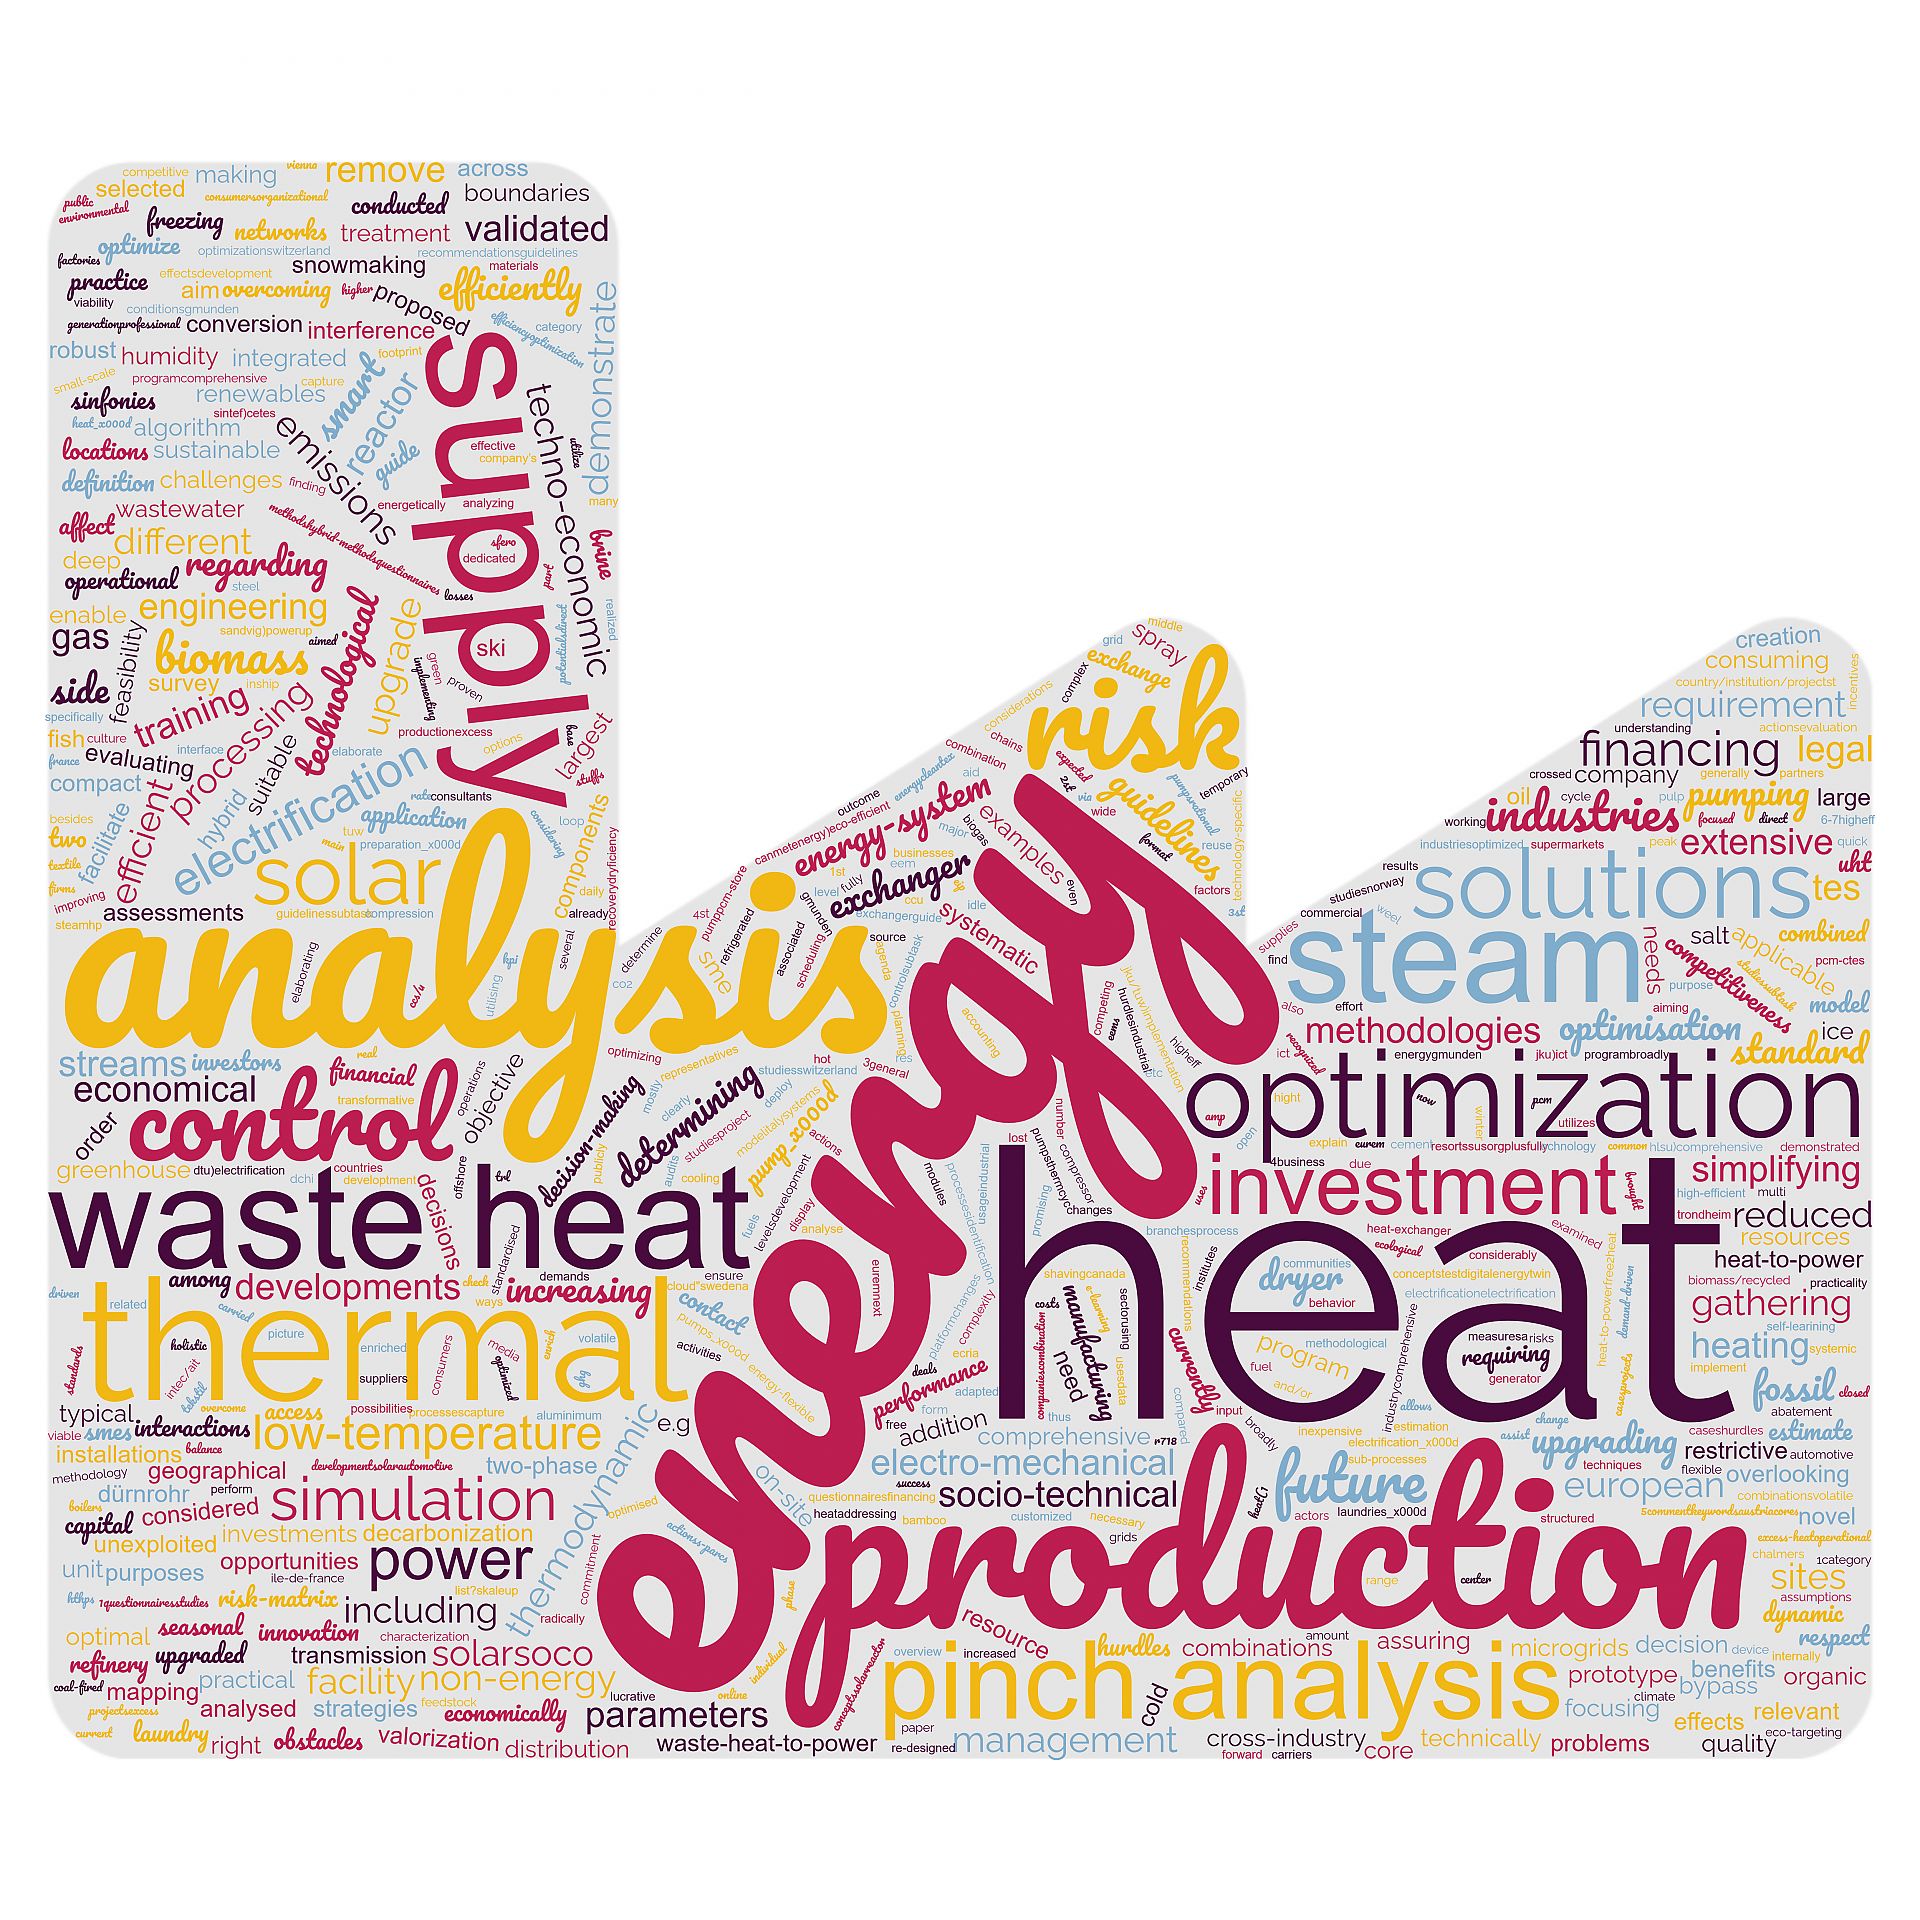
Word cloud Annex 15 Projects
The figure shows a word cloud with the most common words occuring in the project descriptions of Annex 15 partners.