Project Image Pool
There are 28 results.
Terms of use: The pictures on this site originate from the projects in the frame of the programmes City of Tomorrow, Building of Tomorrow and the IEA Research Cooperation. They may be used credited for non-commercial purposes under the Creative Commons License Attribution-NonCommercial (CC BY-NC).
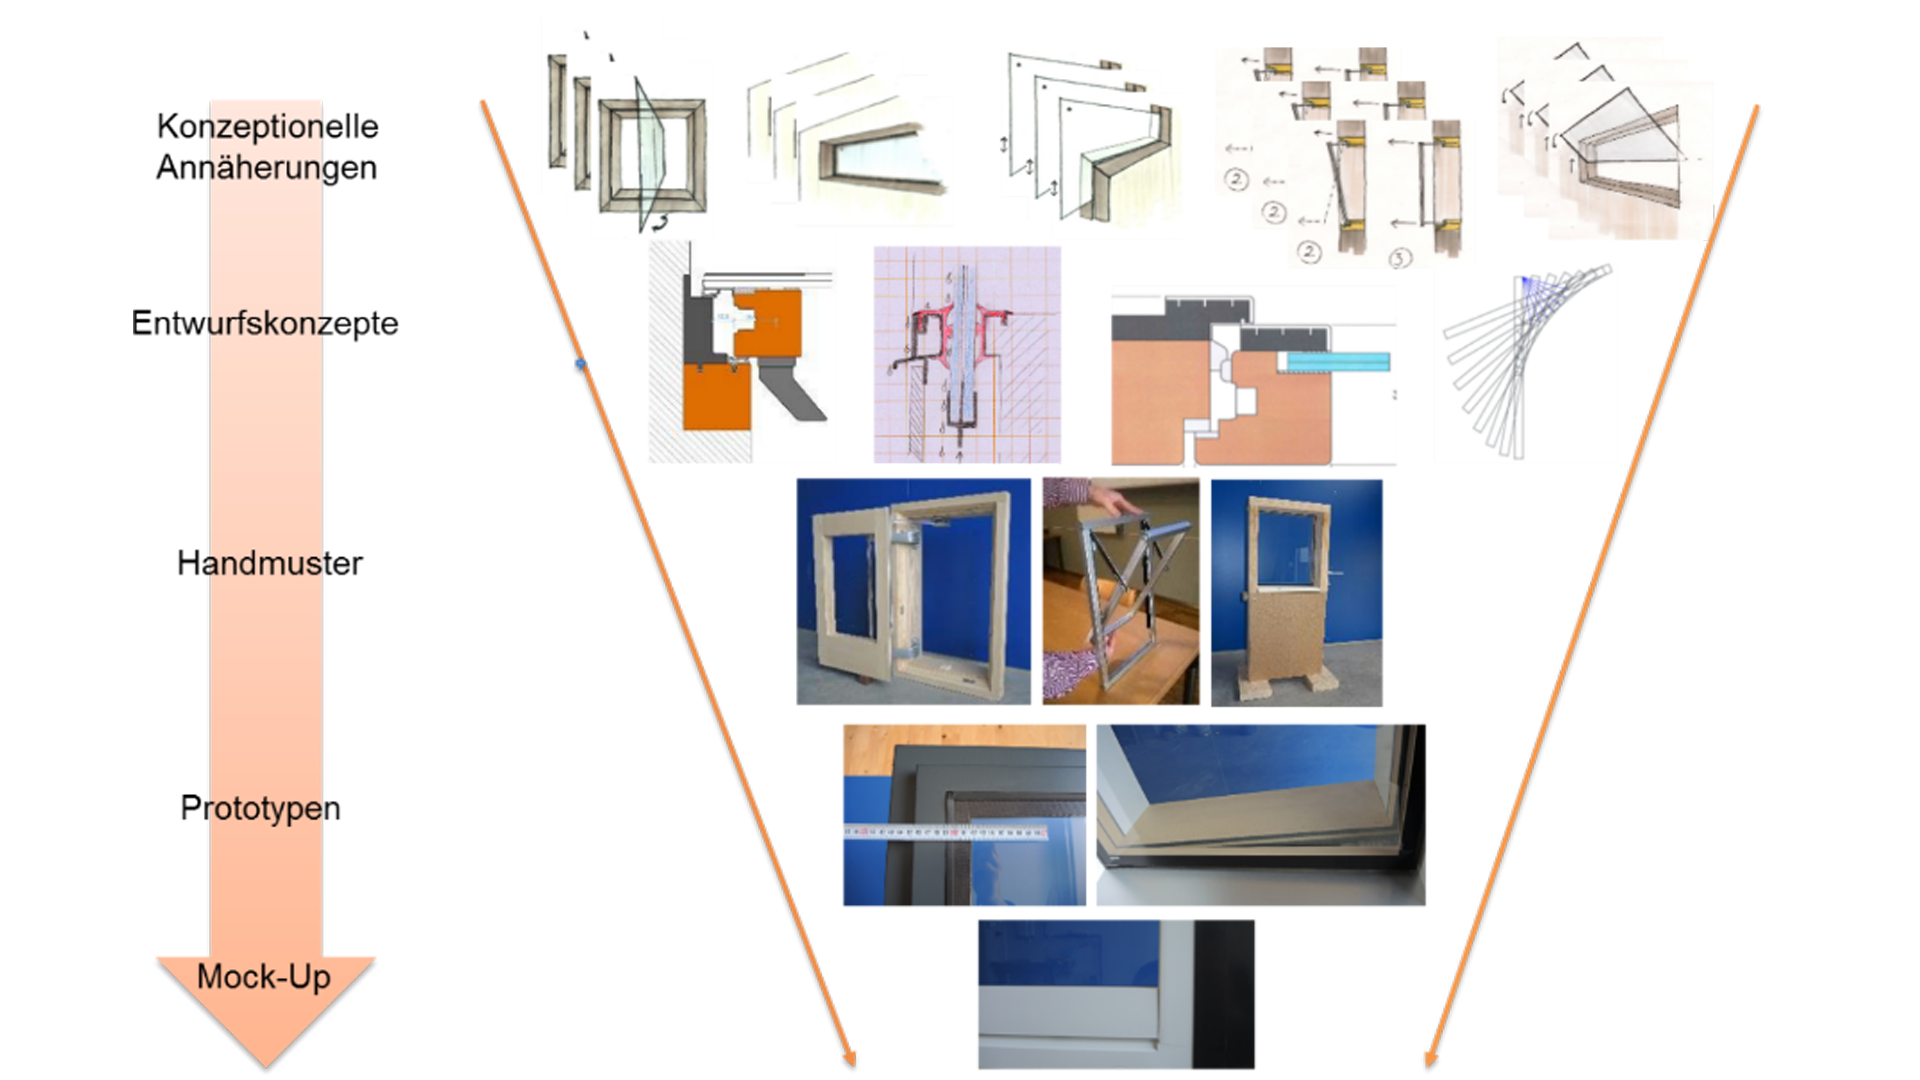
Reductive Approach toward new window concepts for vacuumglass windows
Reductive Approach for different vacuum-glass-windows: concepts - sketches - specimen - prototypes - mock-ups
Copyright: Team Projekt MOTIVE (Abt. Bauphysik und Bauökologie, TU Wien & Holzforschung Austria)
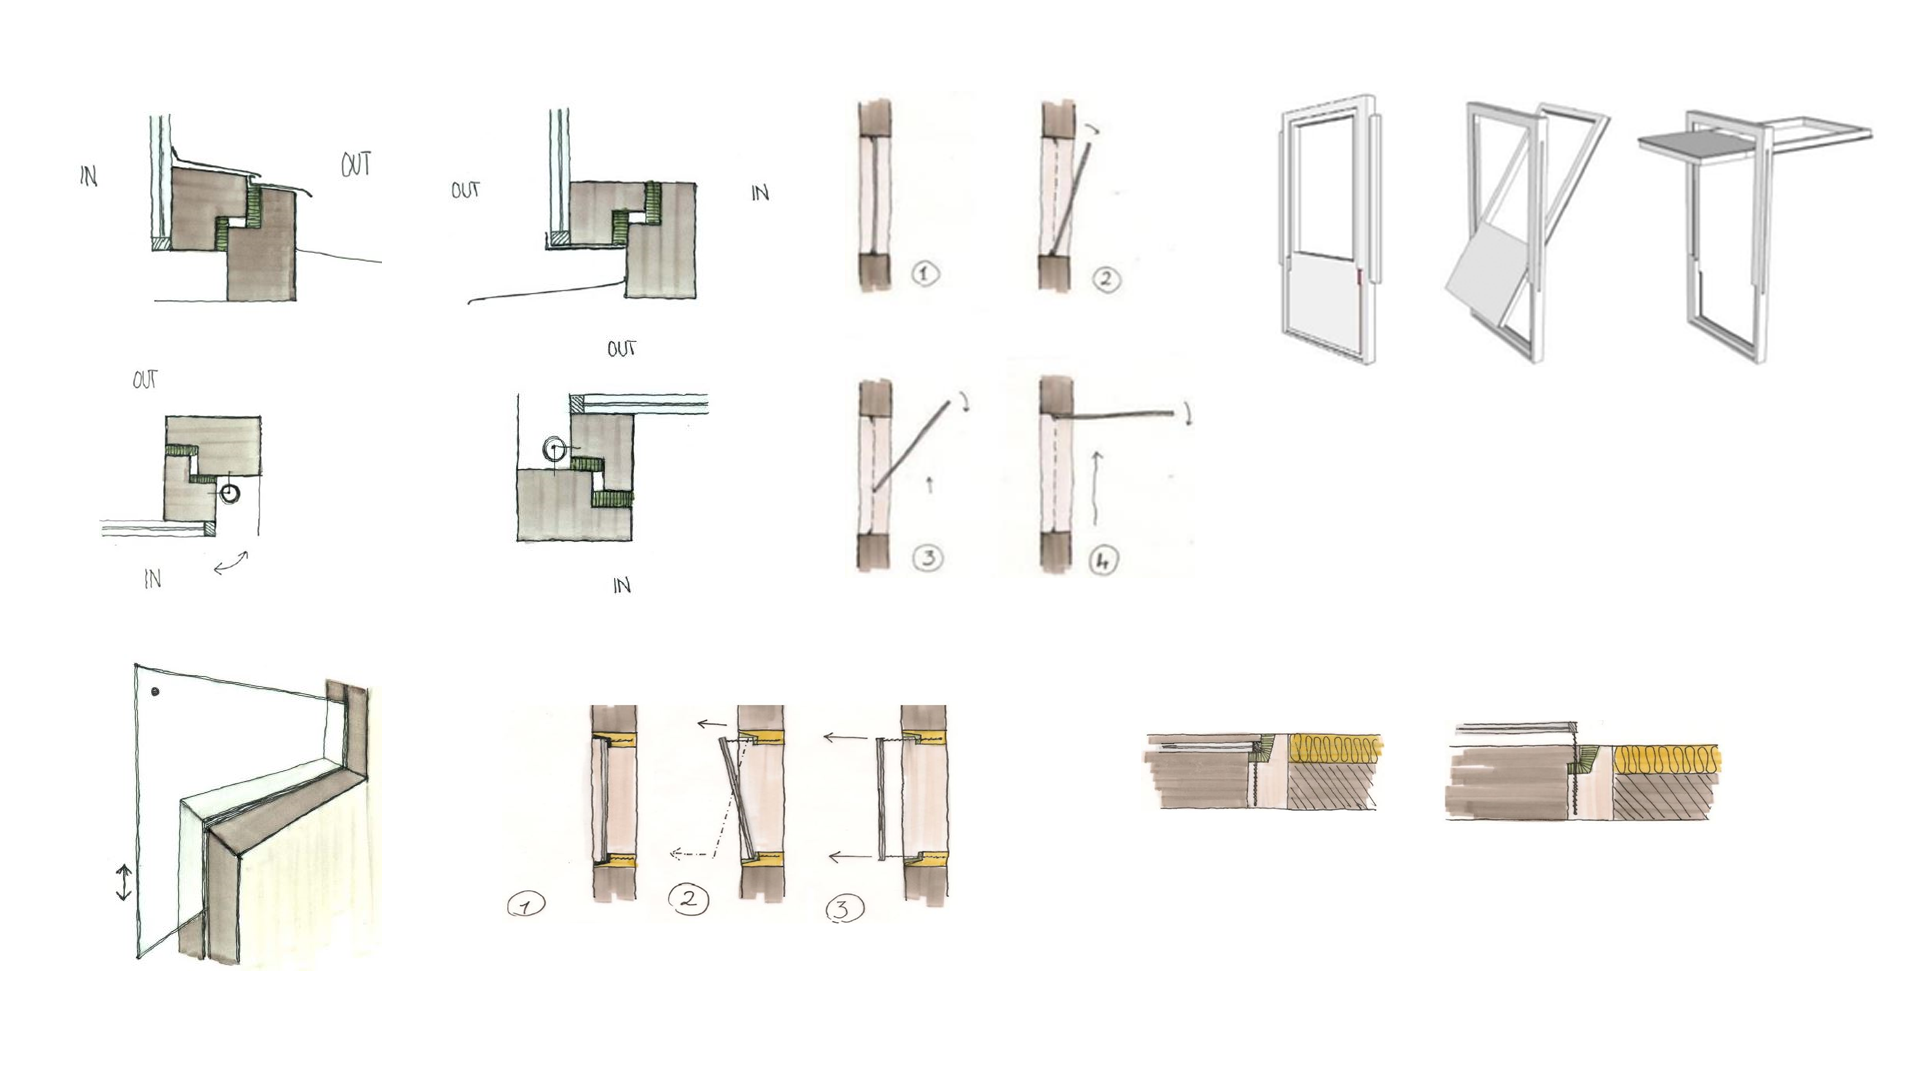
Different Window-Concepts
Different Design-Sketches of unconventional Windows with Vacuumglazing. All of them do feature unconventional opening / operation schemes
Copyright: Team Projekt MOTIVE (Abt. Bauphysik und Bauökologie, TU Wien & Holzforschung Austria)
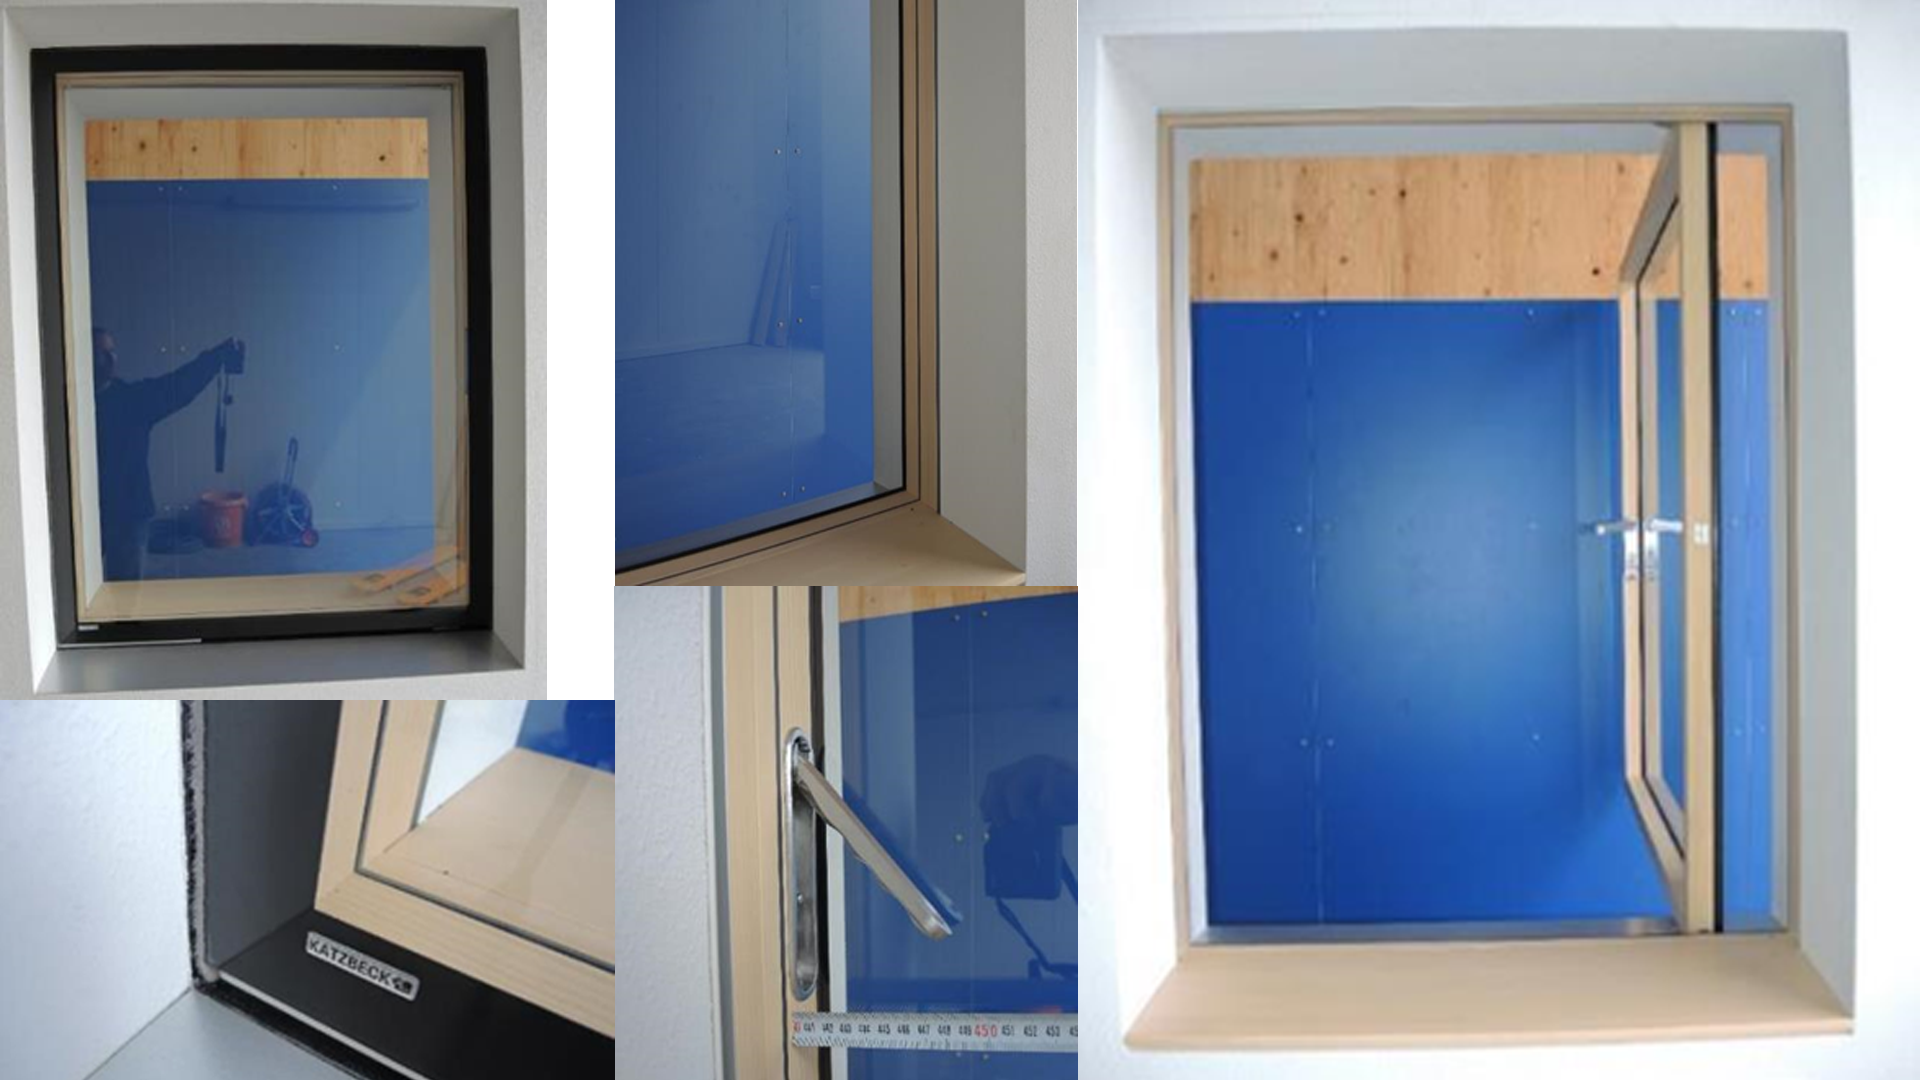
Vacuum-glazing-window with opening direction to inside and indoor-sided vacuum glazing
A set of illustrations of a window-prototype with vacuum-glazing interface on the inside and opening direction to the inside.
Copyright: Team Projekt MOTIVE (Abt. Bauphysik und Bauökologie, TU Wien & Holzforschung Austria)
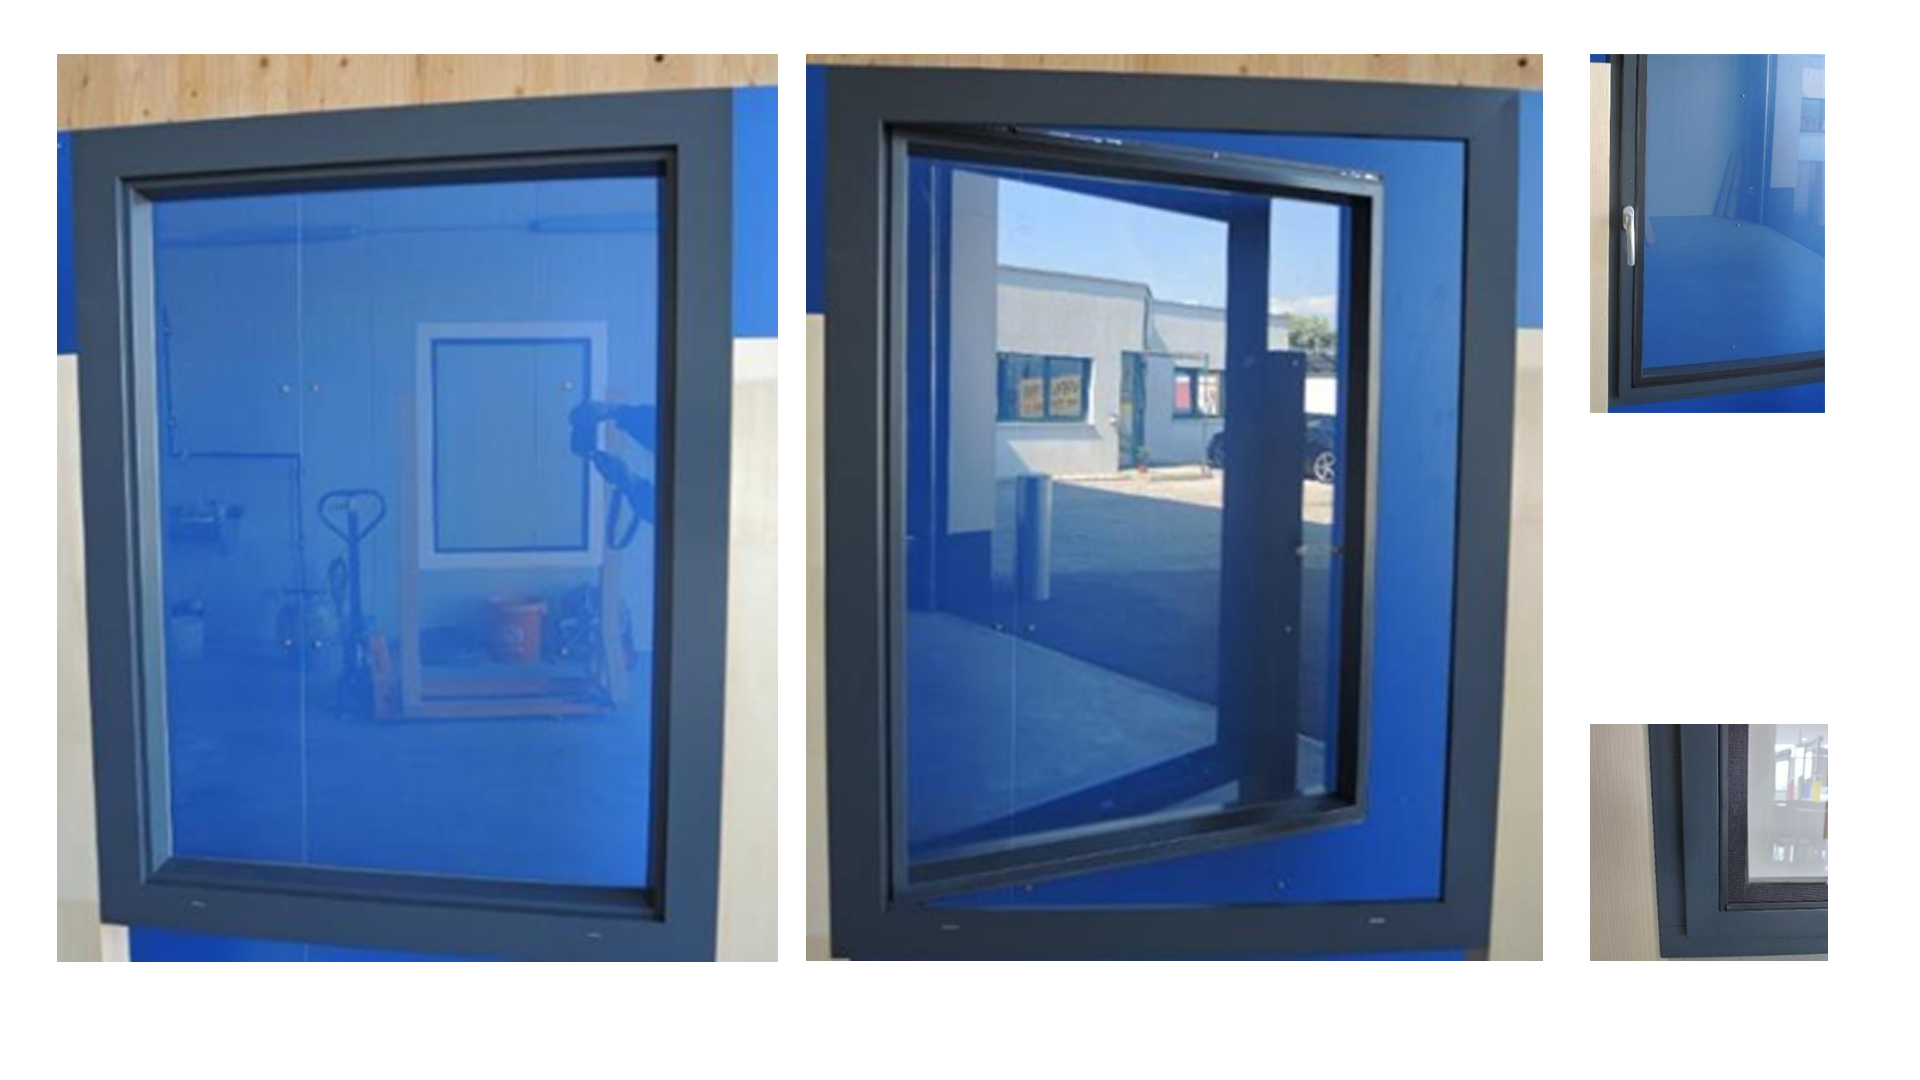
Vacuum-glazing-window in fully-glazed appearance, opening direction to the outside.
This non-conventional window was concepted during the MOTIVE-project. It's attractive architectural appearance is based on a fully-glazed impression. However, the opening direction to the ouside needs to be furtherly worked on, regarding user acceptance, maintenance, and sun protection.
Copyright: Team Projekt MOTIVE (Abt. Bauphysik und Bauökologie, TU Wien & Holzforschung Austria)

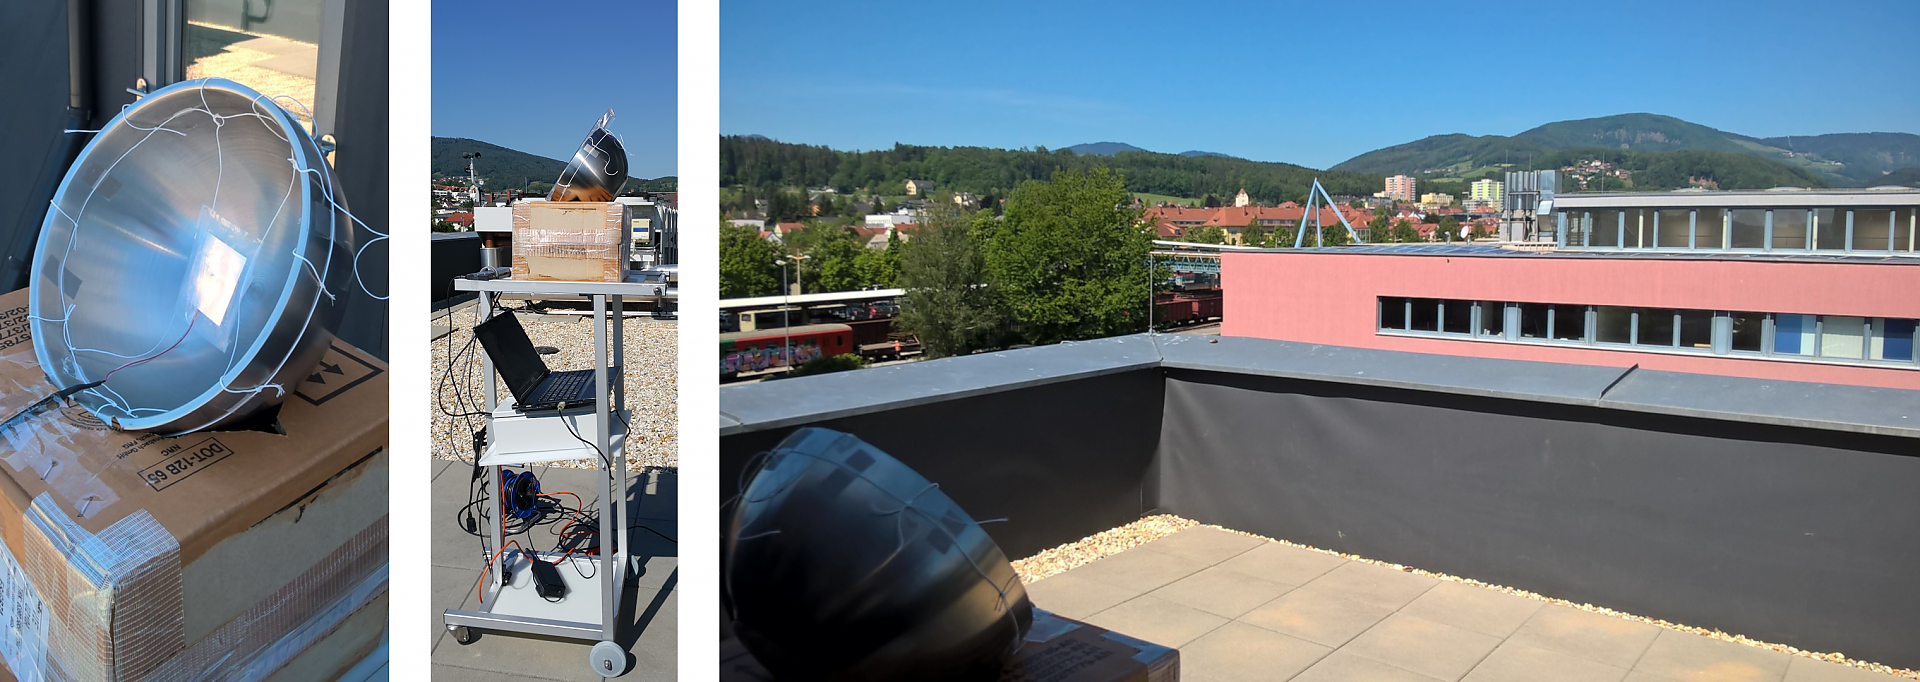
Photonic Cooling measurement setup with parabolic reflector
An example of a measurement setup used during the project photonic cooling employing a parabolic reflector. Reflector-Sample-Peltier-module unit in detail (left), complete measurement setup (middle) as well as an overview of the surroundings next to the measurement setup. Image taken on 17.5.2017, Weiz.
Copyright: JOANNEUM RESEARCH
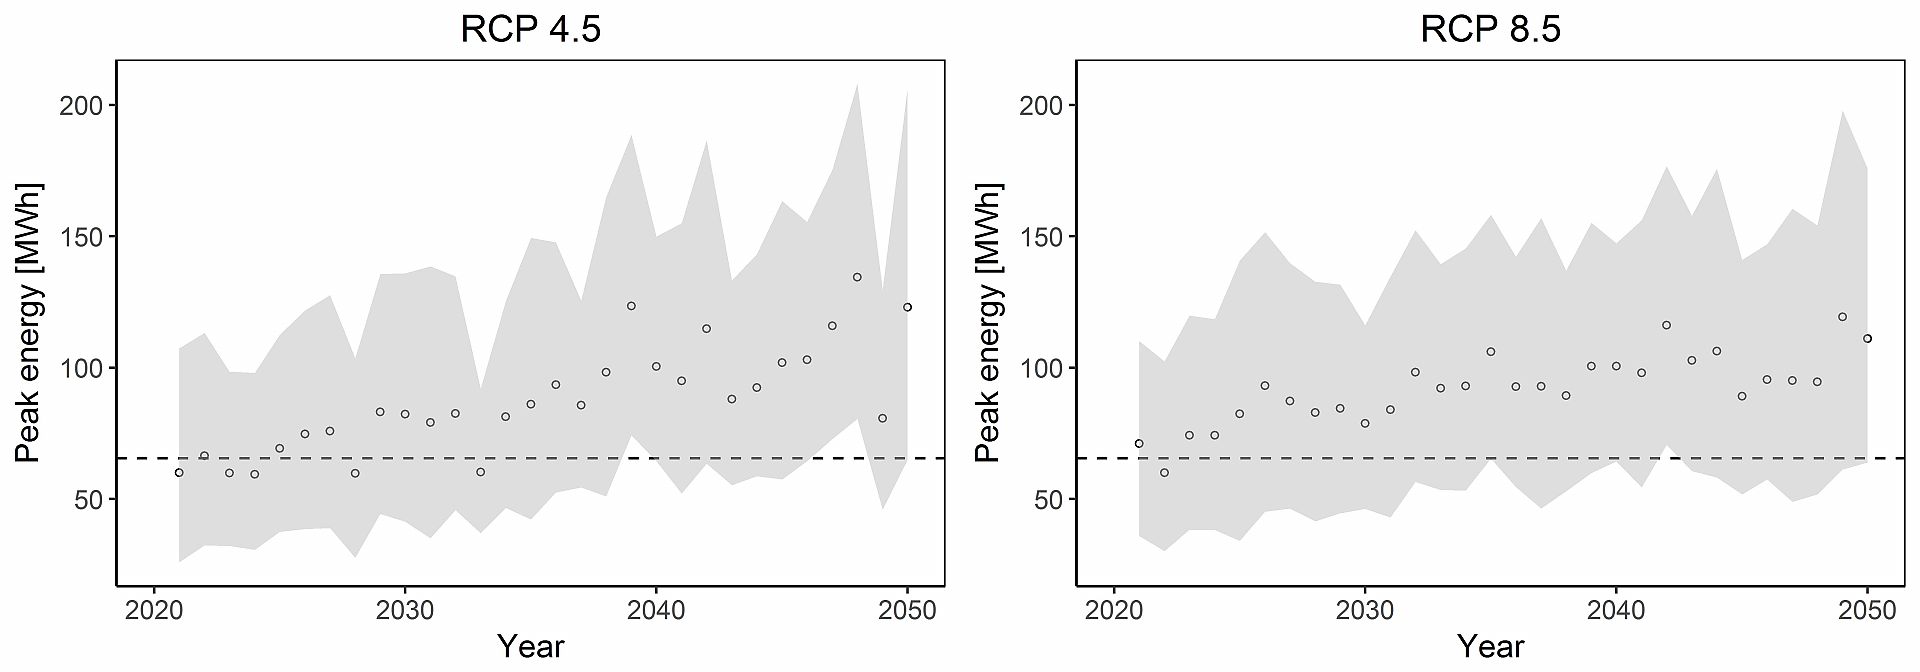
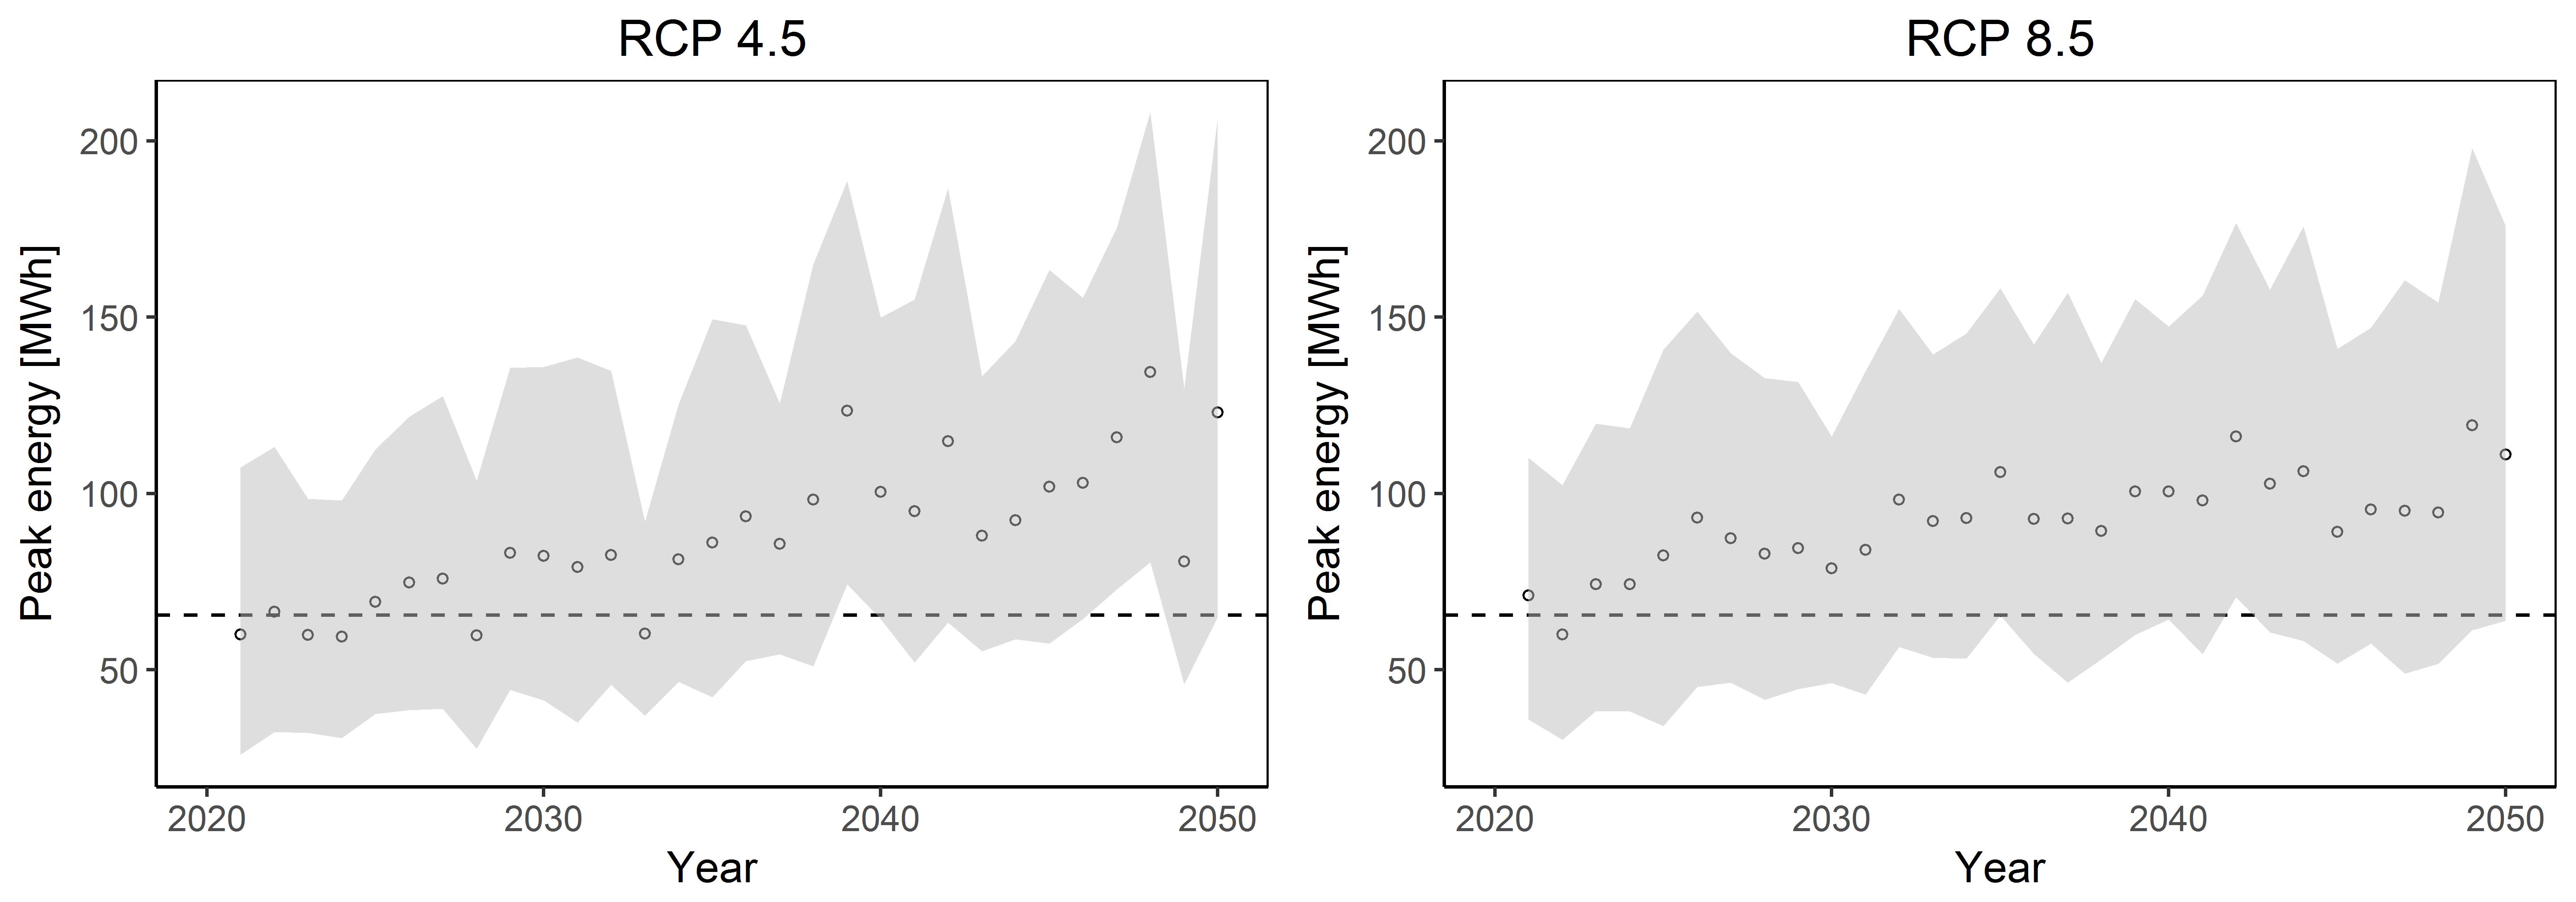
Estimated annual peak demand for air conditioning in Vienna for different climate scenarios
Estimated annual peak demand needed for air conditioning in Vienna according to the model calculations applied for the climate scenario RCP4.5 (left) and RCP8.5(right). Data points represent the average annual peak demand, the grey area the uncertainty with a 95% confidence interval and the dashed line the peak demand in Vienna for 2016.
Copyright: JOANNEUM RESEARCH

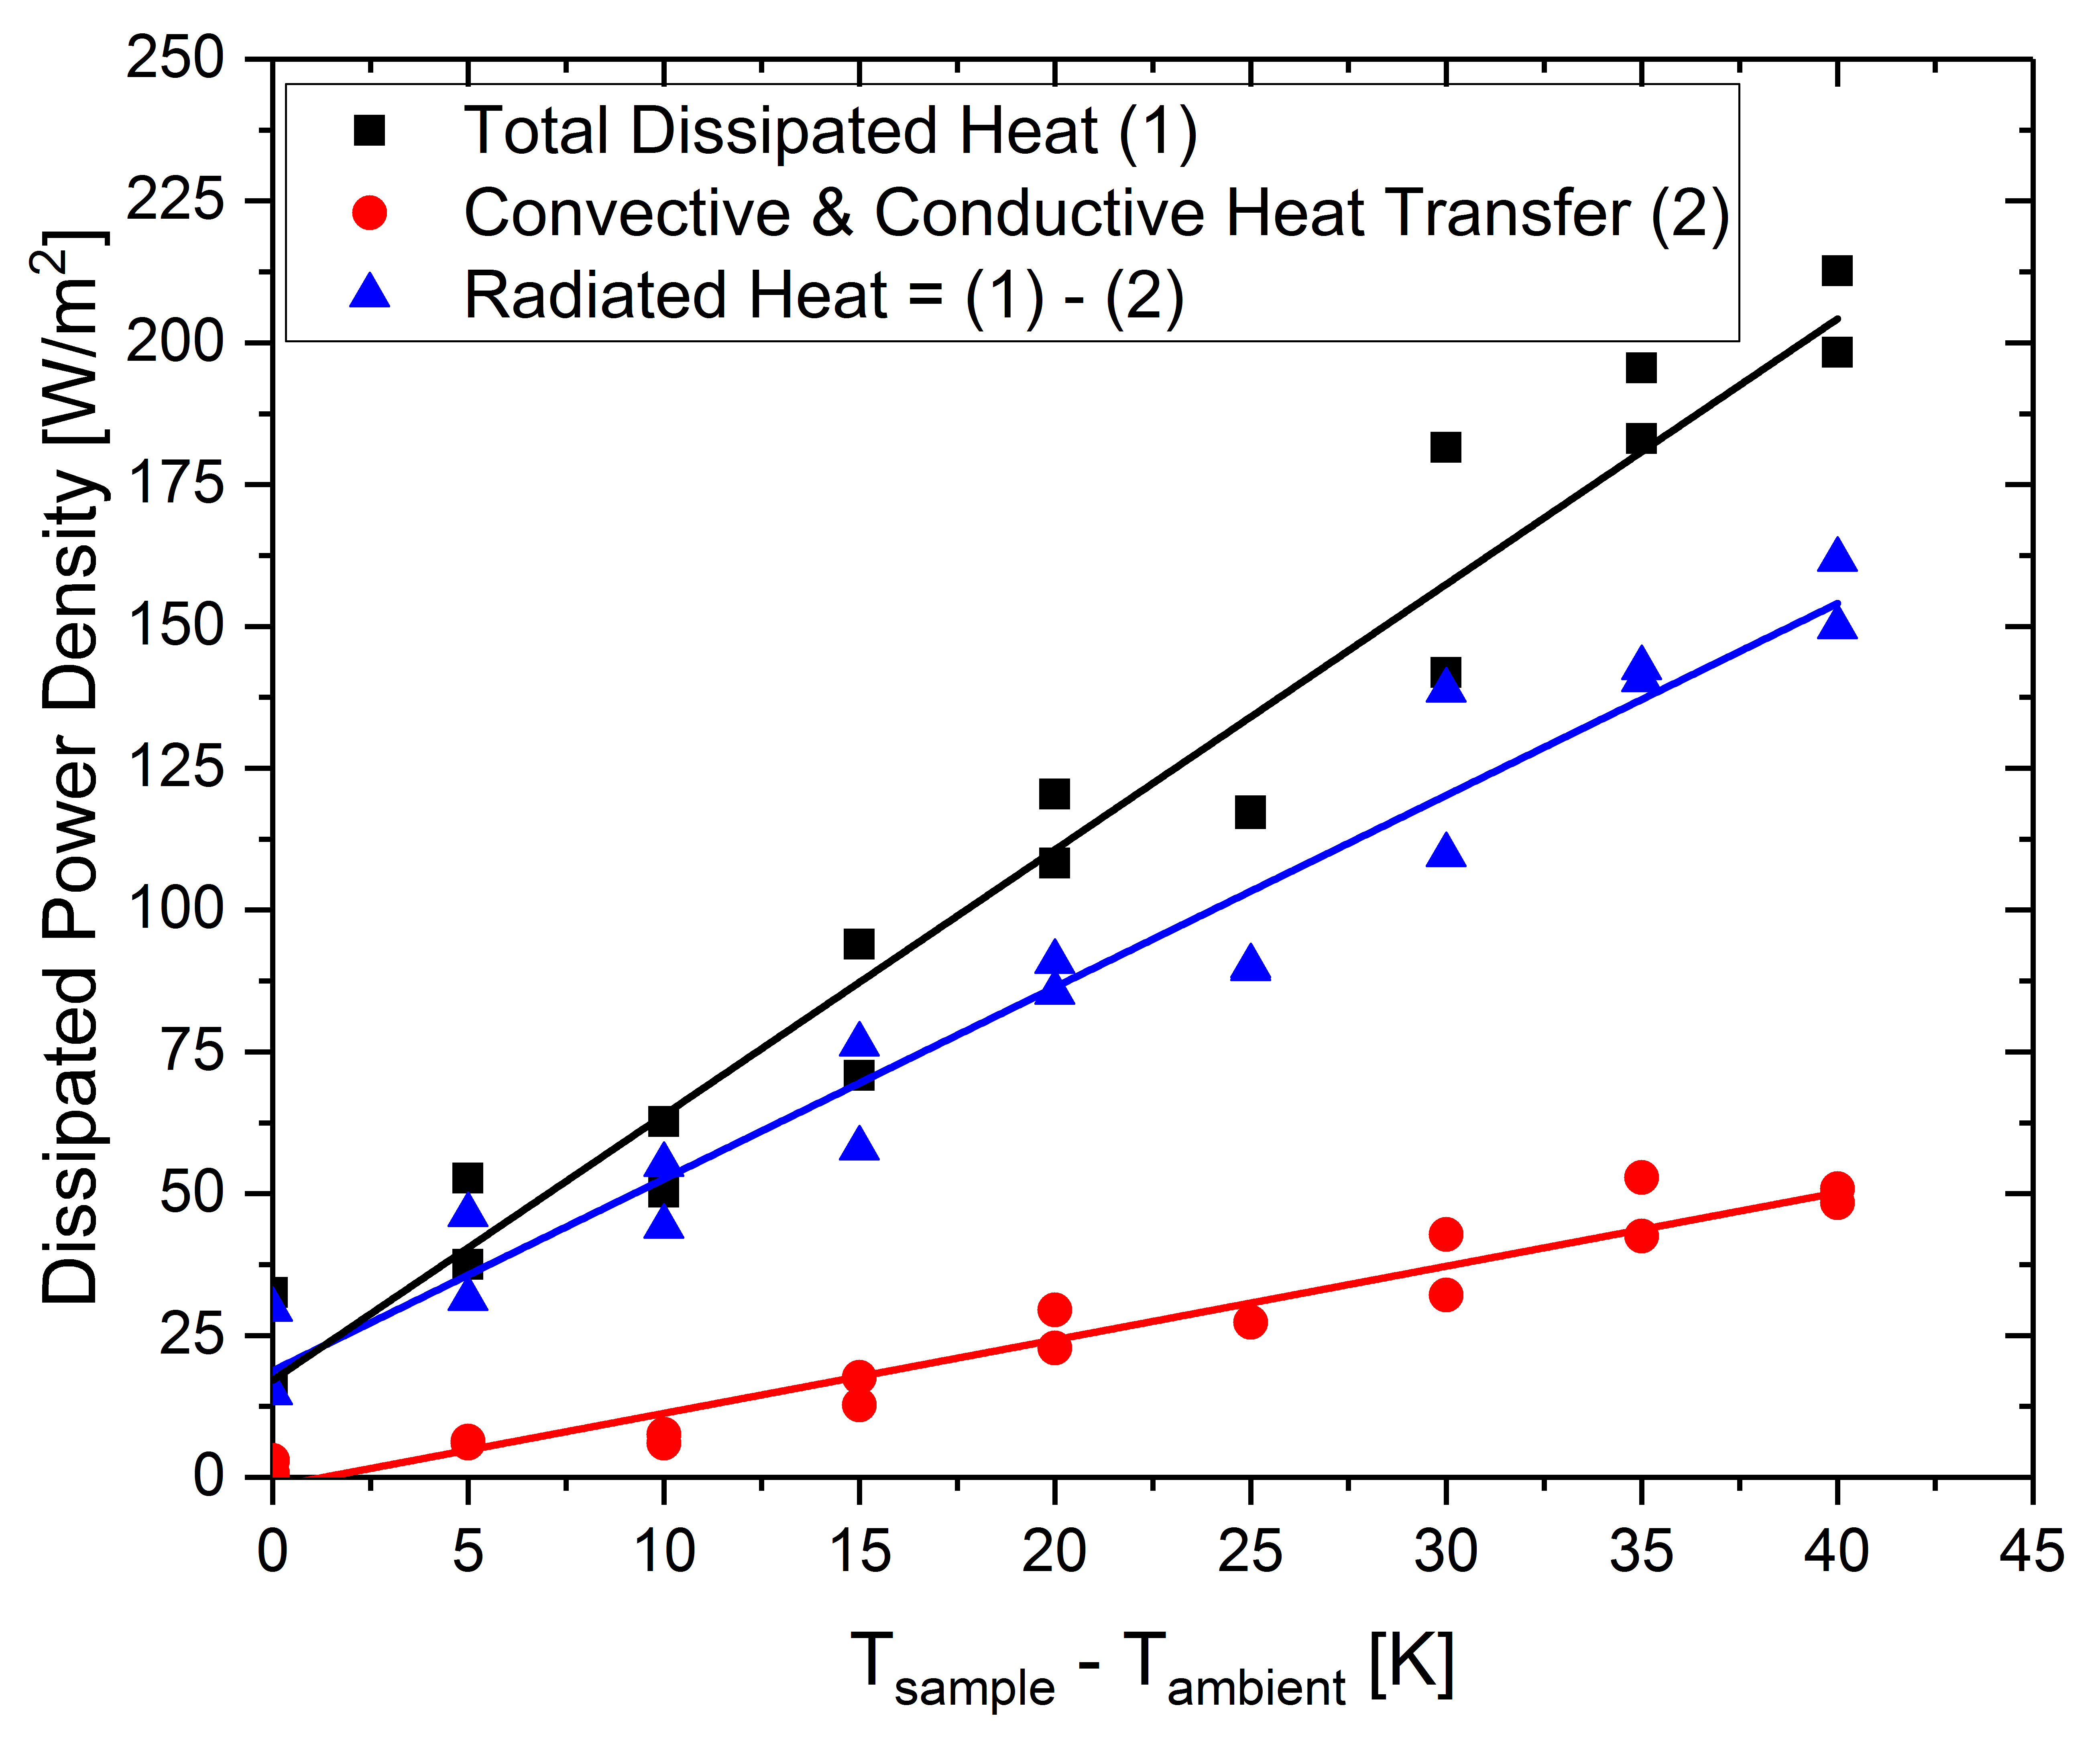
Dissipated power density in dependence of the temperature difference between sample and its surroundings
The figure shows the dissipated power density in dependence of the temperature difference between sample and its surroundings. The highest power density was observed when no design element blocking the radiation of the sample was used. In this case the heat was transferred from the sample to its surroundings by heat conduction, heat radiation and heat convection. Applying a heat radiation blocking element led to a significantly decreased power density as heat was transferred only by heat conduction and heat convection. The intensity of the dissipated heat radiation was evaluated by calculating the difference of the power densities observed for the two different situations (i.e whether the heat radiation blocking element was used or not).
Copyright: JOANNEUM RESEARCH

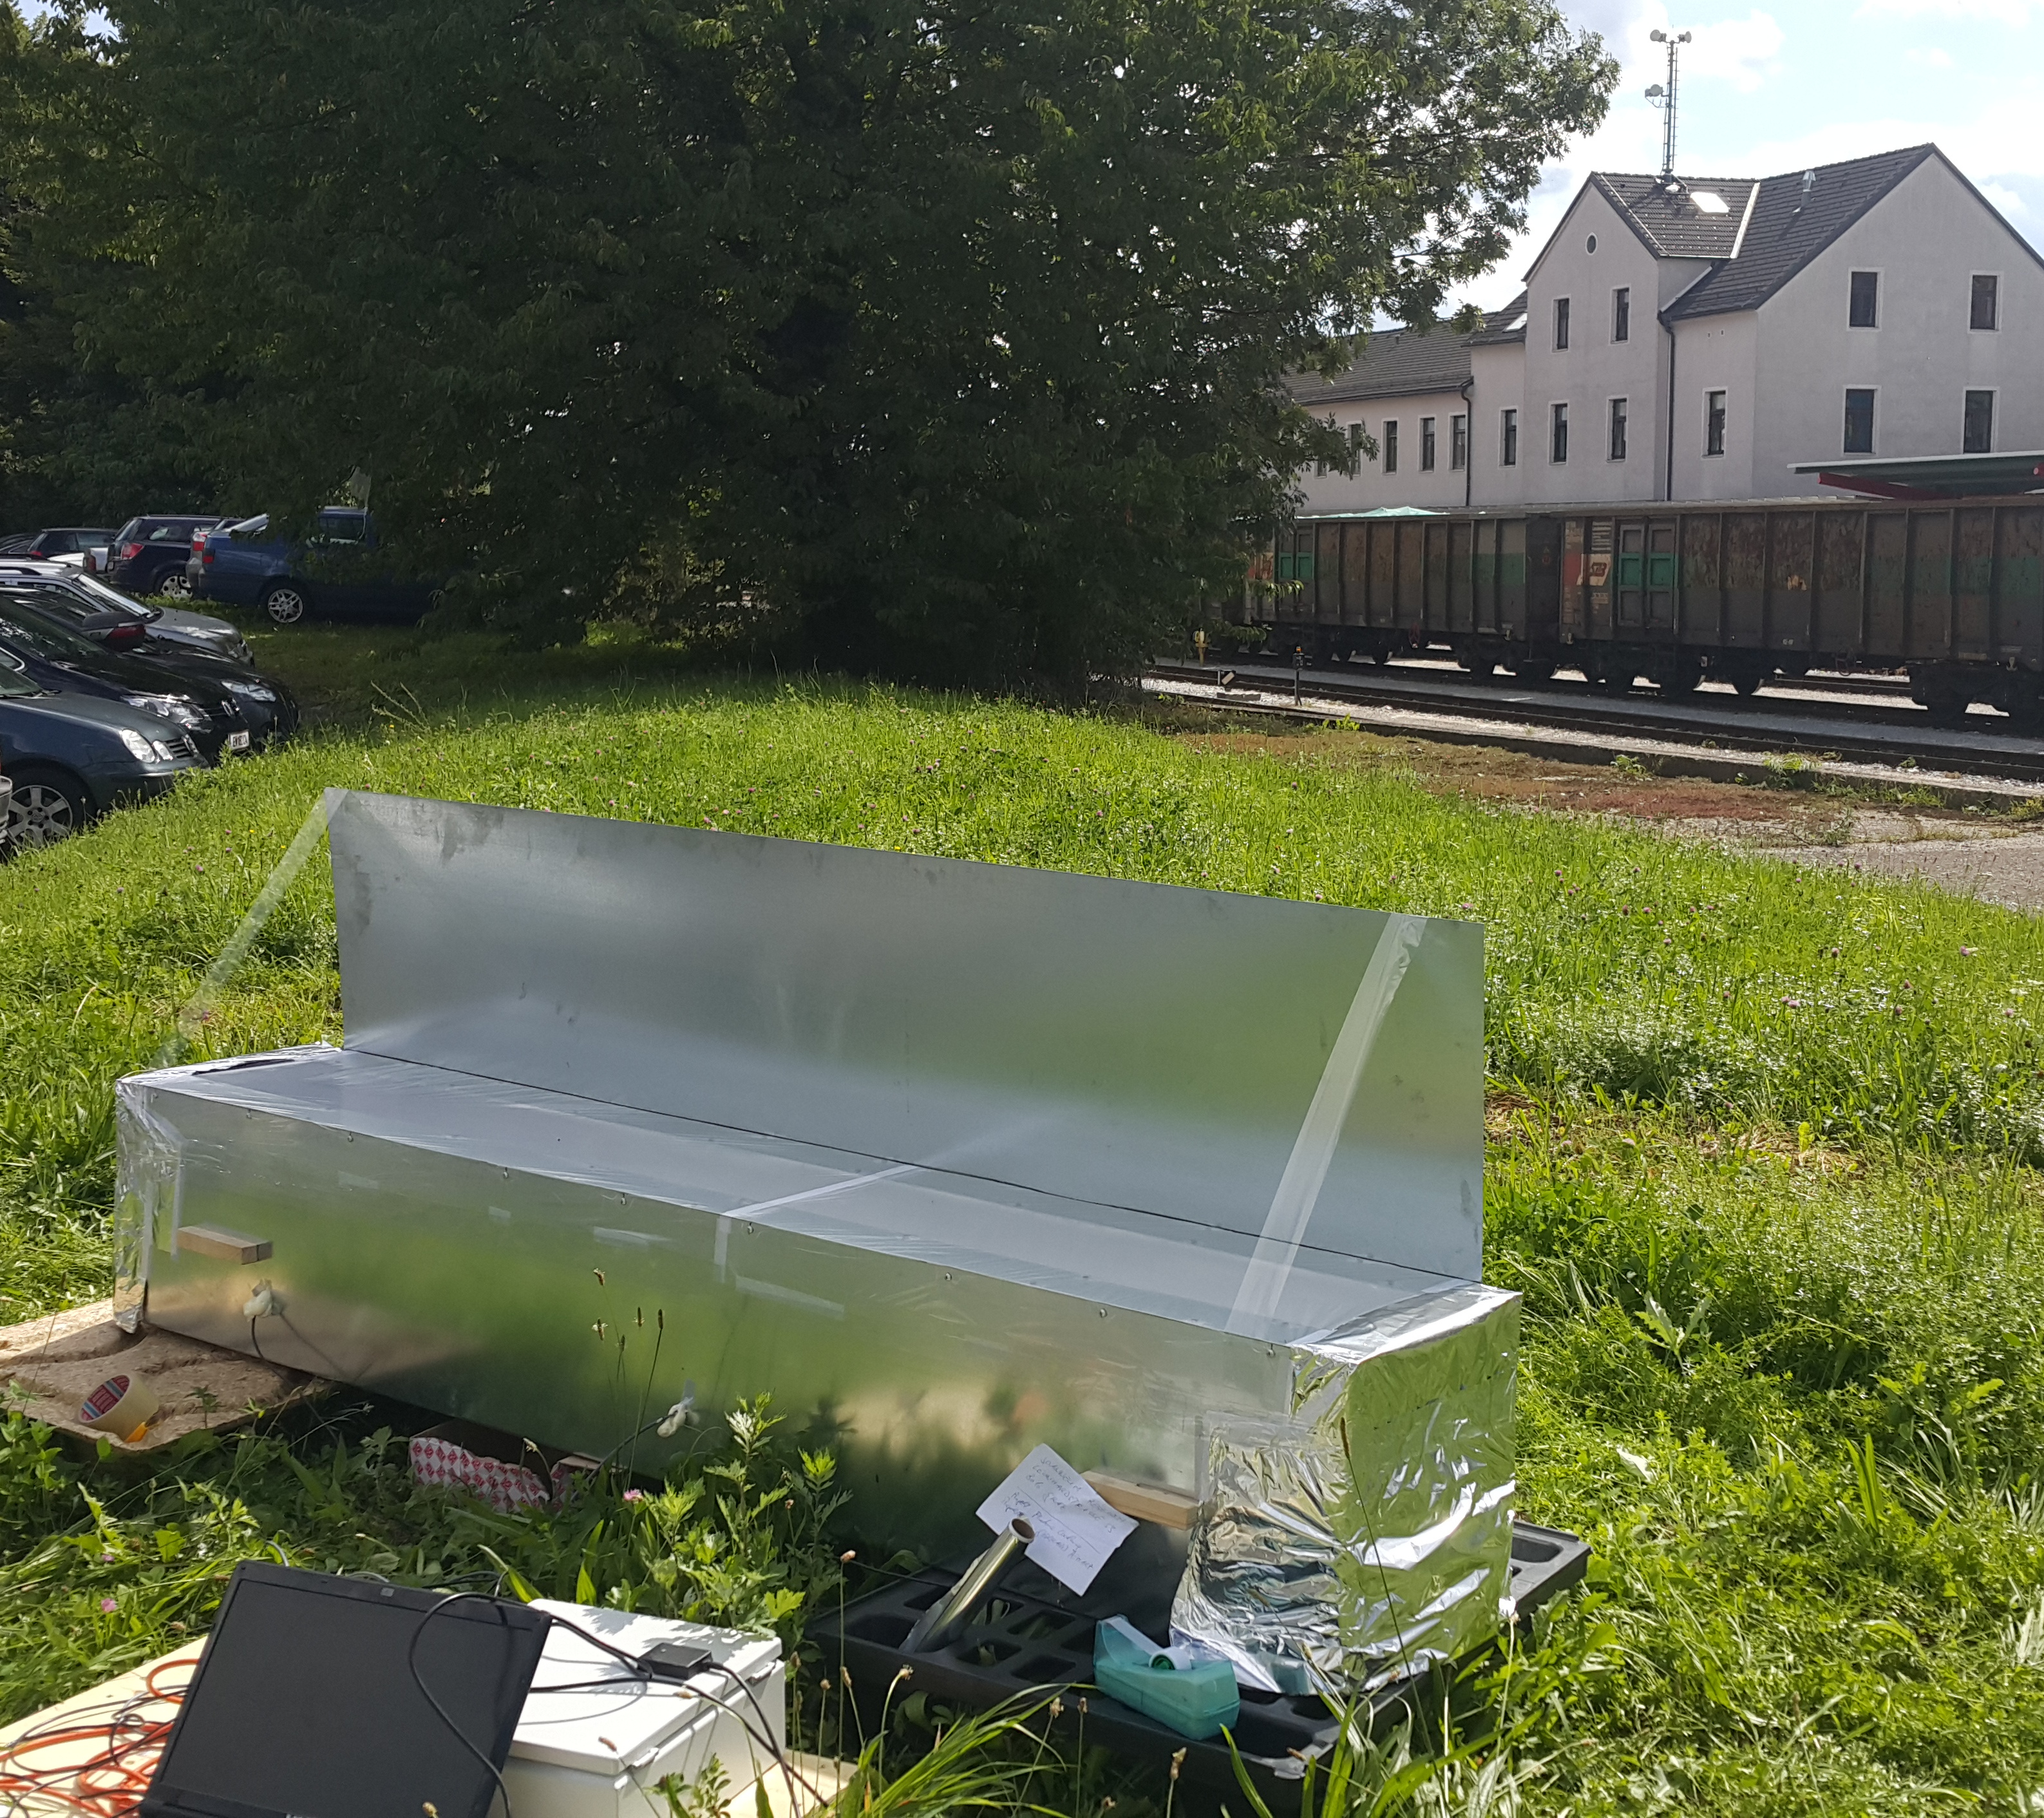
Outdoor use of a Photonic Cooling functional model
Image taken on 04.09.2017, Weiz.
Copyright: JOANNEUM RESEARCH
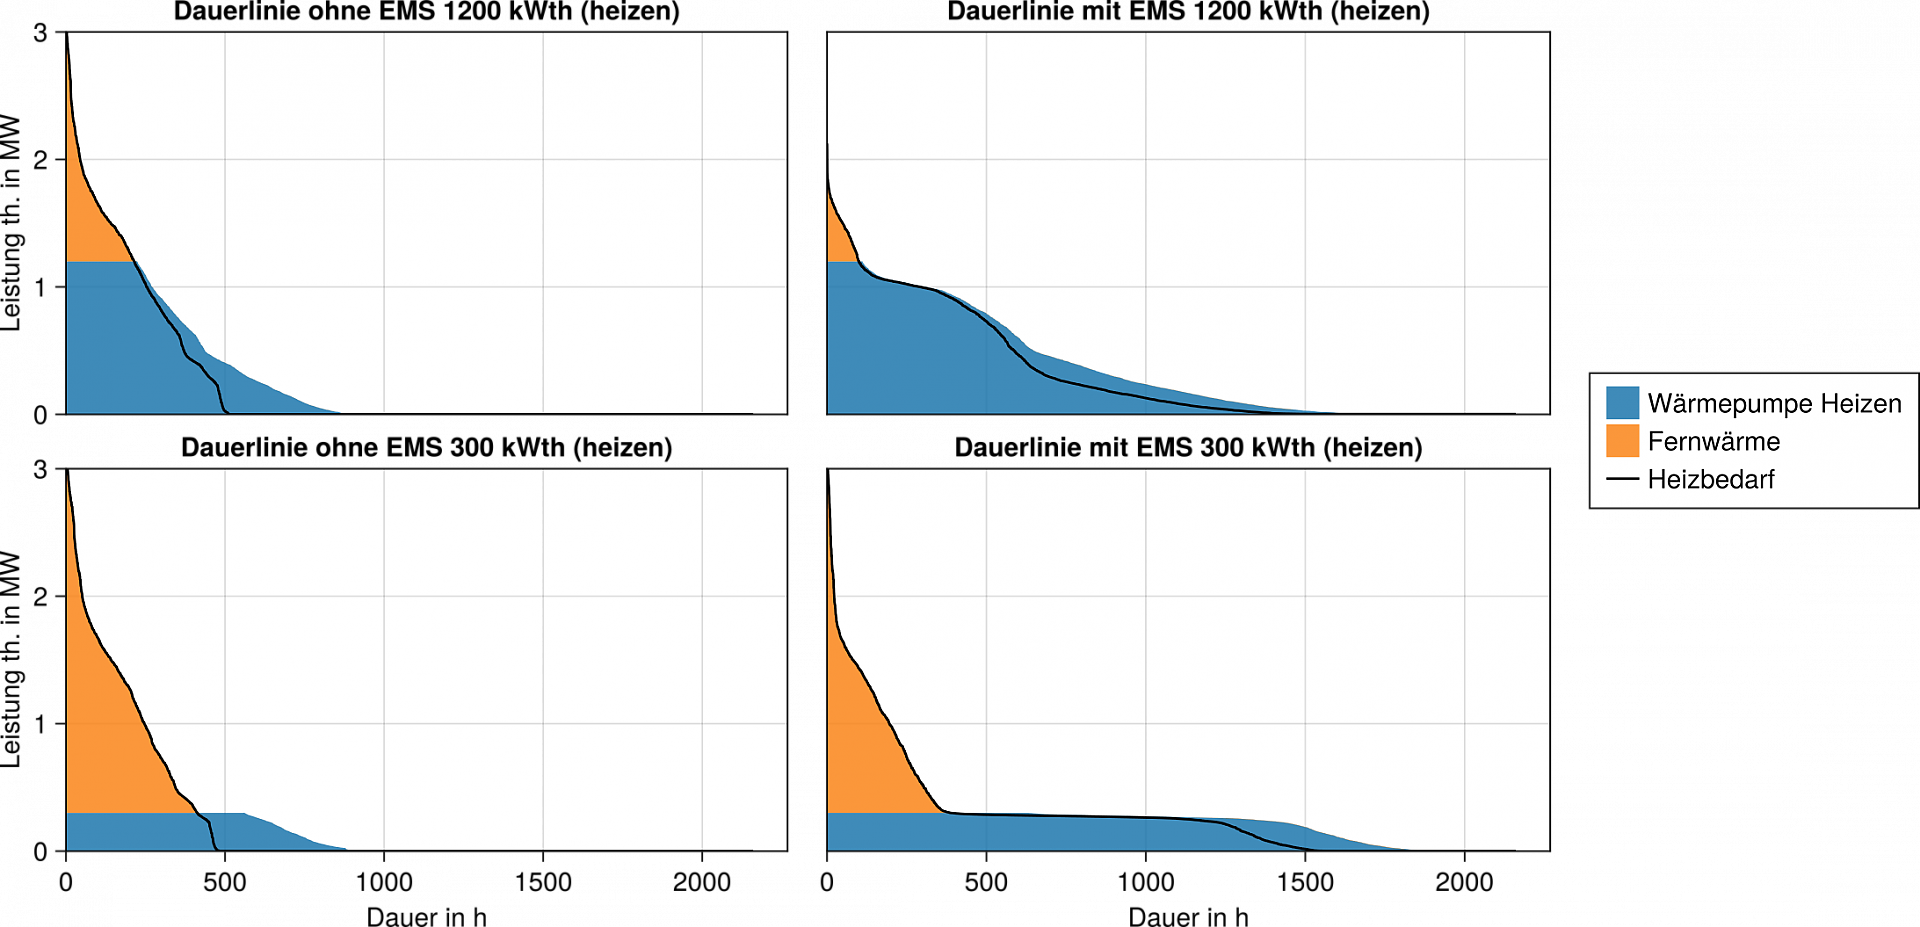
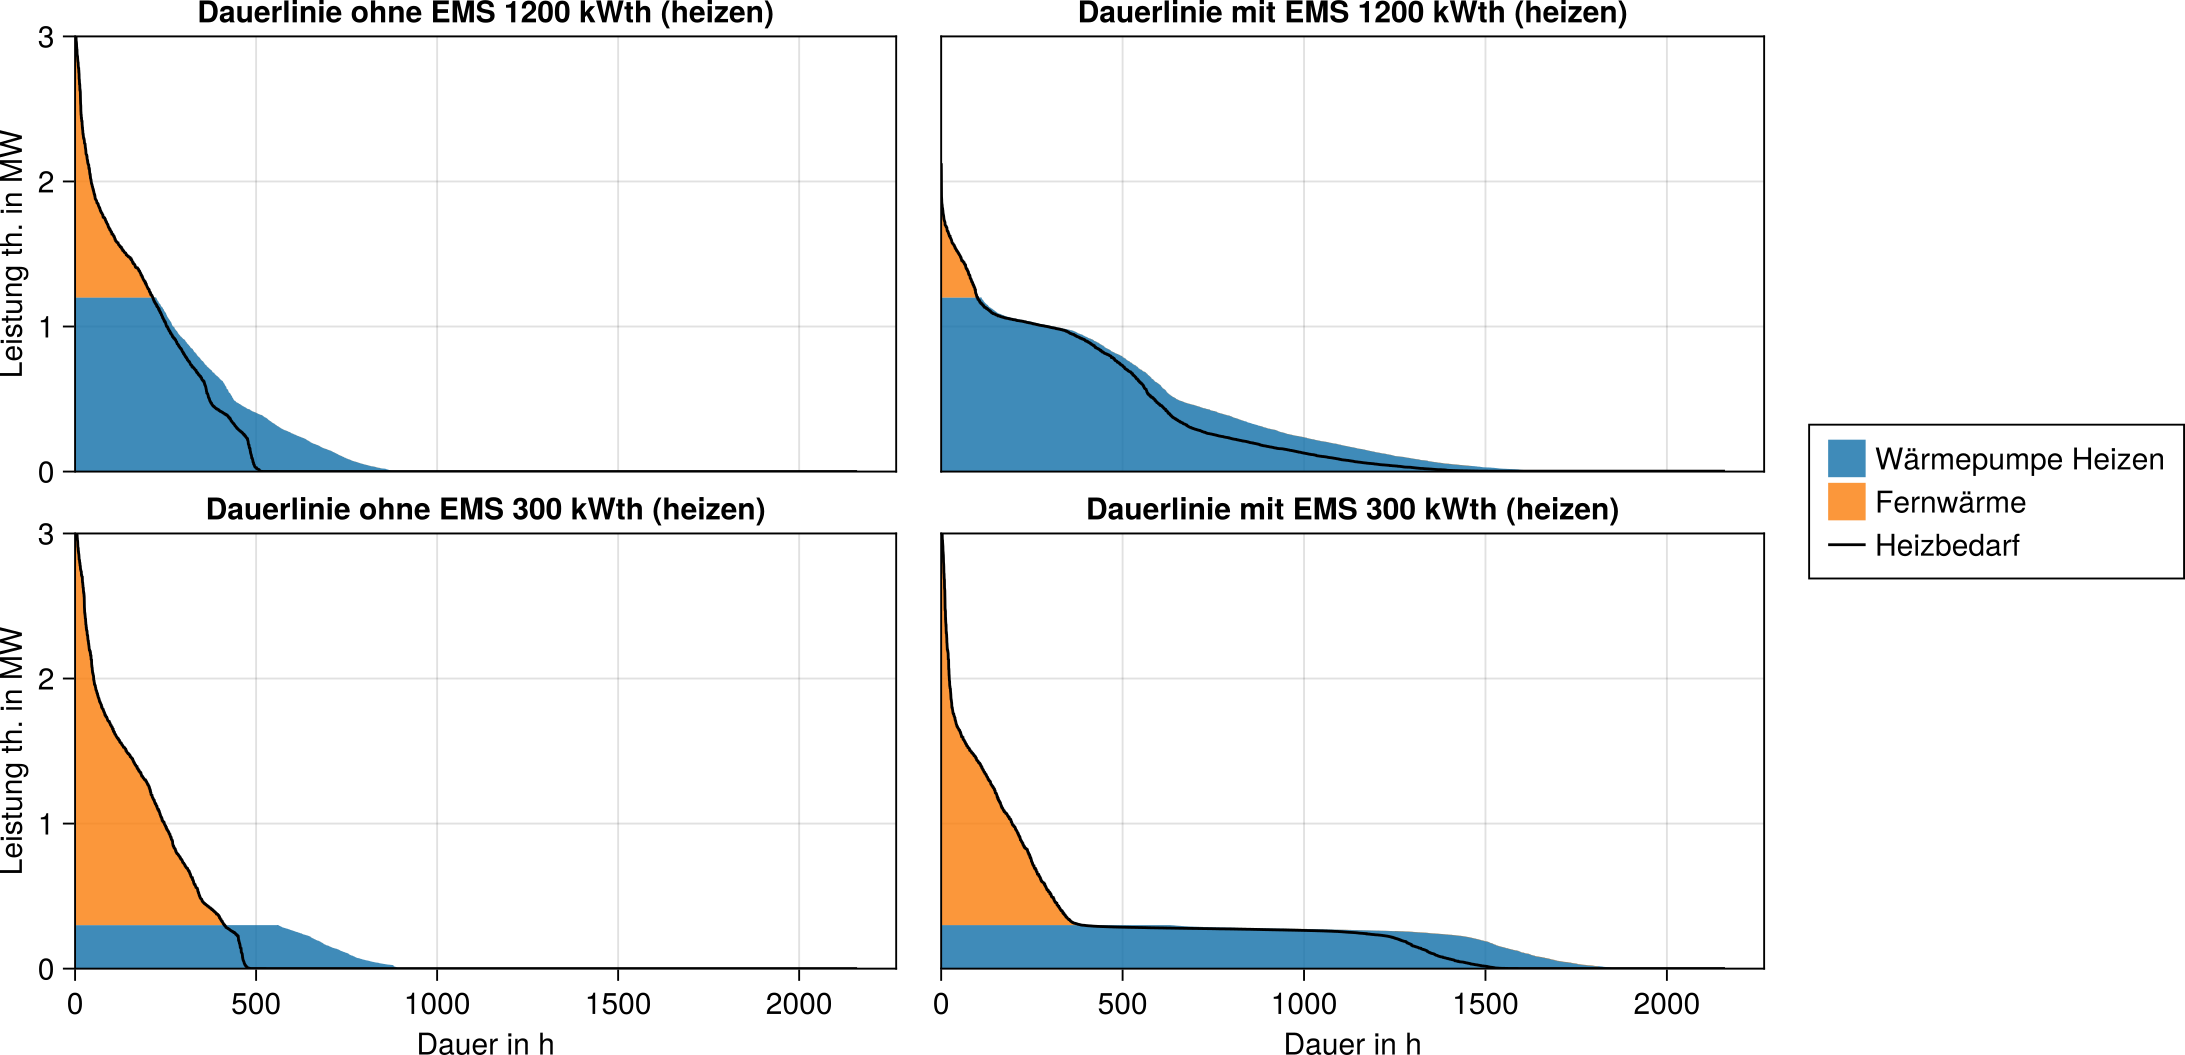
Load shifting potential with EMS
Continuous lines for the first quarter (heating demand) with component activation. With EMS (right), higher outputs are in principle demanded less frequently. Since all power above the maximum power of the heat pump has to be provided by the more expensive district heating, costs can be reduced. The blue area above the heating demand curve represents waste heat from the heat pump, since cooling demand also occurs in the first quarter, which must be provided by the heat pump / chiller.
Copyright: BEST - Bioenergy and Sustainable Technologies GmbH
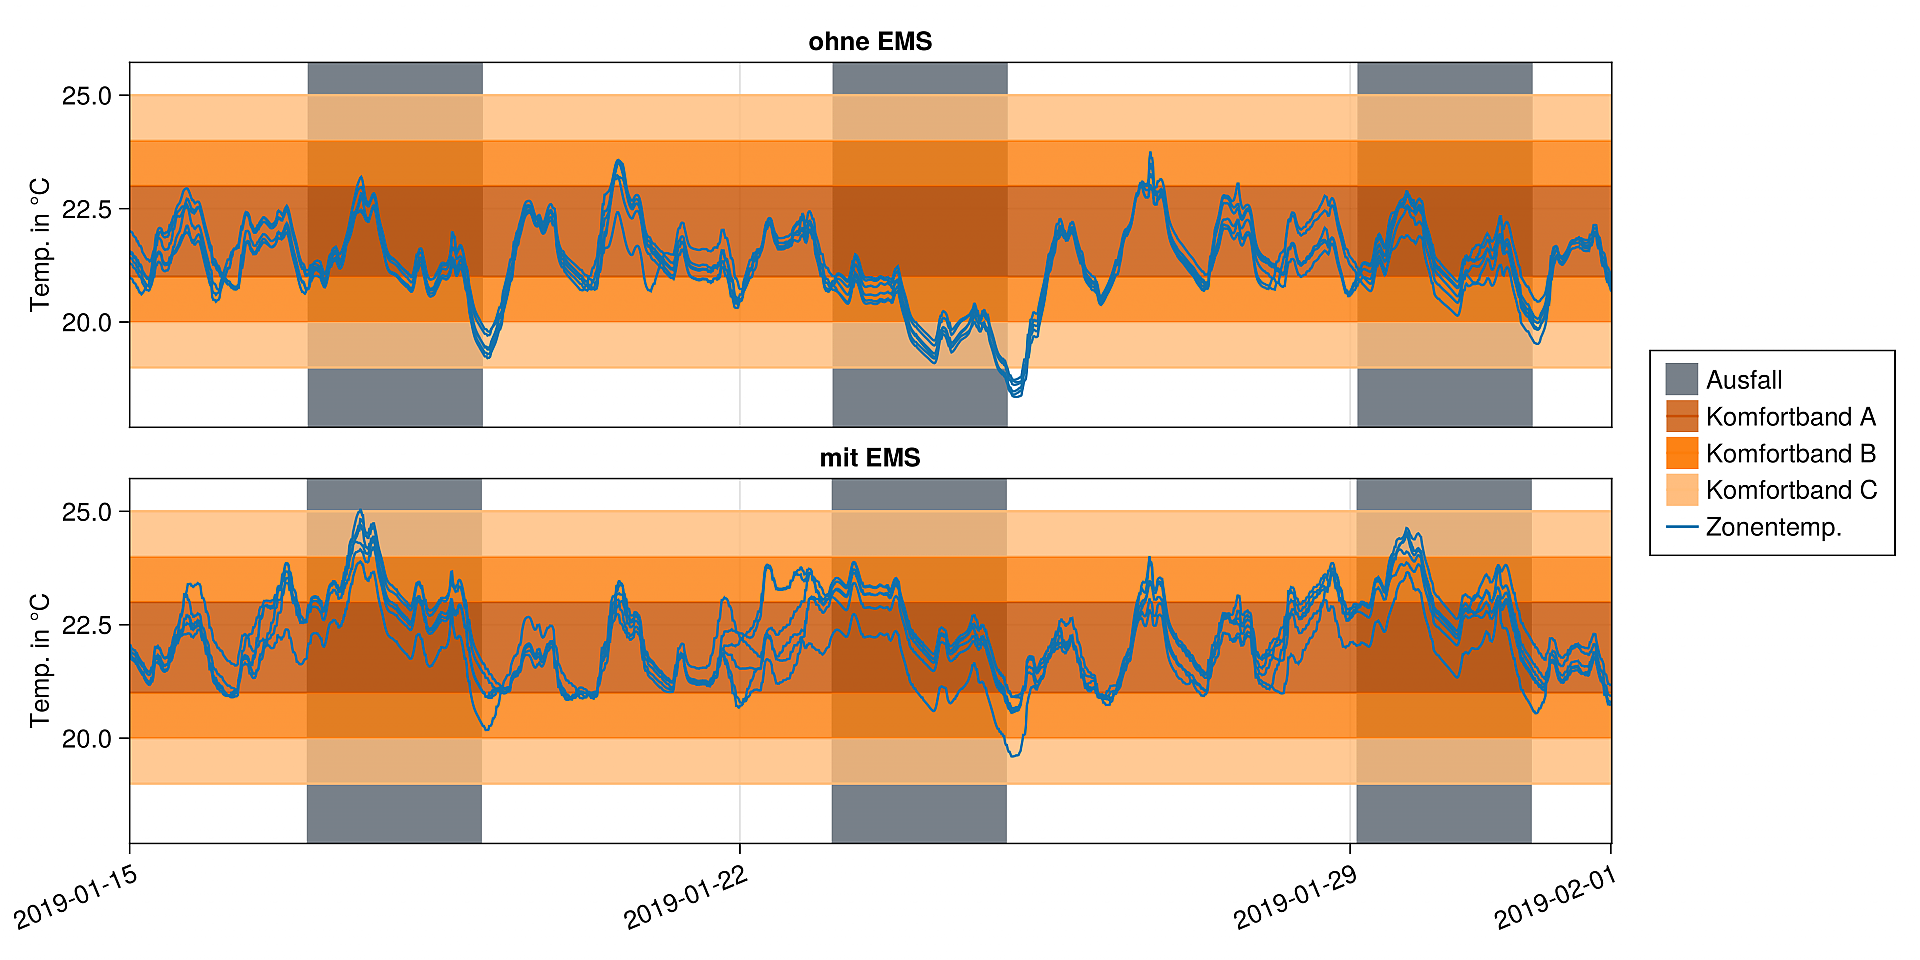
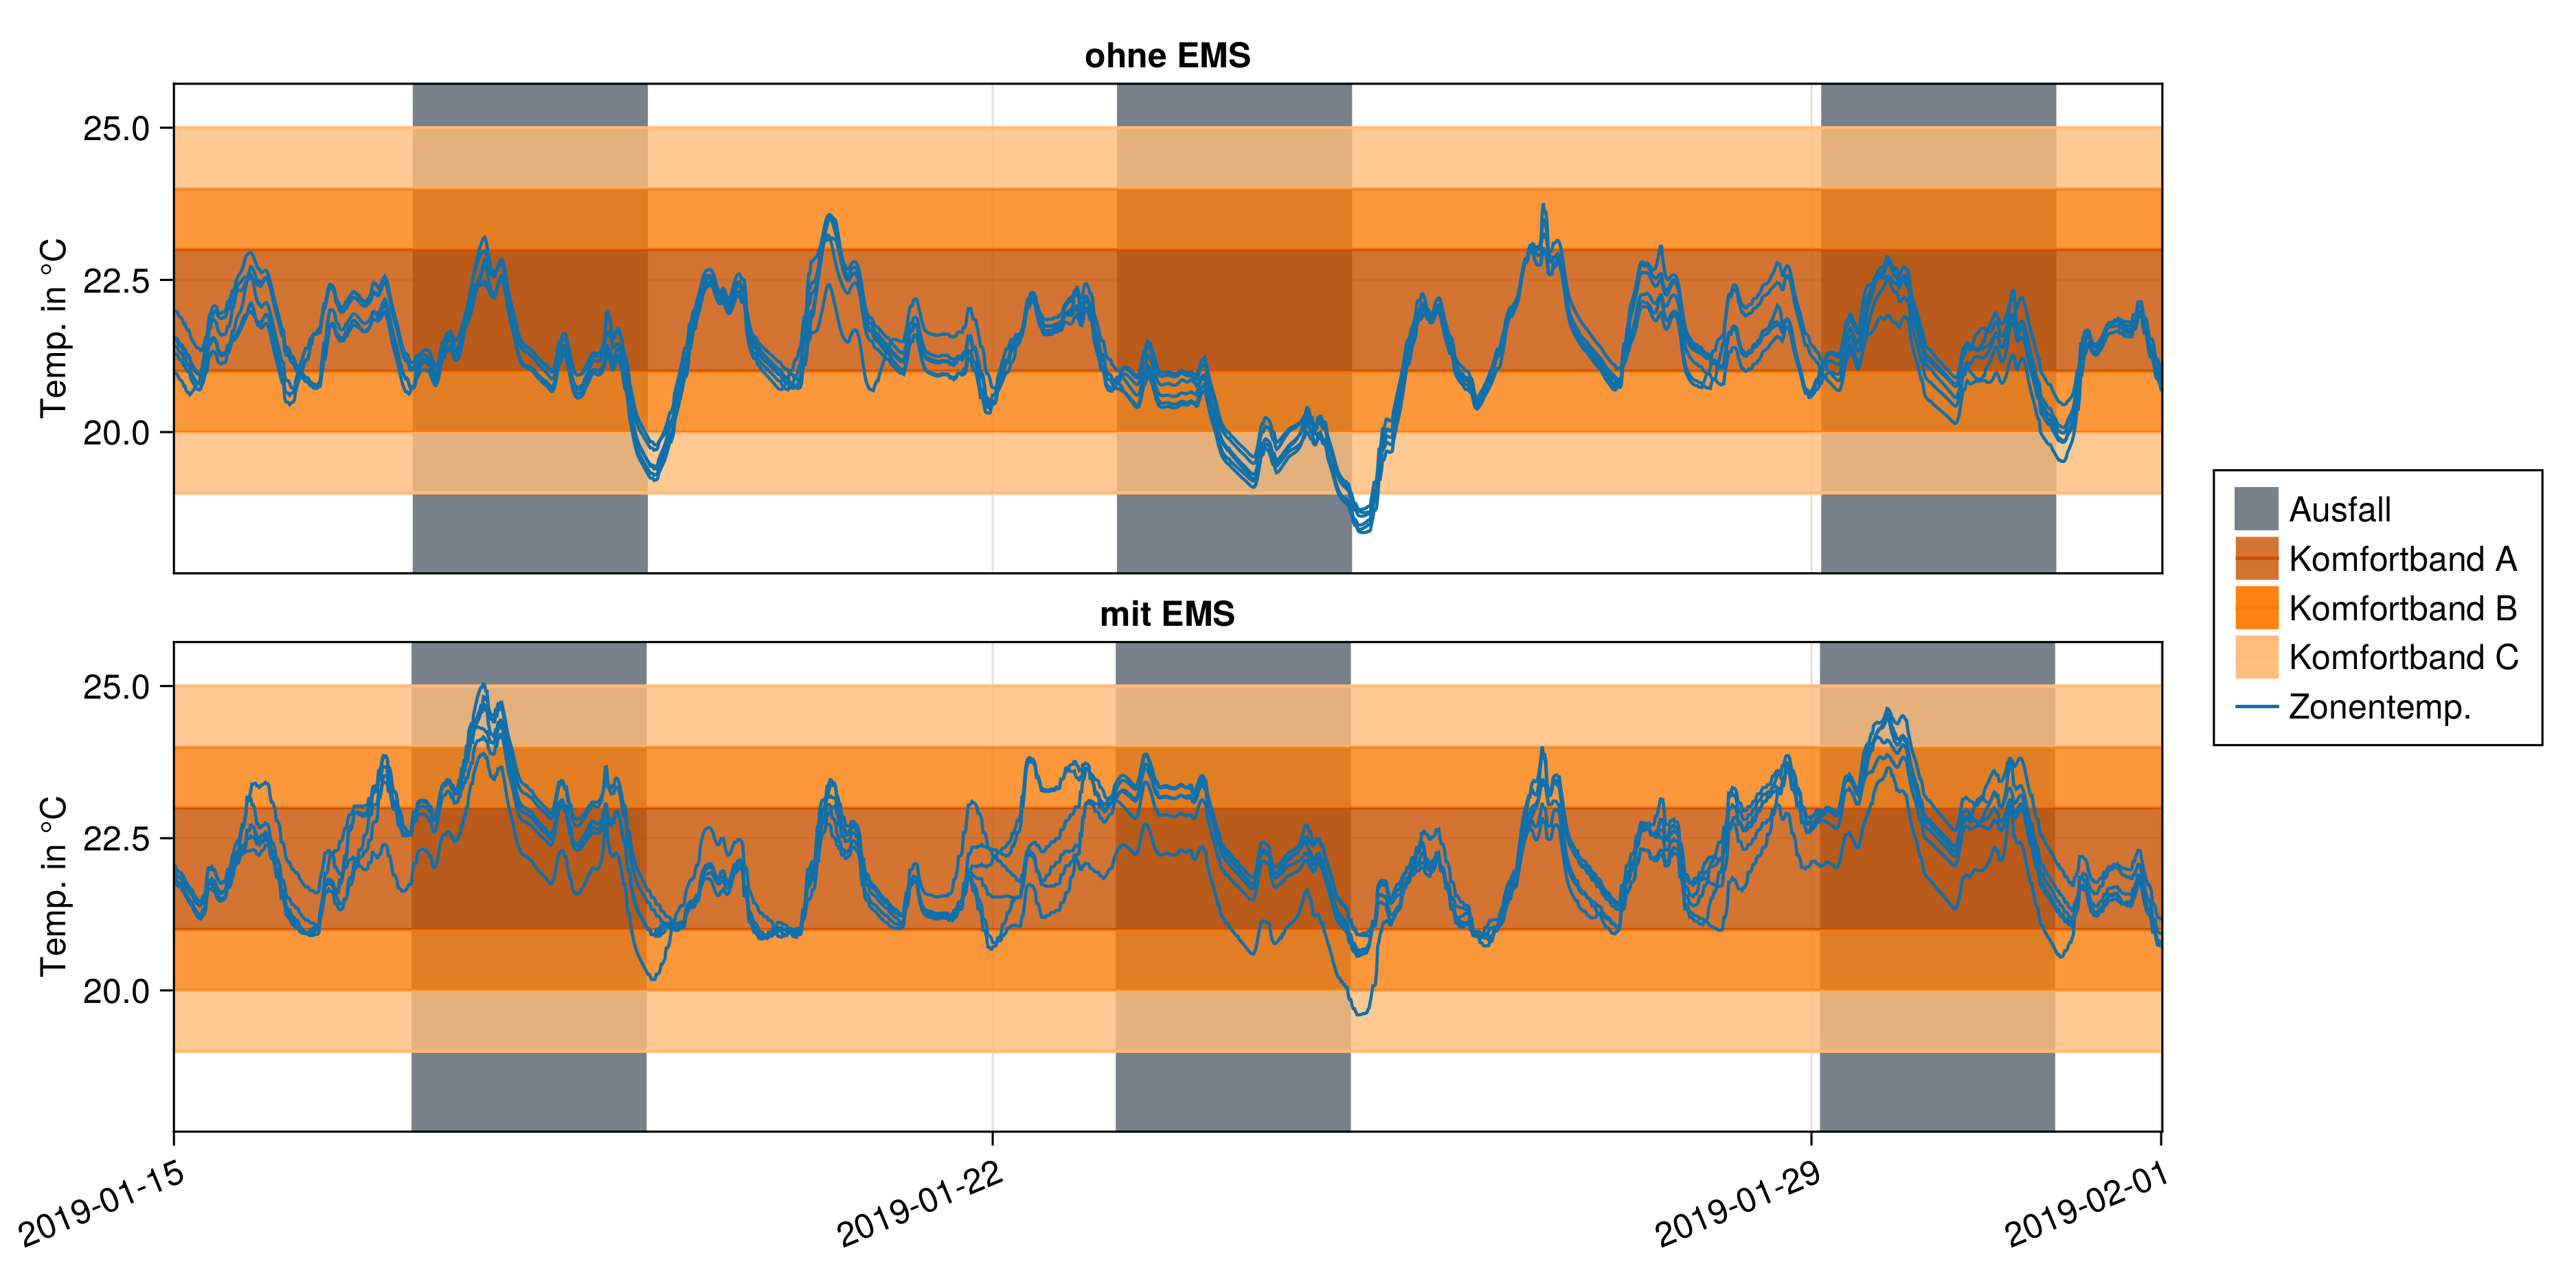
Simulation: failure of the heating circuit pump
Comparison of a standard control and an EMS that is informed of an impending failure of the heating circuit pump. The EMS preheats accordingly to prevent undercooling. Conversely, however, the comfort limits are sometimes exceeded in the other direction, i.e. a slight overheating, because the time constants are correspondingly long.
Copyright: BEST - Bioenergy and Sustainable Technologies GmbH
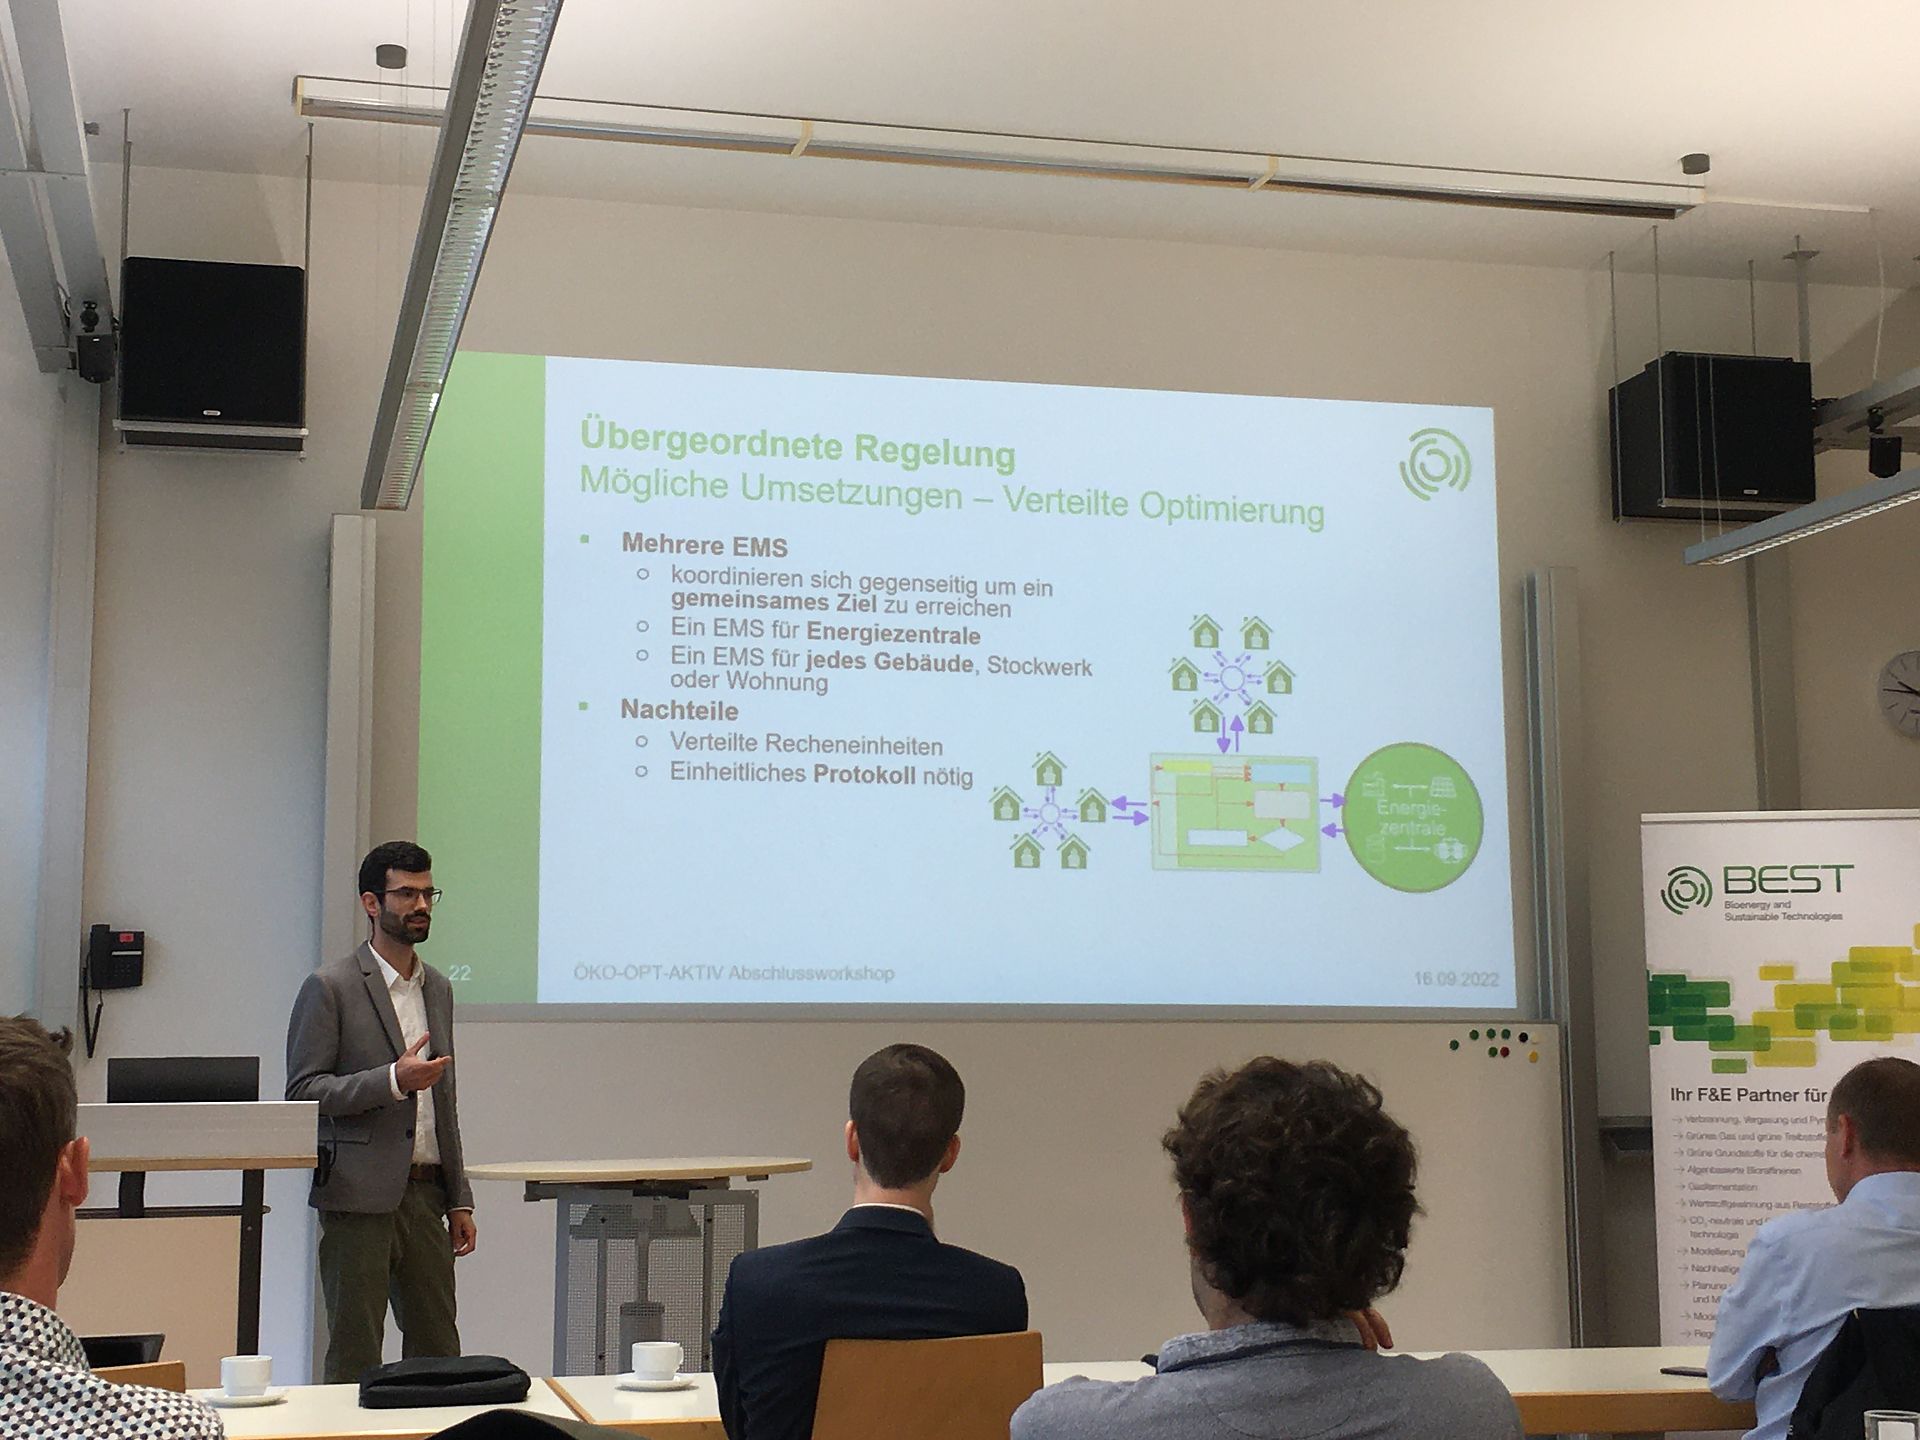
Final workshop ÖKO-OPT-AKTIV
Presentation of Valentin Kaisermayer about the results of the project ÖKO-OPT-AKTIV
Copyright: BEST - Bioenergy and Sustainable Technologies GmbH
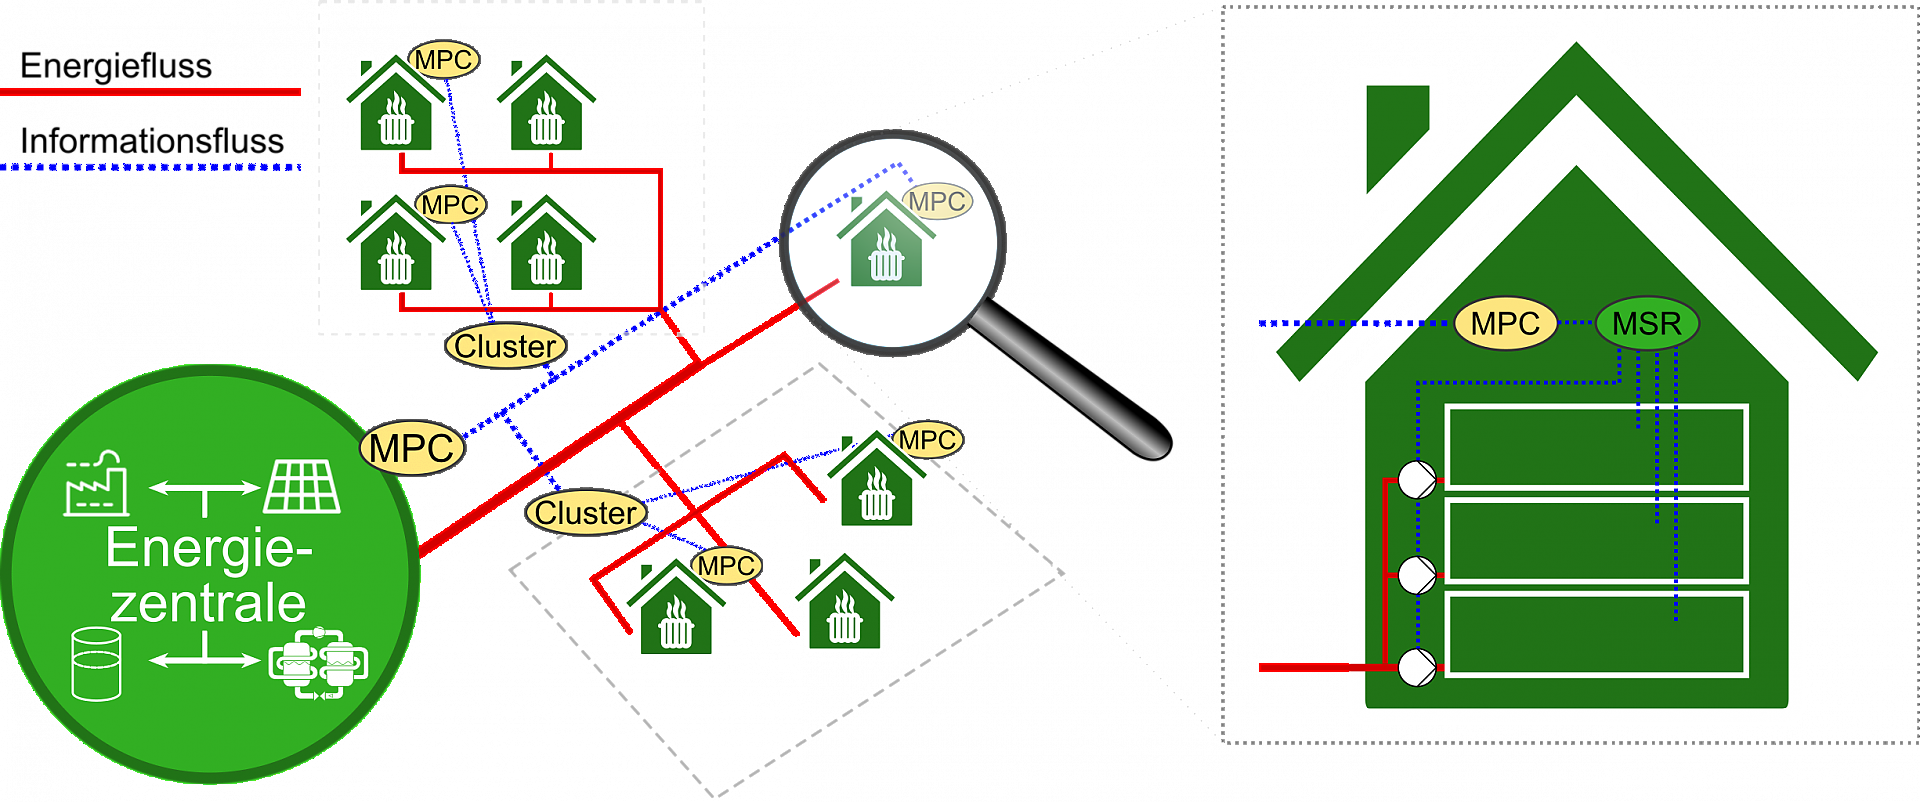
Superordinate structure of the energy hub
Proposed structure of the interaction between individual building control units and the controller of the energy hub. The controllers used are predictive, optimizing controllers (e.g. model predictive controllers, MPC).
Copyright: BEST - Bioenergy and Sustainable Technologies GmbH

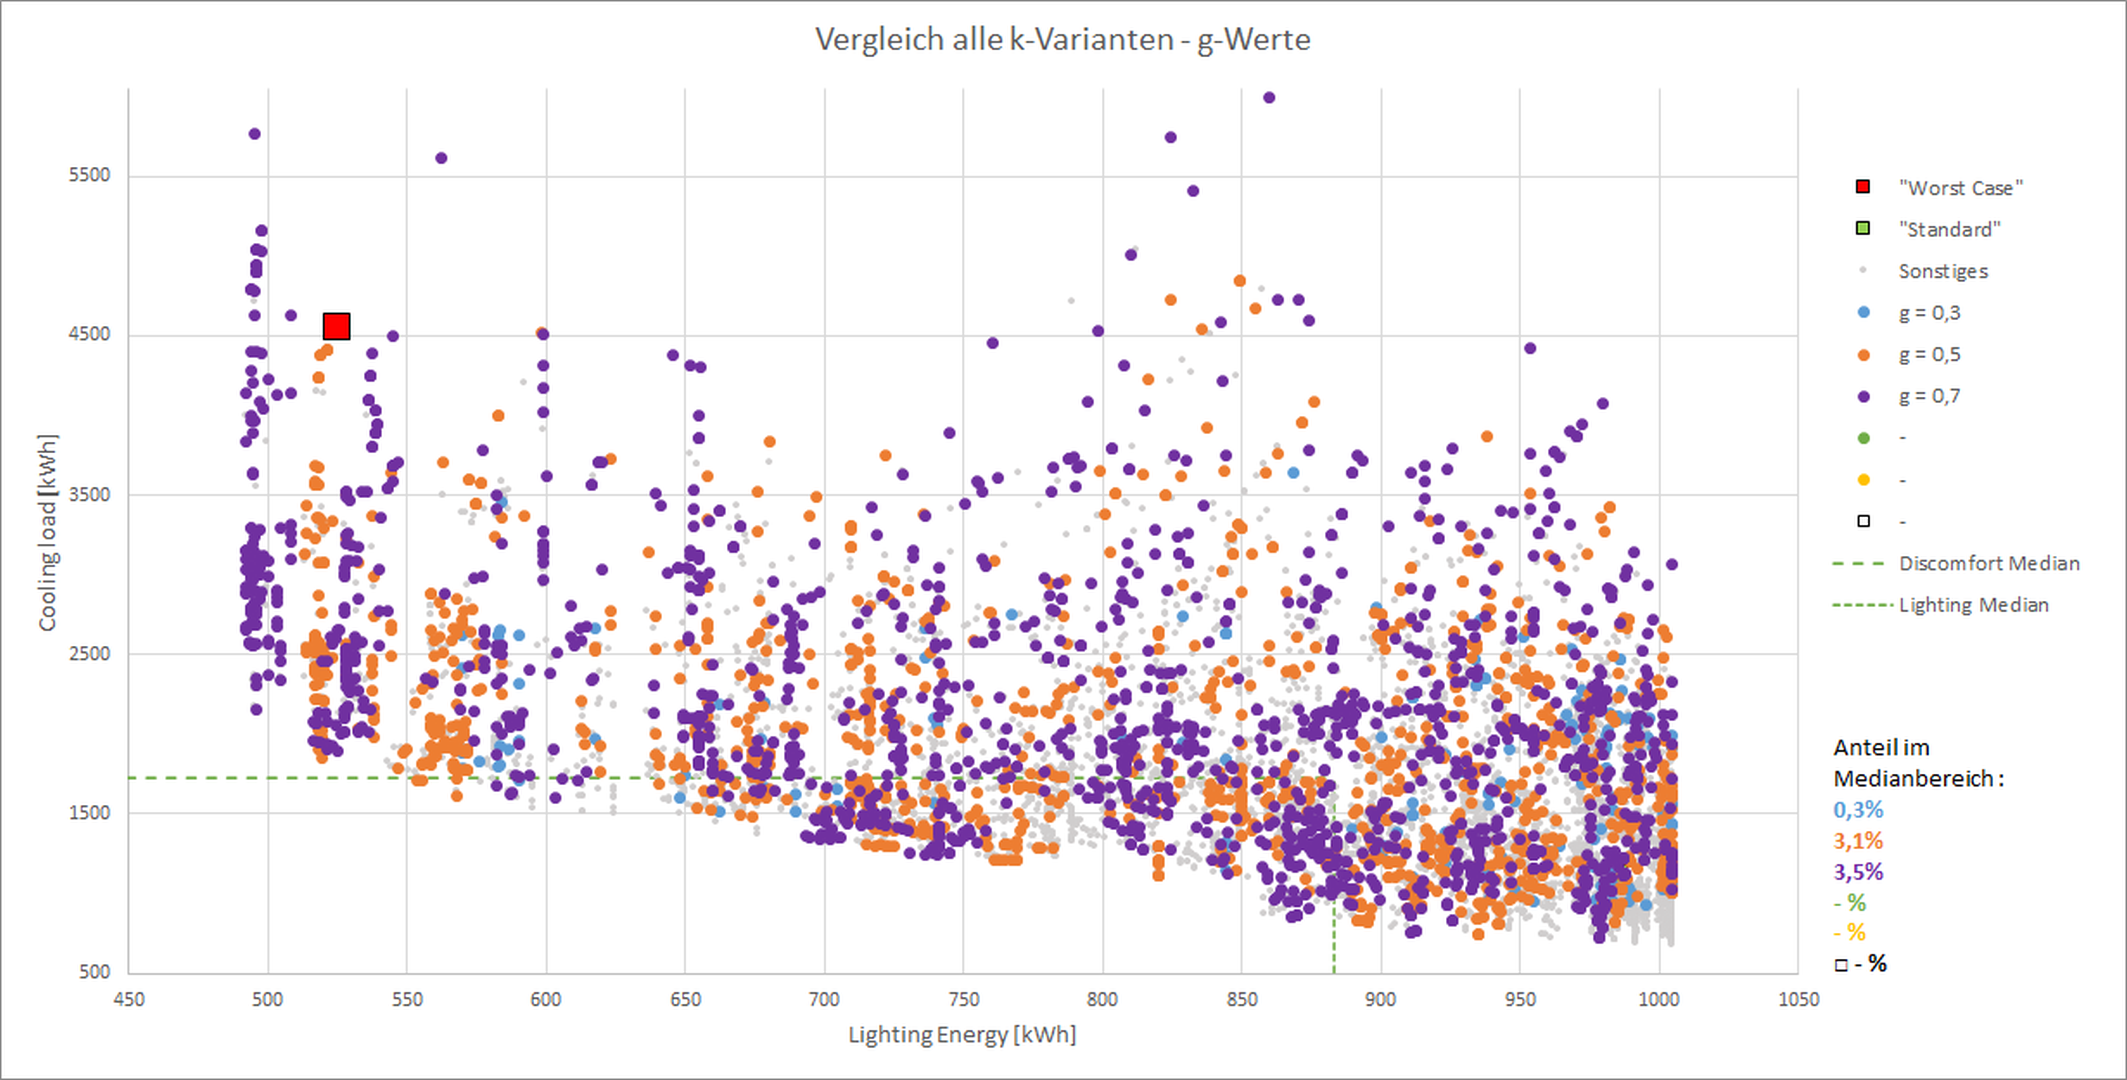
Cooling load &Lighting Energy, sorted by total solar transmission
The simulation results of all calculated parameter combinations including active cooling were depicted in a scatter diagram based on their cooling load and lighting energy and sorted by total solar transmission. The percentage shown for the "median area" refers to the total sum of calculated combinations.
Copyright: Holzforschung Austria & TU Graz
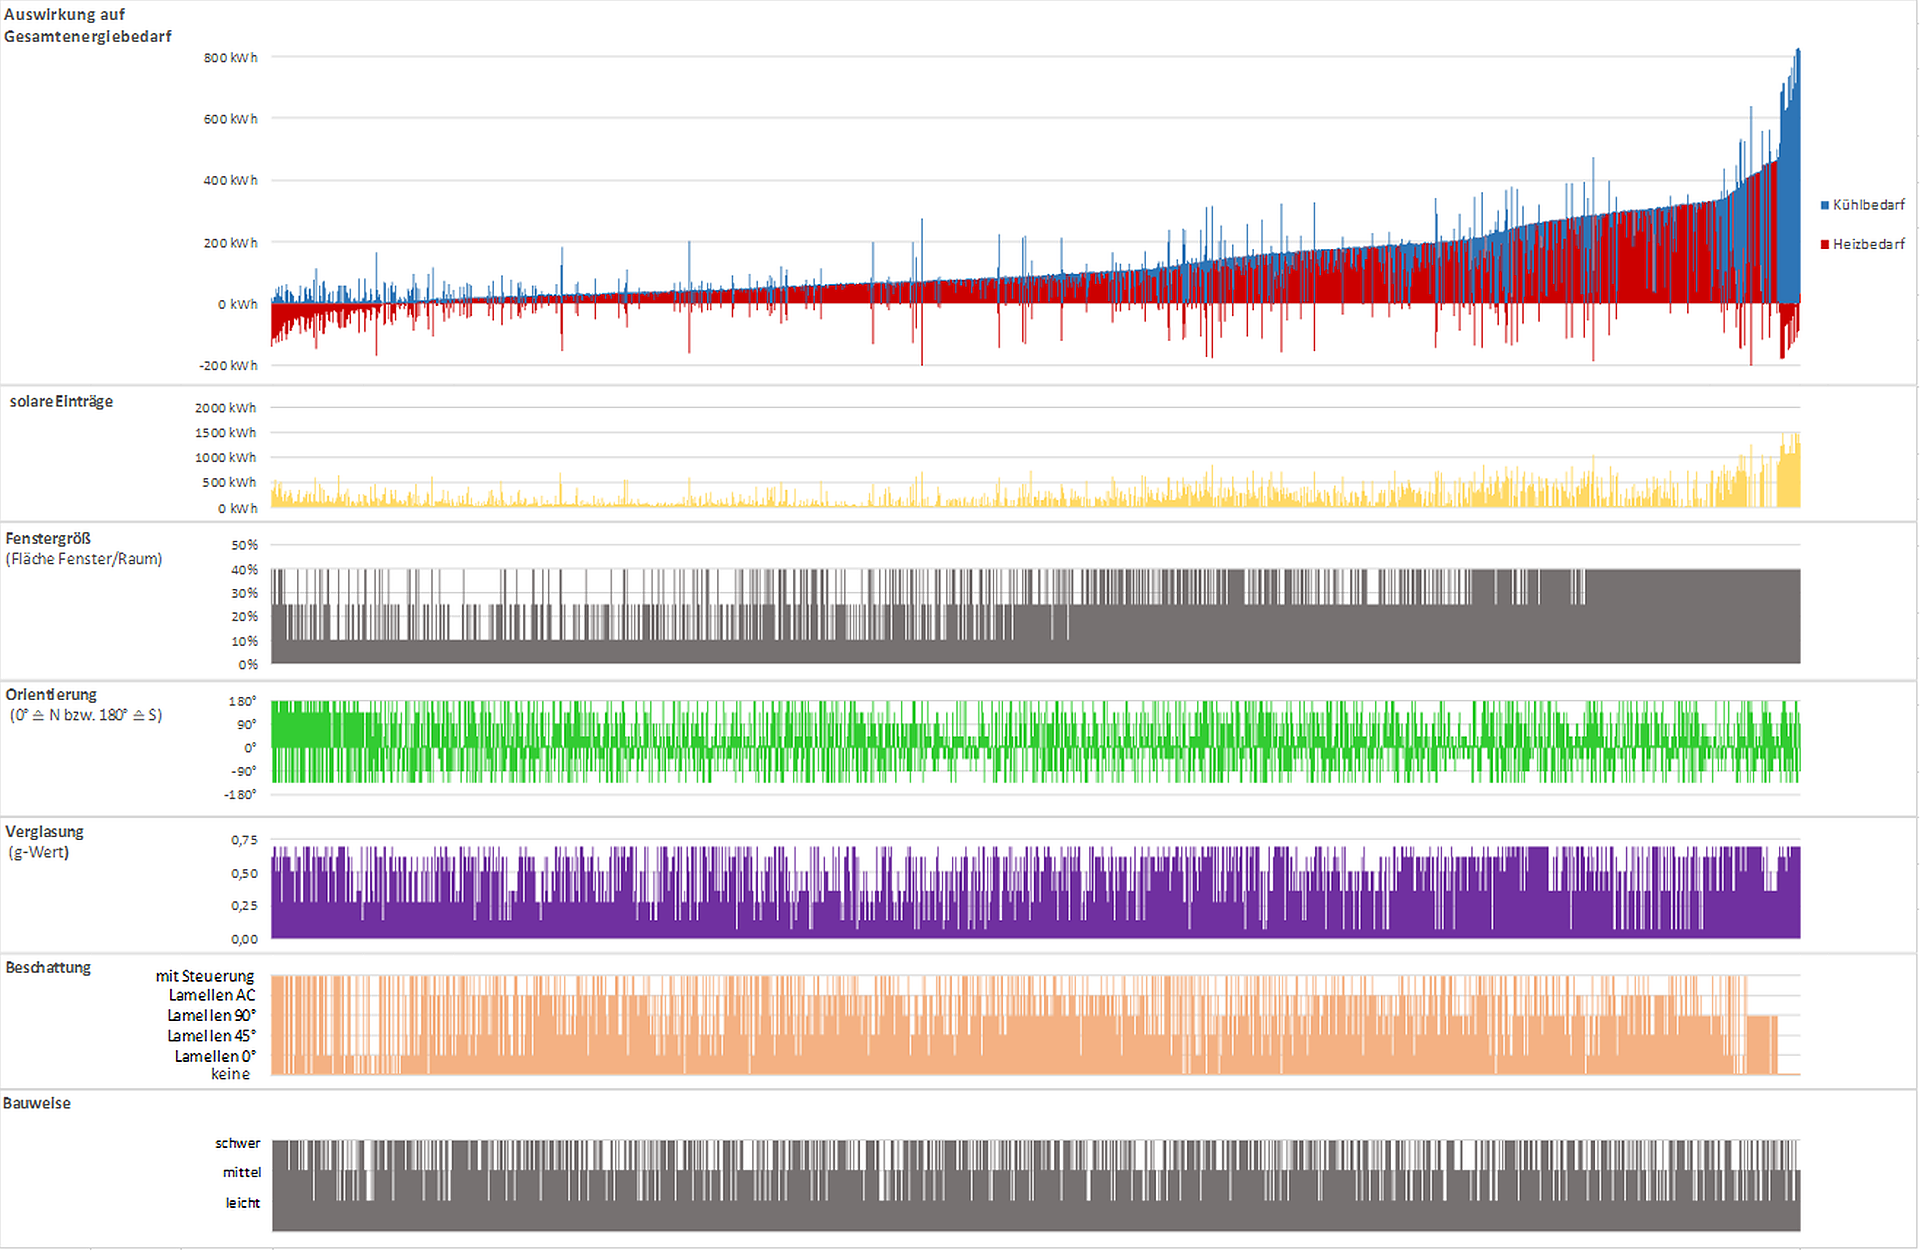
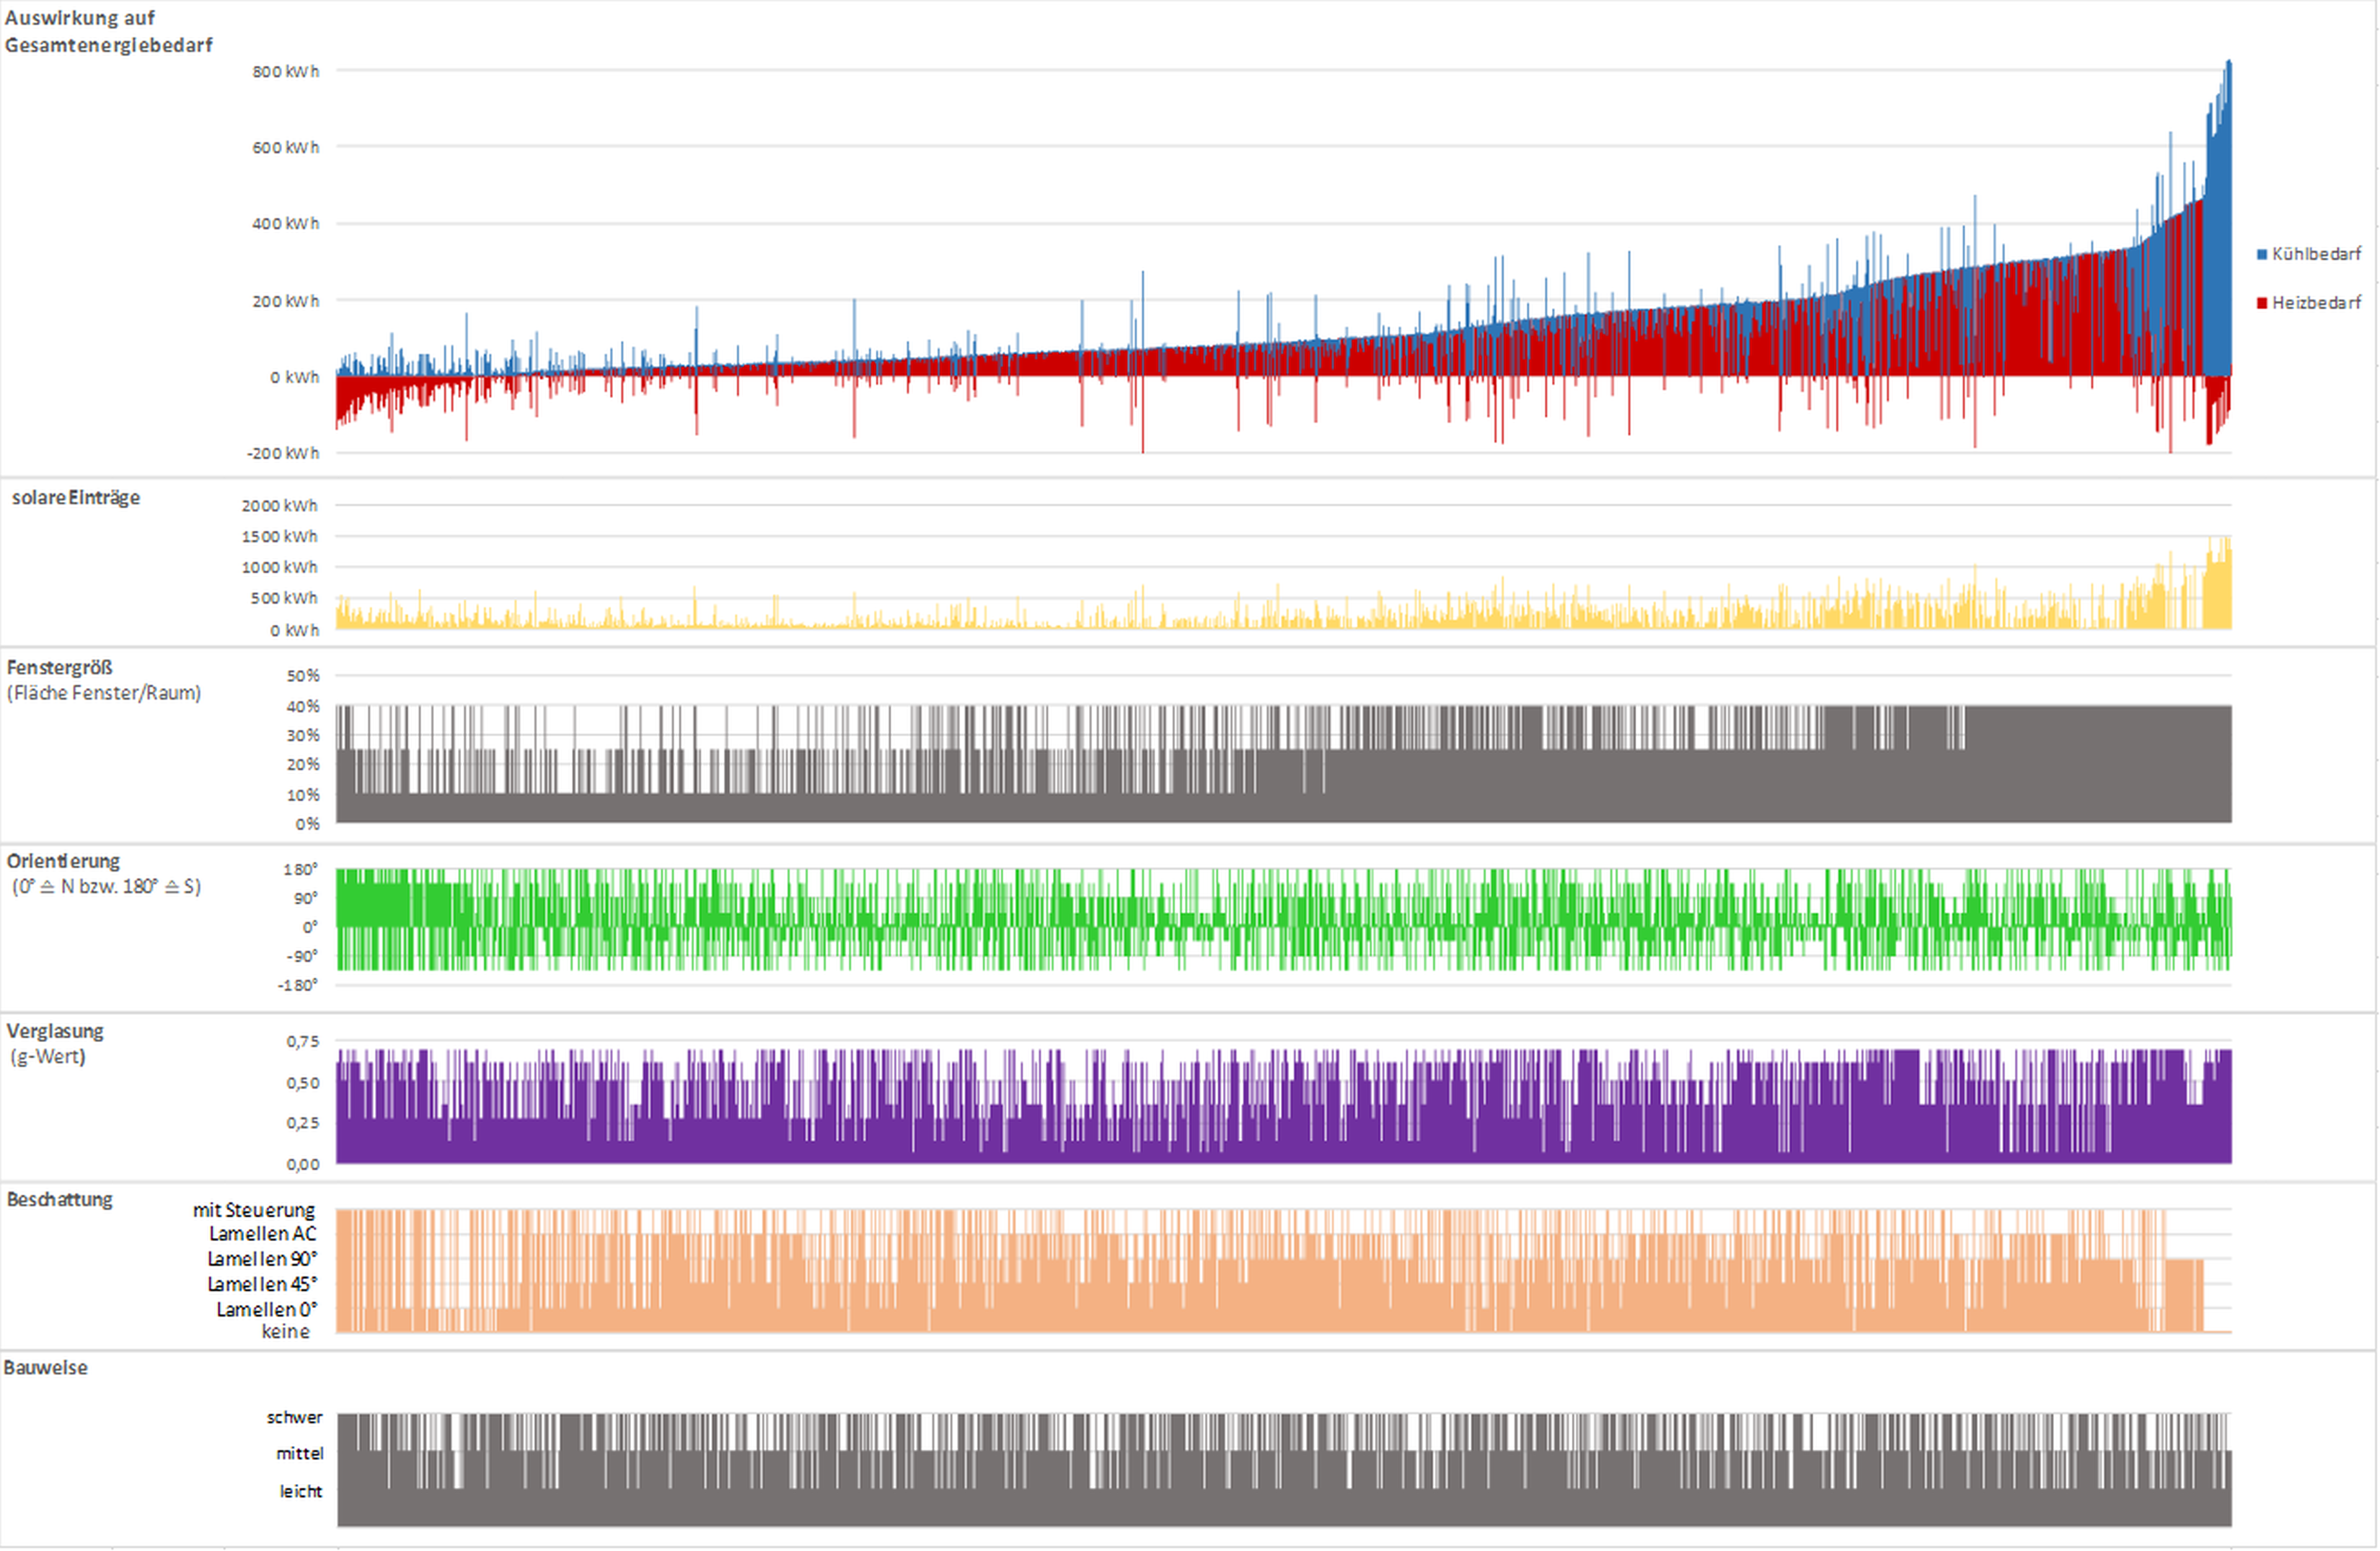
Summary of preliminary study results
A preliminary study examined the effect of different parameters on total energy; the influence on daylight utilisation was not considered for this.
Copyright: Holzforschung Austria & TU Graz
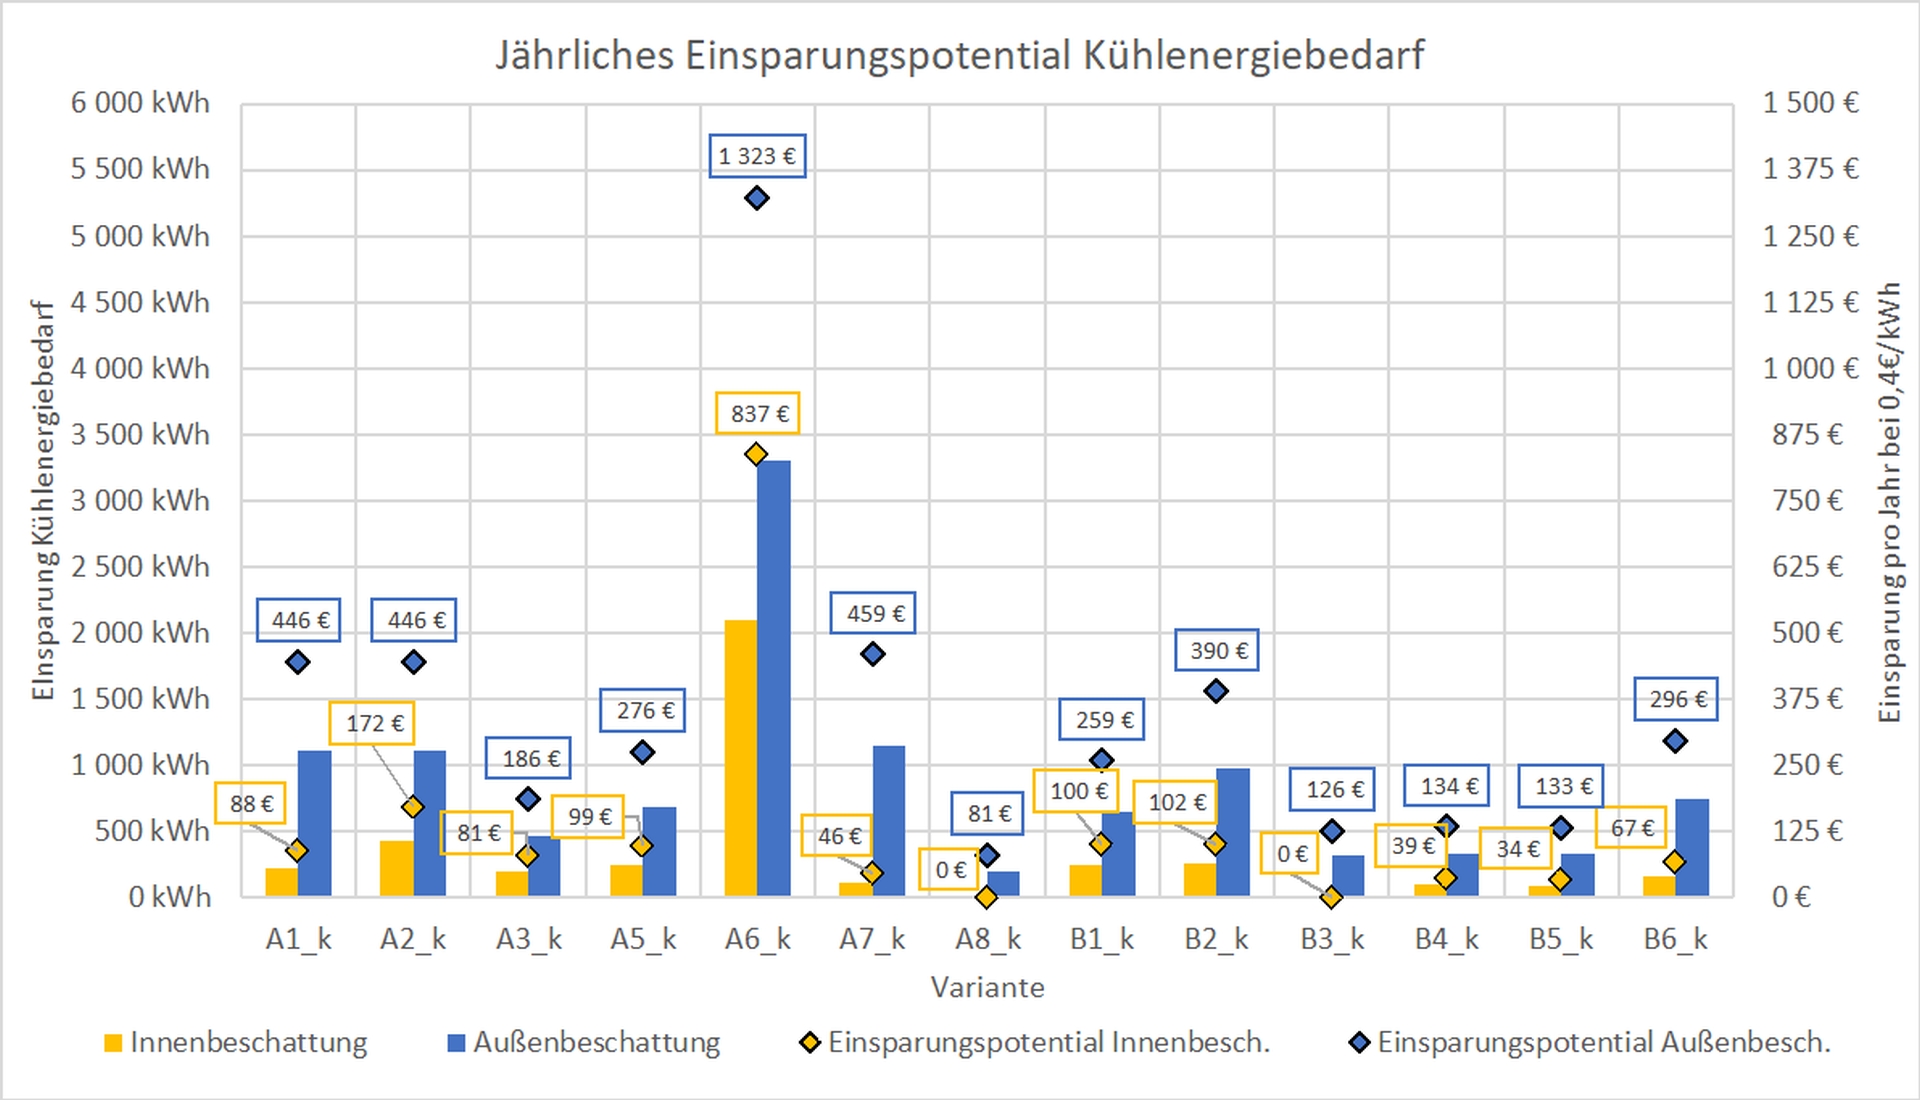
Potential for reduction of cooling energy and costs
This graph shows the potential for saving cooling energy and cooling costs with inside or outside window shadings for selected combinations.
Copyright: Holzforschung Austria & TU Graz
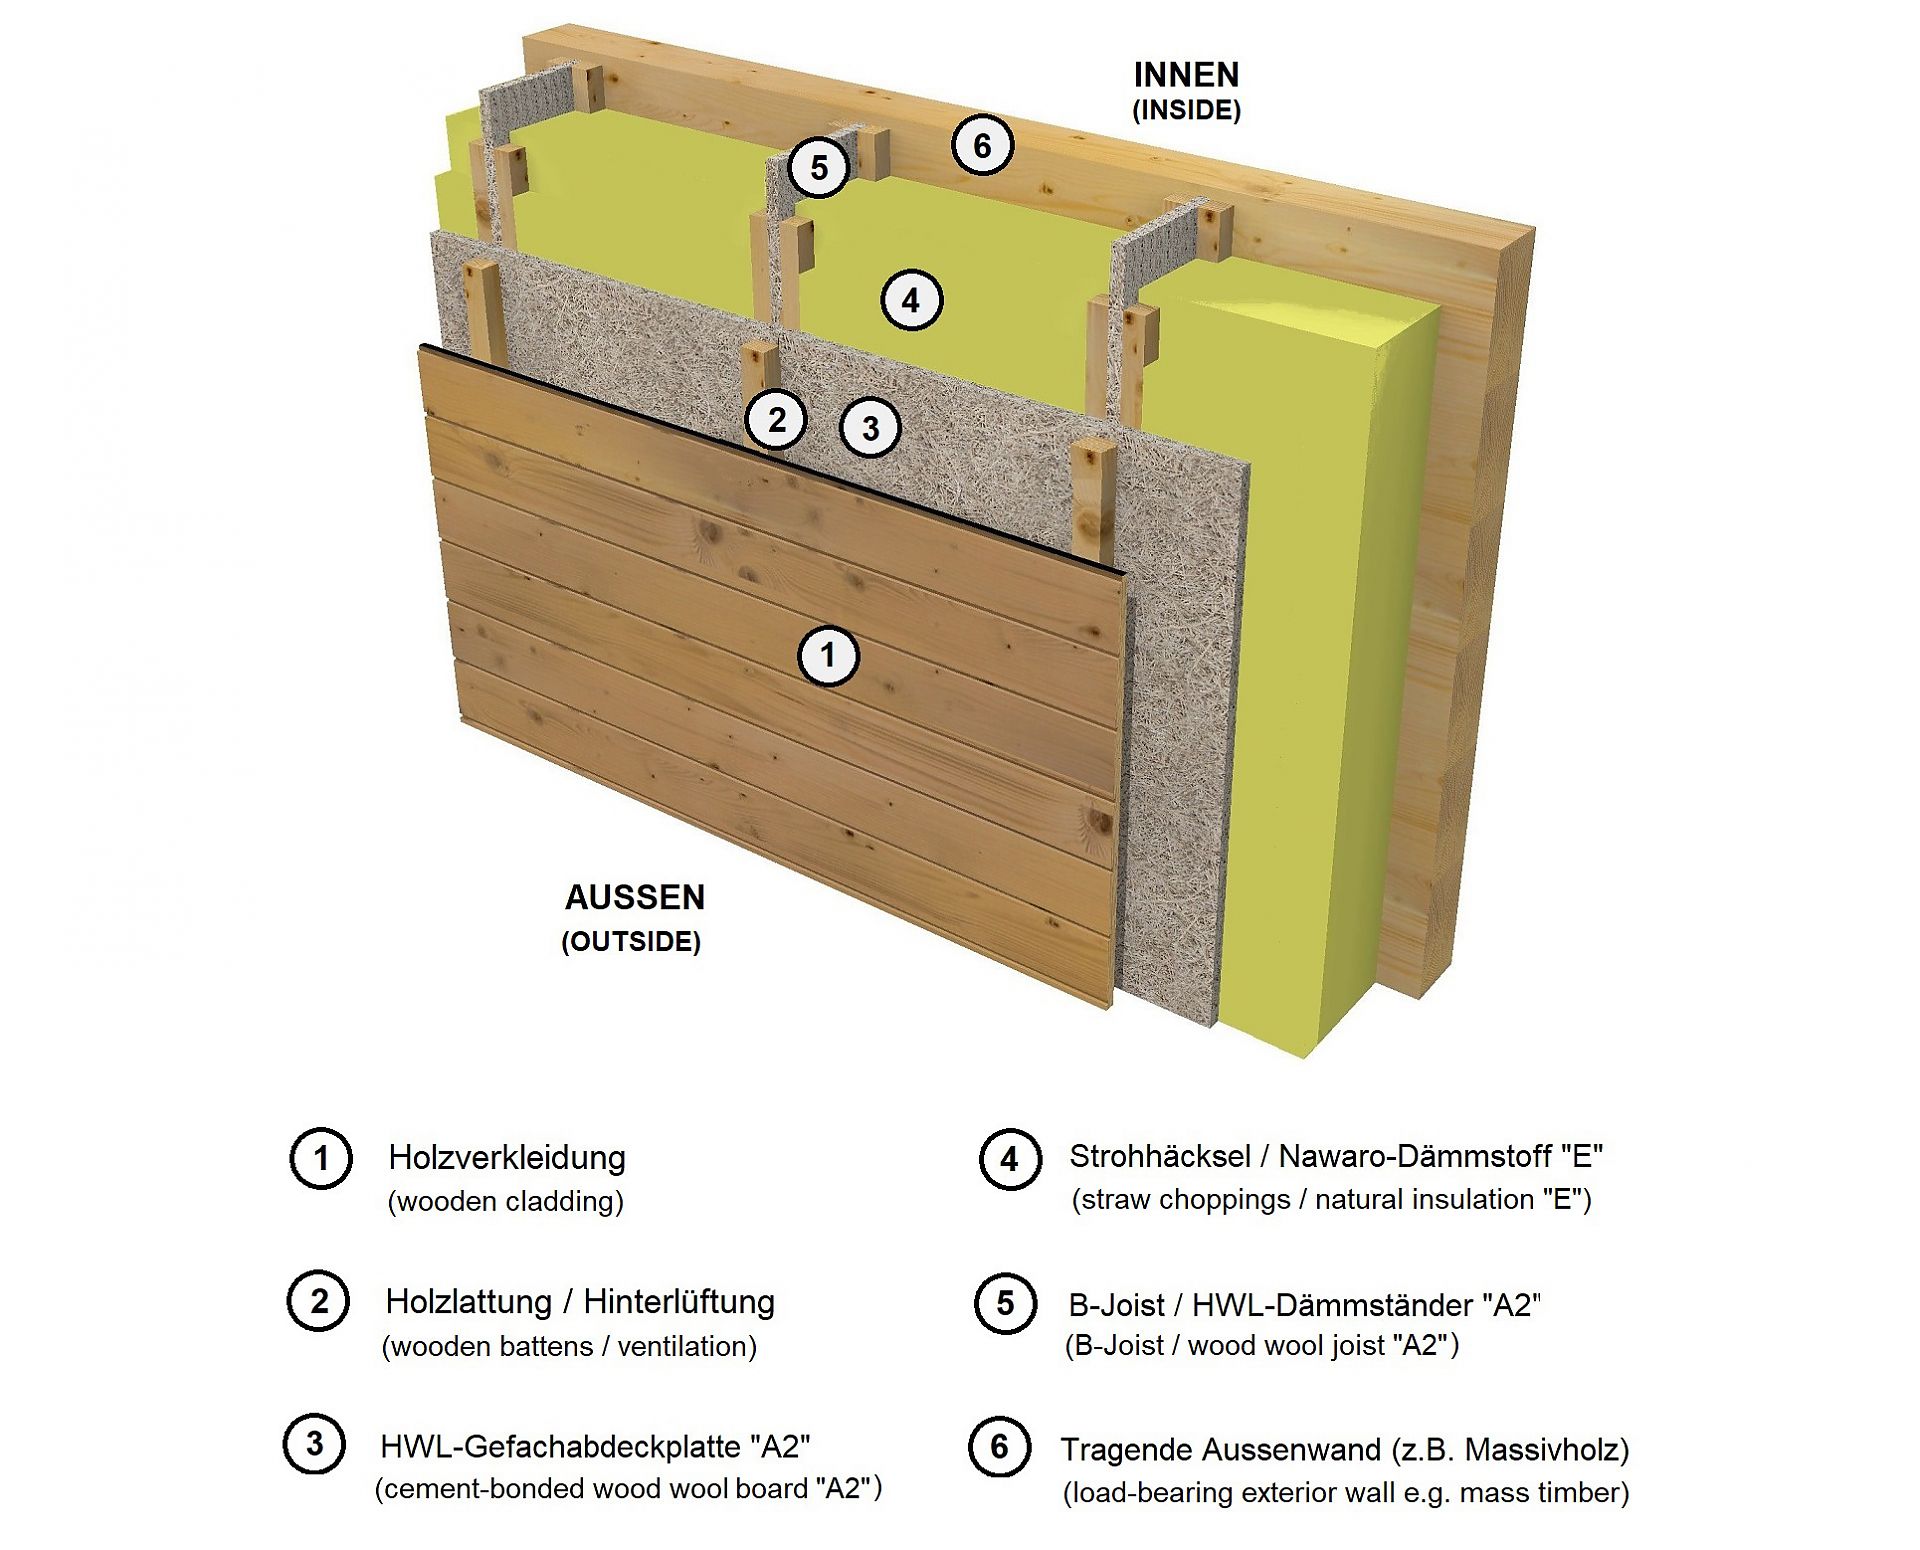
Urban Straw System exterior wall with wooden cladding.
Urban Straw System exterior wall with wooden cladding.
Copyright: capital [ A ] architects

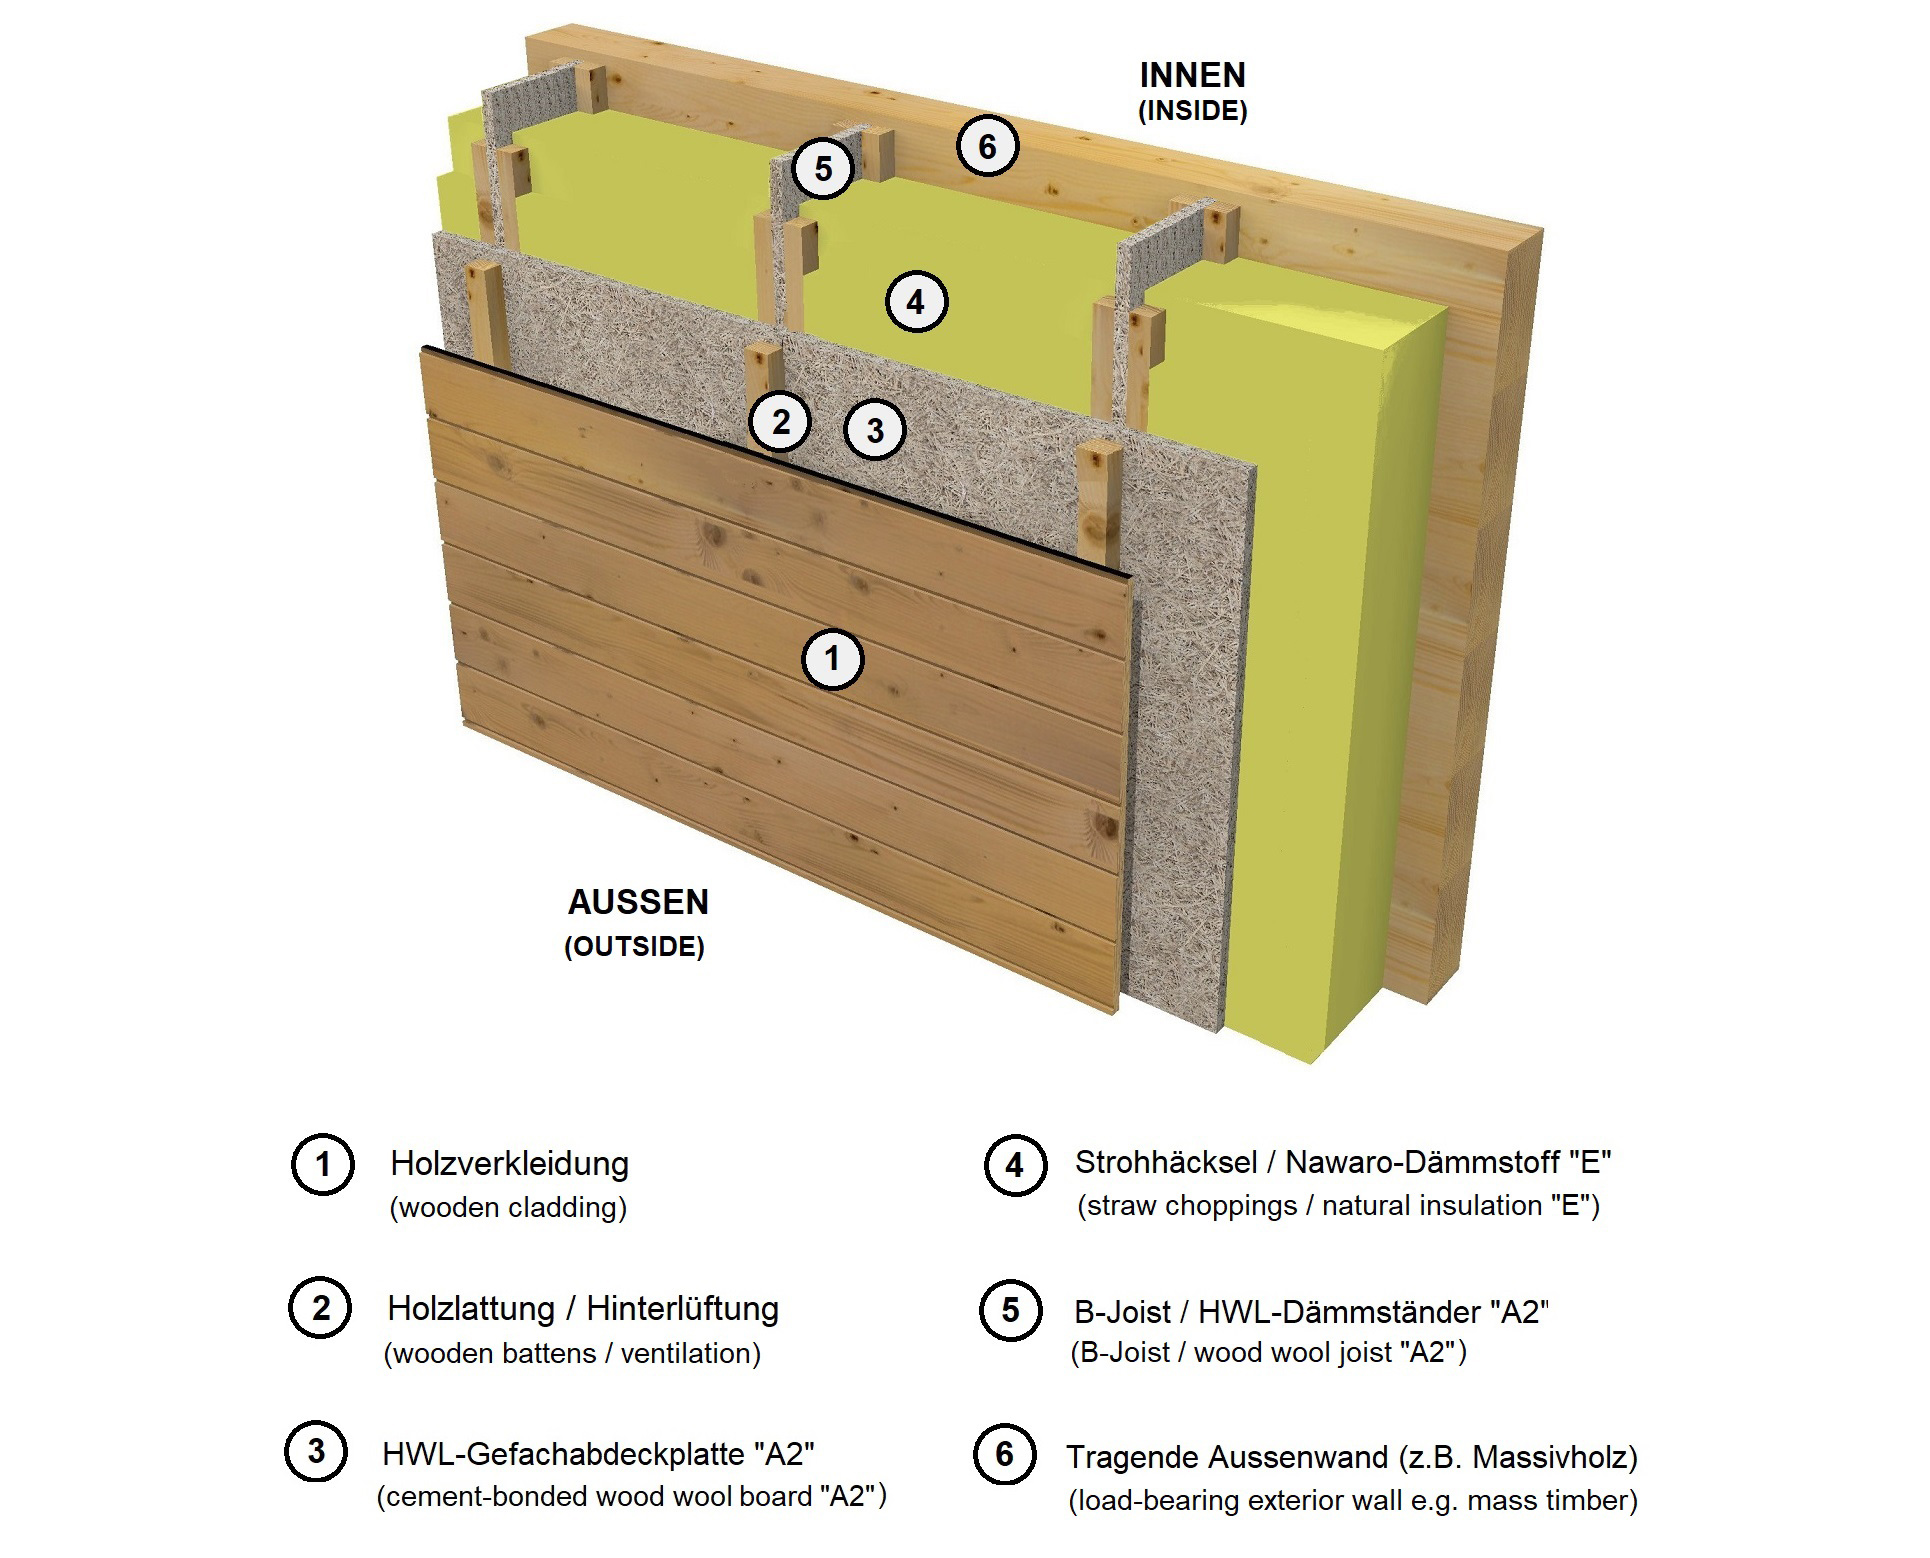
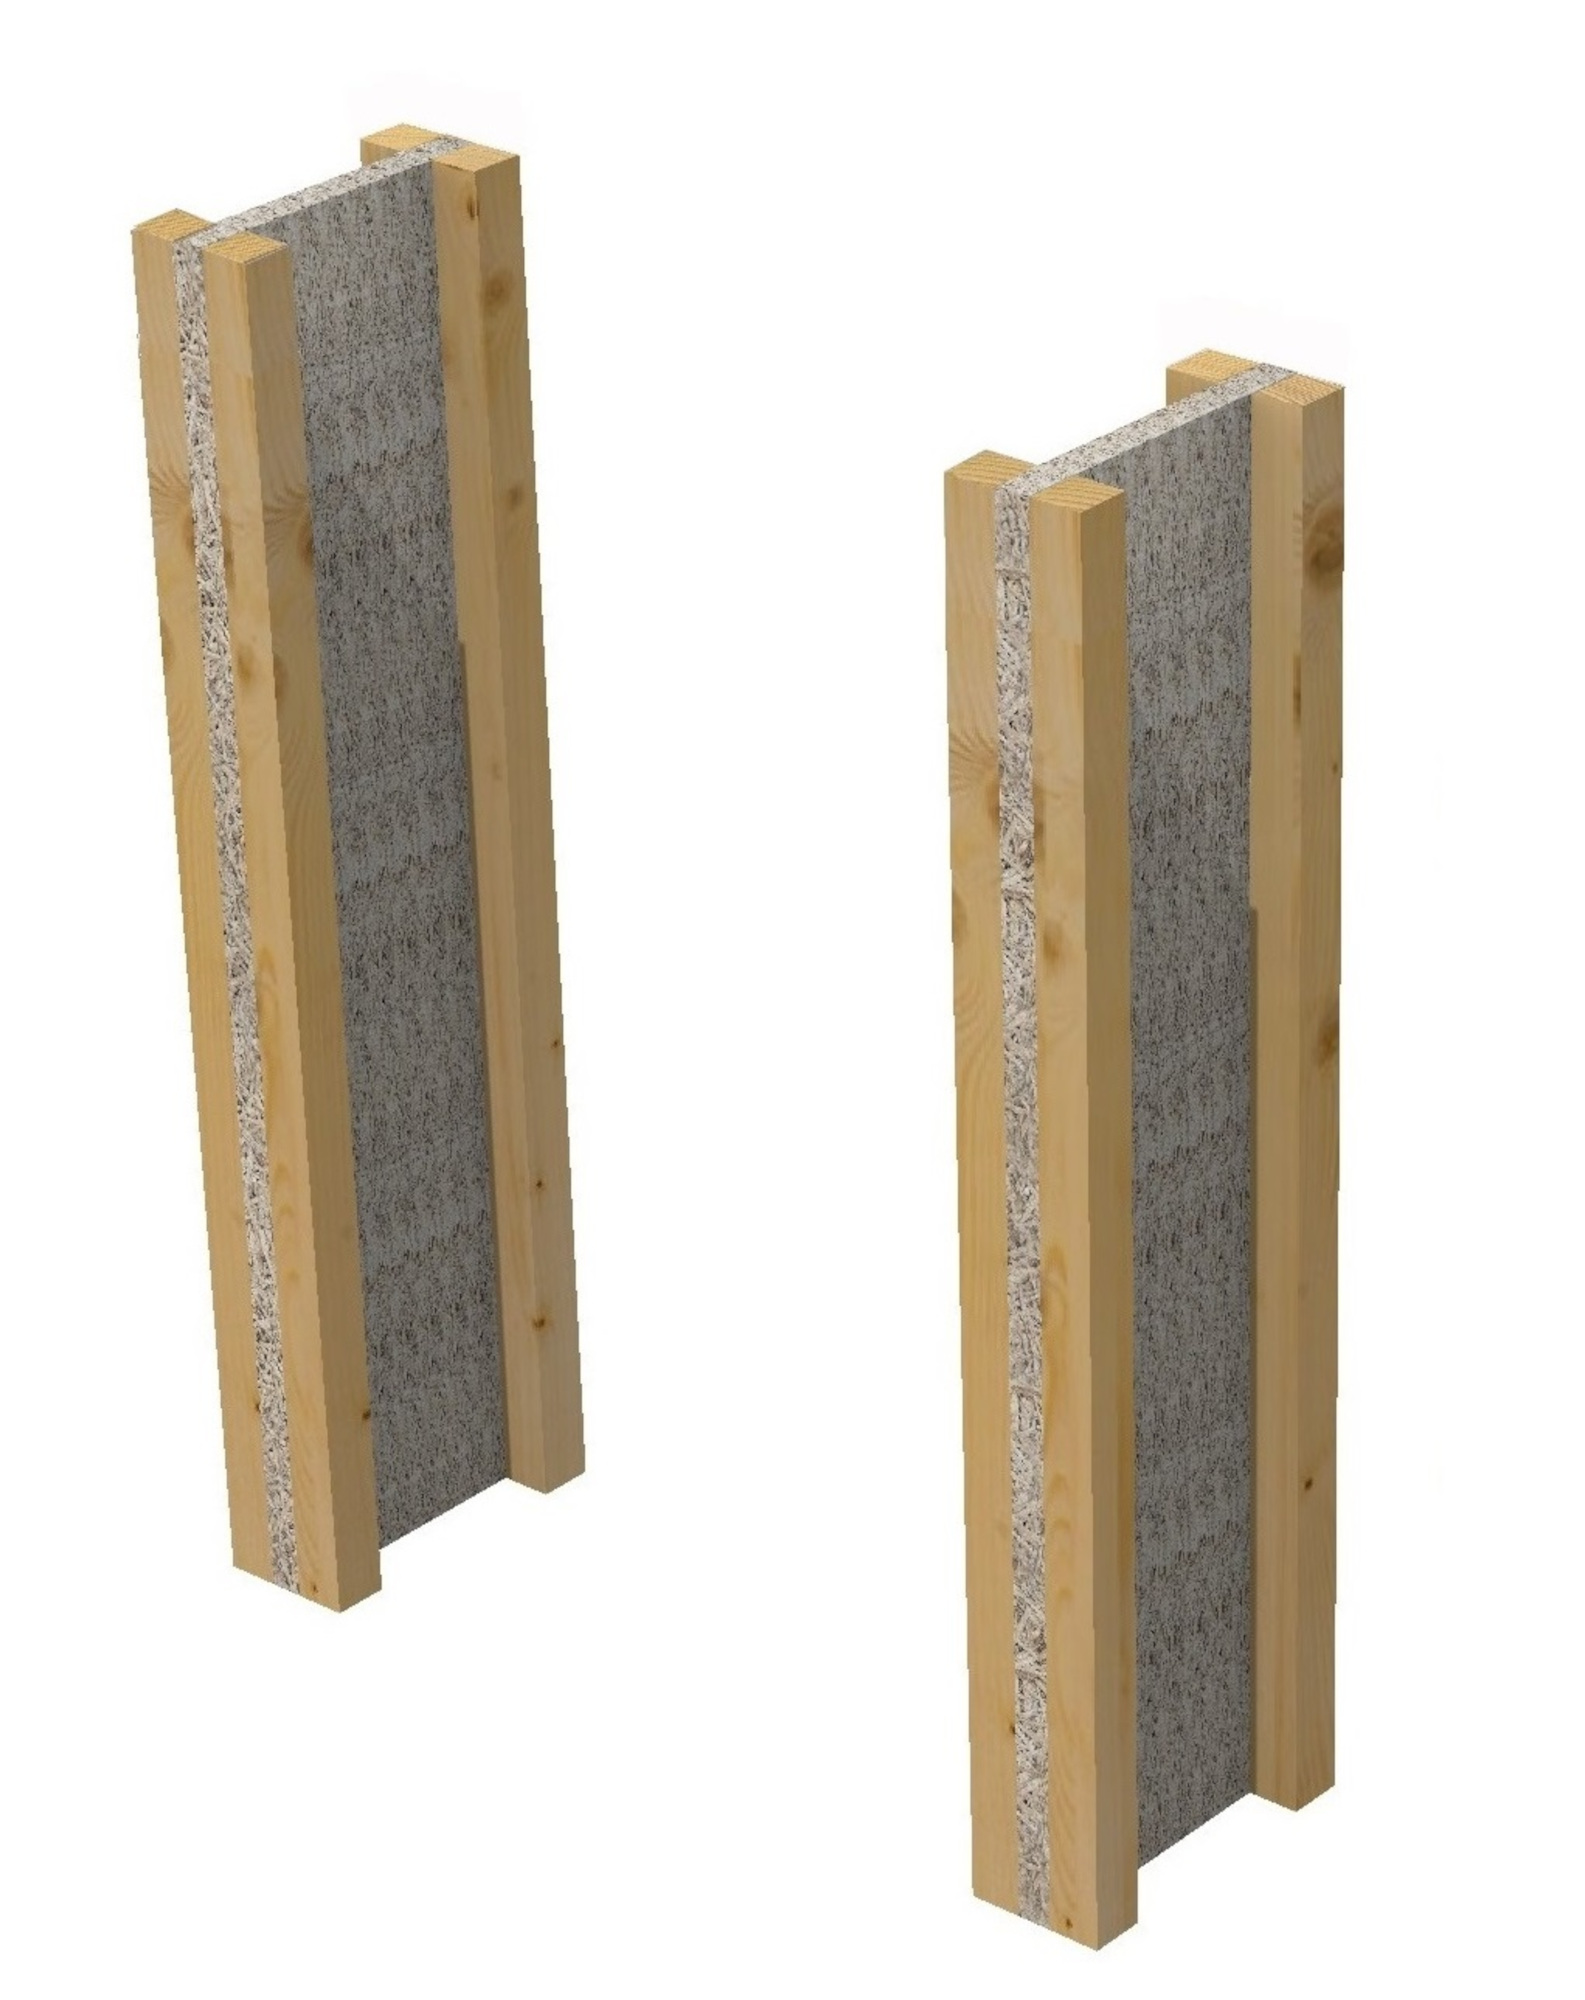
B-Joist wood wool joist
Urban Straw system compartment separator made of cement-bonded wool boards and wooden slats.