Project Image Pool
There are 18 results.
Terms of use: The pictures on this site originate from the projects in the frame of the programmes City of Tomorrow, Building of Tomorrow and the IEA Research Cooperation. They may be used credited for non-commercial purposes under the Creative Commons License Attribution-NonCommercial (CC BY-NC).
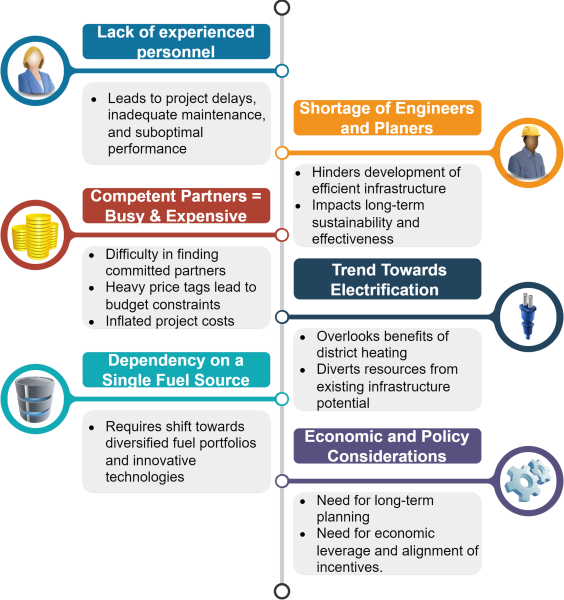
Bottlenecks and challenges in transformation processes
Bottlenecks and challenges in transformation processes
Copyright: AEE INTEC / Ingo Leusbrock
Overview transformation plan
Overview transformation plan
Copyright: AEE INTEC / Ingo Leusbrock
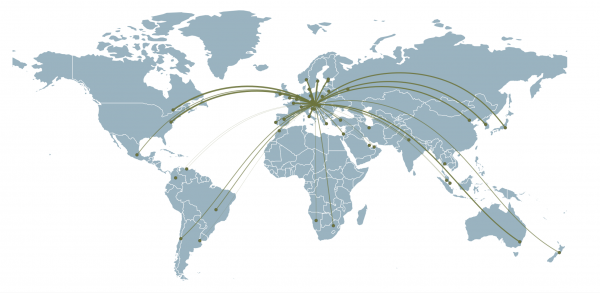
Austrian Activities Worldwide
Visualisation of Austrian cooperations in context of TCP tasks and annexes. Available in german language at https://nachhaltigwirtschaften.at/de/iea/visualisierungen/weltweite-kooperationen.php
Copyright: Austrian Energy Agency
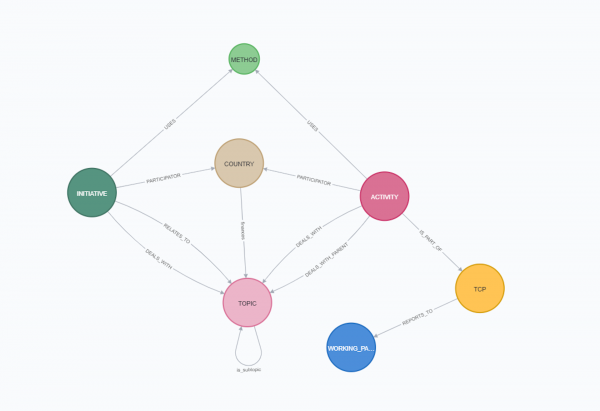
Graph Datastructure
Graphbased datastructure of the open access IEA-TCP dataset.
Copyright: Austrian Energy Agency
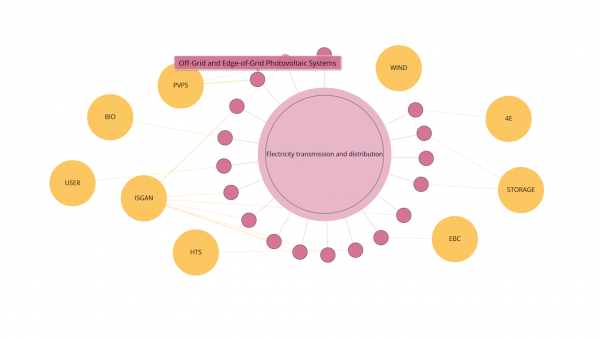
Visualisation of TCPs
After selecting a topic (in this example "Electricity transmission and distribution" was selected), this graph shows all tasks (activities) focussing on the selected topic. The topics are structured according to the IEA energy RD&D budget/expenditure statistics. Additionally, you can see the related Technology Collaboration Programmes (TCPs). Activities which had been ongoing in Summer 2020 from all IEA-TCPs are covered in this analysis. You can re-arrange the different bubbles to better meet the needs of your analysis. If a TCP consists of more than one task (activity), it also contains one entry in the database labelled “ExCo-Activities”. Available at https://nachhaltigwirtschaften.at/en/iea/visualisations/tcps-focussing-on-a-topic.php
Copyright: Austrian Energy Agency
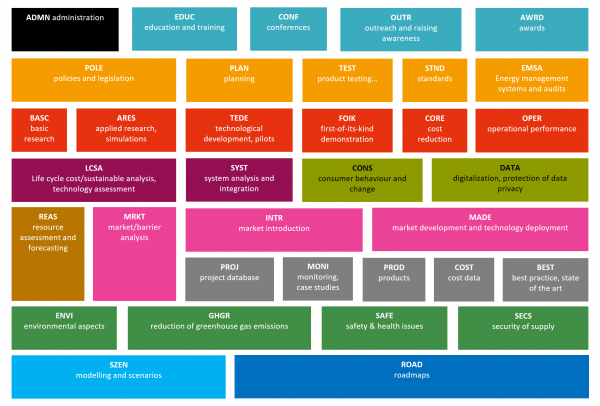
Methods
Set of methods to classify the type of activity of TCP Tasks and Annexes.
Copyright: Austrian Energy Agency
IEA DHC Annex TS8: Example laboratory middleware
Example of using a laboratory middleware for connecting a laboratory test stand with real-time simulation models. The same approach can be used to connect geographically distributed laboratory setups.
Copyright: AIT Austrian Institute of Technology GmbH
IEA DHC Annex TS8: 2. Working Phase Meeting (Picture 1/2)
The international cooperation in IEA DHC Annex TS8 also includes working meetings. The 2nd working meeting took place on 26/27 November 2024 at the DTU Risø Campus.
Copyright: Edmund Widl
IEA DHC Annex TS8: 2. Working Phase Meeting (Picture 2/2)
The international cooperation in IEA DHC Annex TS8 also includes working meetings. The 2nd working meeting took place on 26/27 November 2024 at the DTU Risø Campus.
Copyright: Edmund Widl
IEA DHC Annex TS8: Overview of subtasks
The international cooperation within the IEA DHC Annex TS8 is structured into 5 work packages (subtasks).
Copyright: IEA DHC Annex TS8
System-level Control of a Heating Grid with Sector Coupling
Exemplary Configuration of a simple heating grid, considering sector coupling through CHP and heat pump by forward-looking system control
Copyright: © BEST – Bioenergy and Sustainable Technologies GmbH
Digital Twins can serve as virtual components in lab setups.
Mapping of a proof-of-concept test case to the DigitalEnergyTestbed setup using the Digital Twin of the DH substation test stand.
Copyright: @ AIT Austrian Institute of Technology GmbH
left: The vicious circle of high system temperatures (lock-in), right: The added value of low system temperatures
presentation of the different relations between system temperatures, supply structures, the effect on the system and the end users
Copyright: Ralf-Roman Schmidt, AIT
Development of technology specific indicators
Concept of energy-economic evaluations with the key figure "Cost Reduction Gradient" (CRG) in €/(MWh·°C)
Copyright: Roman Geyer
Combination of Methods used by TCP-Activities
A set of methods was developed to categorize the kind of project work that is done in the activities. The figure shows which methods are applied how often in total (node size), and which methods were frequently applied together (edge width) by activities. The color corresponds to the different method cate-gories described in chapter.
Copyright: Österreichische Energieagentur, 2018
IEA-Topics, Related Activities and Working Parties
IEA-topics on level 1 (orange, node size corresponds to the official RD&D budget 2015) and TCP-activities (non-orange nodes) and related TCP-working parties (see color code in legend).
Copyright: Österreichische Energieagentur, 2018
Participation of countries in IEA Technology Collaboration Programmes and Related Research Topics
Absolute (upper chart) and relative (lower chart) number of TCP-activities that countries are participating in. The color code shows how the assigned activities are related to the IEA-Topics and how the countries set their priorities with regard to the research topics (based on the IEA RD&D taxonomy).
Copyright: Österreichische Energieagentur, 2018
International cooperations of Austria in context of TCP activities.
Worldmap of Austrias cooperations with other countries in context of the IEA Technology Collaboration Program reasearch activities. Line thickness indicates the number of cooperations.

