Project Image Pool
There are 22 results.
Terms of use: The pictures on this site originate from the projects in the frame of the programmes City of Tomorrow, Building of Tomorrow and the IEA Research Cooperation. They may be used credited for non-commercial purposes under the Creative Commons License Attribution-NonCommercial (CC BY-NC).
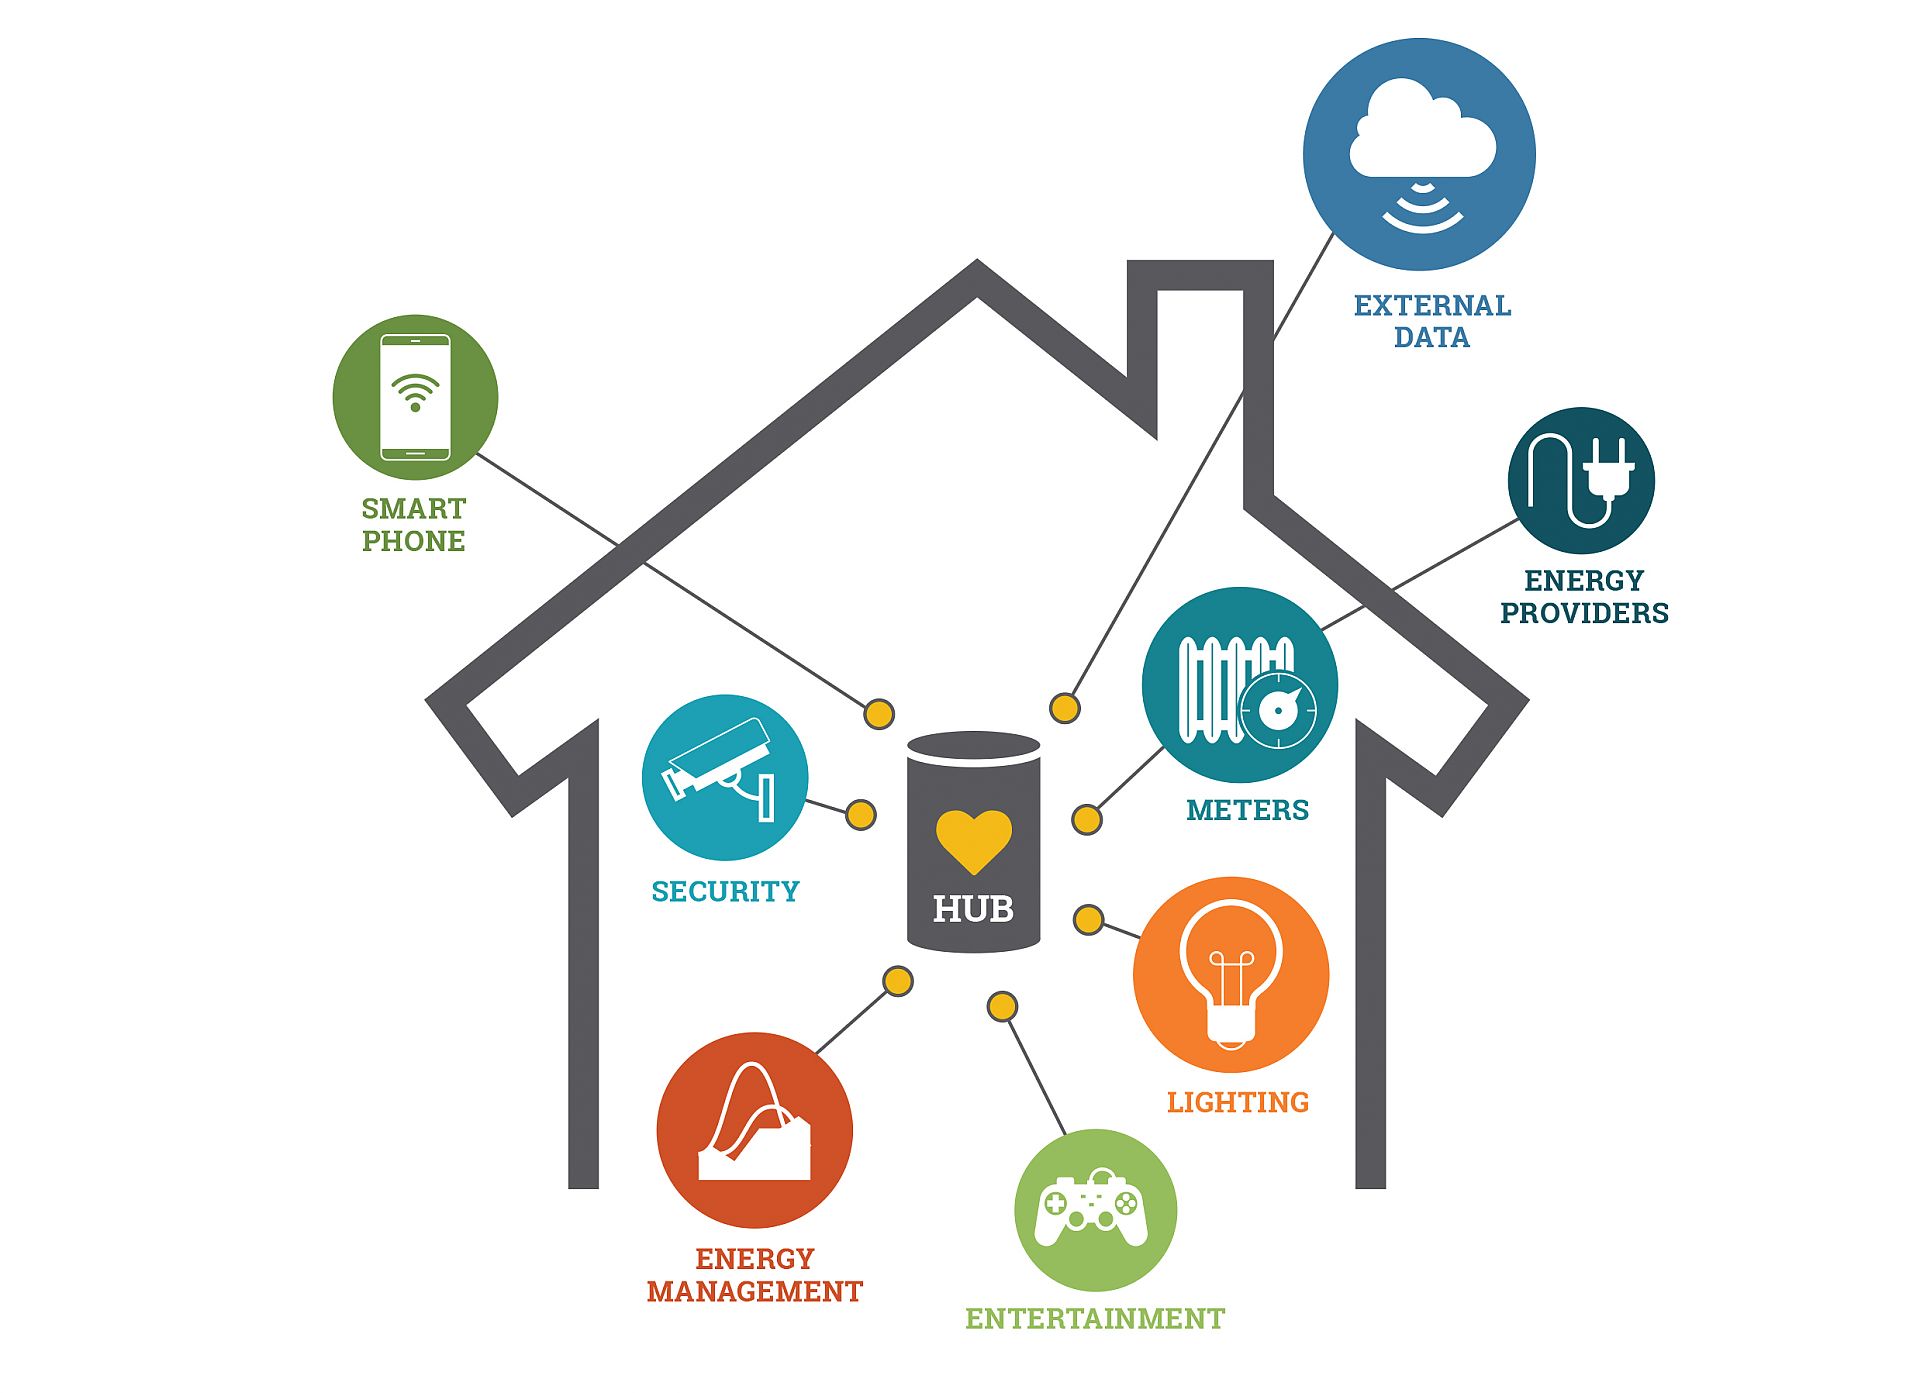
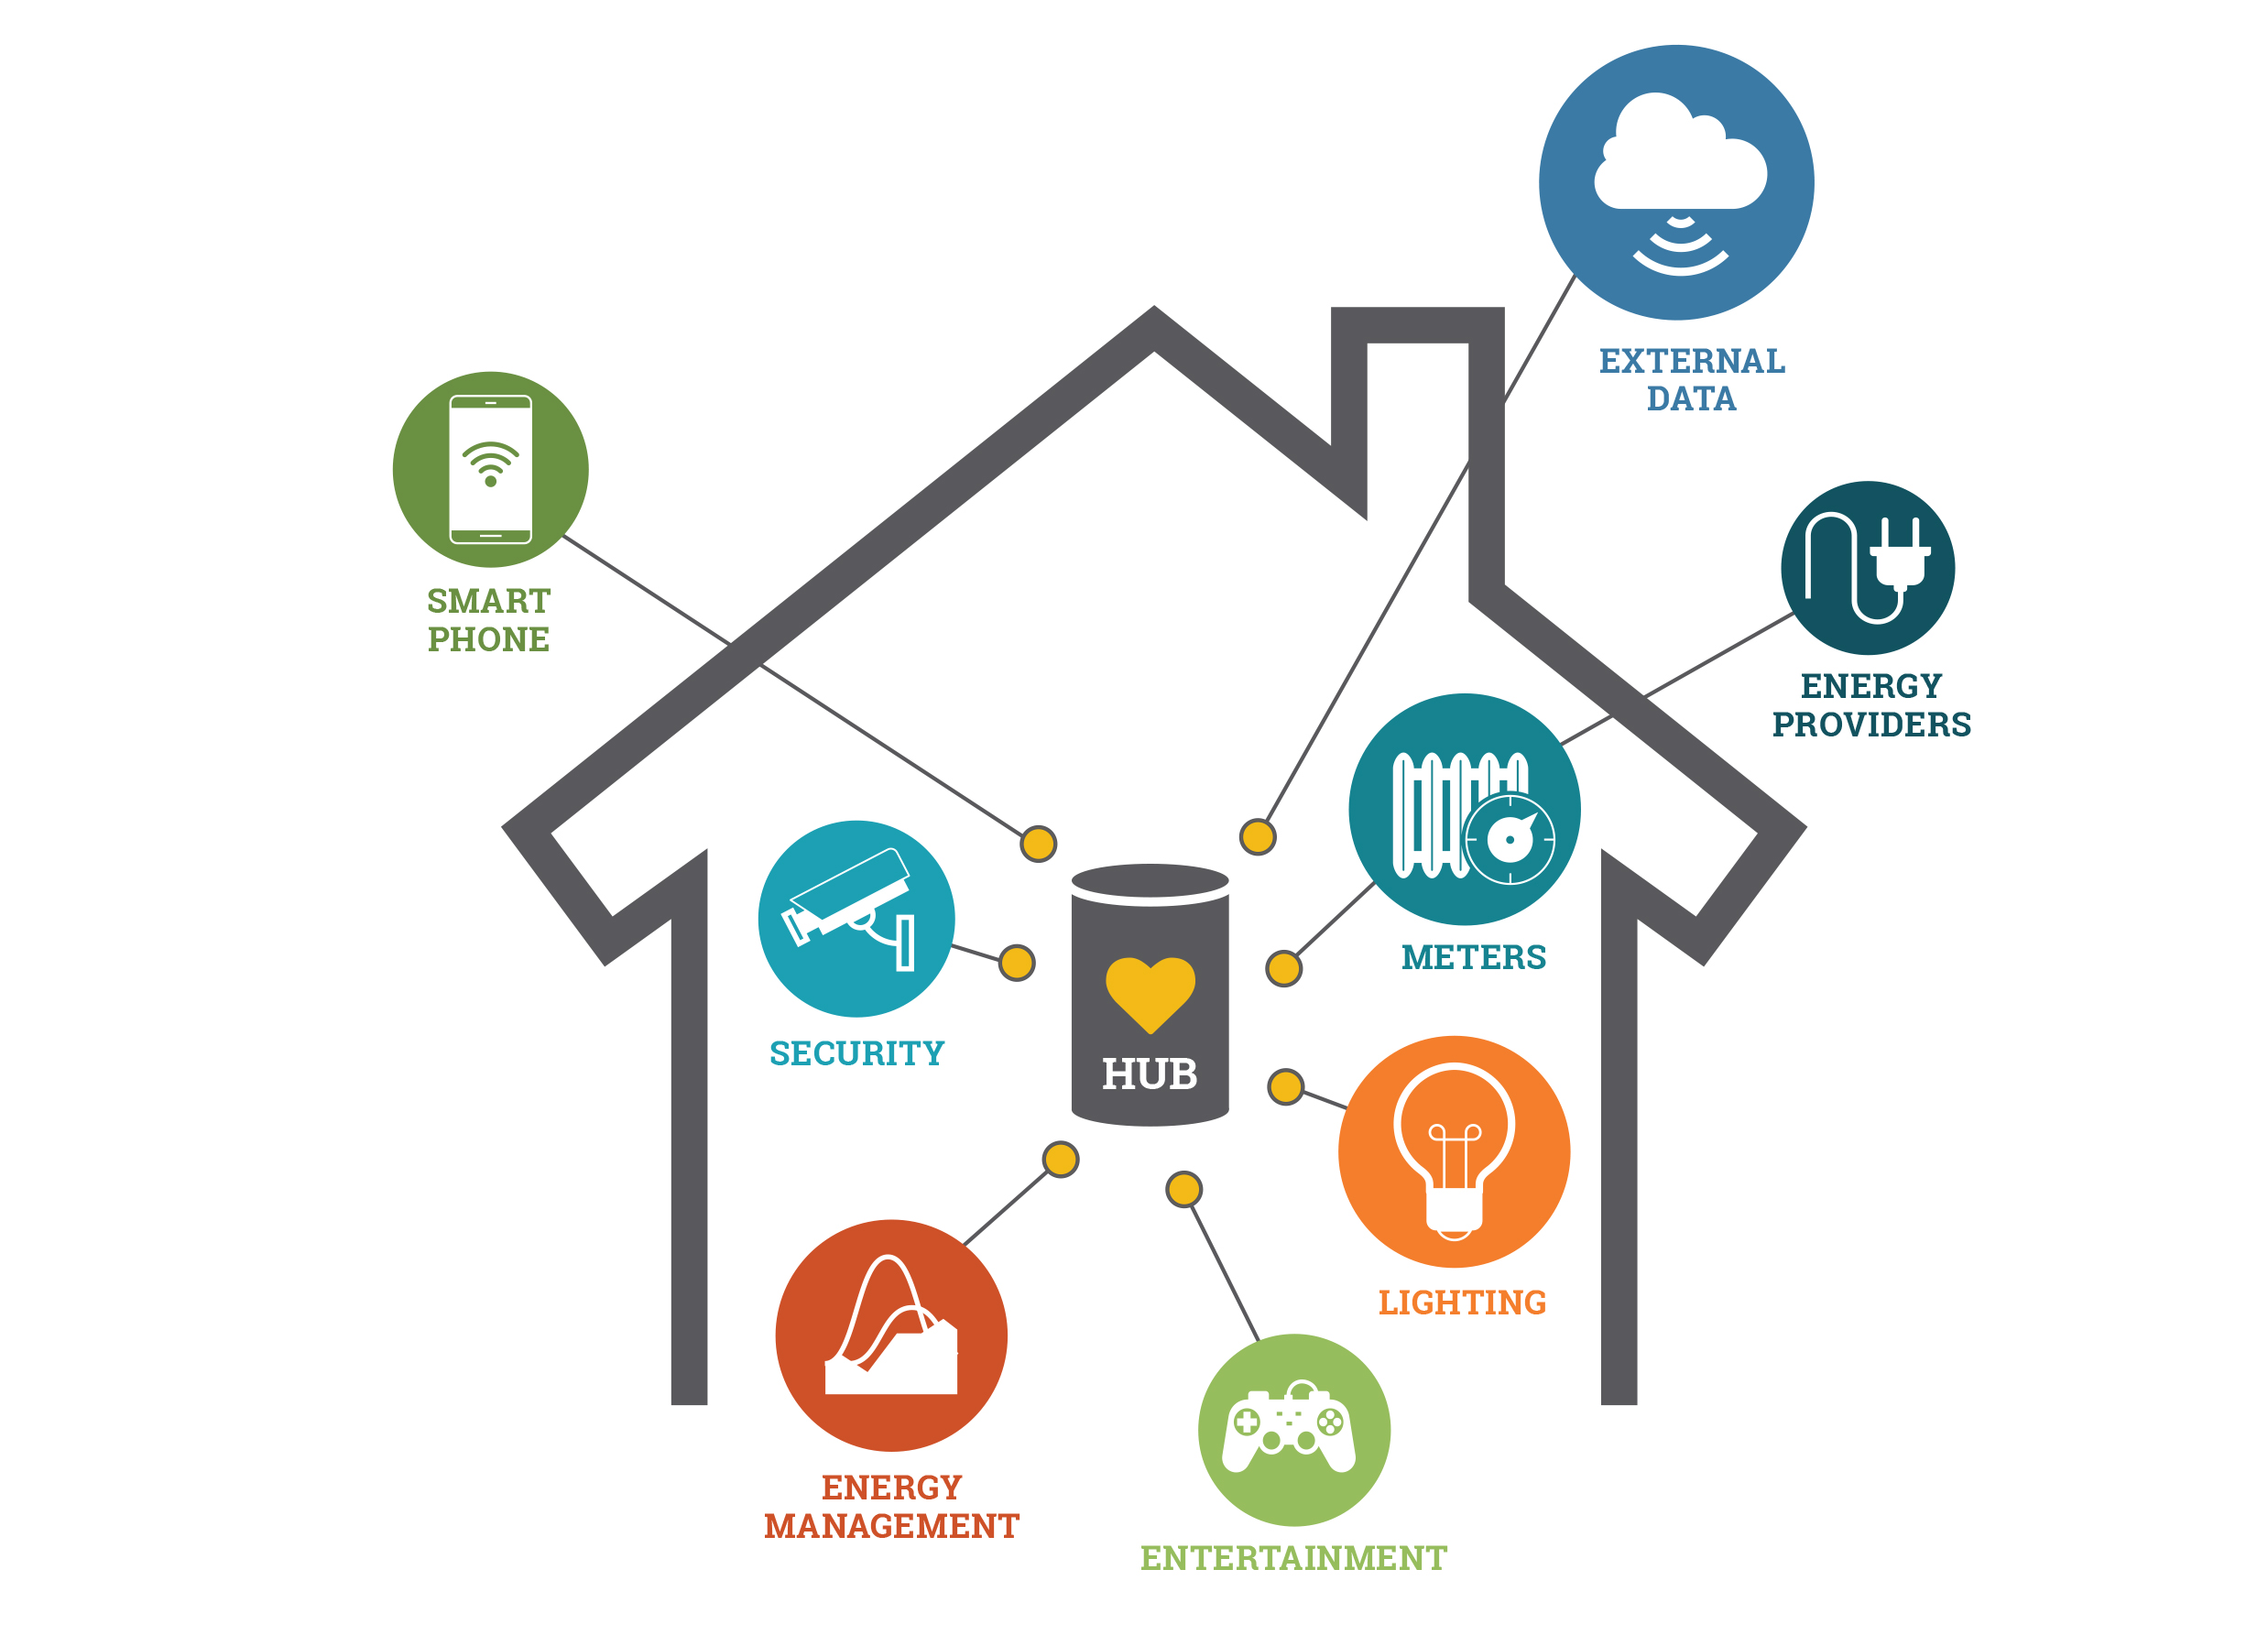
Smart home systems
Smart home systems generally consist of sensors and switches connected to a hub (also called a gateway) from which the system is controlled with a user interface via wall-mounted terminal, mobile phone or computer, often via internet cloud services. Smart Homes utilize network connectivity to manage and automate services such as lighting, heating/cooling and washing. This has impacts on energy consumption (and running costs). EDNA investigates such impacts.
Copyright: IEA 4E Electronic Devices and Networks Annex - EDNA (https://edna.iea-4e.org/)

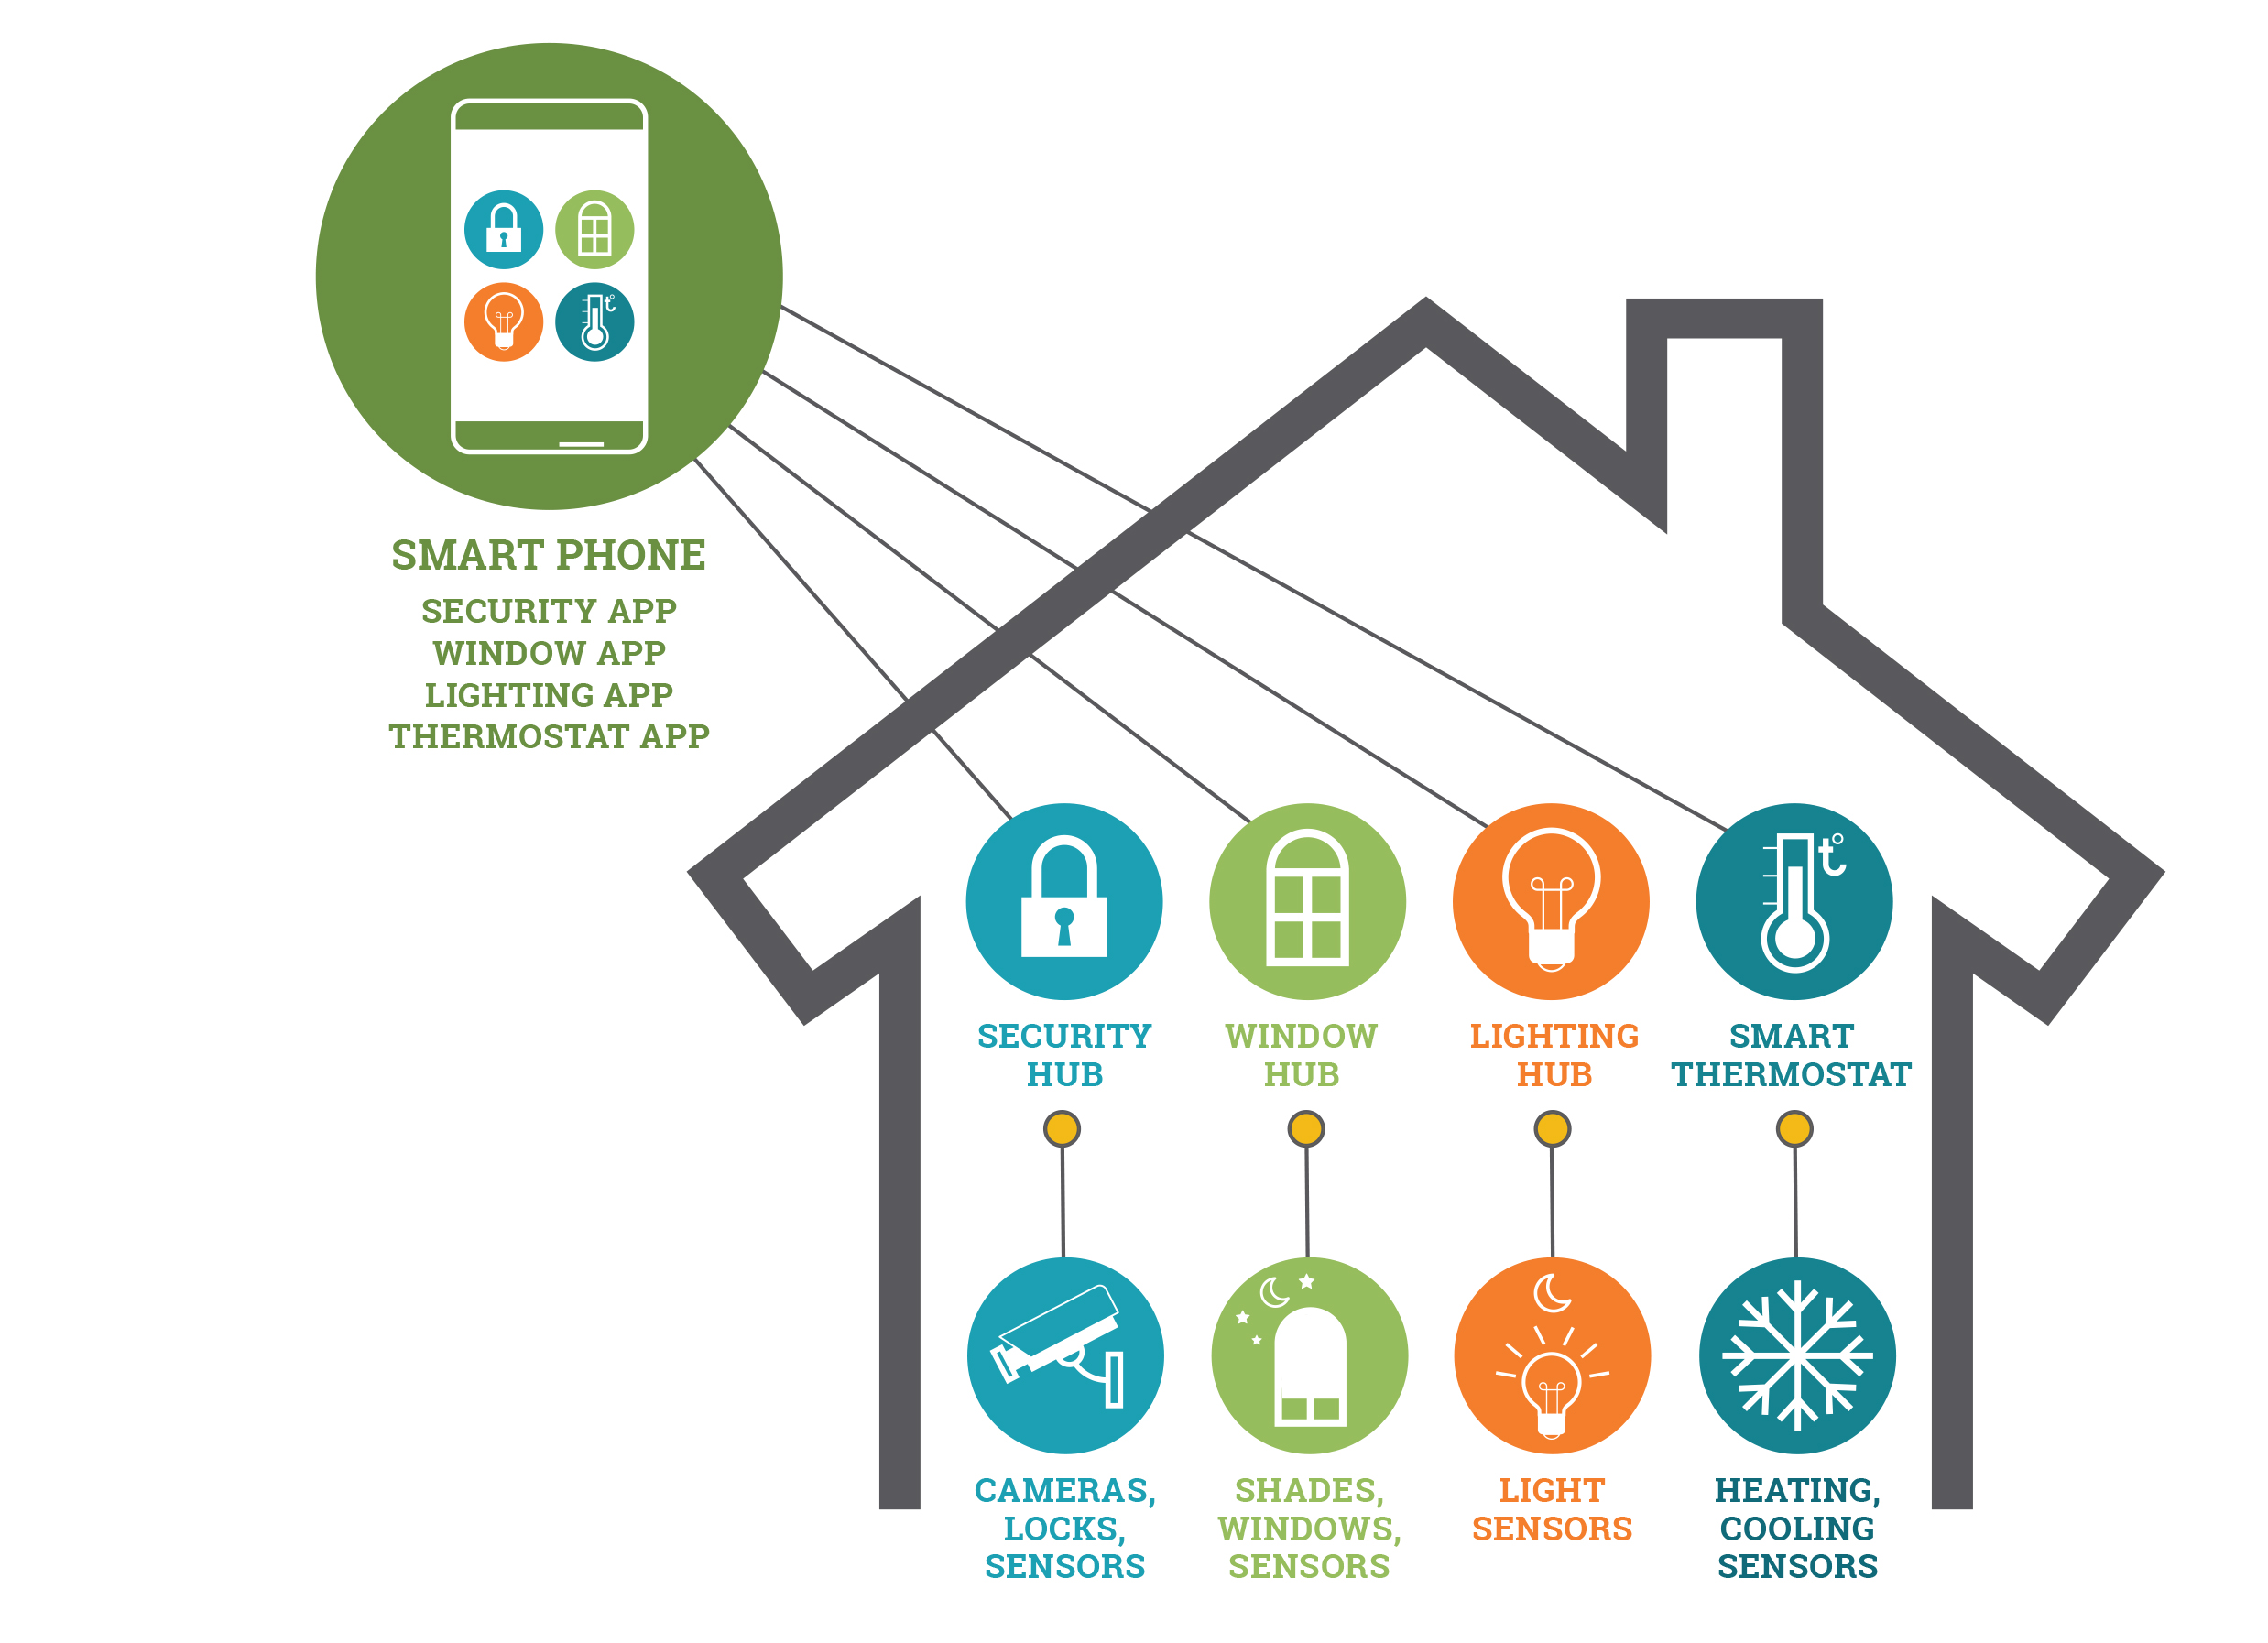
Smart home with multiple systems
Smart home with multiple smart systems and interfaces, for example, smart meter display, lighting control display, heating and cooling control display, window status display etc. (This raises concerns about interoperability and acceptance by users).
Copyright: IEA 4E Electronic Devices and Networks Annex - EDNA (https://edna.iea-4e.org/)
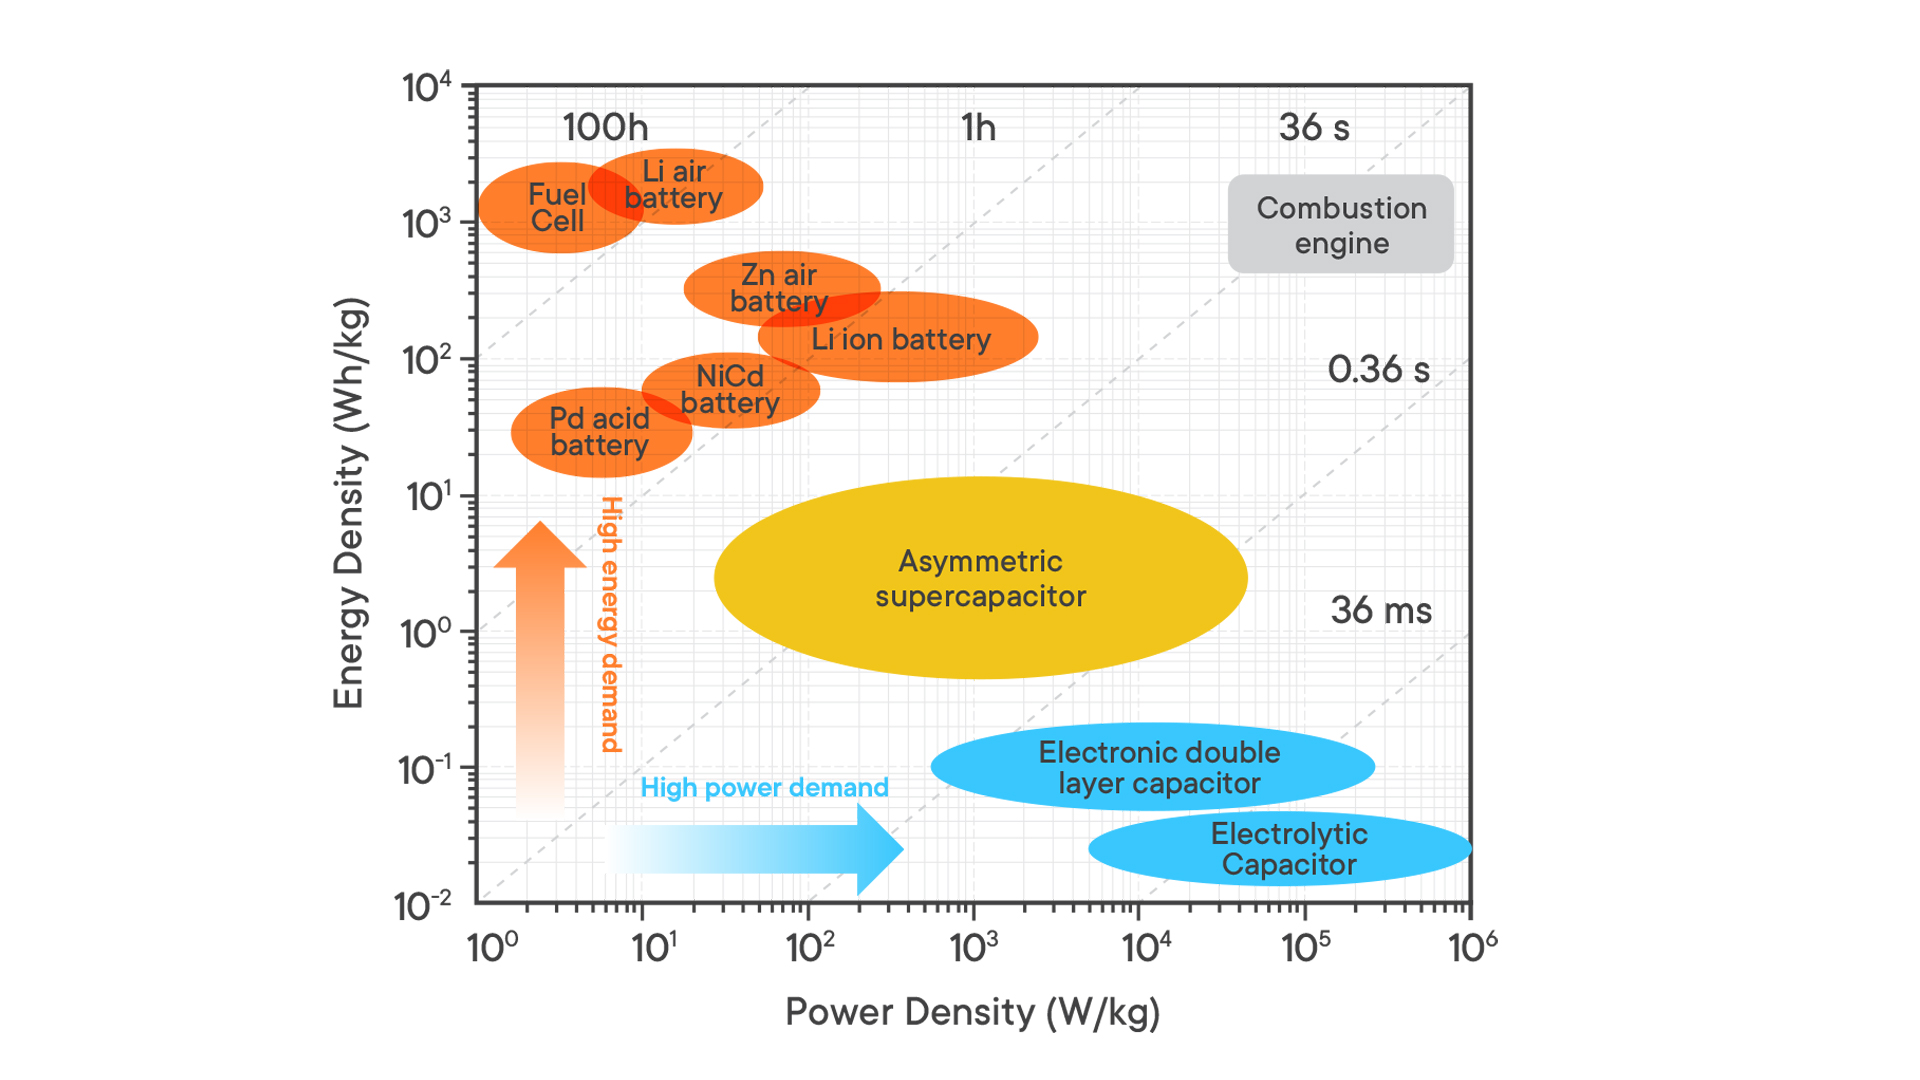
Stand of the different baterry technologies.
This figure shows the development status of various technologies for rechargeable batteries in consumer electronics.
Copyright: 4E EDNA
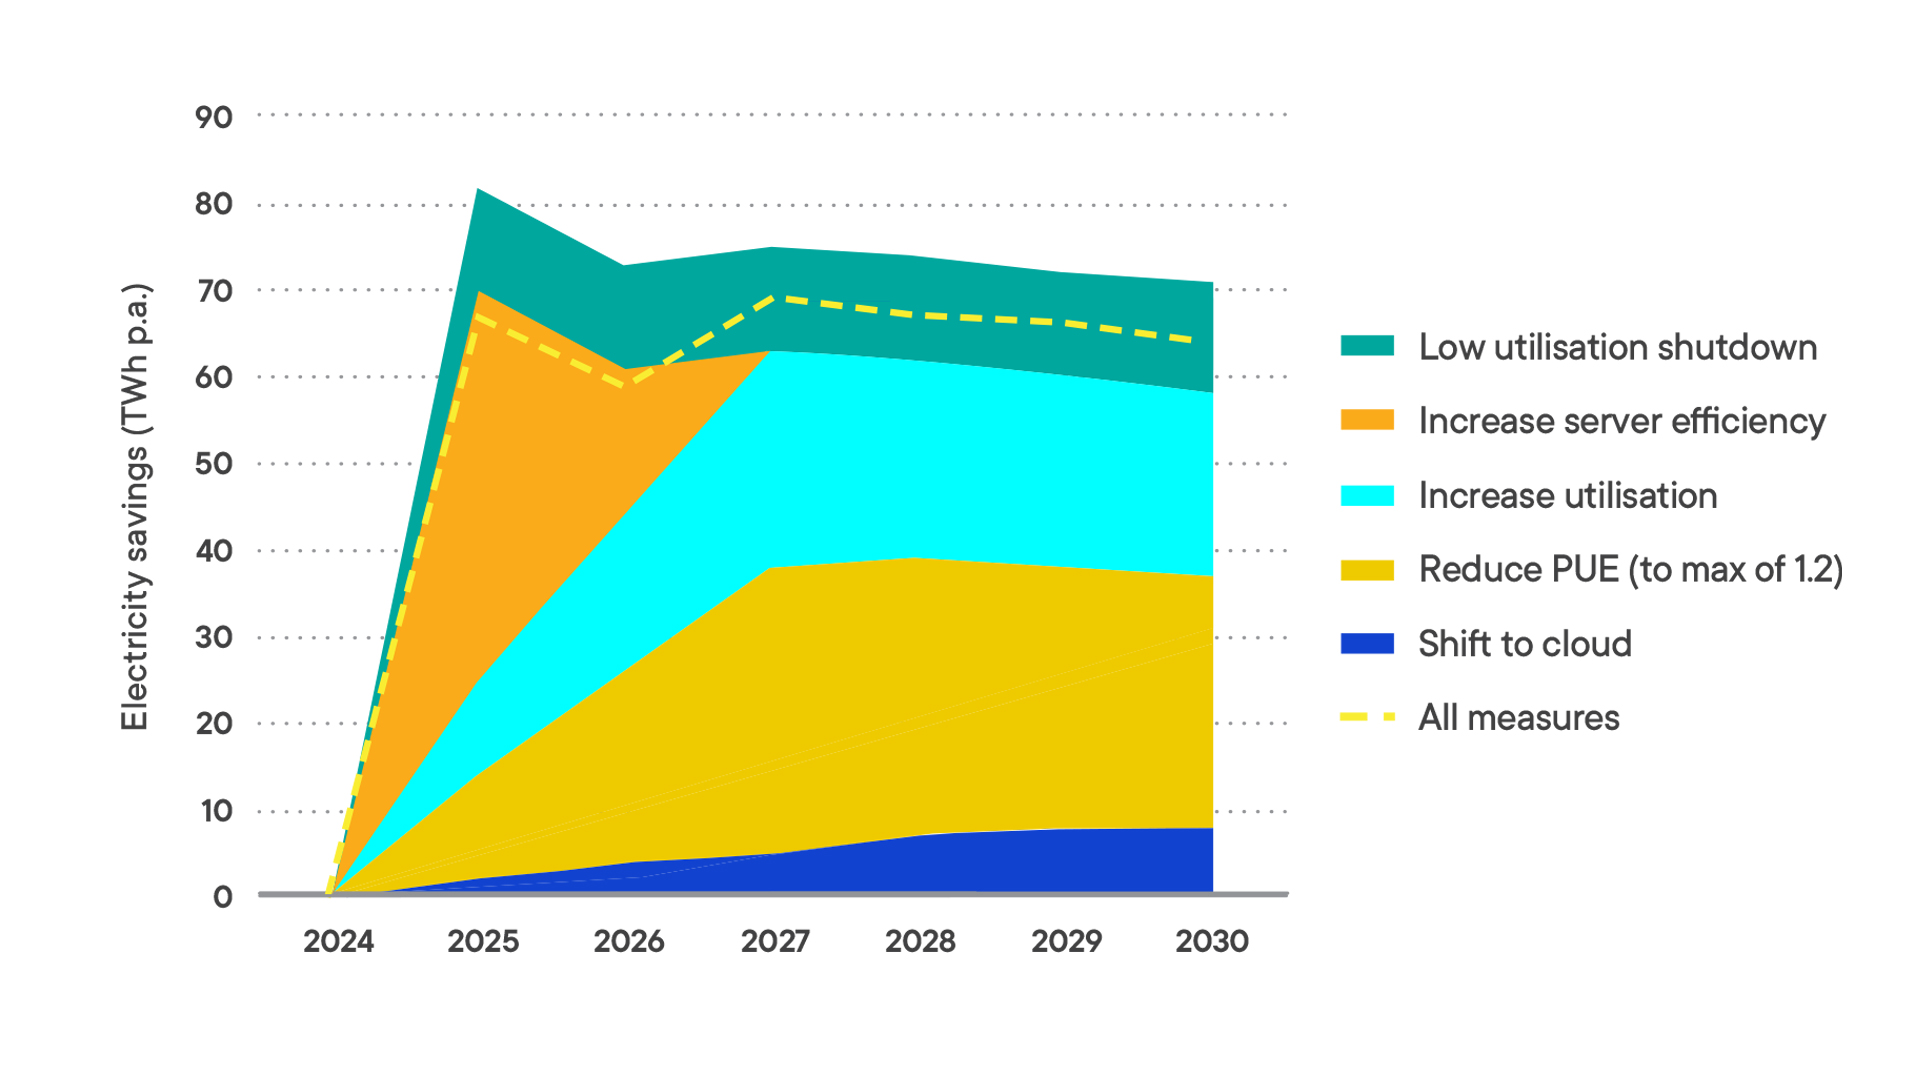
Potential energy savings from measures for Data Centres.
The graphic shows the estimated energy savings per year until 2030, for a range of possible measures to improve the efficiency of Data centres, according to modeling conducted by EDNA in 2024.
Copyright: 4E EDNA
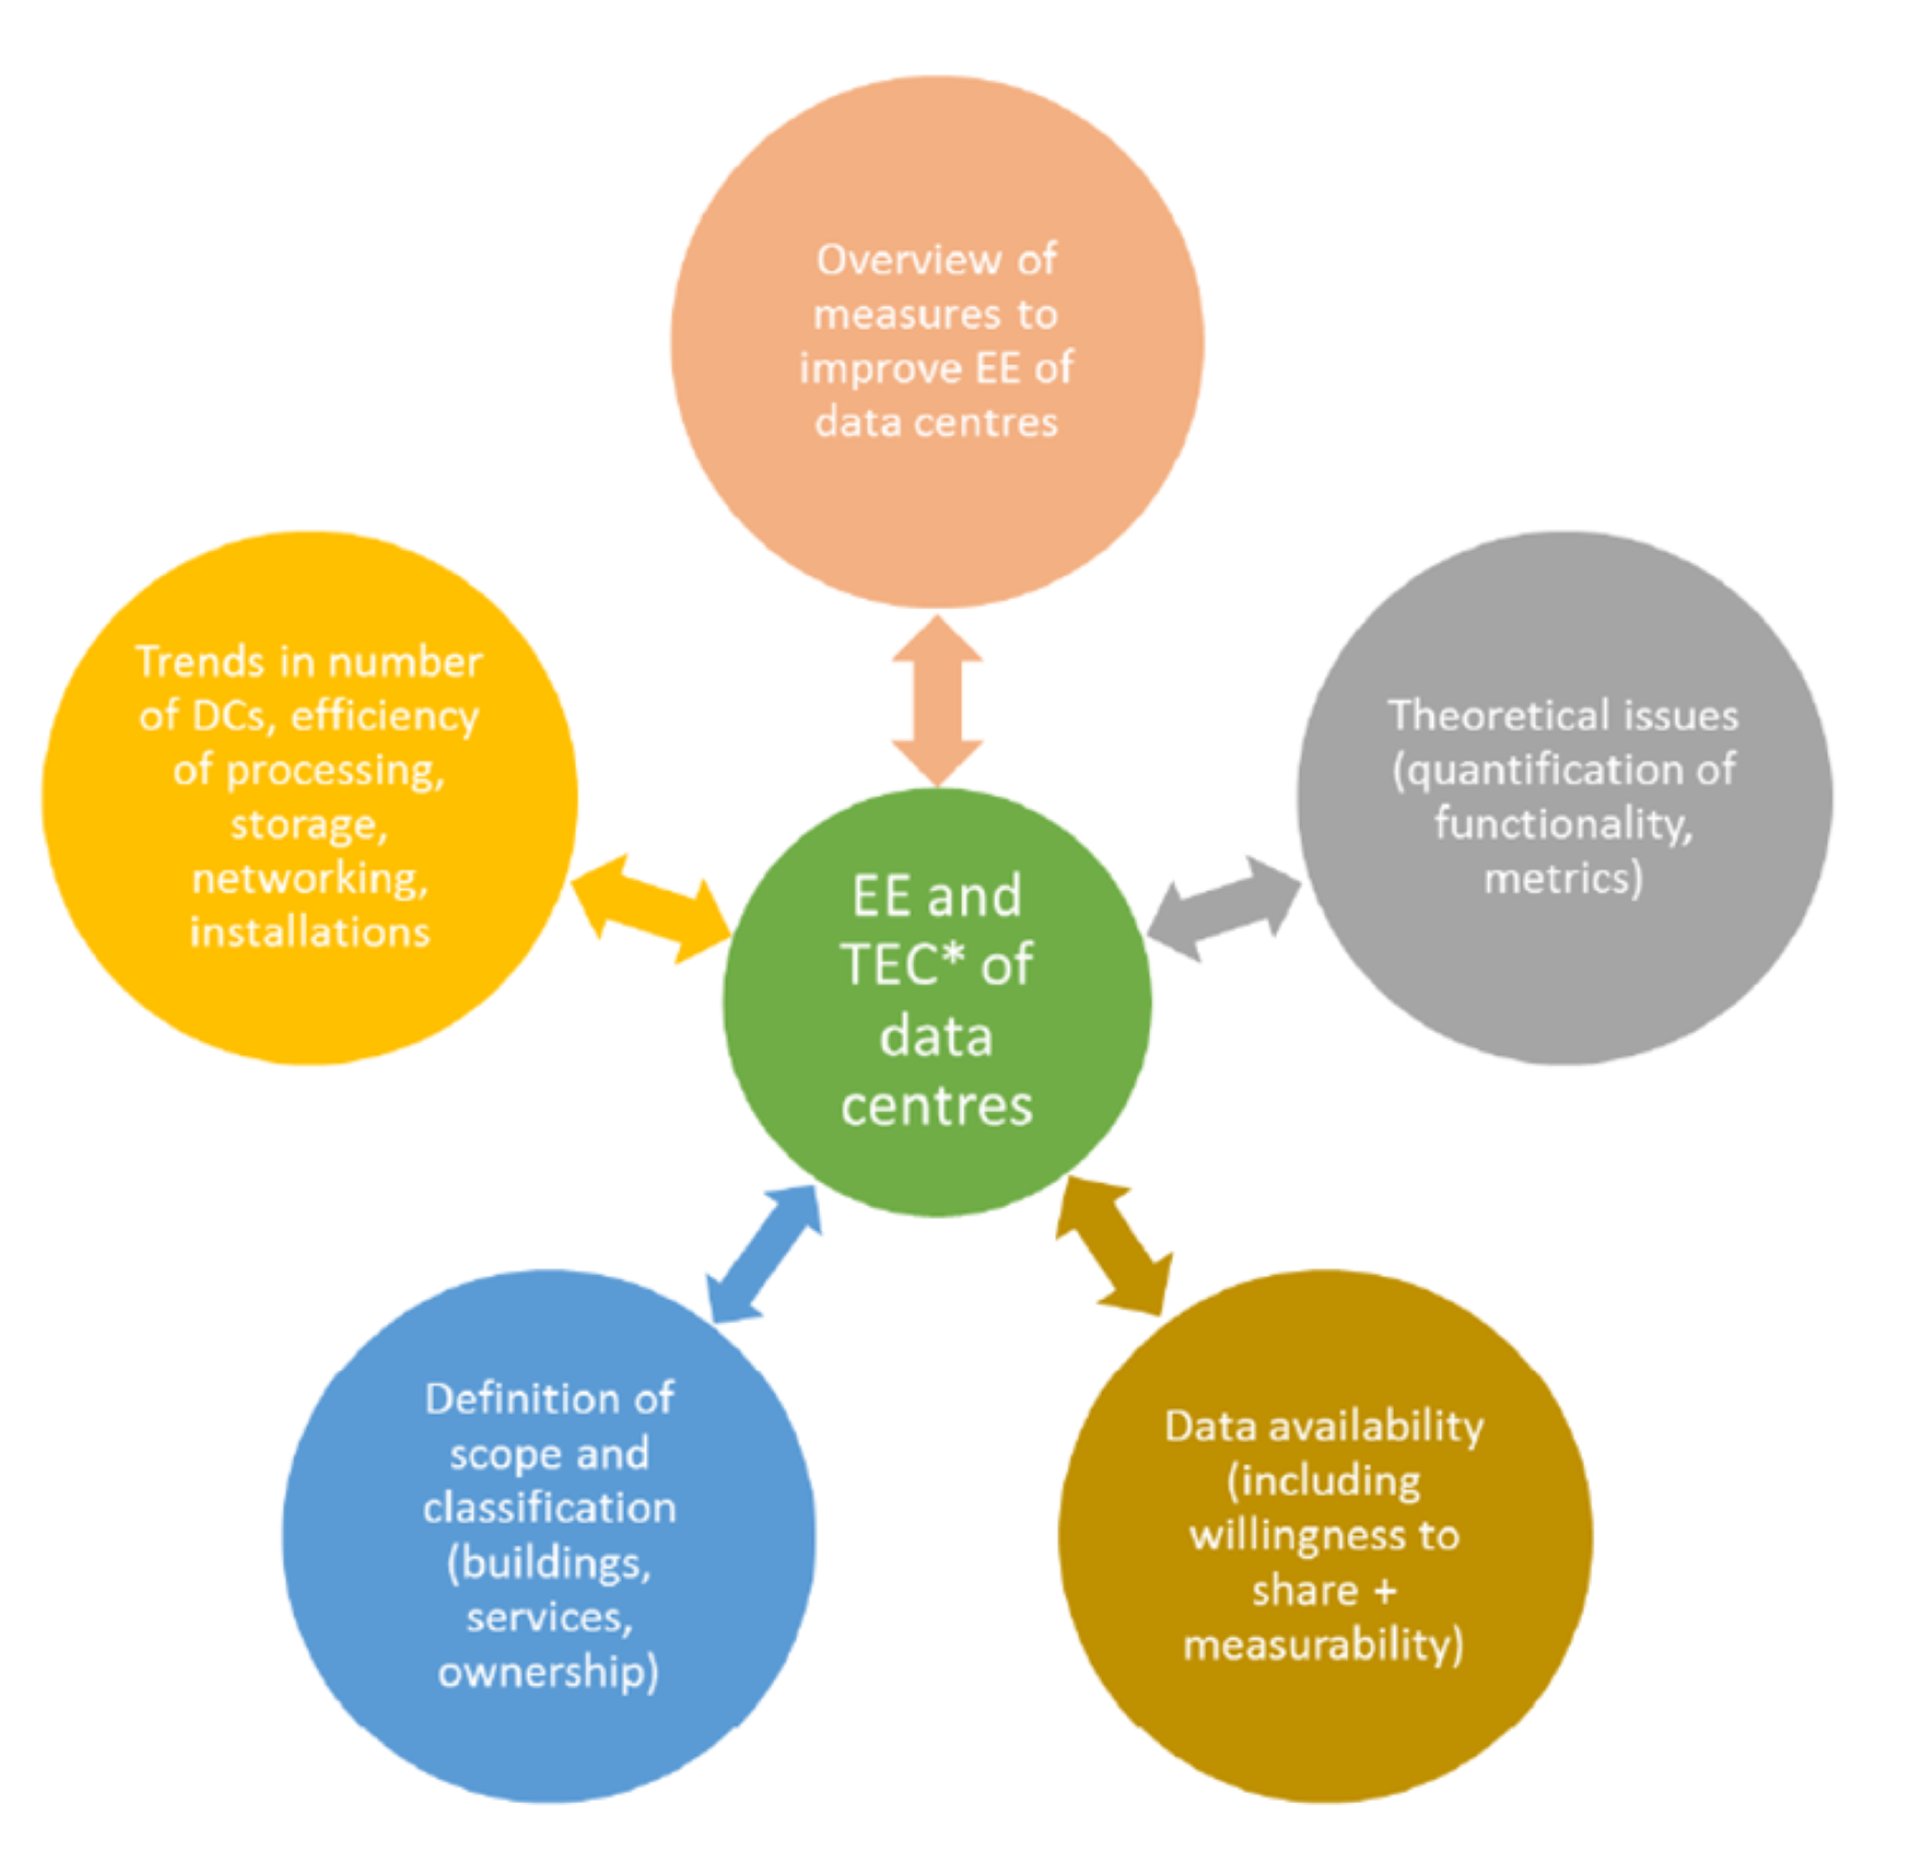
IEA 4E EDNA Activities of the workstream opn energy effi ciency of data centres
This figure shows the diff erent activities that contribute to the workstream on energy effi ciency of data centres.
Copyright: 4E EDNA
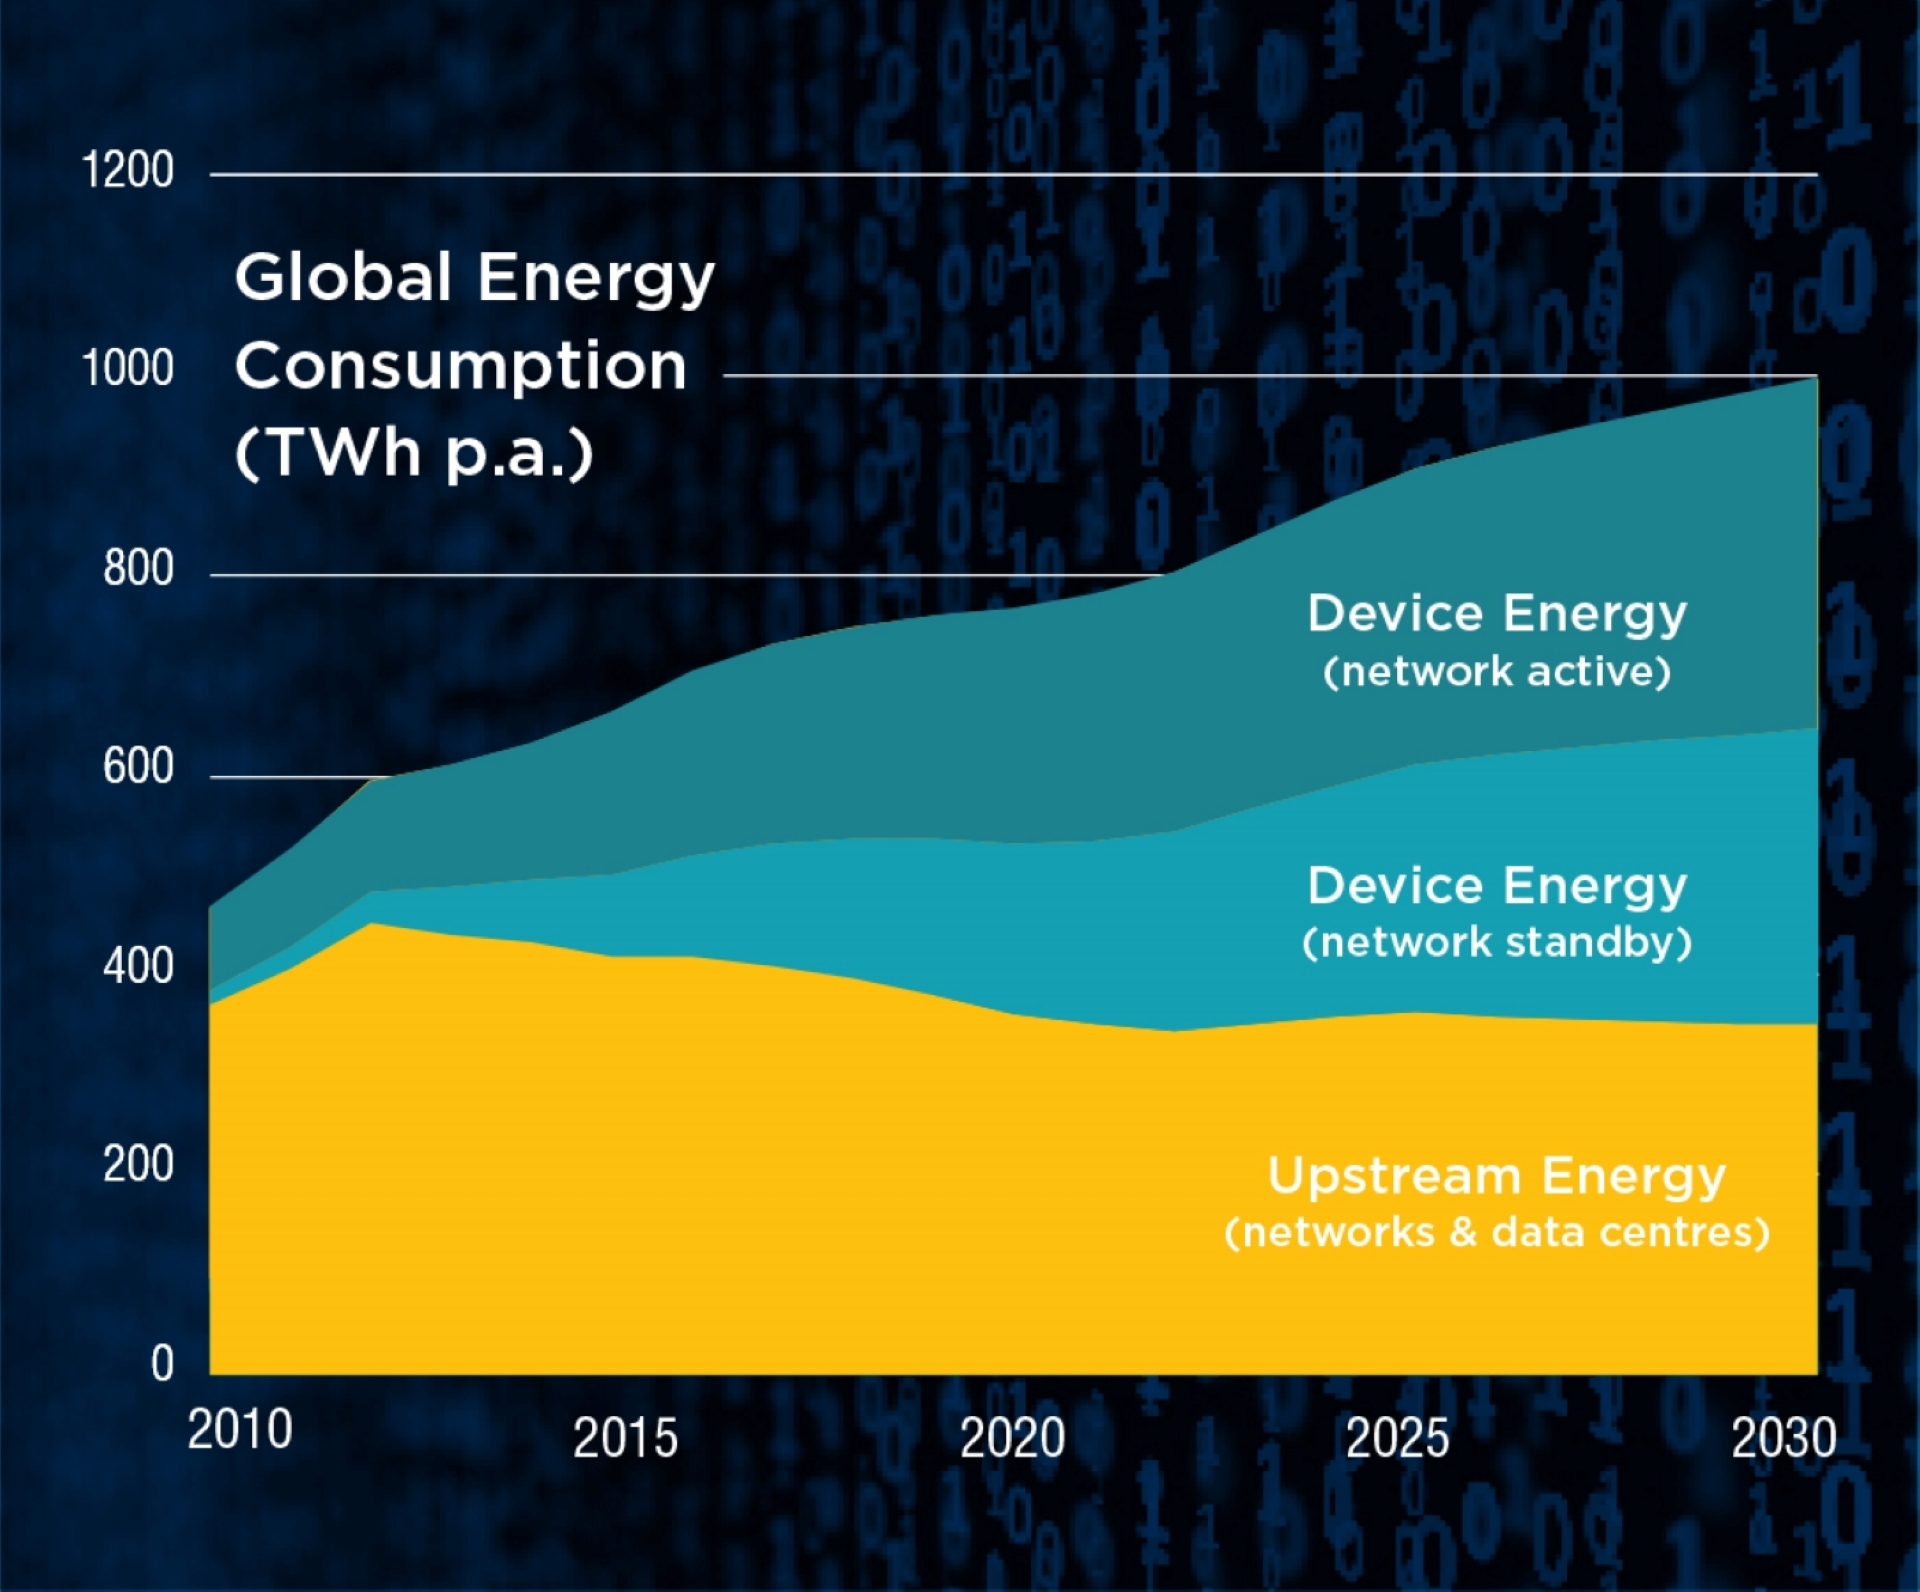
Global Energy Consumption of network connected devices 2010-2030
The figure shows a graph with the annual energy consumption of network-connected devices in different operating modes - network active and network standby - as well as with the upstream energy consumption of networks and data centers. By 2030, the total global energy consumption of network-connected devices will increase to about 1,000 TWh/yr. Device-related energy consumption in particular will increase significantly, whereas upstream energy consumption will decrease somewhat and account for about one-third of the energy consumption associated with network-connected devices. These and other graphs on the energy consumption of network-connected devices can be quantified using the EDNA Total Energy Model.
Copyright: EDNA, 2020
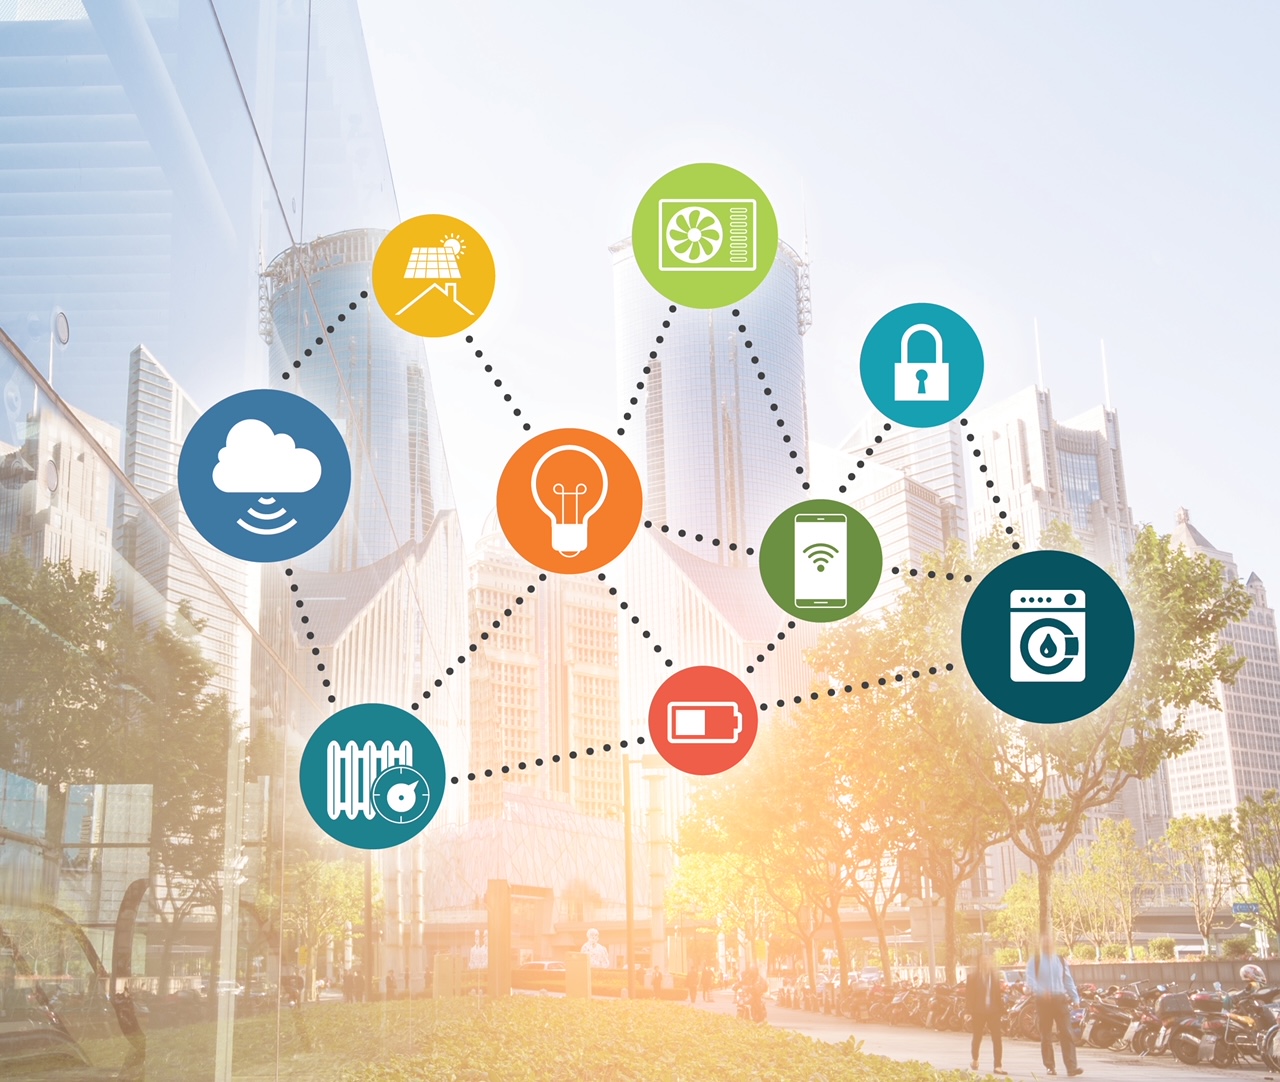
Network connected devices
Schematic overview of network-connected devices and application areas.
Copyright: EDNA, 2020

New image of EDNA´s website
New EDNA platform website with a range of residential connected devices, which are in the focus of EDNA´s work.
Copyright: 4E EDNA
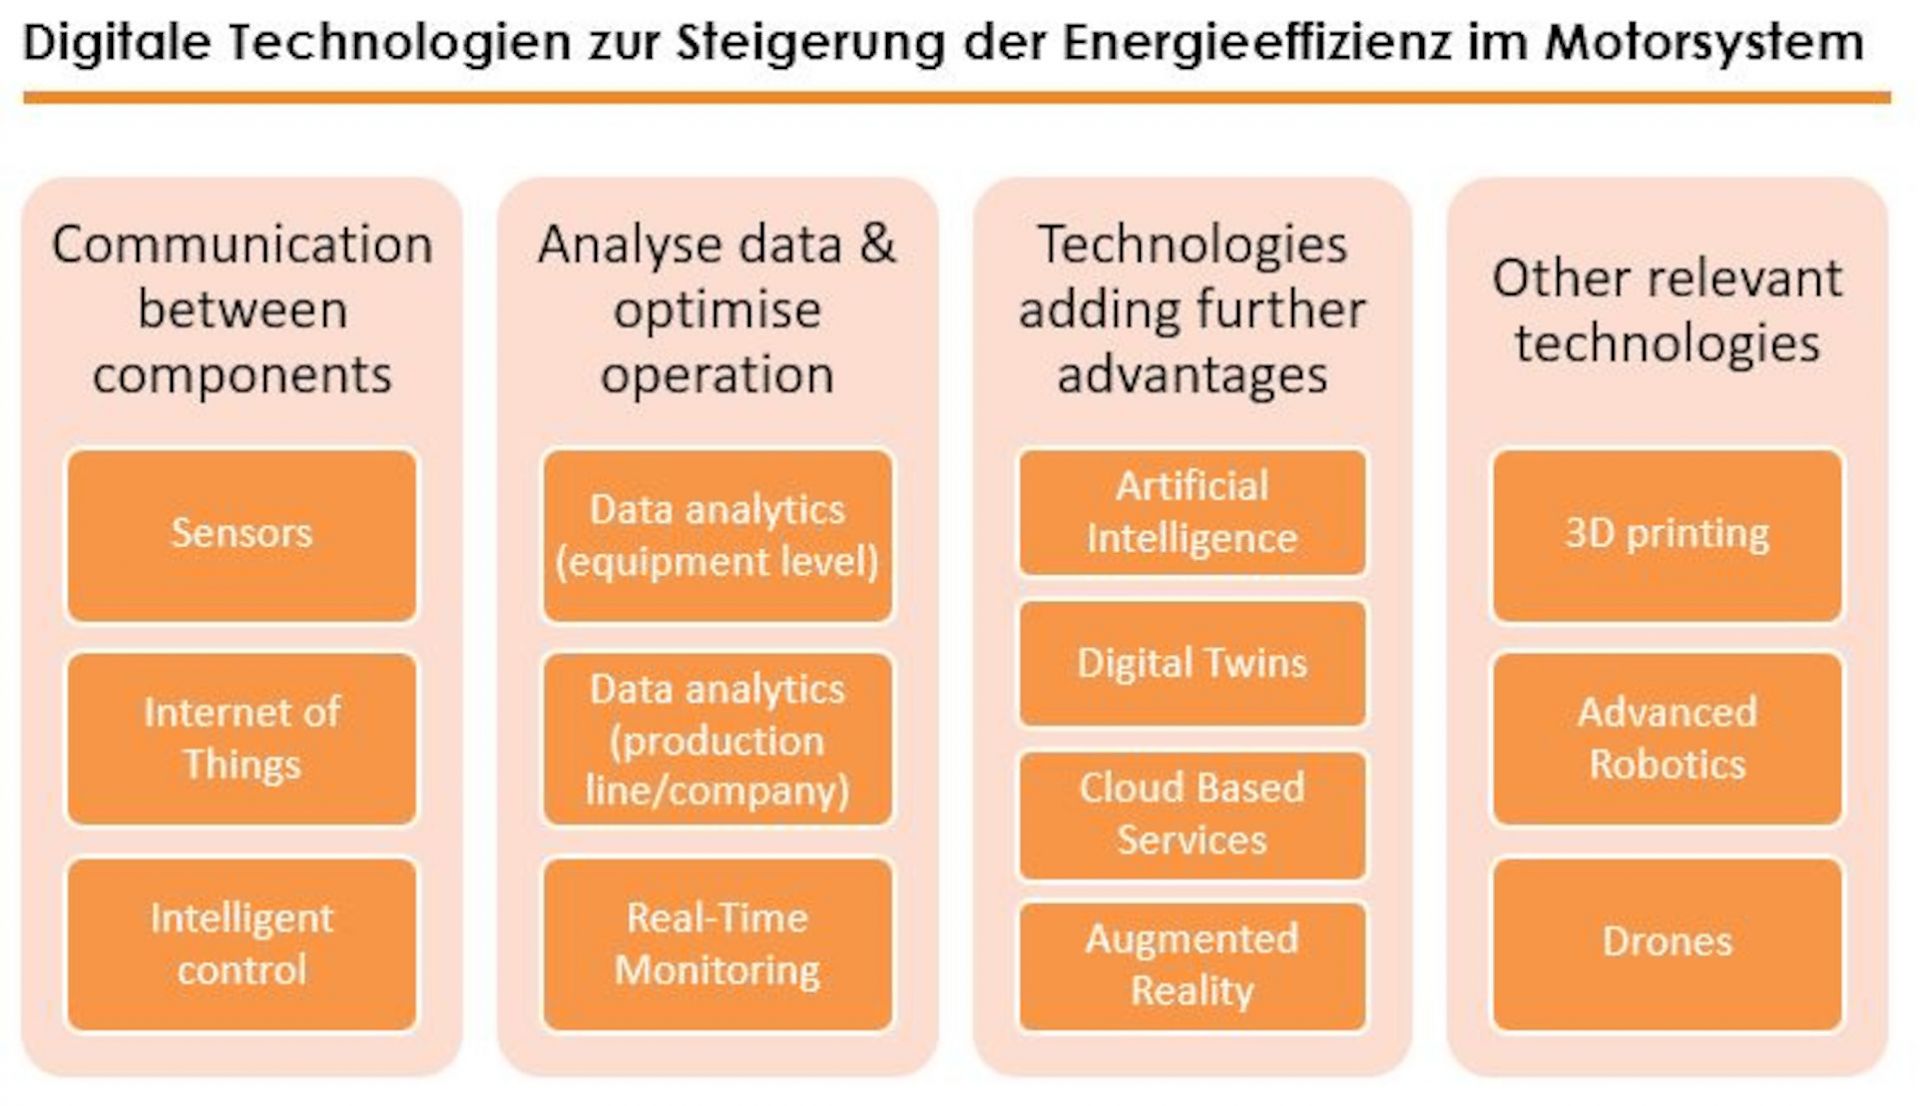
Digital Technologies to Increase the Energyefficiency in Electric Motor Systems
This figure gives an overview of the technologies that were identified as relevant for energy efficiency in electric motor systems in several workshops, in the survey and interviews. Starting on the left-hand side, technologies listed are smart sensors, advanced control on the level of machines and the Internet of things enabling communication between the different levels and components (in dark blue). Furthermore, the next level is the use of possibilities to analyse data and optimize operation (in green): data analytics on both the level of motor systems and on the level of production lines or even the whole company. Continuous monitoring of the different appliances is also significant. Technologies adding advantages to these applications (in grey) are digital twins, cloud-based services and artificial intelligence. Augmented reality can help to implement the suggested measures. Three technologies that are not directly related to the optimization of motor driven systems, but are of further interest include drones, 3D printing and advanced robotics.
Copyright: Österreichische Energieagentur, impact energy
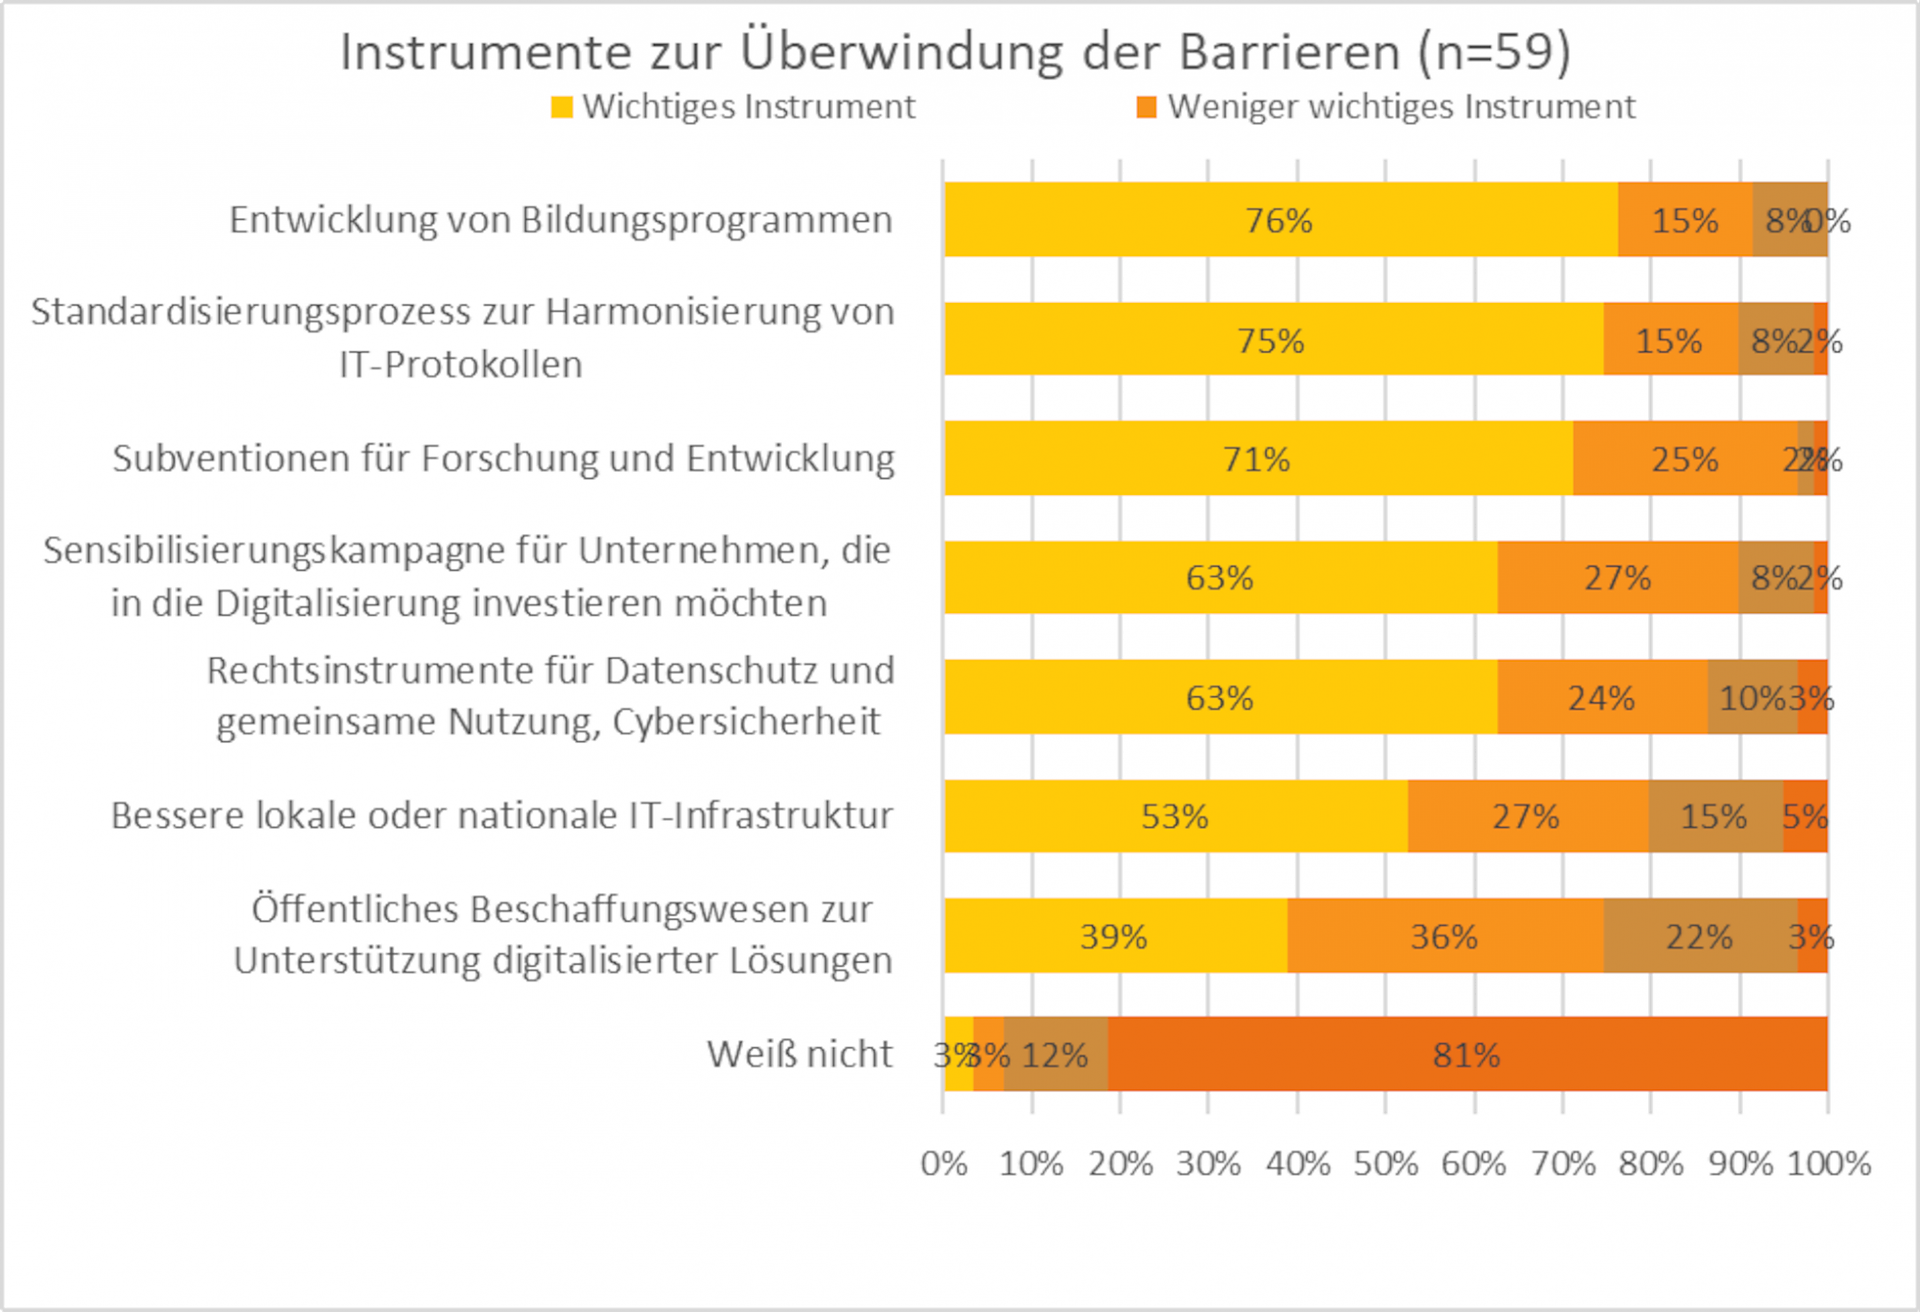
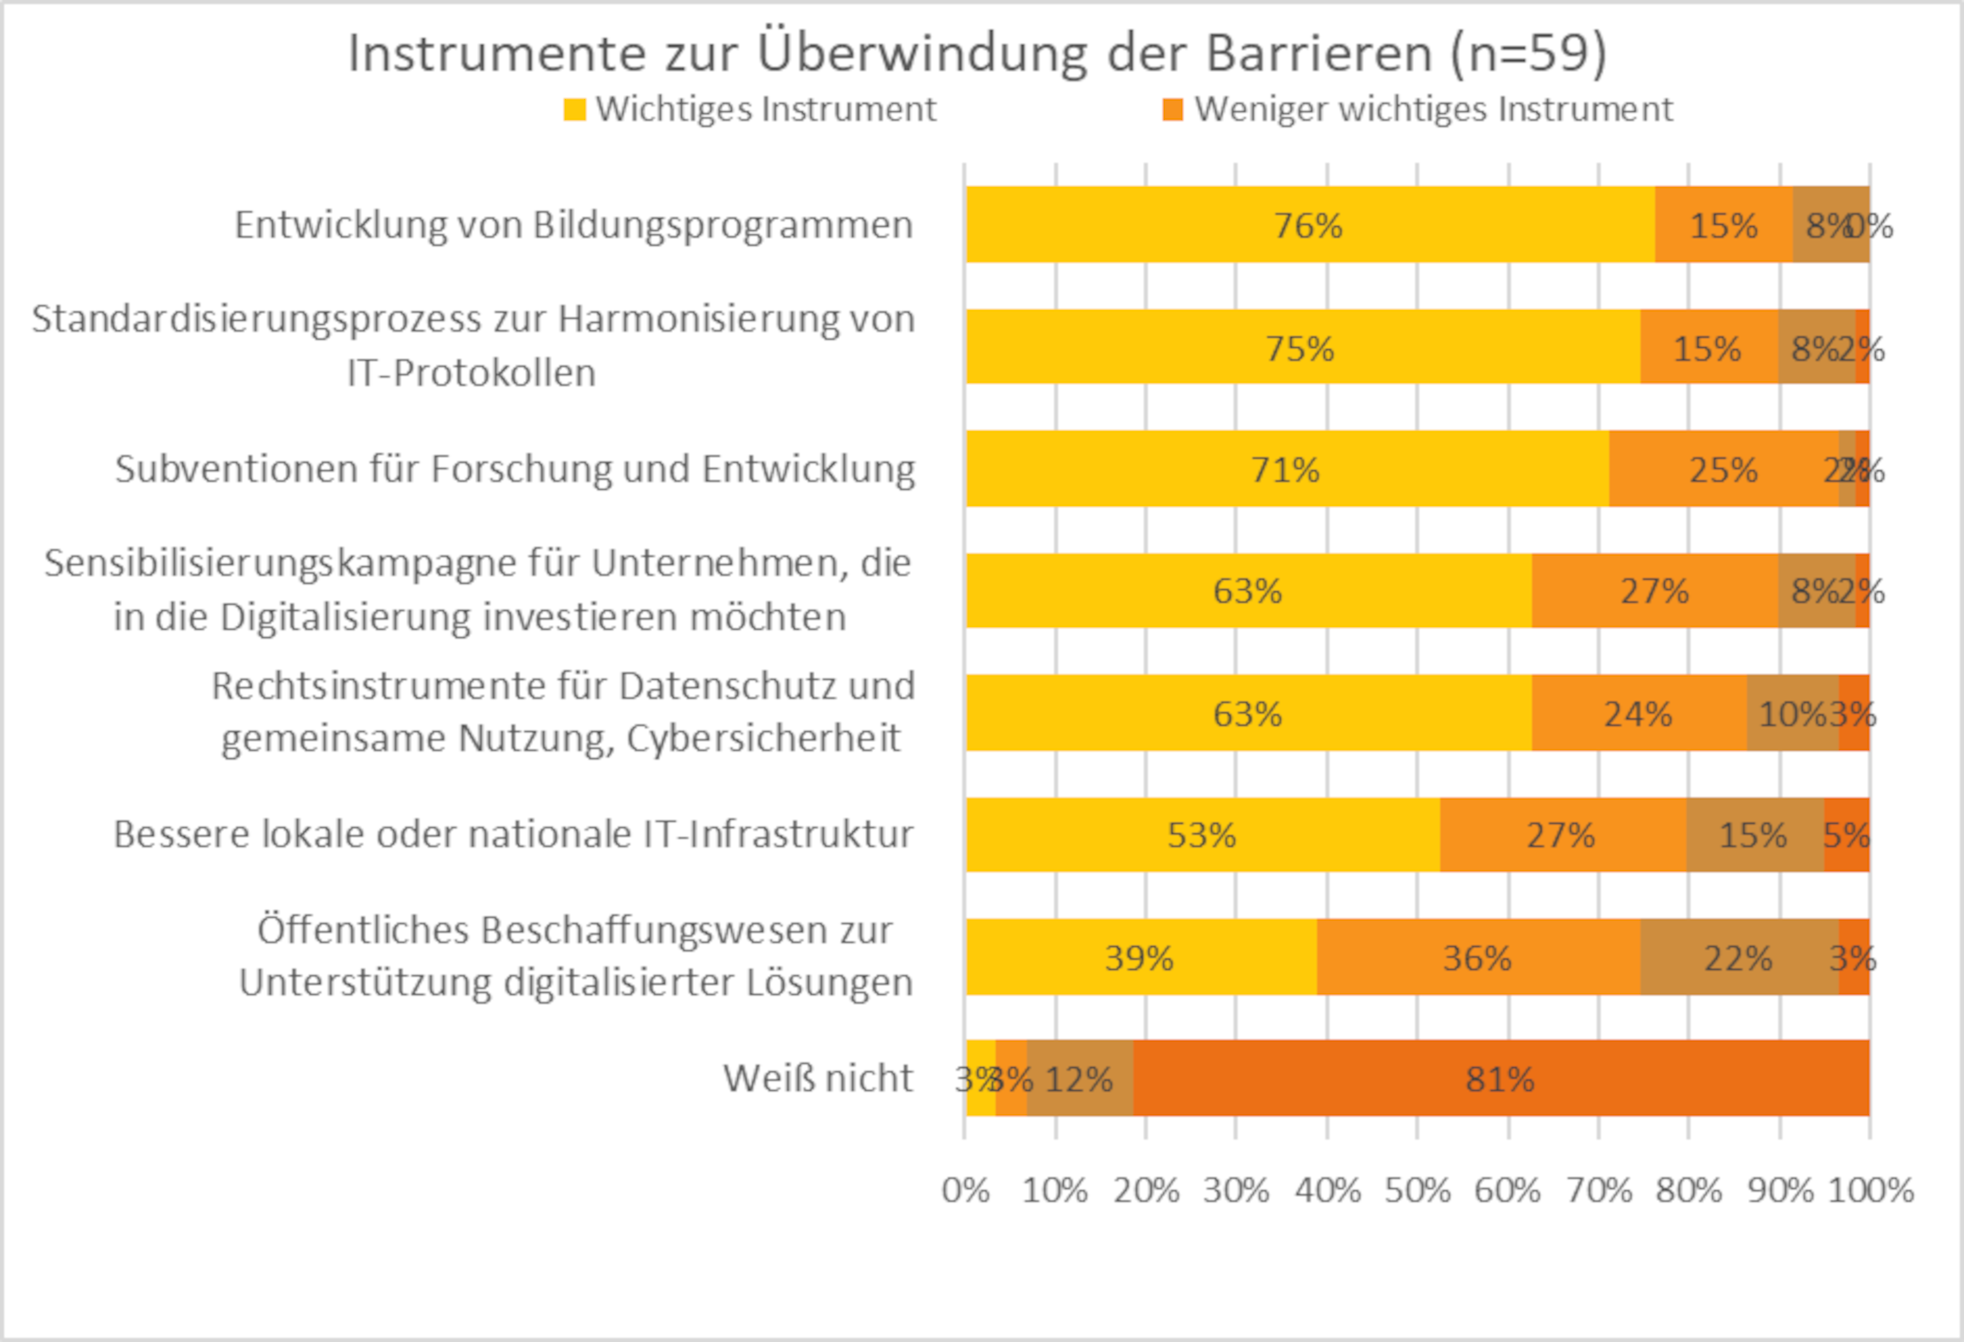
Important instruments to overcome barriers to using digital production technologies
Around three quarters of the respondents consider the development of education programmes and the standardisation process to harmonise protocols, as well as subsidies for research as important policy instruments to overcome these barriers.
Copyright: Österreichische Energieagentur
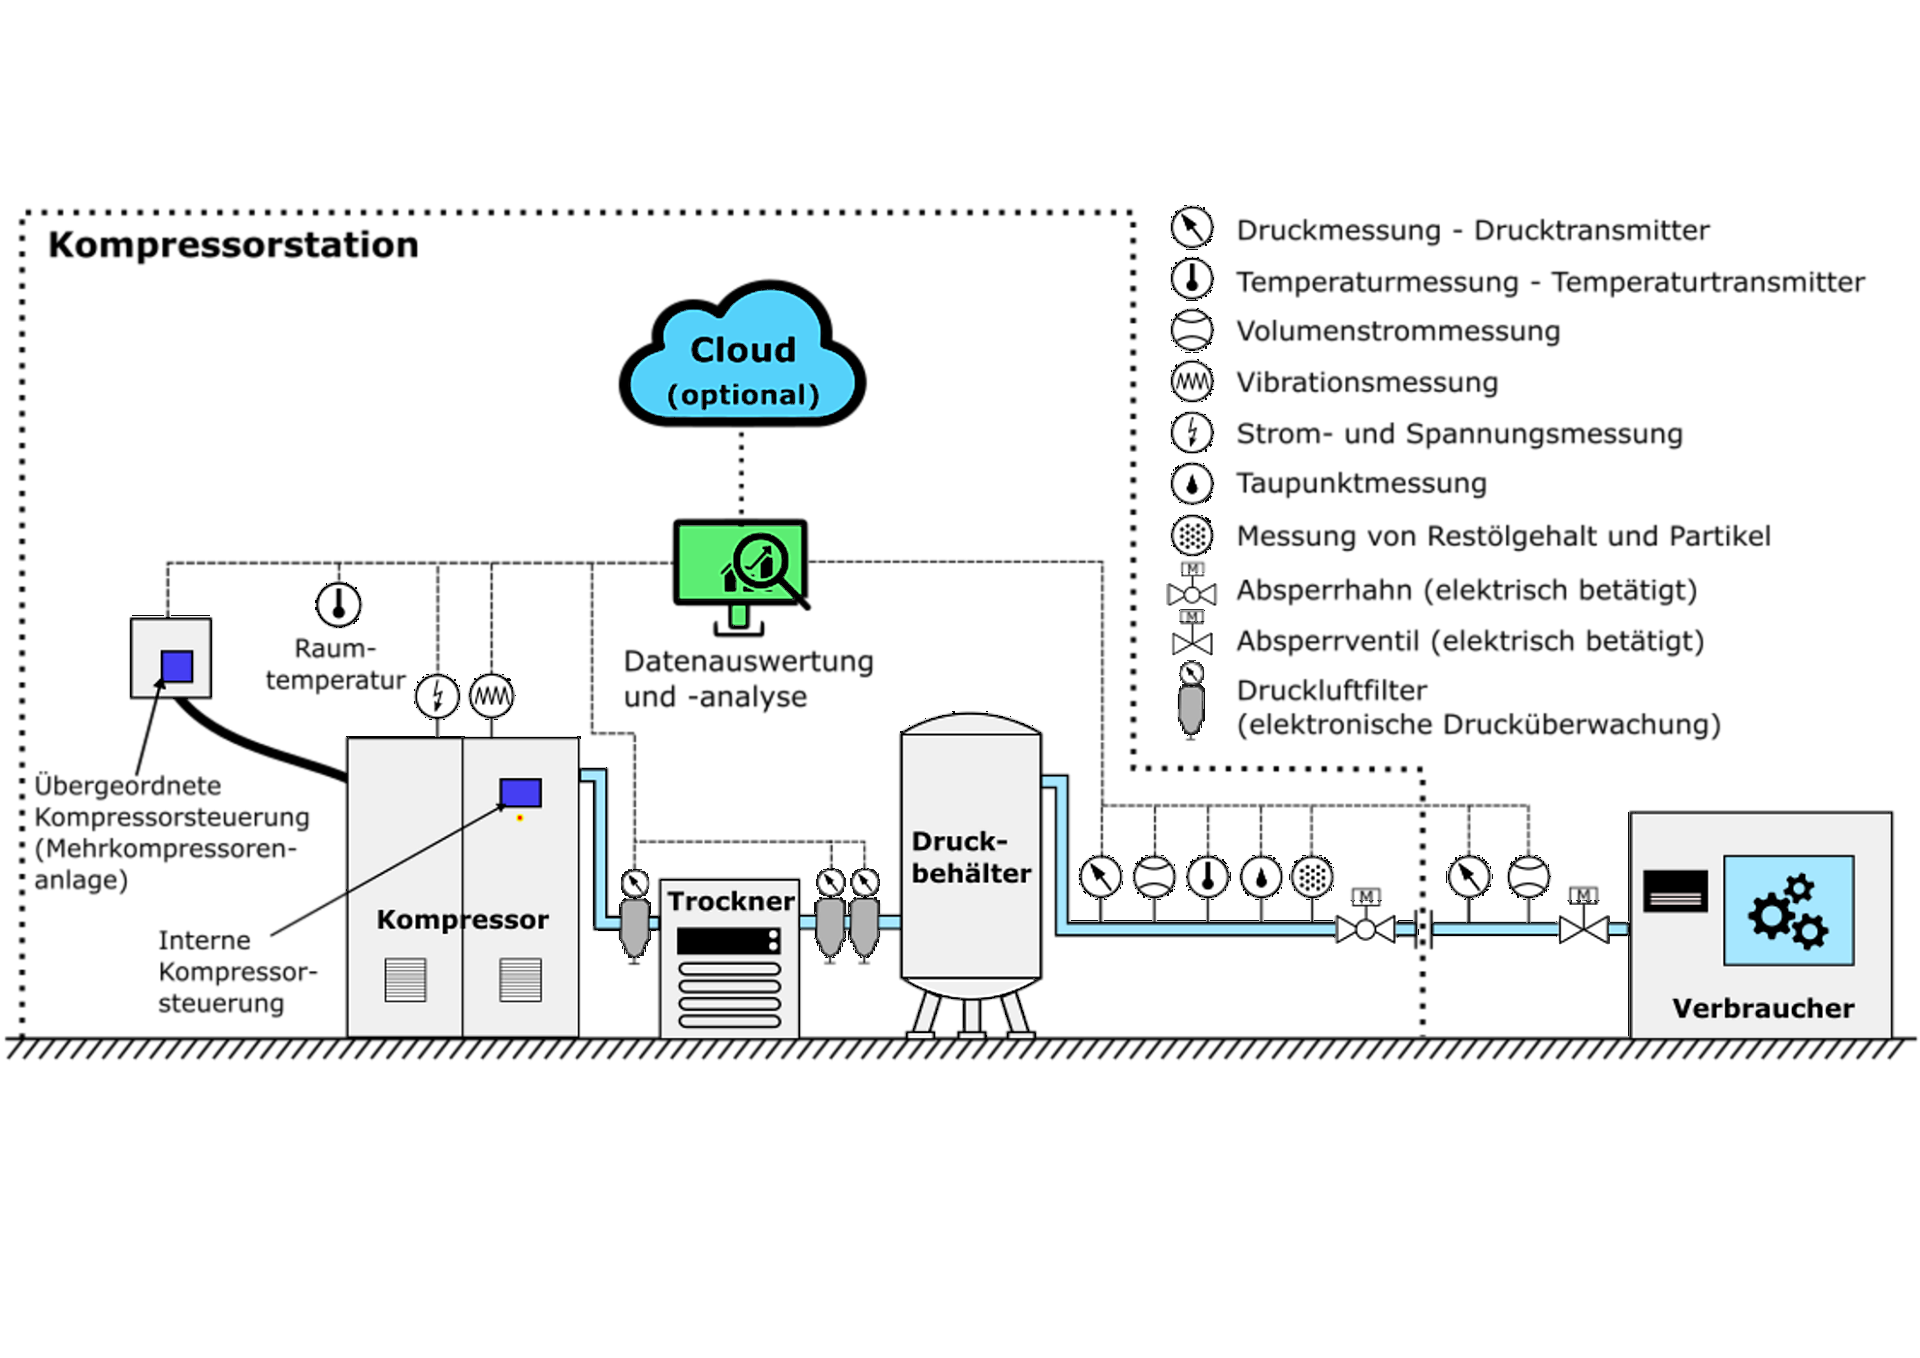
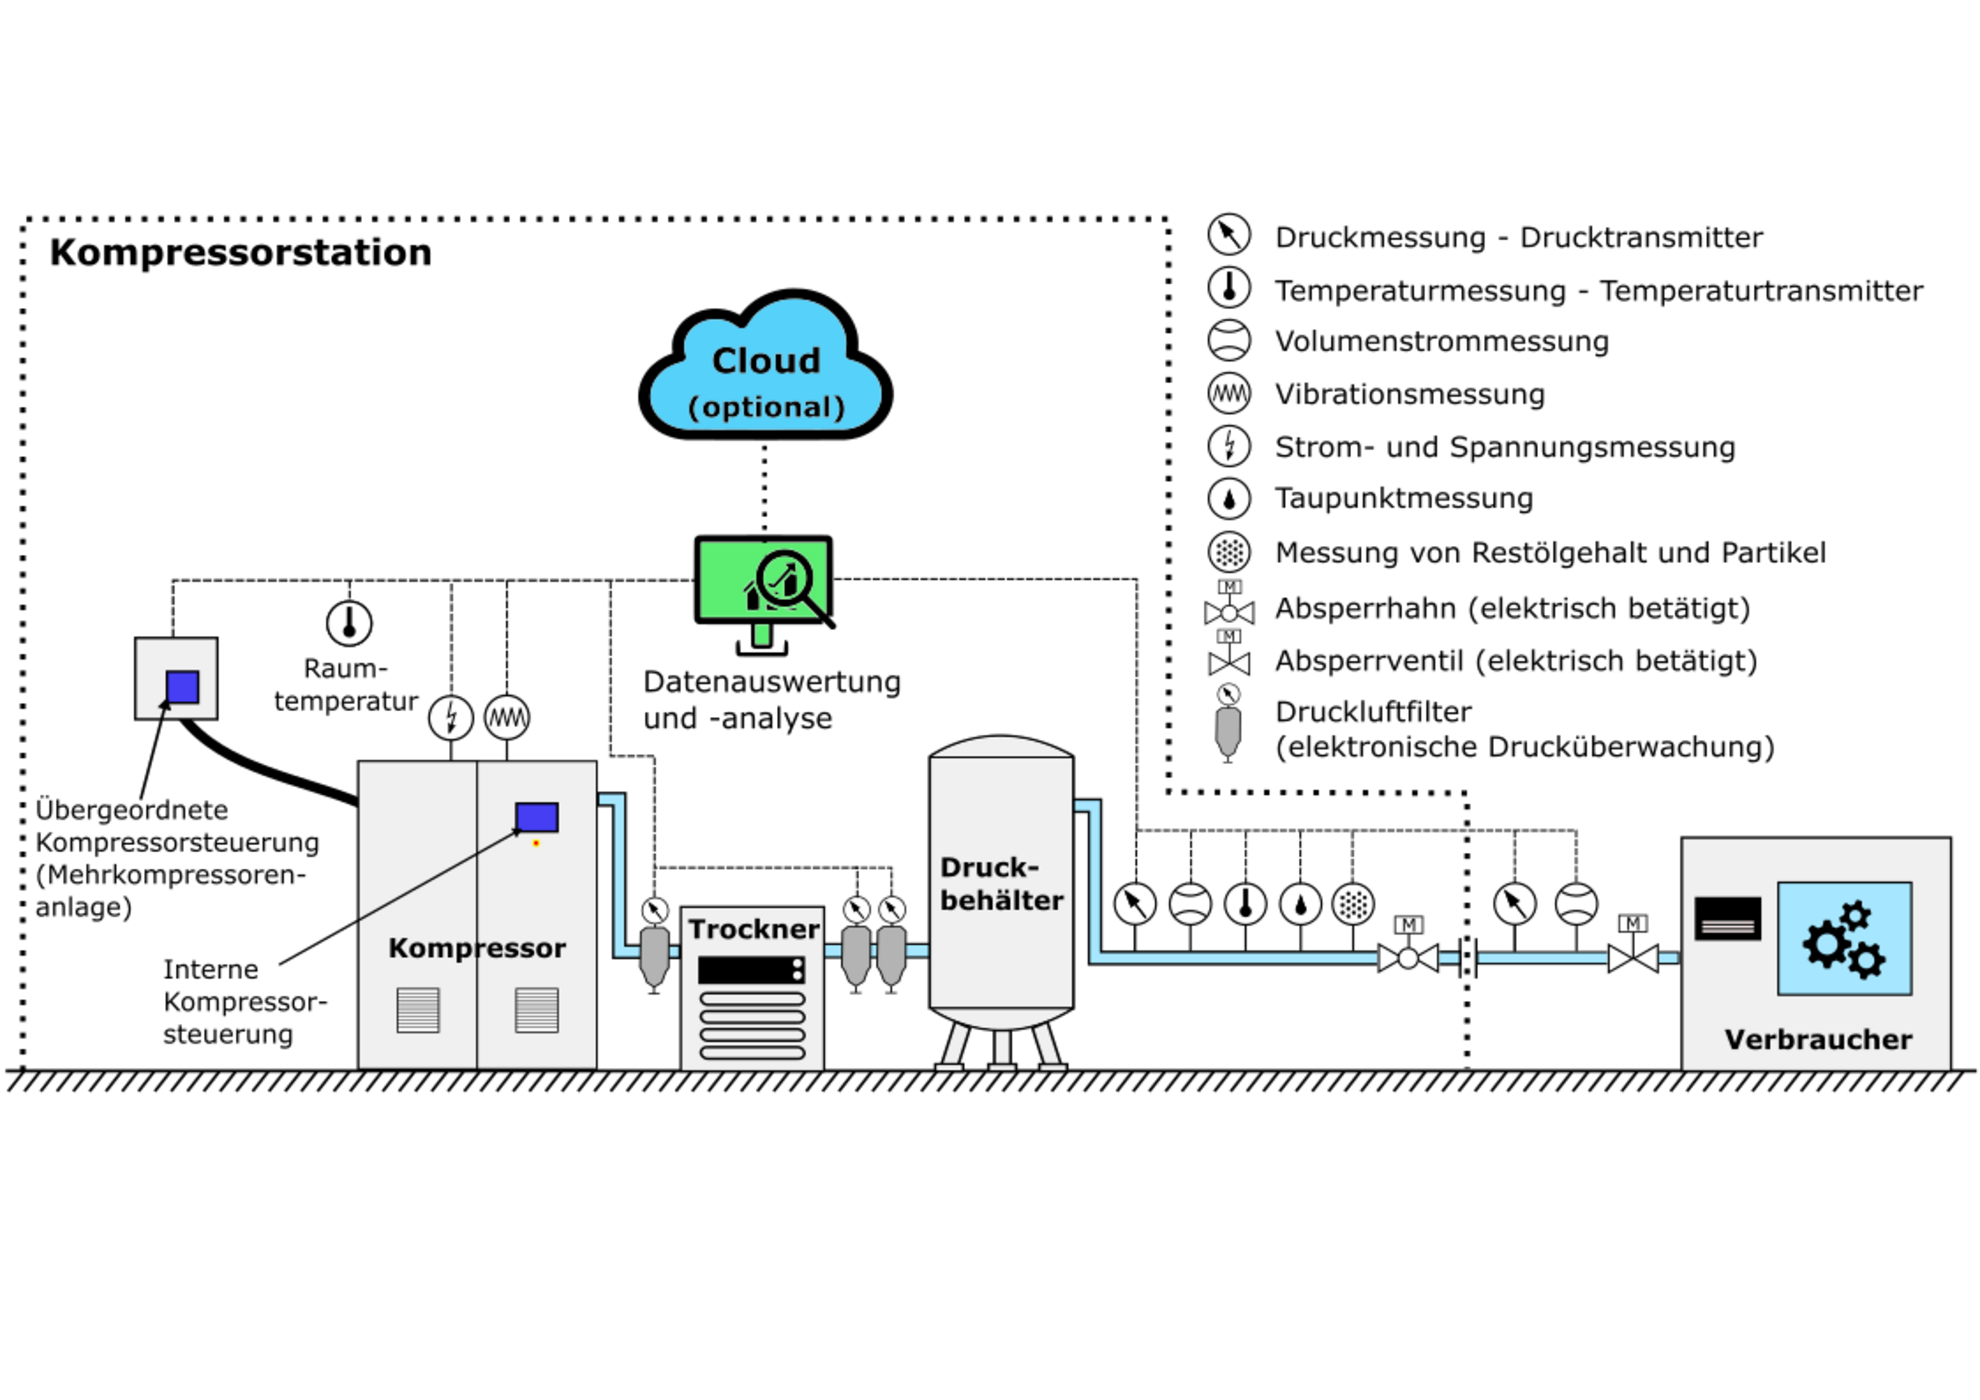
Overview of possible measuring points for the digitalization of compressed air systems
The diagram shows a compressor in the form of a larger square. Virbration measurement and current and voltage measurement are added here as small circles. There is a small rectangle on the square with the note: Internal compressor control. There is also a thick connection to another rectangle for higher-level control. Nearby is a small circle for the room temperature. A line comes out of the compressor to a compressed air filter with electronic pressure monitoring and on to a larger rectangle, the dryer. After two more compressed air filters, the line runs to the pressure tank, a larger oval with three feet. The line continues out of the pressure tank. The small circles with the designations for pressure measurement, volume flow measurement, temperature measurement, wobble point measurement and measurement for residual oil content and particles are then shown here one after the other, and an electrically operated stopcock is also drawn in. A dotted line in the form of a rectangle is drawn around these components for the compressor station. The pipe runs further out of this rectangle. Pressure measurement and volume flow measurement as well as an electrically operated shut-off valve are also drawn. At the end of the line, another rectangle is drawn with the label: Consumer. Within the dotted rectangle above the components mentioned are two symbols, one in the form of a computer screen labeled: Data evaluation and analysis, above it a blue cloud labeled: Cloud (optional). All the measurements mentioned are connected to the data evaluation via a dotted line.
Copyright: Österreichische Energieagentur
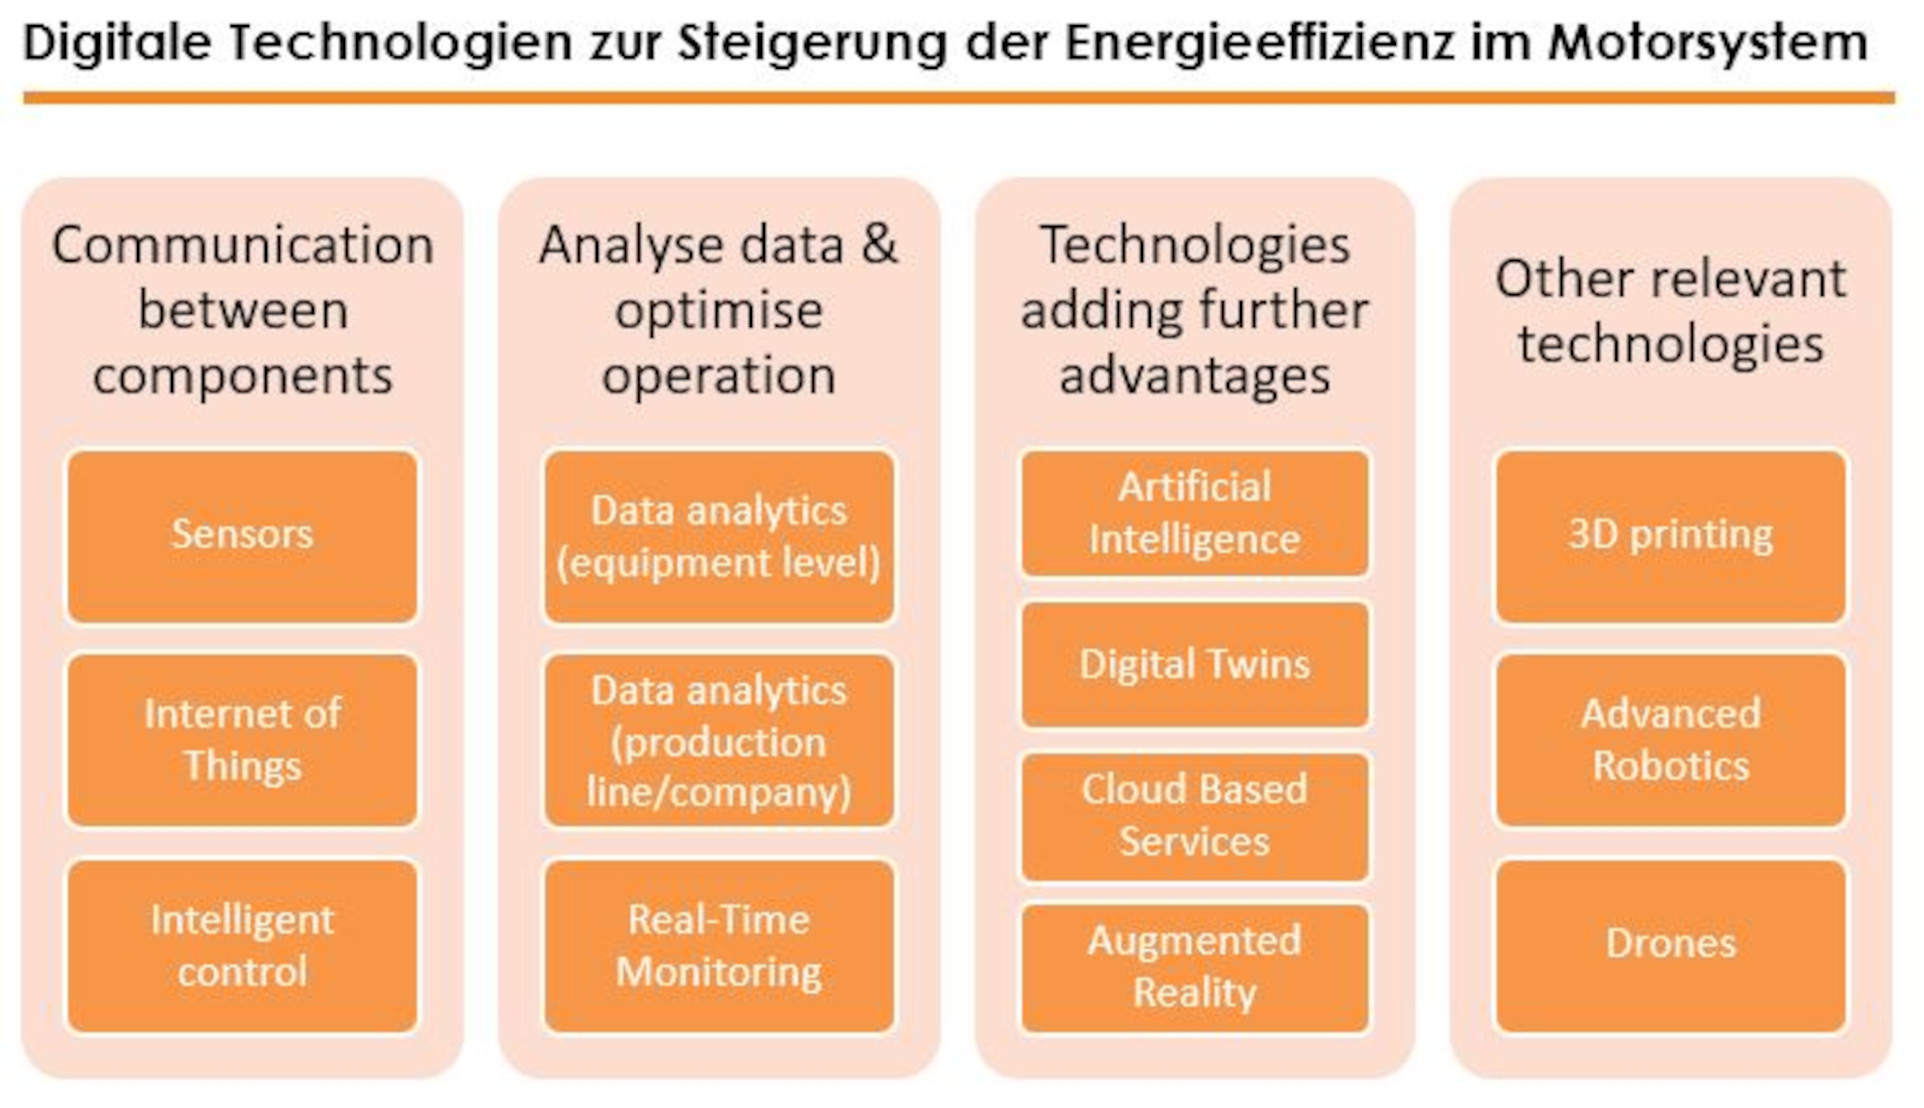
Digital Technologies to Increase the Energyefficiency in Electric Motor Systems
The figure gives an overview of the technologies that were identified as relevant for energy efficiency in electric motor systems in several workshops, in the survey and interviews. Starting on the left-hand side of this picture technologies listed are smart sensors, advanced control on the level of machines and the Internet of things enabling communication between the different levels and components (in dark blue). Furthermore, the next level is the use of possibilities to analyse data and optimize operation (in green): data analytics on both the level of motor systems and on the level of production lines or even the whole company. Continuous monitoring of the different appliances is also significant. Technologies adding advantages to these applications (in grey) are digital twins, cloud-based services and artificial intelligence. Augmented reality can help to implement the suggested measures. Three technologies that are not directly related to the optimization of motor driven systems, but are of further interest include drones, 3D printing and advanced robotics (in dark blue at the right side of Figure 1). Starting on the left-hand side in Figure 1, technologies listed are smart sensors, advanced control on the level of machines and the Internet of things enabling communication between the different levels and components (in dark blue). Furthermore, the next level is the use of possibilities to analyse data and optimize operation (in green): data analytics on both the level of motor systems and on the level of production lines or even the whole company. Continuous monitoring of the different appliances is also significant. Technologies adding advantages to these applications (in grey) are digital twins, cloud-based services and artificial intelligence. Augmented reality can help to implement the suggested measures. Three technologies that are not directly related to the optimization of motor driven systems, but are of further interest include drones, 3D printing and advanced robotics (in dark blue at the right side of Figure 1).
Copyright: Österreichische Energieagentur, impact energy
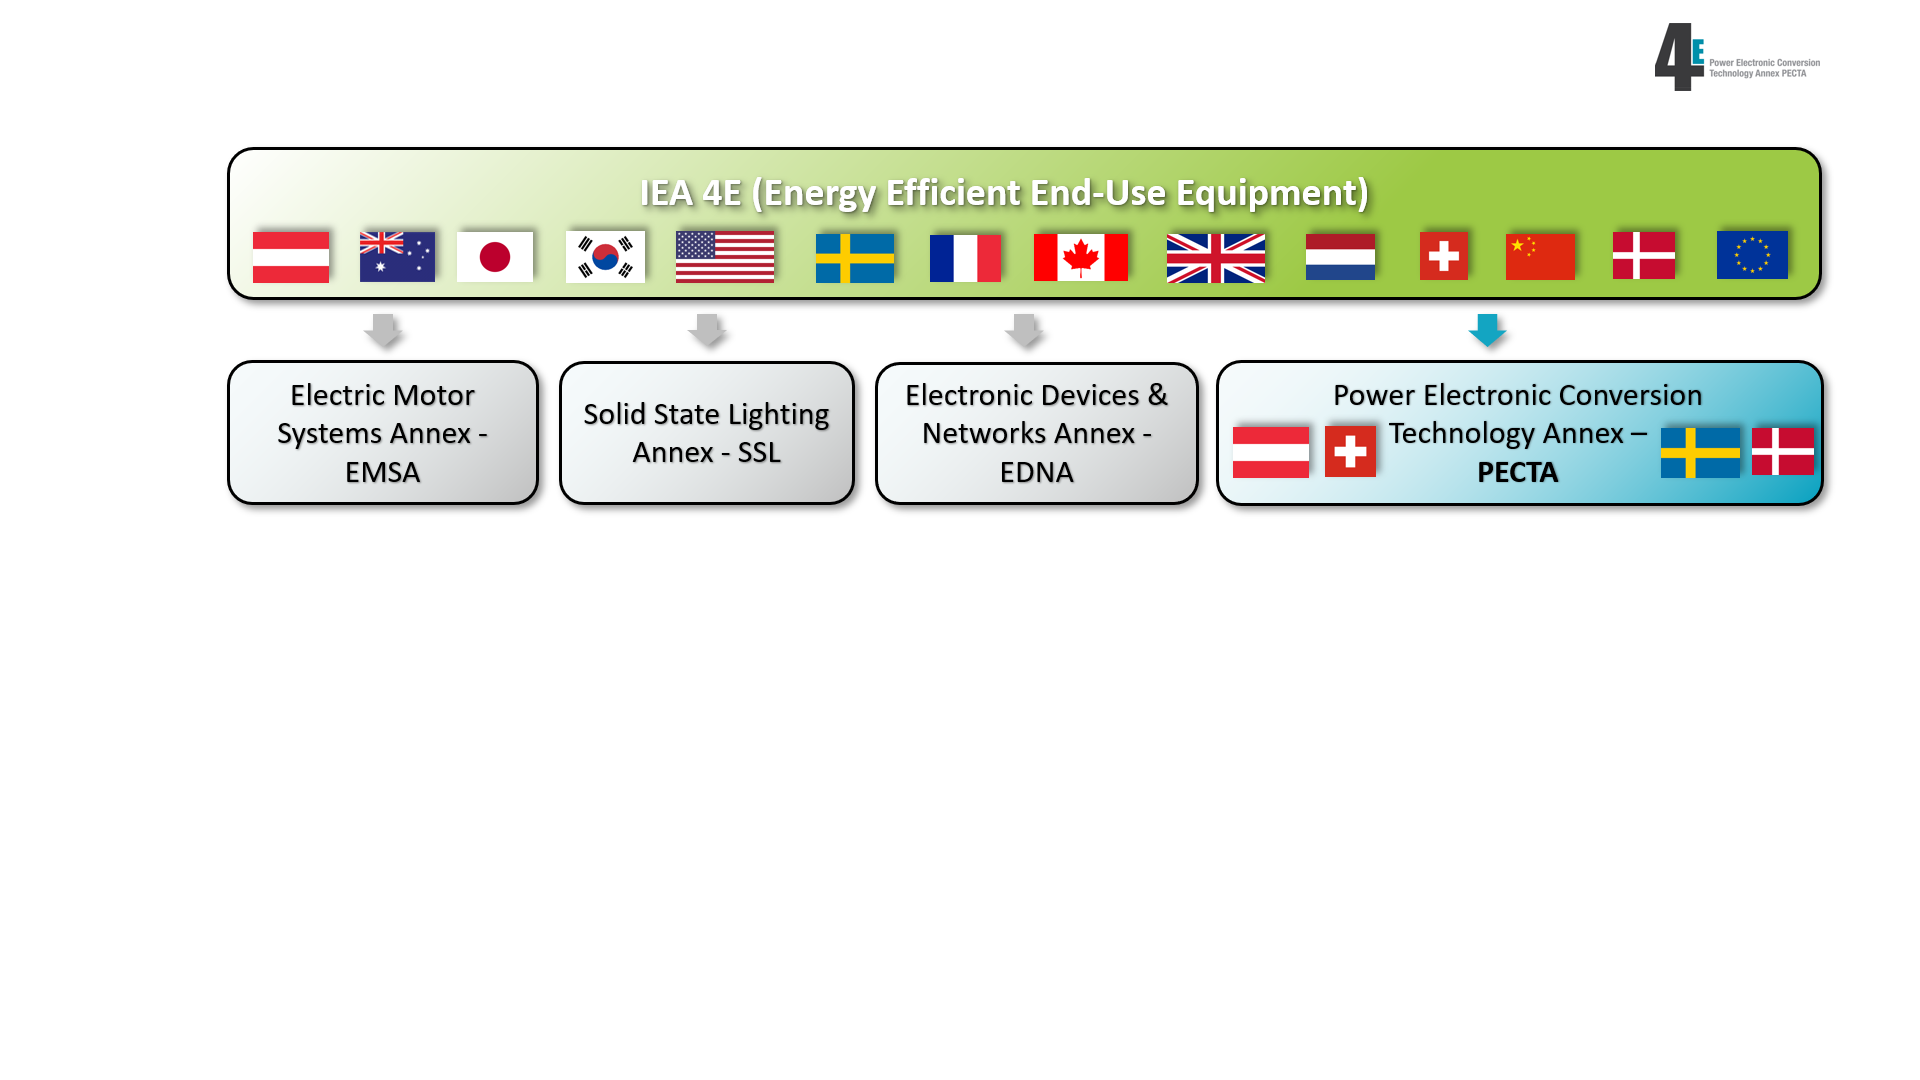
Integration of PECTA within the 4E technology program
Since March 2019, the 4E Technology Program consists of 4 different Annexes: EMSA (Electric Motor Systems Annex), SSL (Solid State Lighting Annex), EDNA (Electronic Devices & Networks Annex) and PECTA (Power Electronic Conversion Technology Annex).
Copyright: 4E PECTA
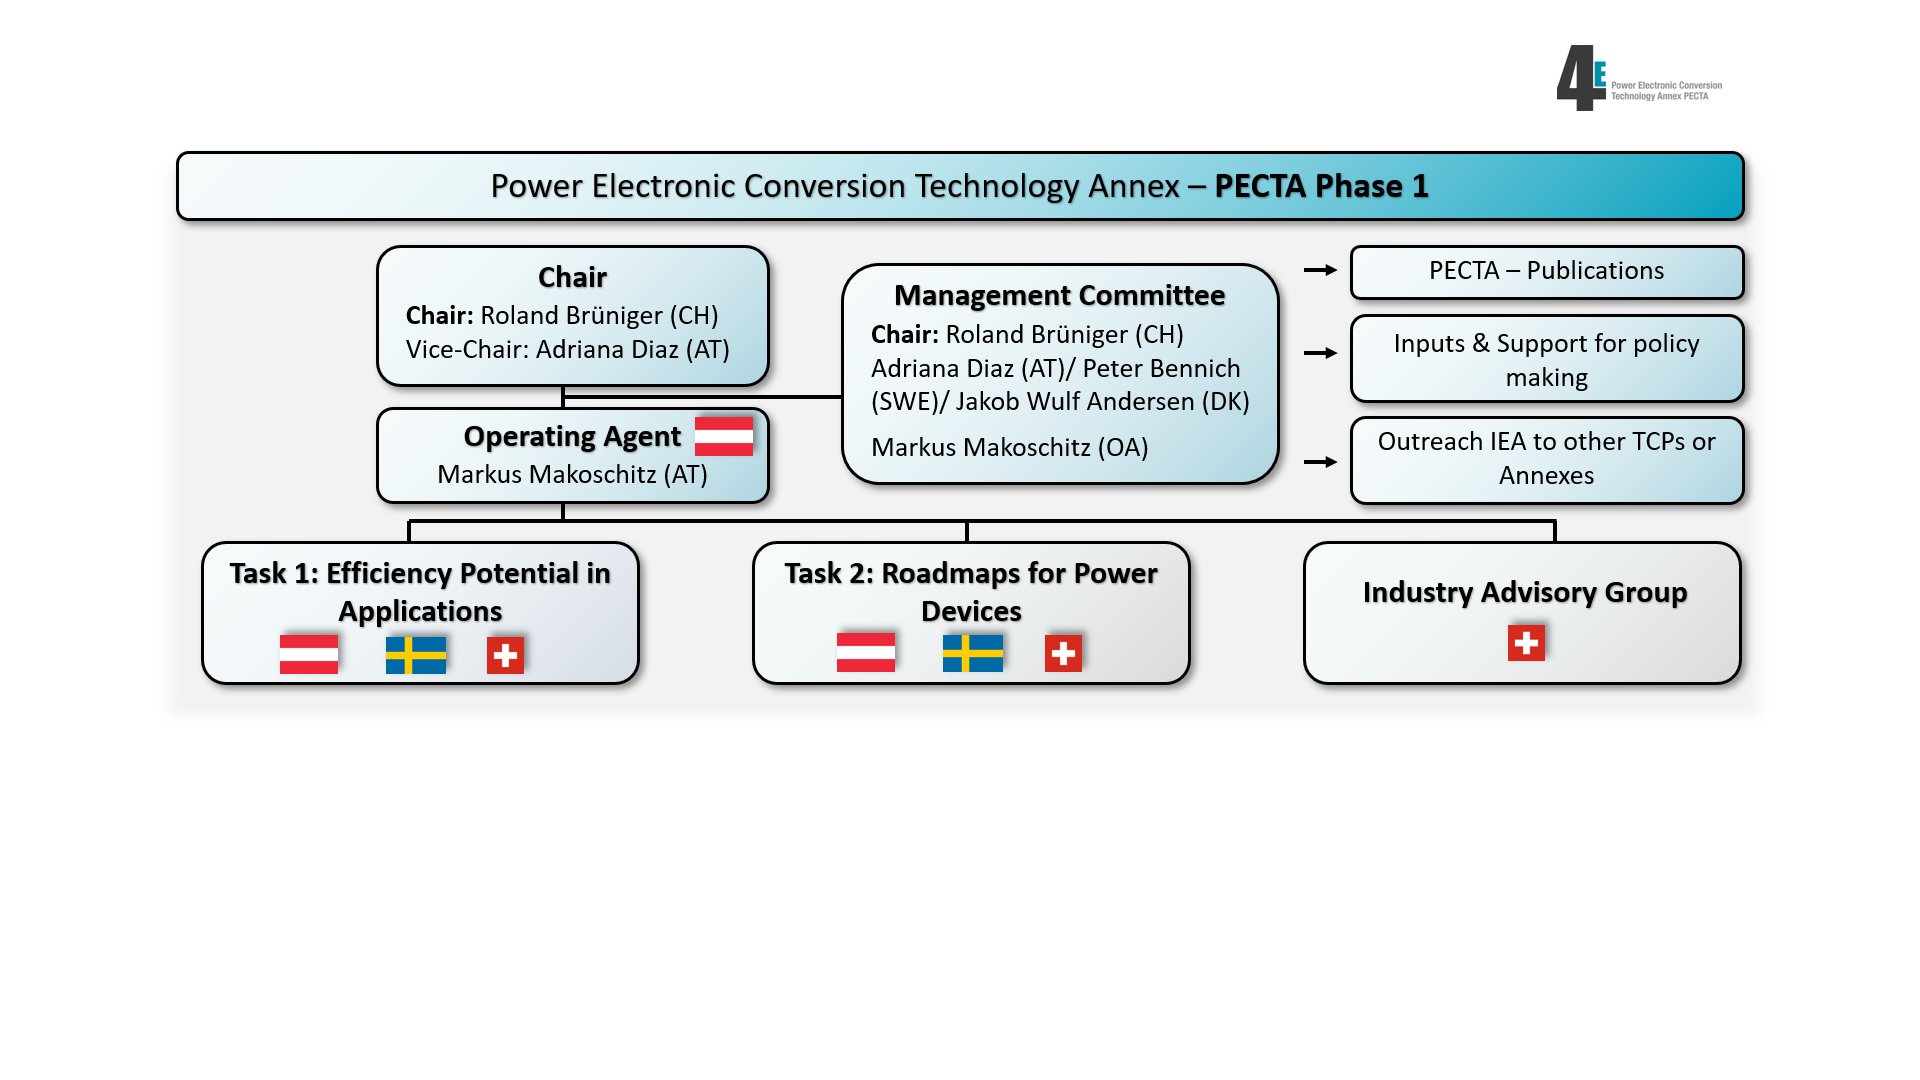
Structure of PECTA during Phase 1
In the course of PECTA's Phase 1, two tasks were processed. Task 1: Efficiency Potential in Applications. Task 2: Roadmaps for Power Devices. The position of the Operating Agent was filled by Austria. Task 1 and Task 2 were carried out with participation from Austria, Sweden and Switzerland. The Industry Advisory Group is coordinated by Switzerland.
Copyright: 4E PECTA
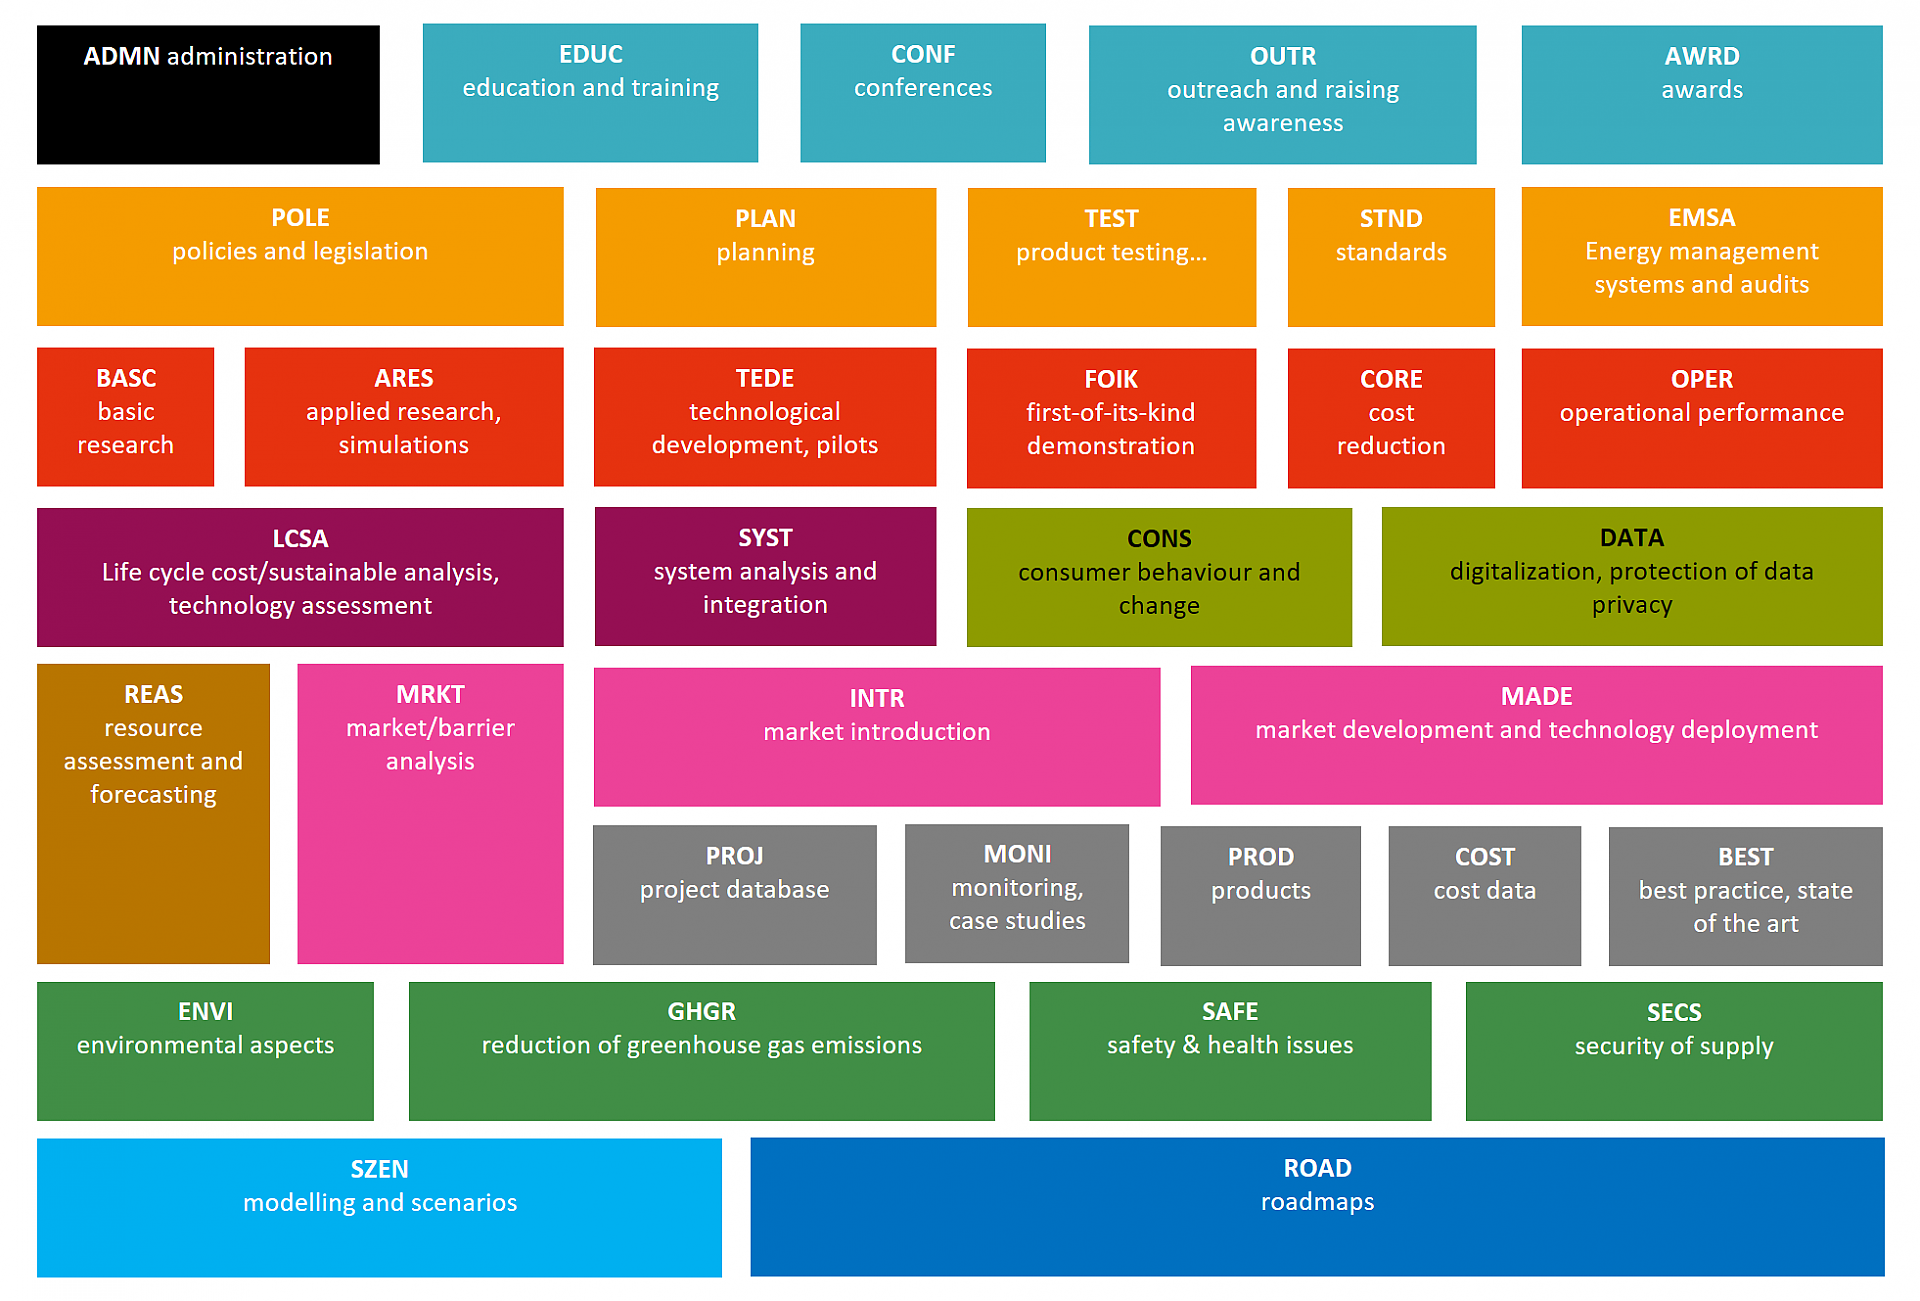
Methods
Set of methods to classify the type of activity of TCP Tasks and Annexes.
Copyright: Austrian Energy Agency
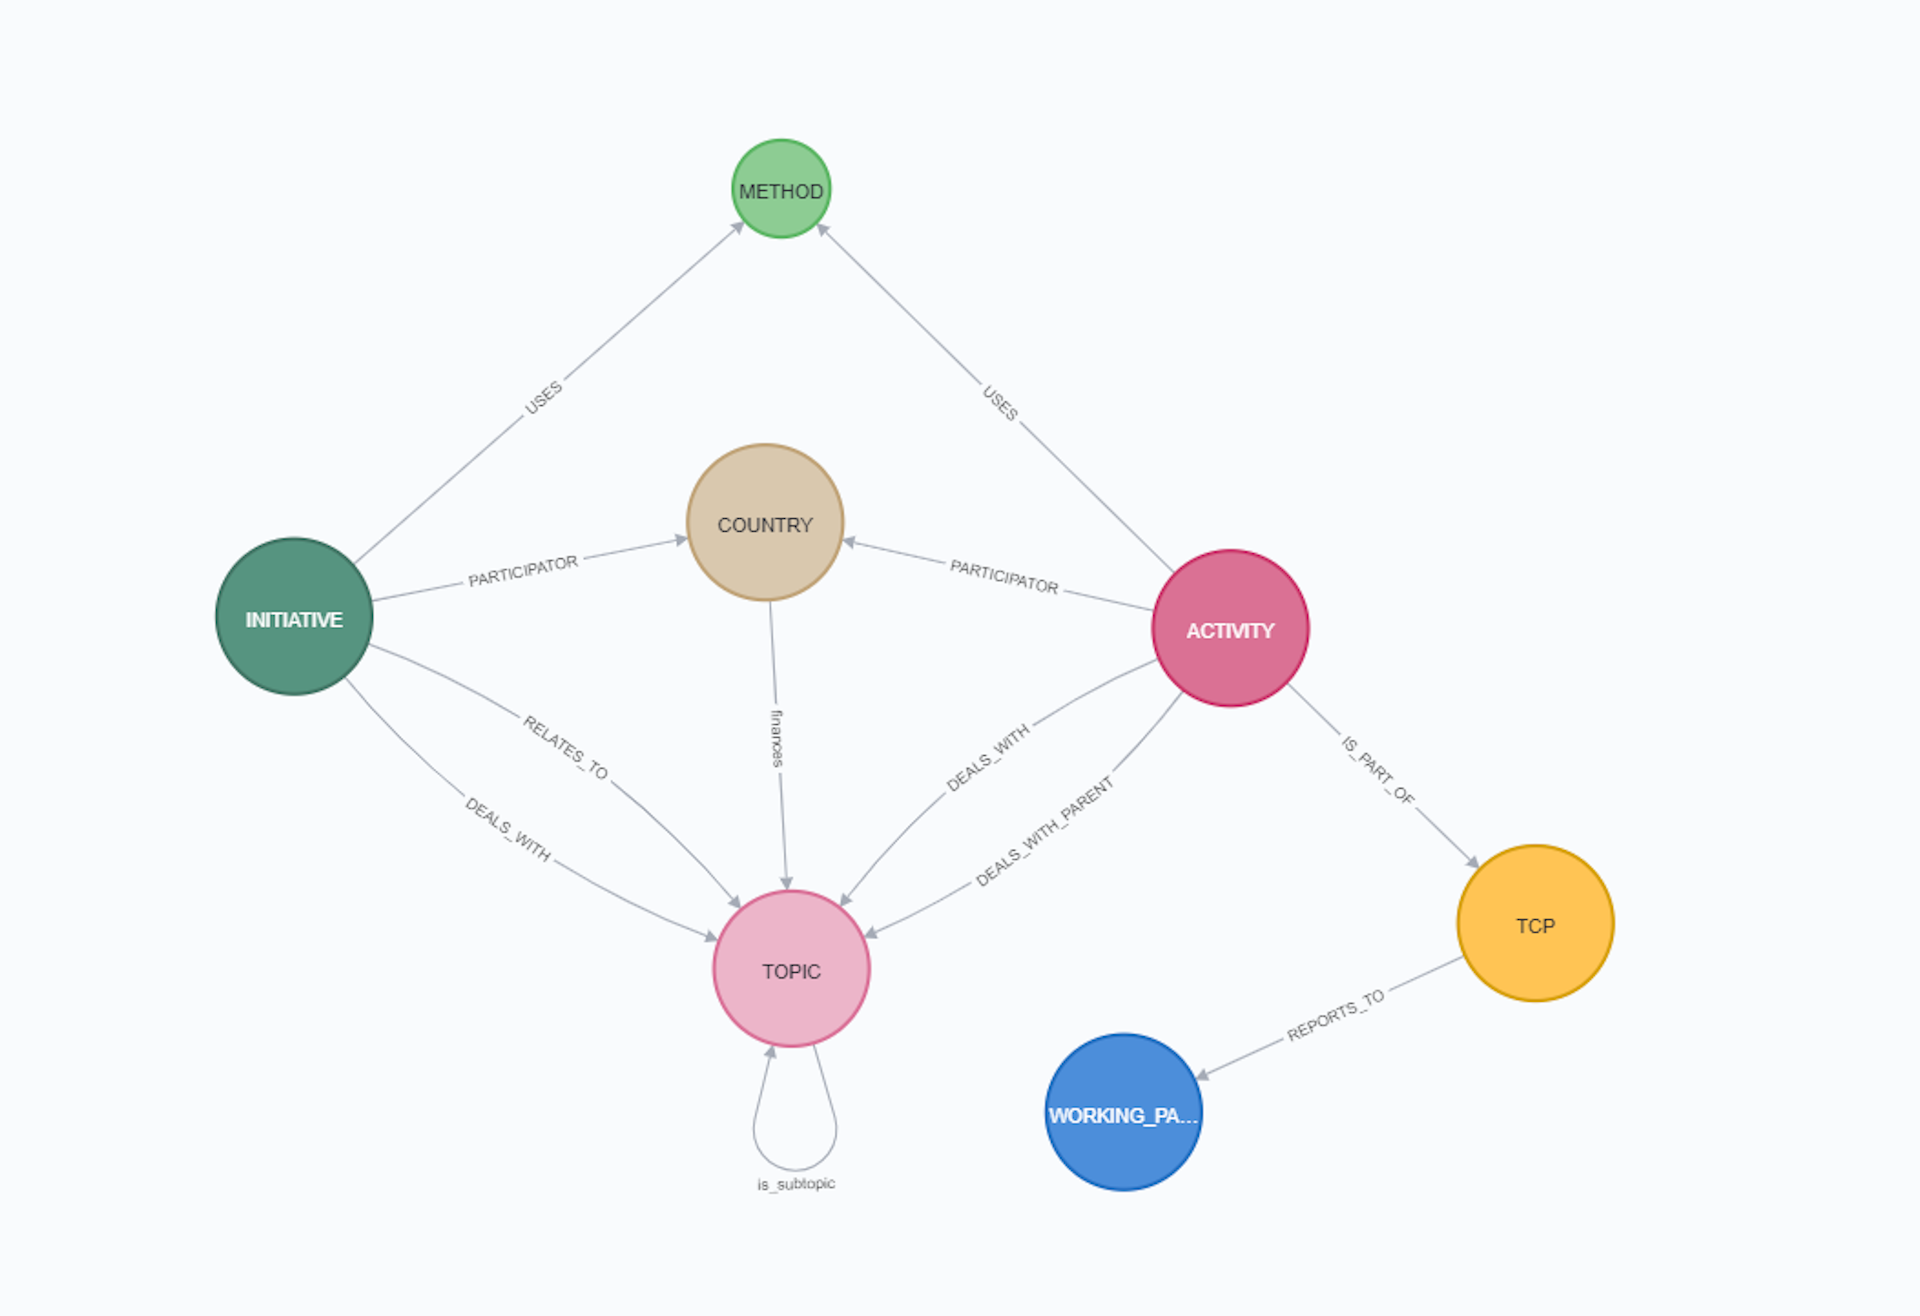
Graph Datastructure
Graphbased datastructure of the open access IEA-TCP dataset.
Copyright: Austrian Energy Agency
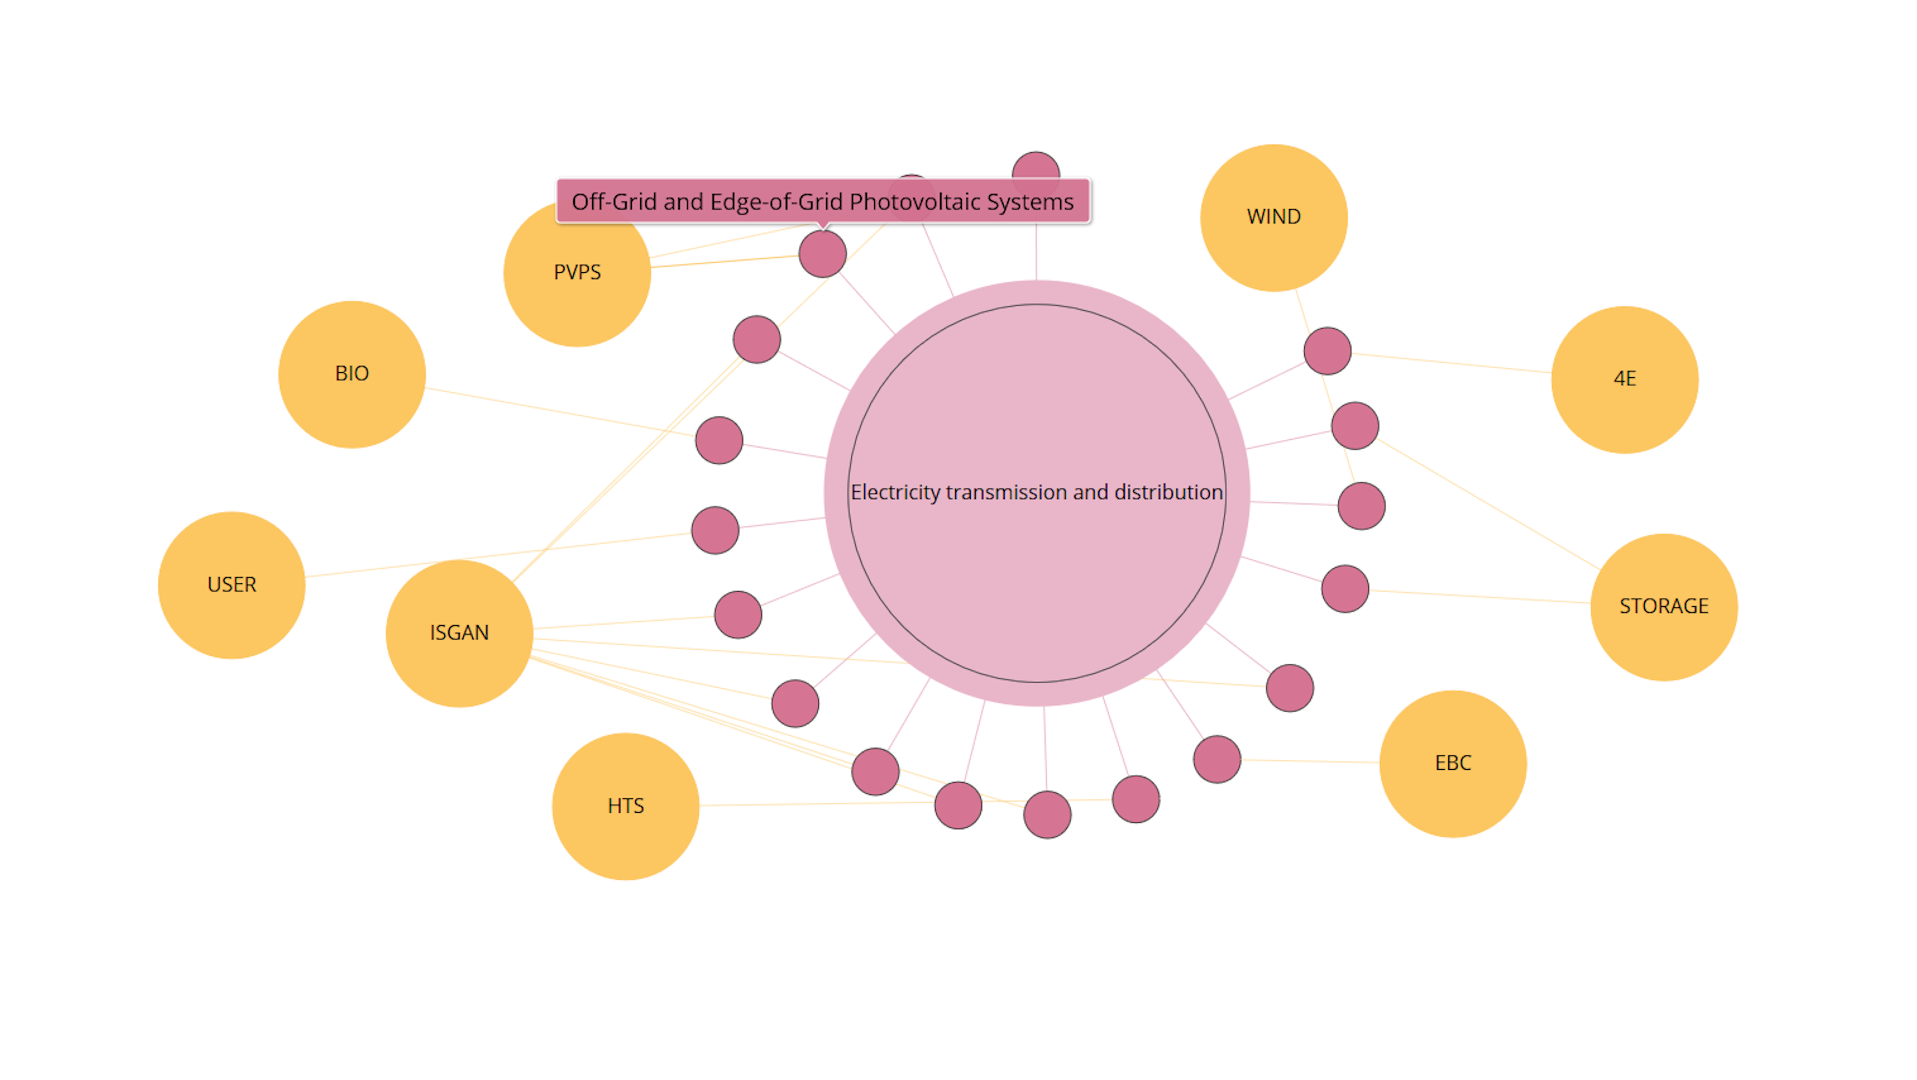
Visualisation of TCPs
After selecting a topic (in this example "Electricity transmission and distribution" was selected), this graph shows all tasks (activities) focussing on the selected topic. The topics are structured according to the IEA energy RD&D budget/expenditure statistics. Additionally, you can see the related Technology Collaboration Programmes (TCPs). Activities which had been ongoing in Summer 2020 from all IEA-TCPs are covered in this analysis. You can re-arrange the different bubbles to better meet the needs of your analysis. If a TCP consists of more than one task (activity), it also contains one entry in the database labelled “ExCo-Activities”. Available at https://nachhaltigwirtschaften.at/en/iea/visualisations/tcps-focussing-on-a-topic.php
Copyright: Austrian Energy Agency
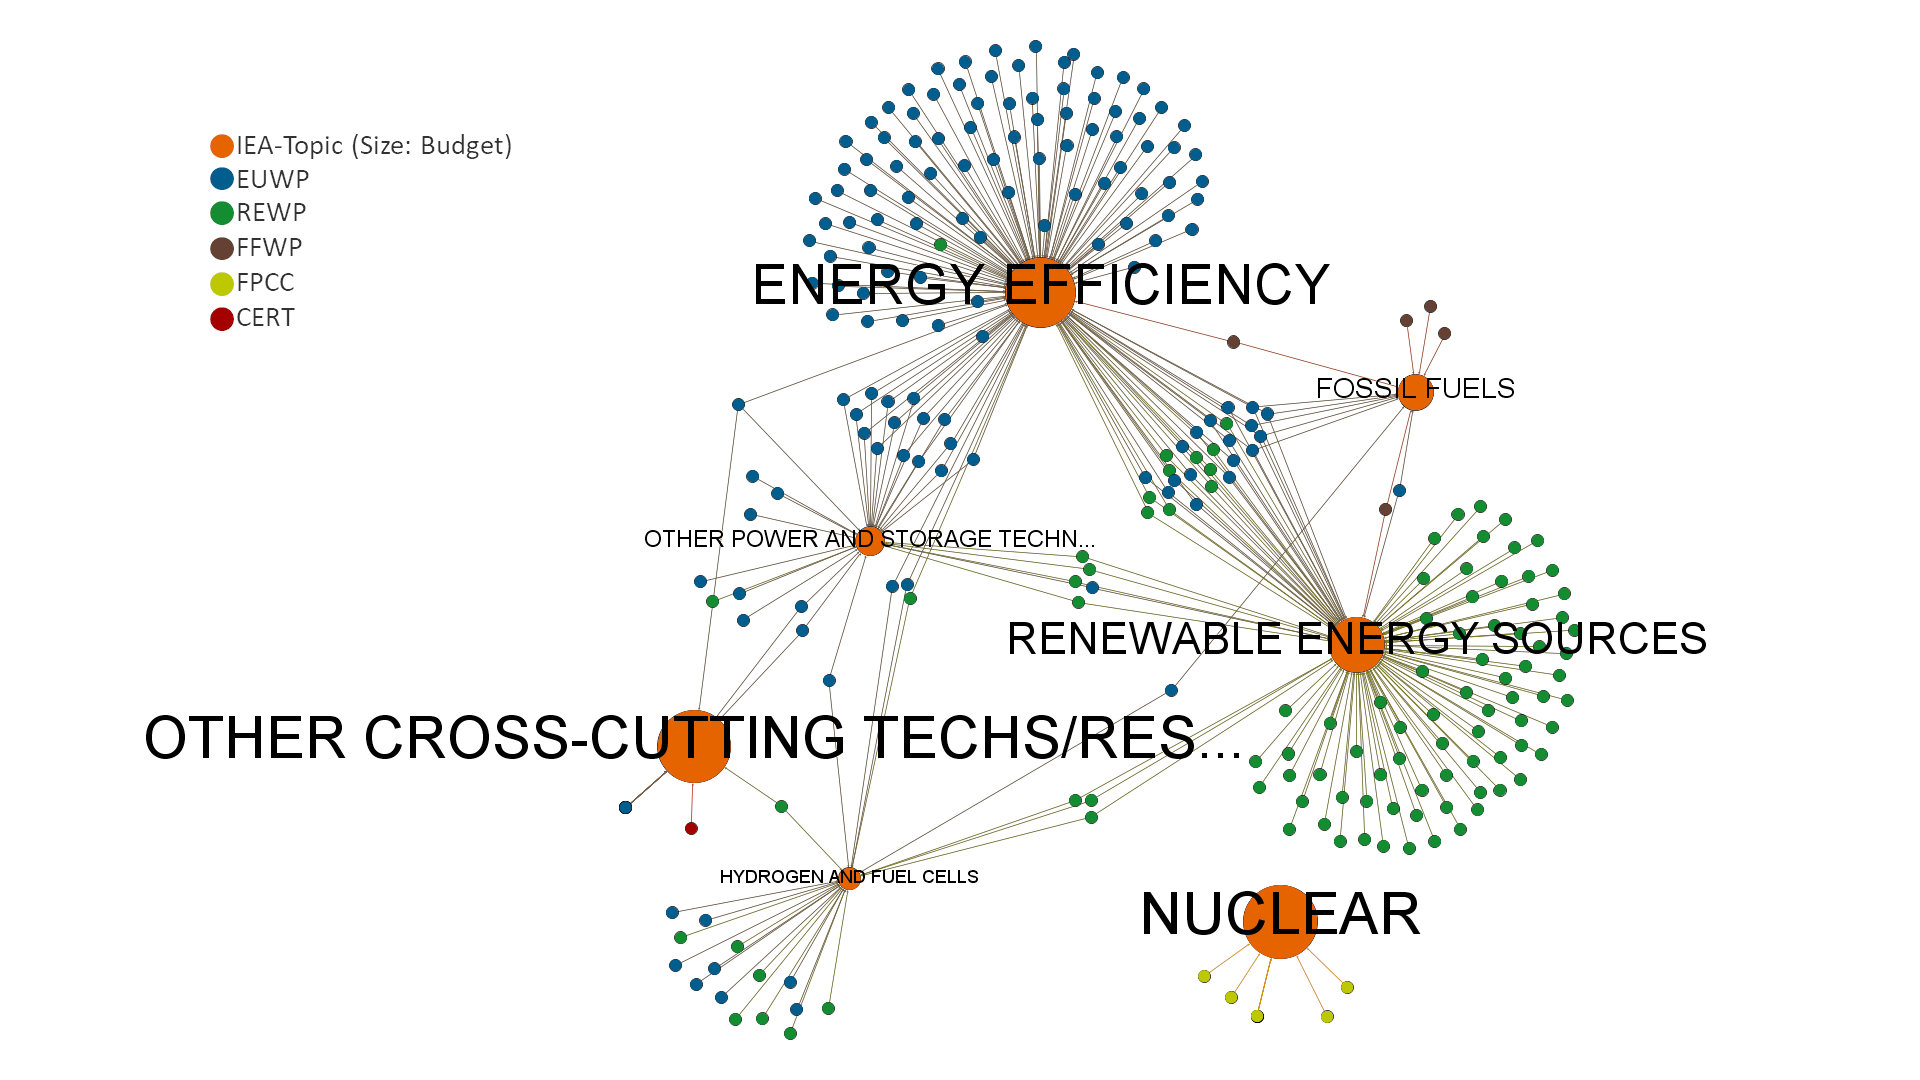
R&D Map
Visualisation of all ongoing Tasks and Annexes ("Activities") and their respective research topics.
Copyright: Austrian Energy Agency
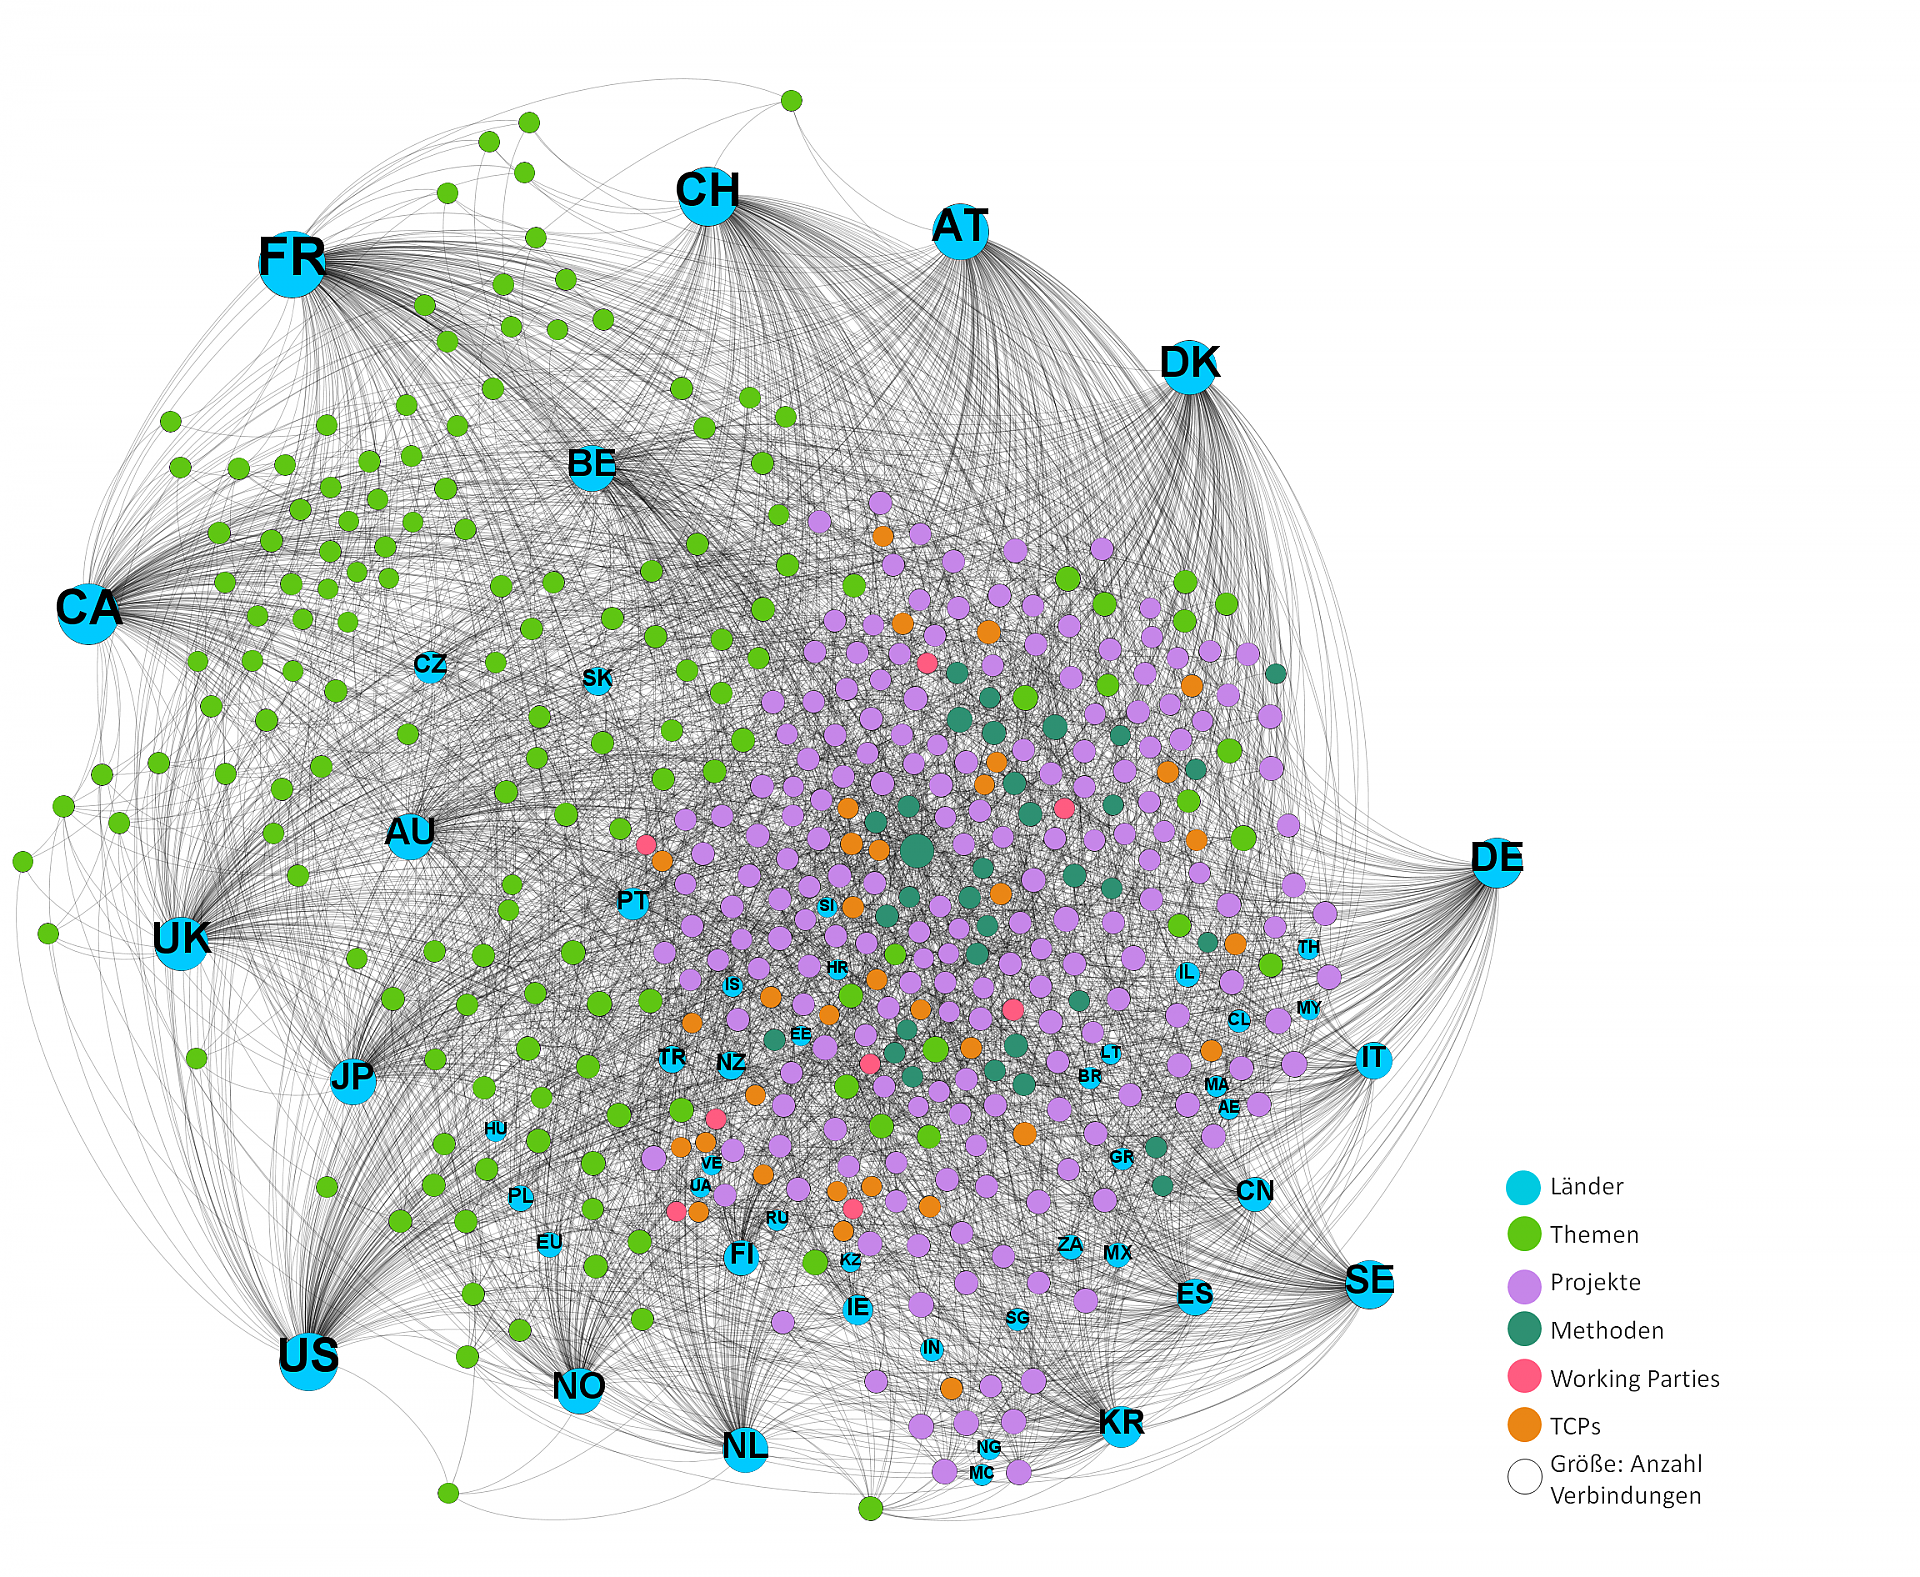
IEA-TCP Graph: Visualization of all nodes and edges in the IEA-TCP data model
Size of the nodes corresponds to the number of connections, color to the type of node (see legend).
Copyright: Österreichische Energieagentur 2018
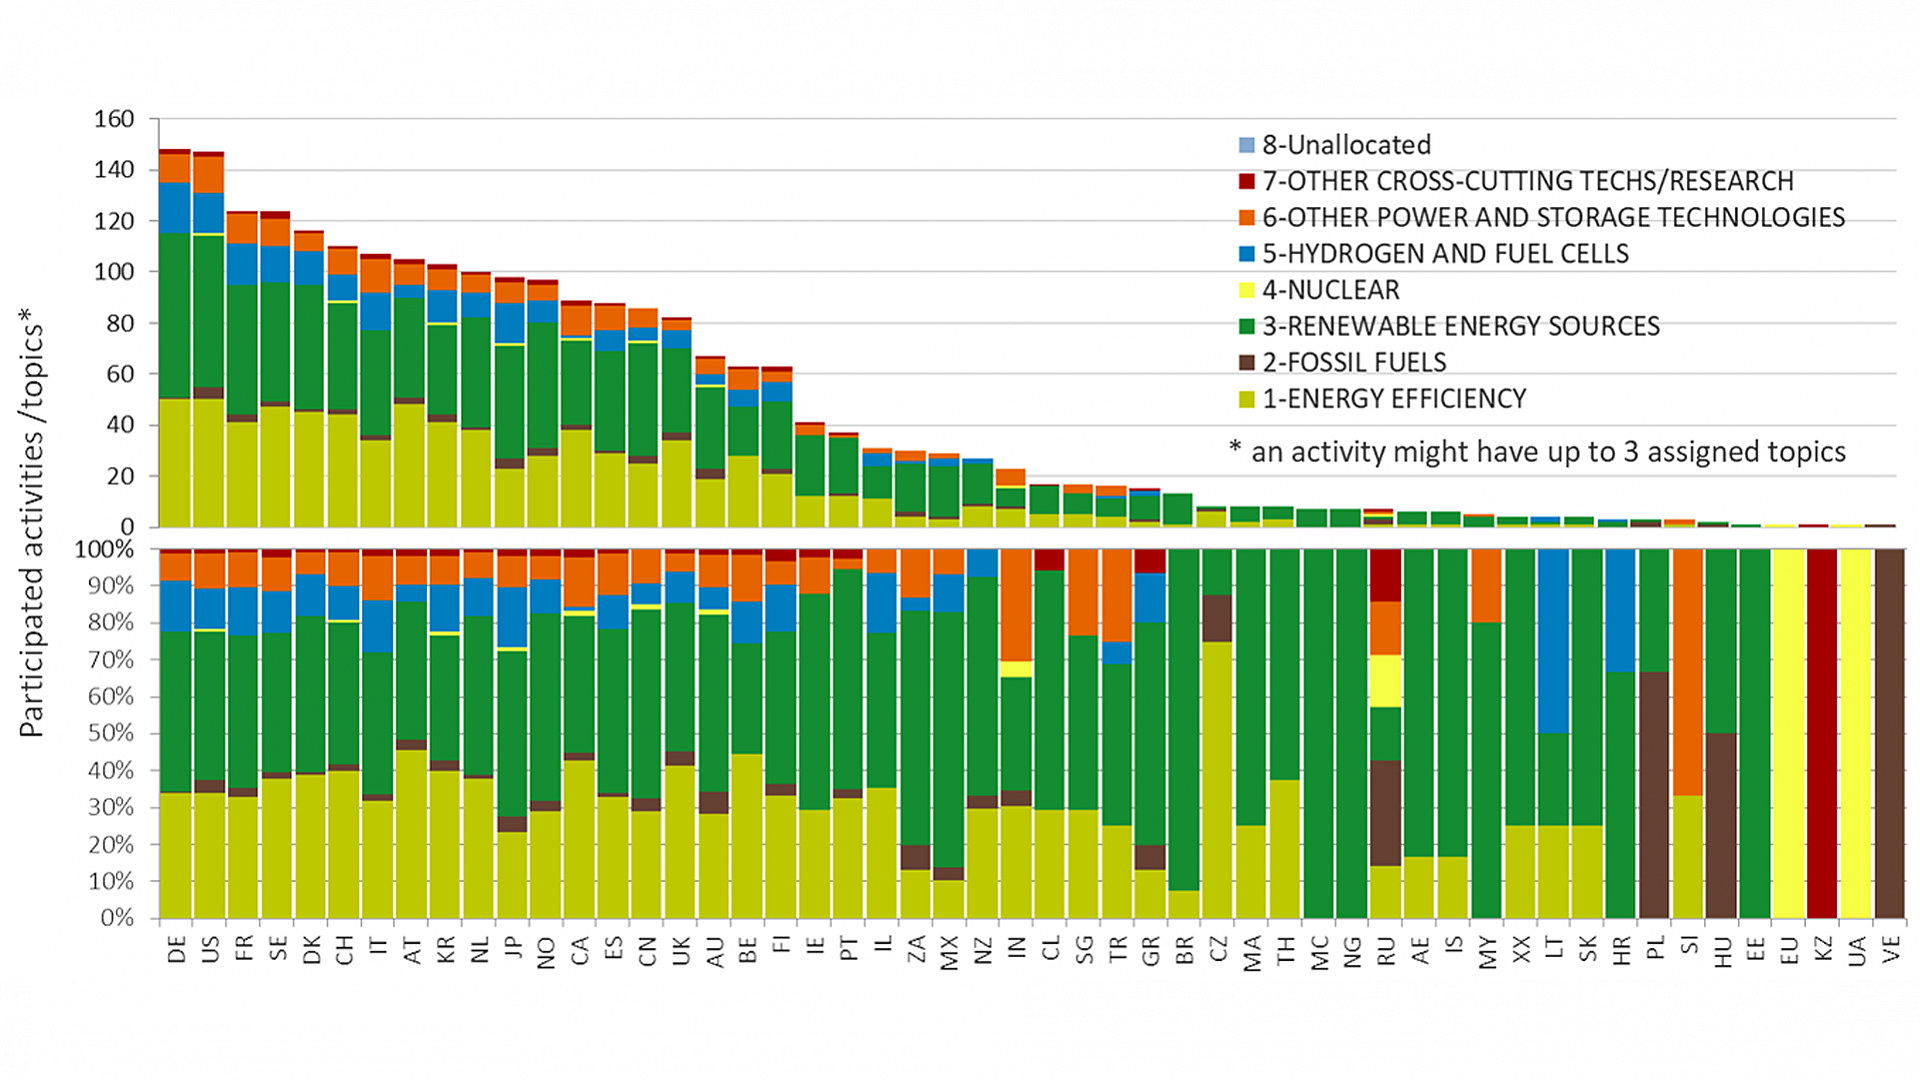
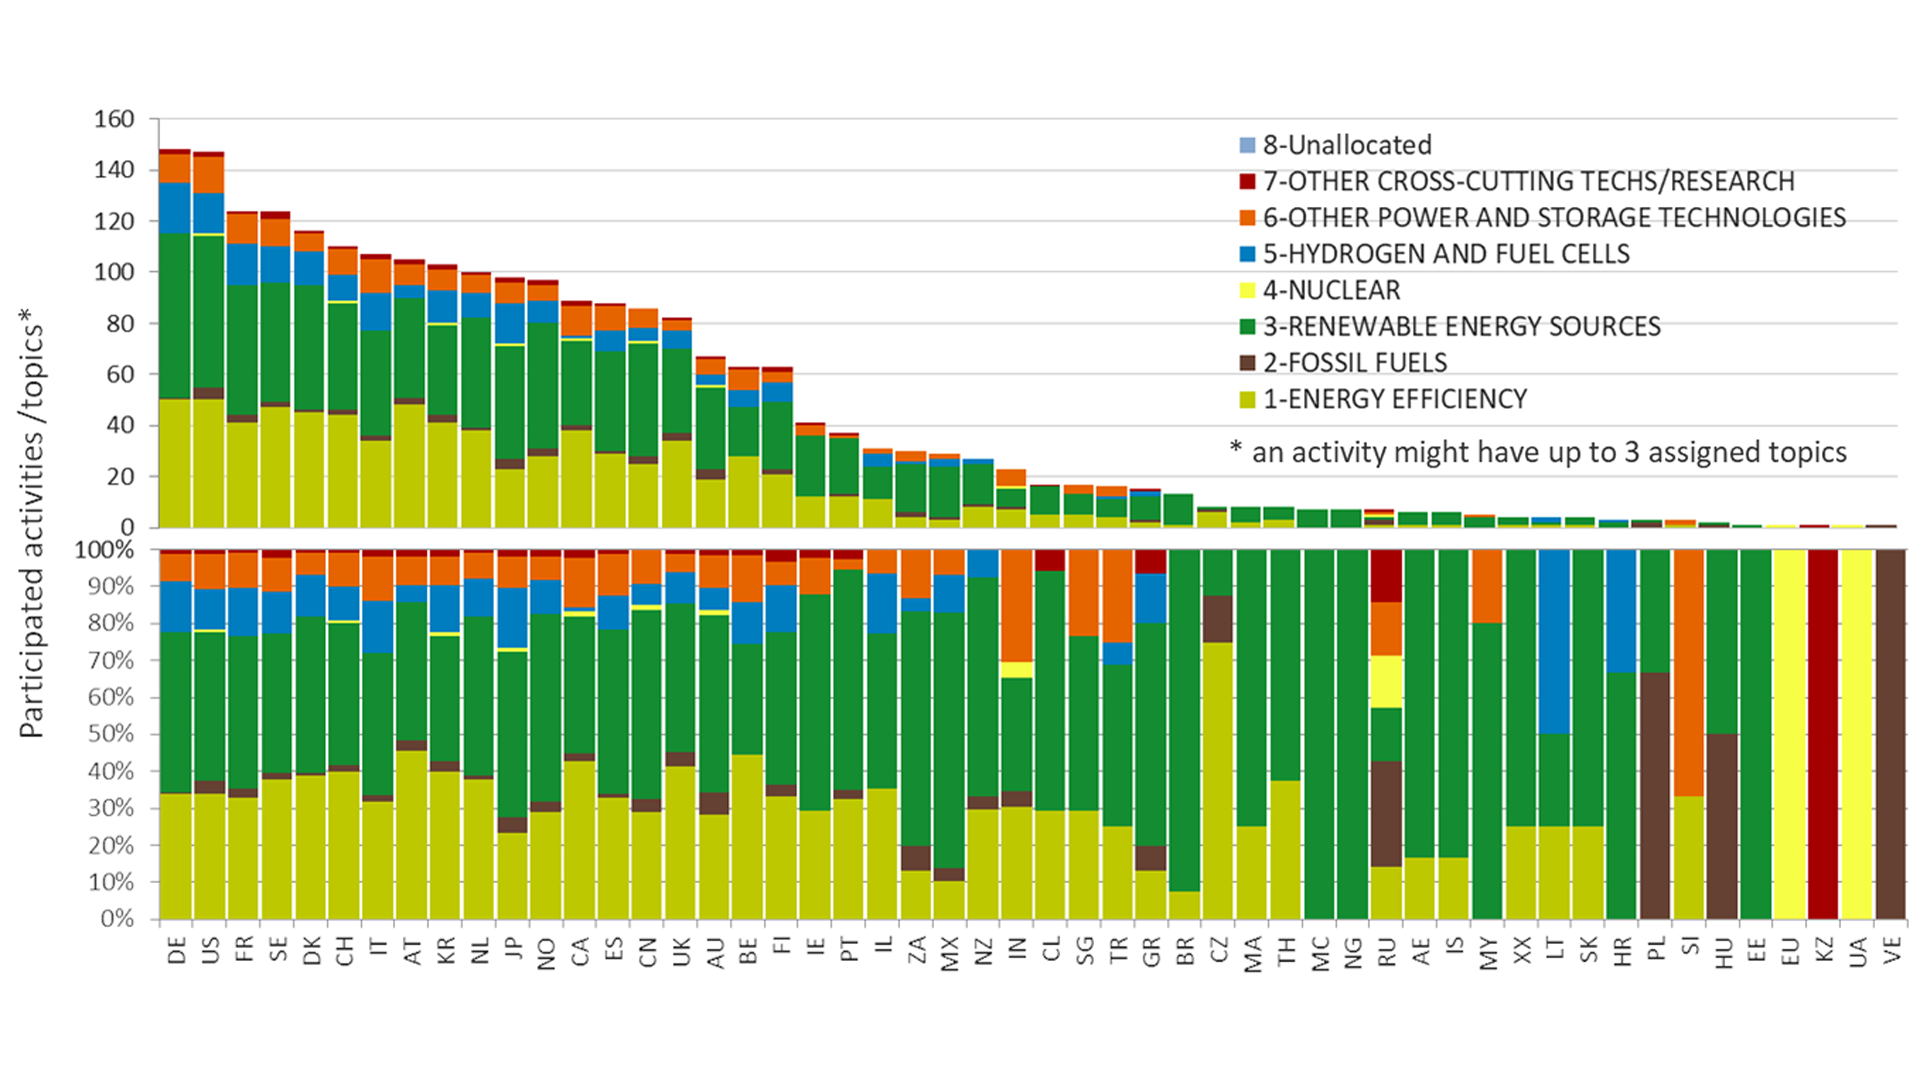
Participation of countries in IEA Technology Collaboration Programmes and Related Research Topics
Absolute (upper chart) and relative (lower chart) number of TCP-activities that countries are participating in. The color code shows how the assigned activities are related to the IEA-Topics and how the countries set their priorities with regard to the research topics (based on the IEA RD&D taxonomy).