Project Image Pool
There are 12 results.
Terms of use: The pictures on this site originate from the projects in the frame of the programmes City of Tomorrow, Building of Tomorrow and the IEA Research Cooperation. They may be used credited for non-commercial purposes under the Creative Commons License Attribution-NonCommercial (CC BY-NC).
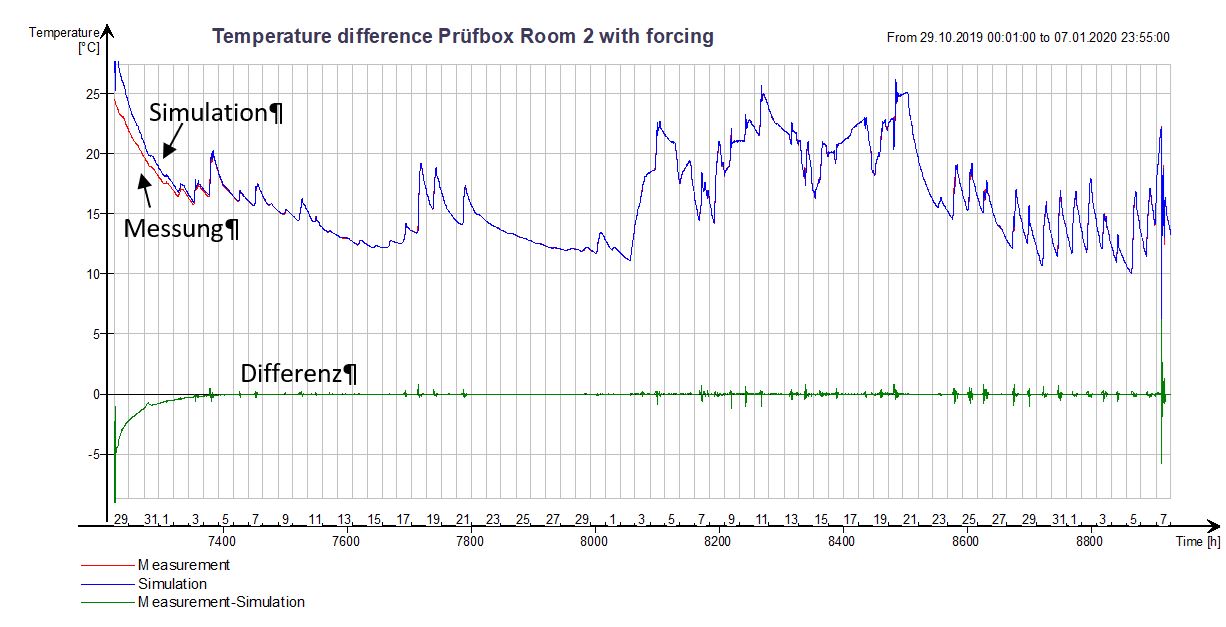
Time series with forcing terms
Time series of an experiment where the digital twin was adapted to the measurement data using forcing terms. At the beginning of the experiment, the measured and simulated temperatures do not yet match. After that, the differences between the two values are very small. See also other image showing the heat sources and sinks needed for this.
Copyright: EQUA
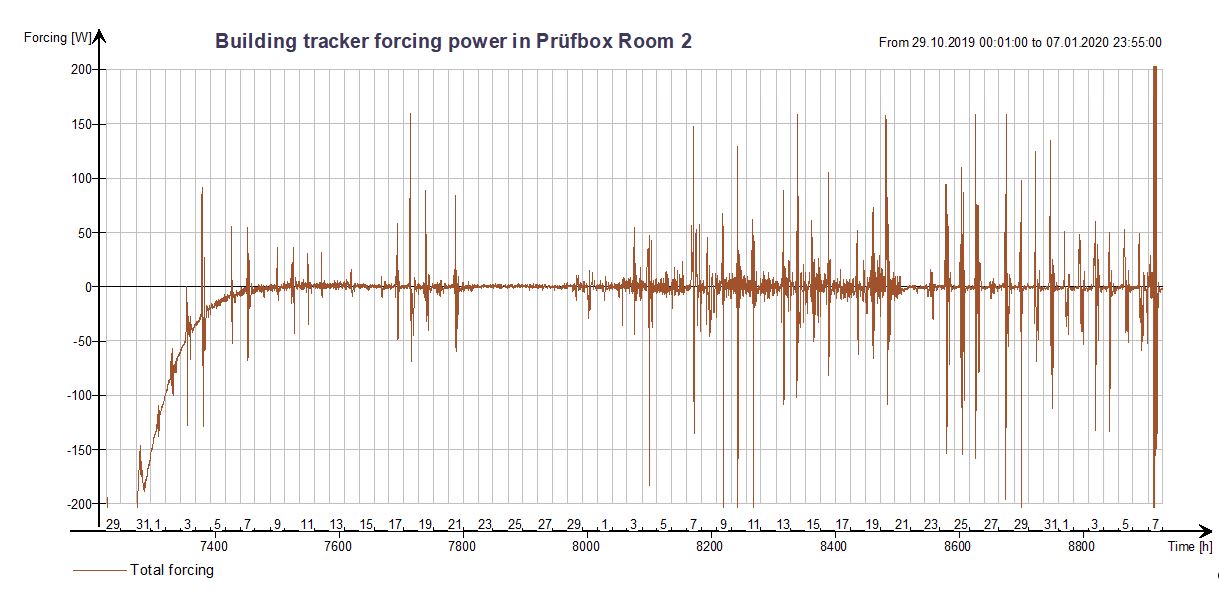
Calculated heat sources and sinks for the digital twin
Time series of an experiment where the digital twin was fitted to the measurement data using forcing terms. The graphic shows the required "Forcing Terms" = heat sources and sinks. See also the other graph with the associated measured and simulated temperatures during the experiment.
Copyright: EQUA

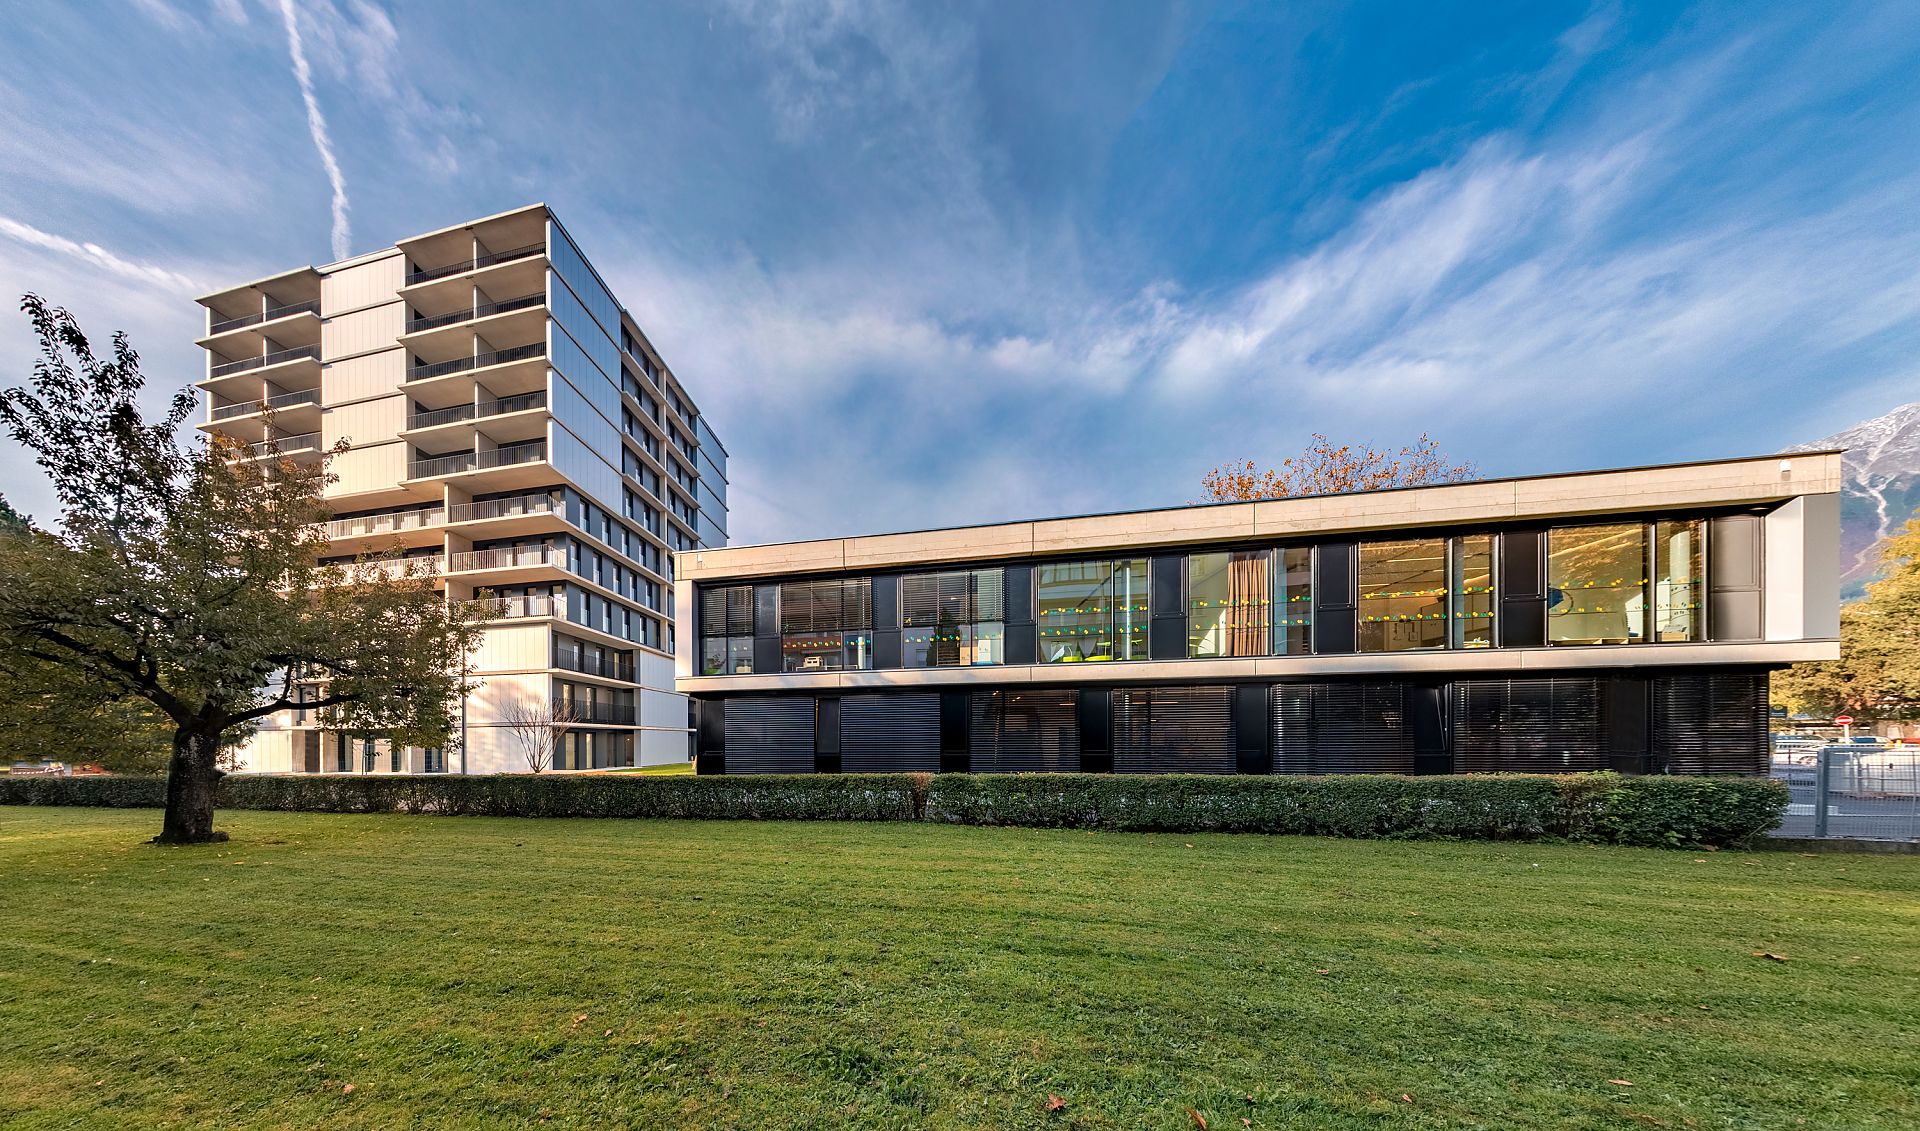
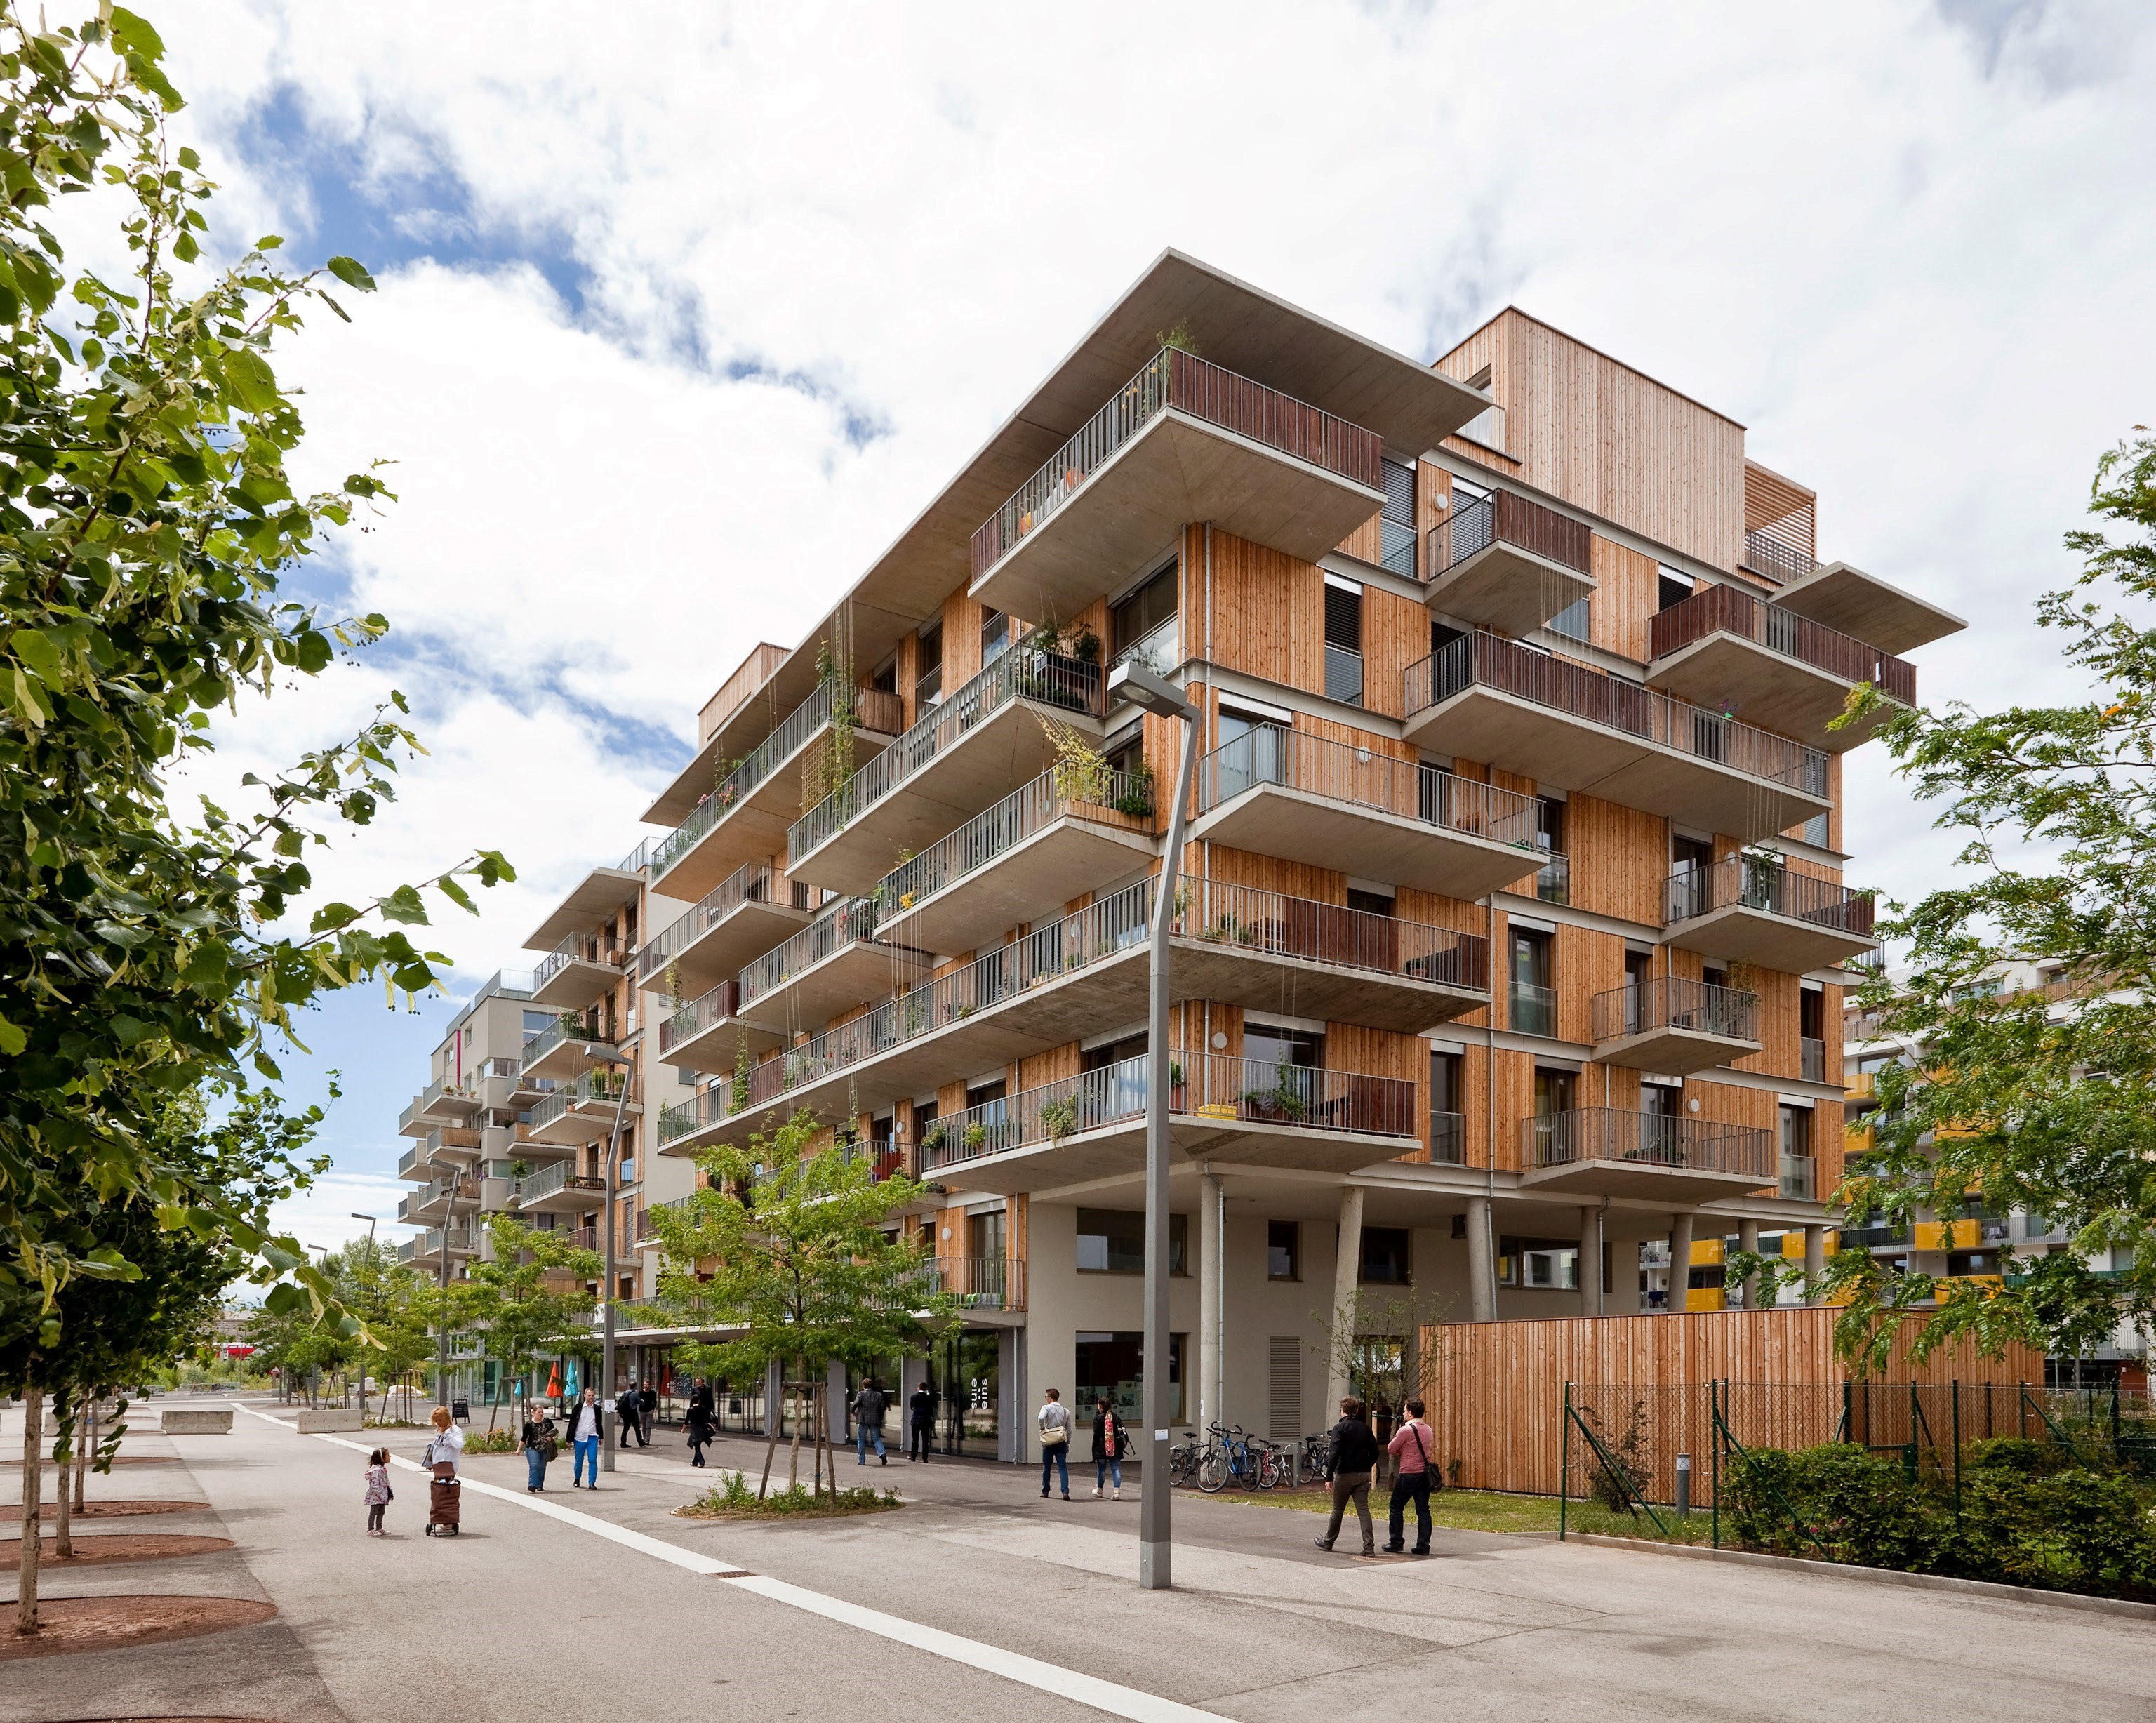
residential building St. Paulus
residential building St. Paulus
Copyright: NEUE HEIMAT TIROL Gemeinnützige WohnungsGmbH
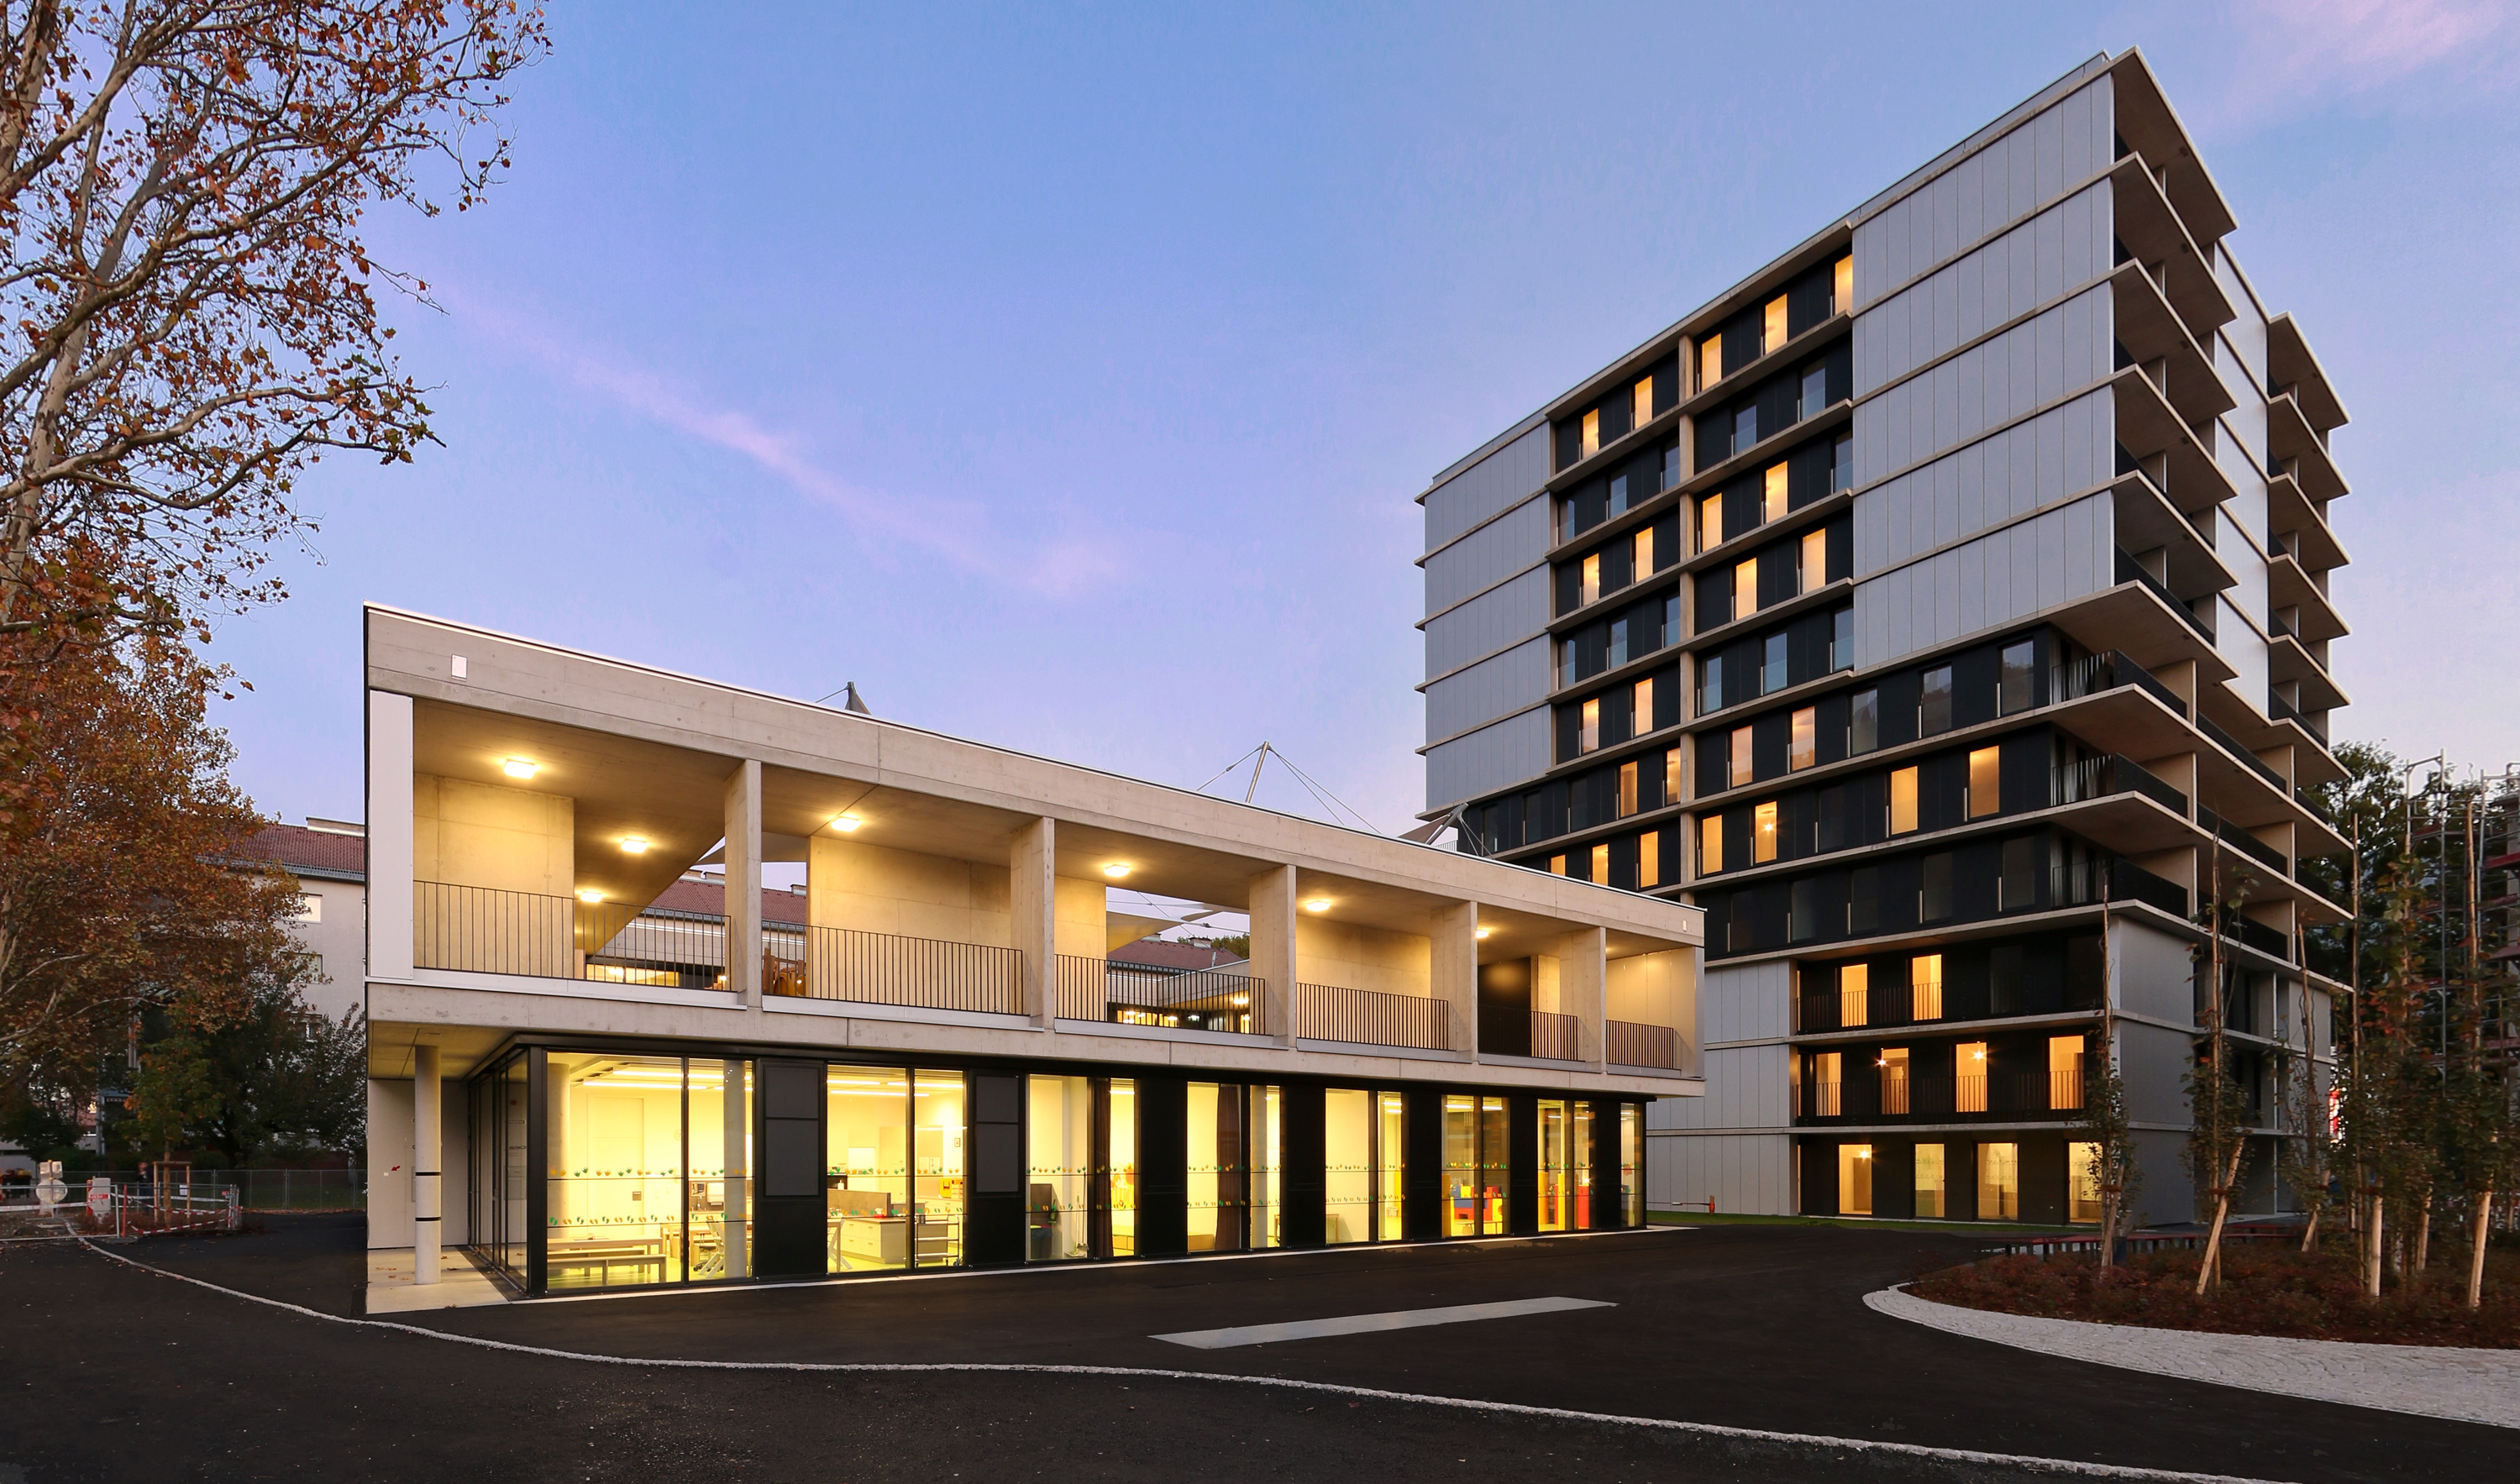
residential building St. Paulus, northeast view
residential building St. Paulus, northeast view
Copyright: NEUE HEIMAT TIROL Gemeinnützige WohnungsGmbH

residential building St. Paulus, northwest view
residential building St. Paulus, northwest view
Copyright: NEUE HEIMAT TIROL Gemeinnützige WohnungsGmbH

Façade office building H2
View of the facade of the H2 office building in Vienna, where a digital twin of a cooling system and a model floor was tested.
Copyright: AEE INTEC
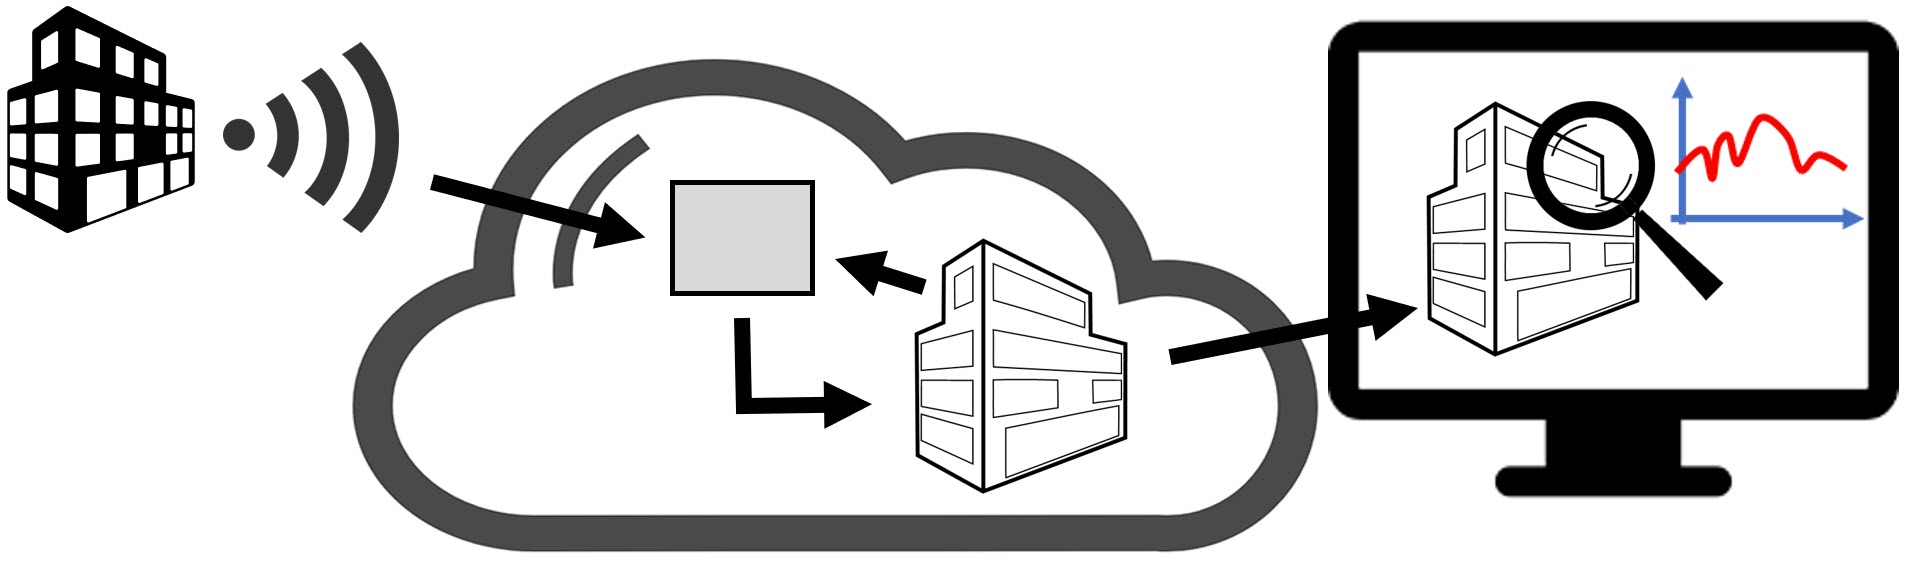
Graphic representation of a digital twin
Graphic representation of a digital twin connected to real-time metering data from a building. The digital twin runs in a cloud. With the so-called State Estimator, the simulation model is continuously adapted to the current measurement data from the building.
Copyright: EQUA

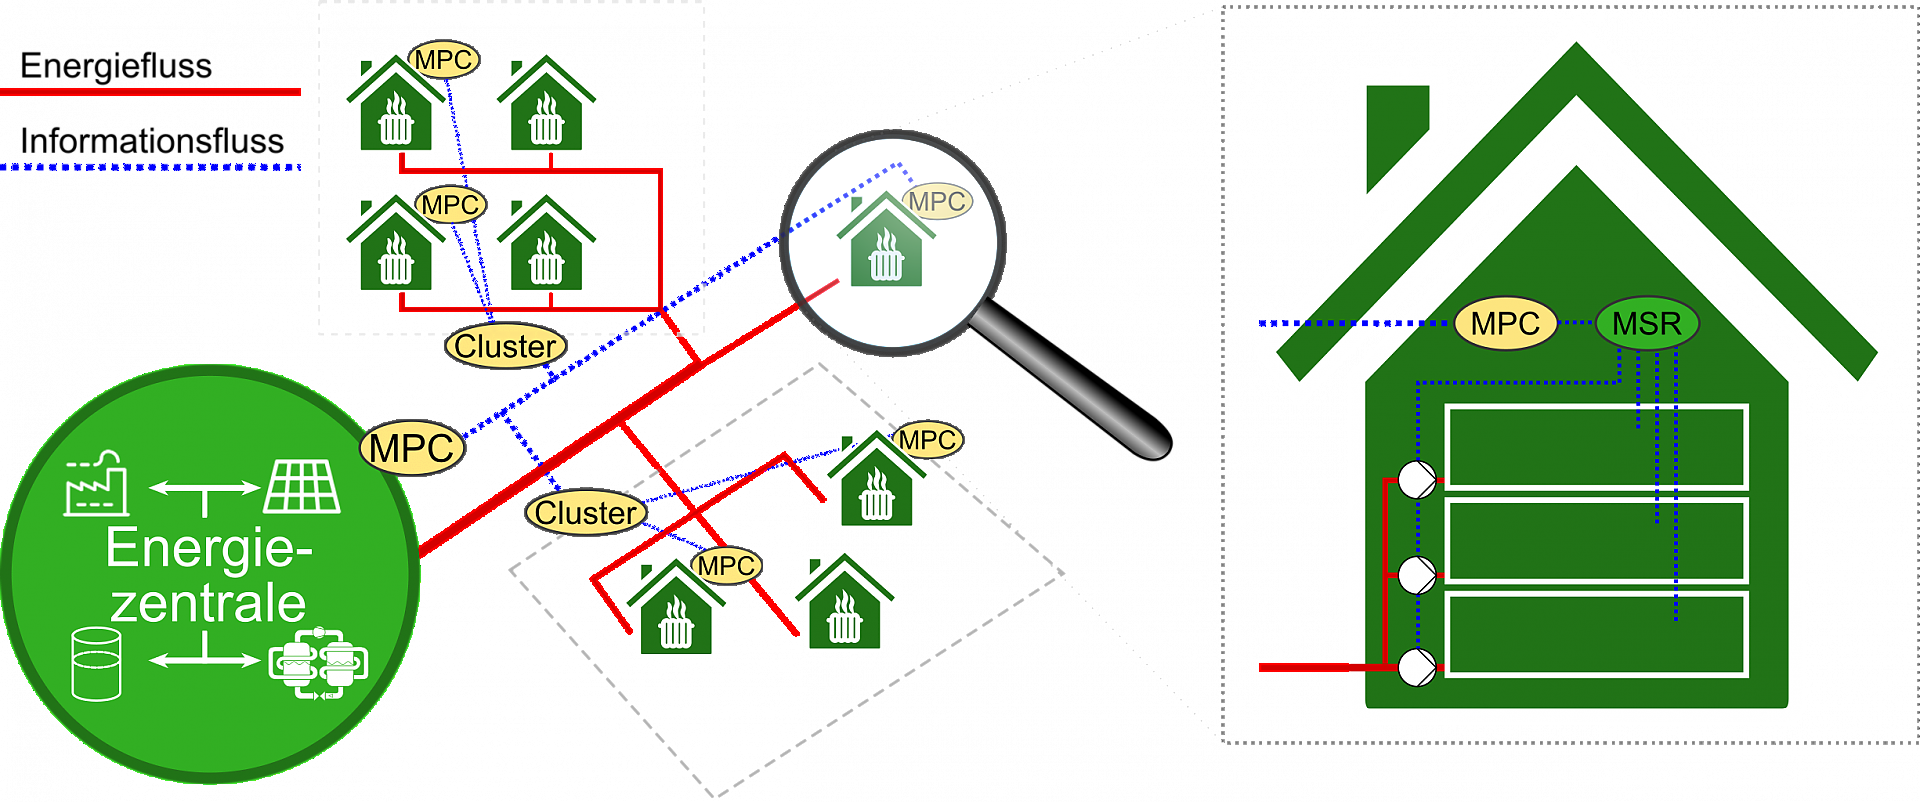
Superordinate structure of the energy hub
Proposed structure of the interaction between individual building control units and the controller of the energy hub. The controllers used are predictive, optimizing controllers (e.g. model predictive controllers, MPC).
Copyright: BEST - Bioenergy and Sustainable Technologies GmbH
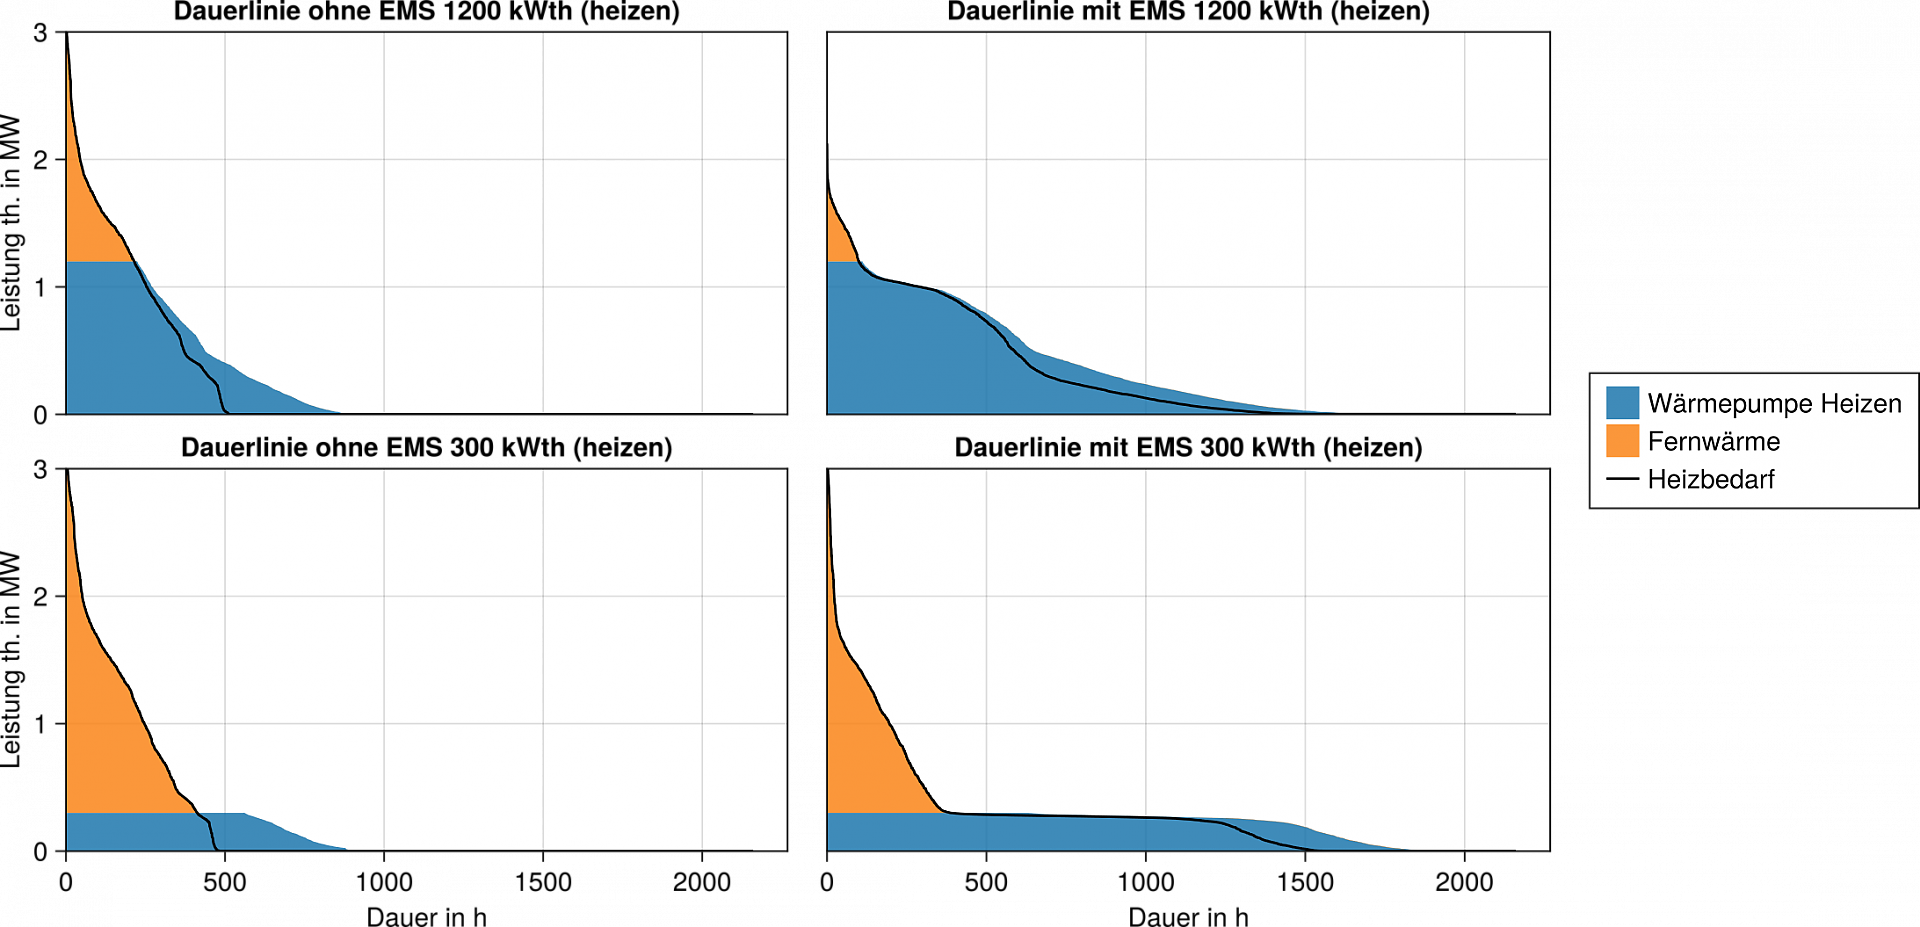
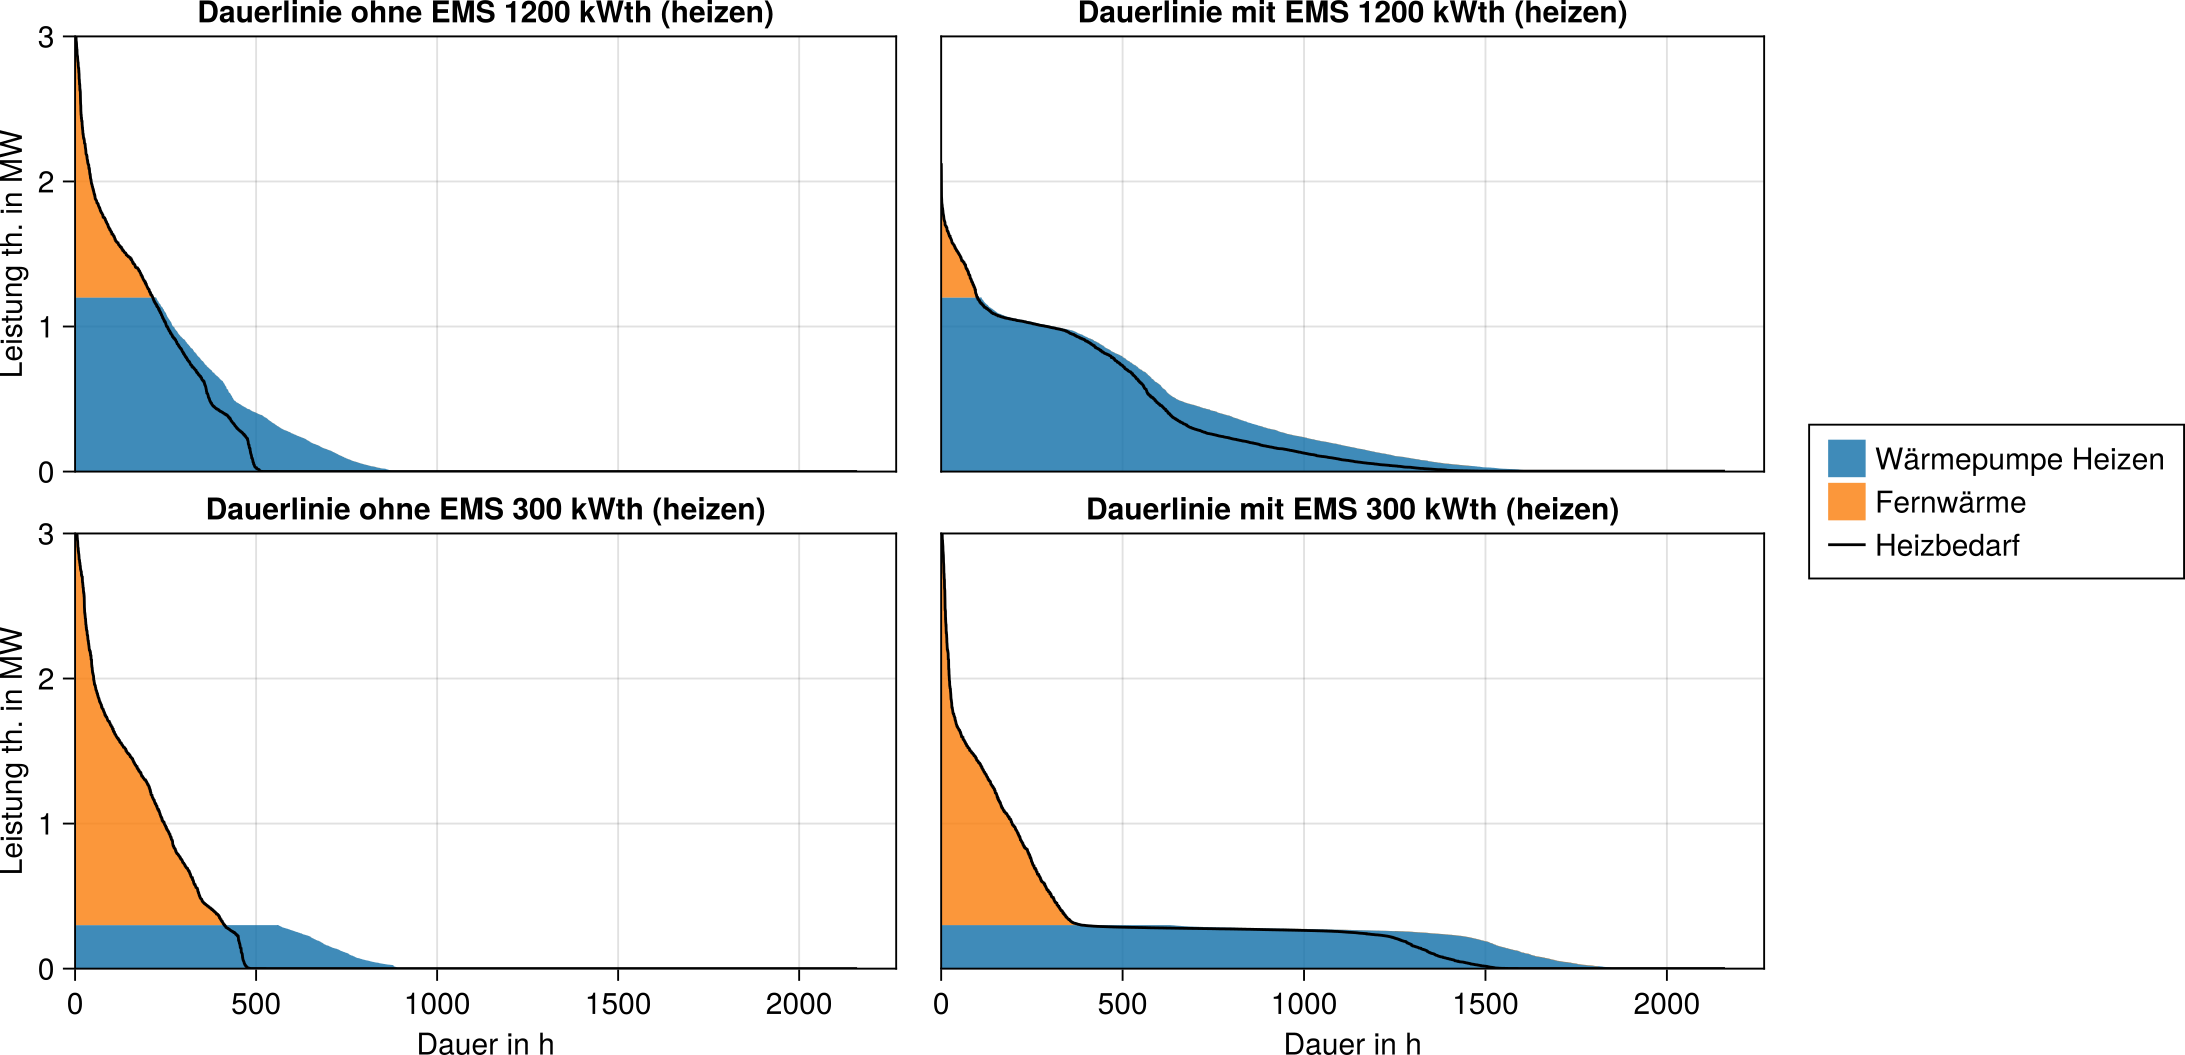
Load shifting potential with EMS
Continuous lines for the first quarter (heating demand) with component activation. With EMS (right), higher outputs are in principle demanded less frequently. Since all power above the maximum power of the heat pump has to be provided by the more expensive district heating, costs can be reduced. The blue area above the heating demand curve represents waste heat from the heat pump, since cooling demand also occurs in the first quarter, which must be provided by the heat pump / chiller.
Copyright: BEST - Bioenergy and Sustainable Technologies GmbH
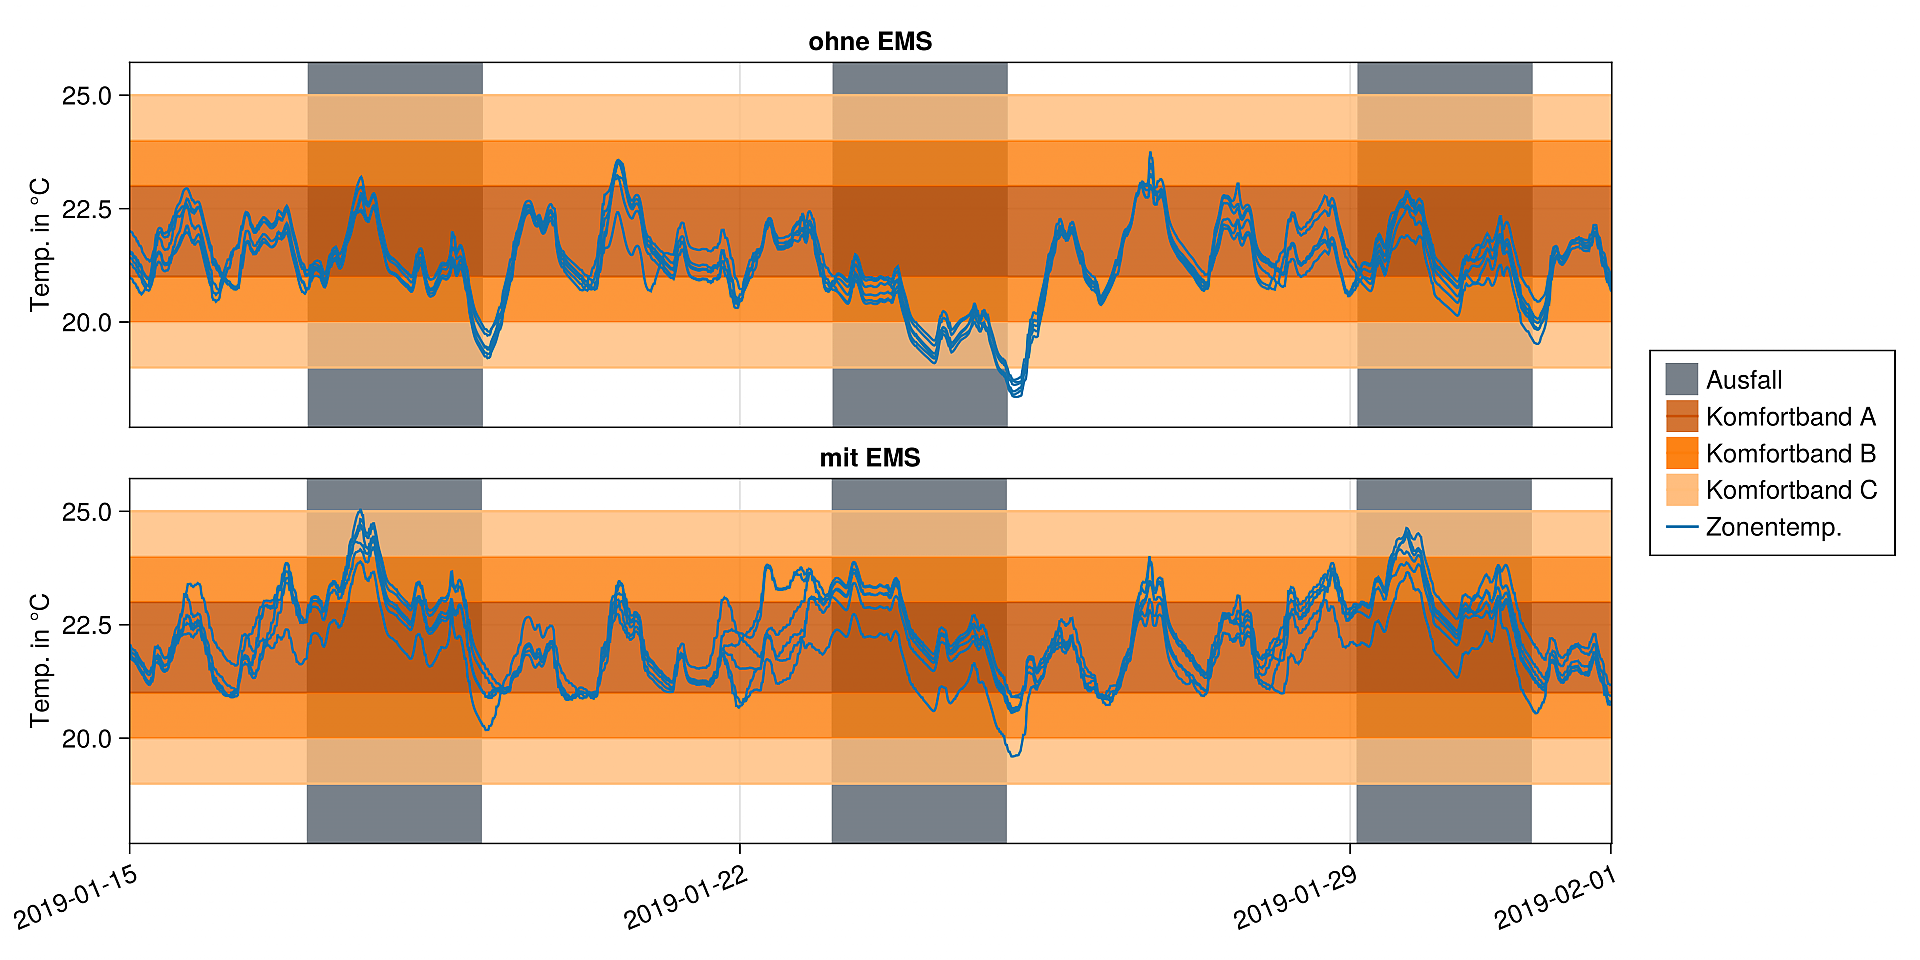
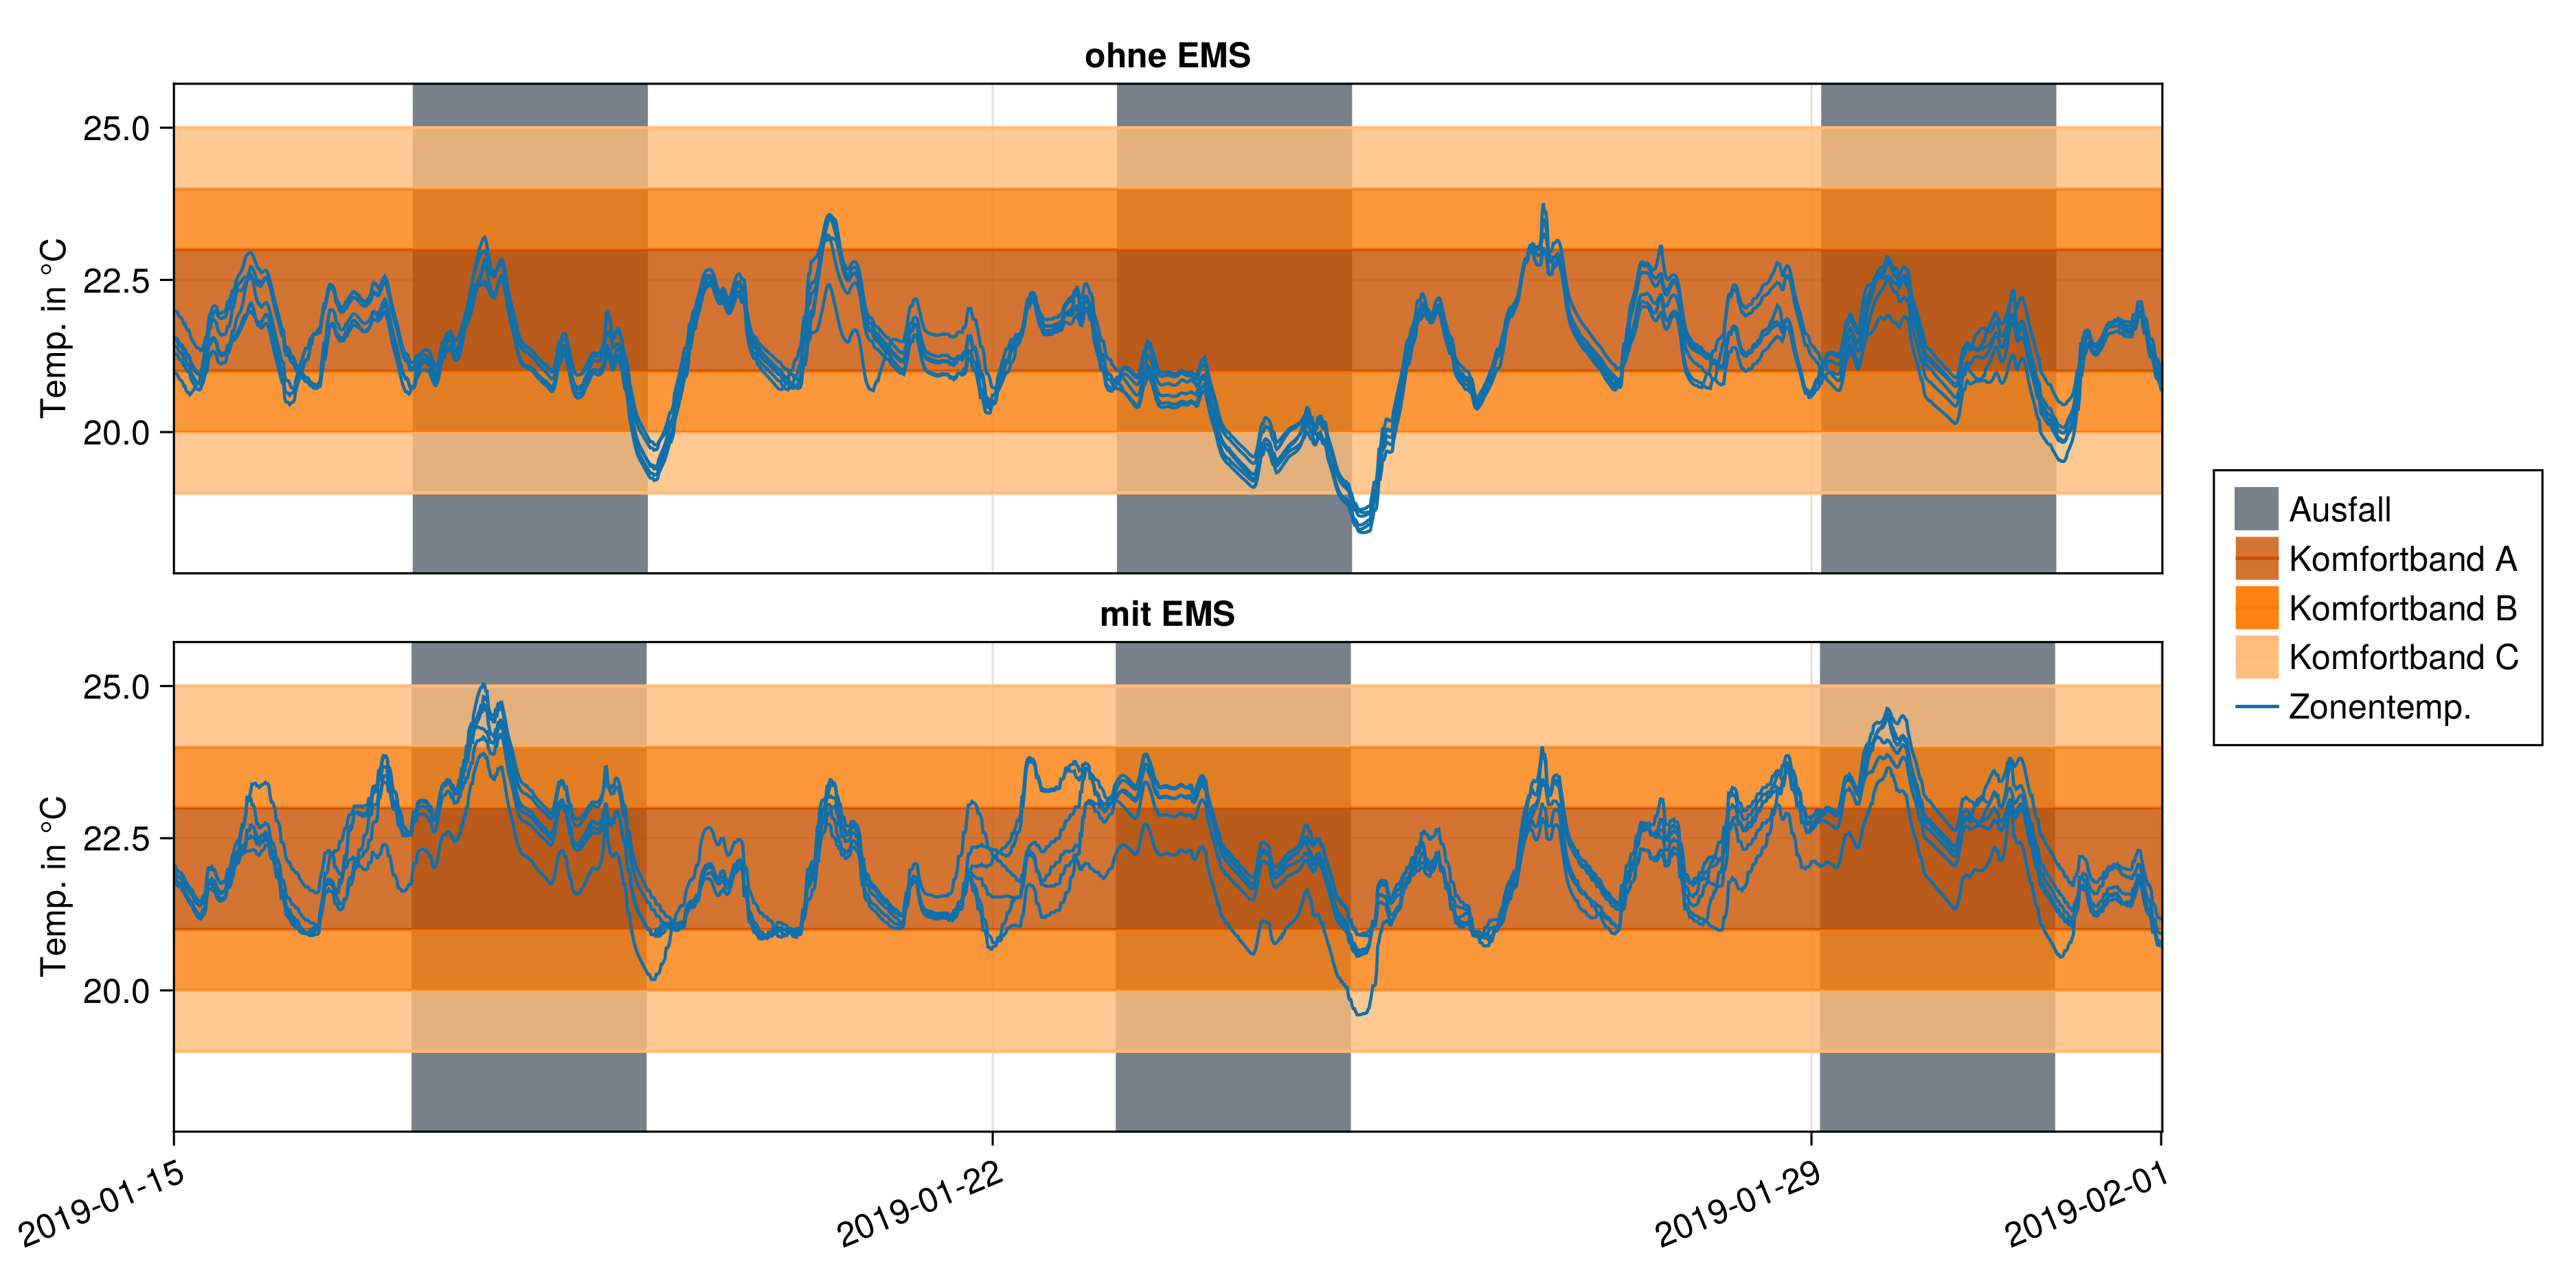
Simulation: failure of the heating circuit pump
Comparison of a standard control and an EMS that is informed of an impending failure of the heating circuit pump. The EMS preheats accordingly to prevent undercooling. Conversely, however, the comfort limits are sometimes exceeded in the other direction, i.e. a slight overheating, because the time constants are correspondingly long.
Copyright: BEST - Bioenergy and Sustainable Technologies GmbH
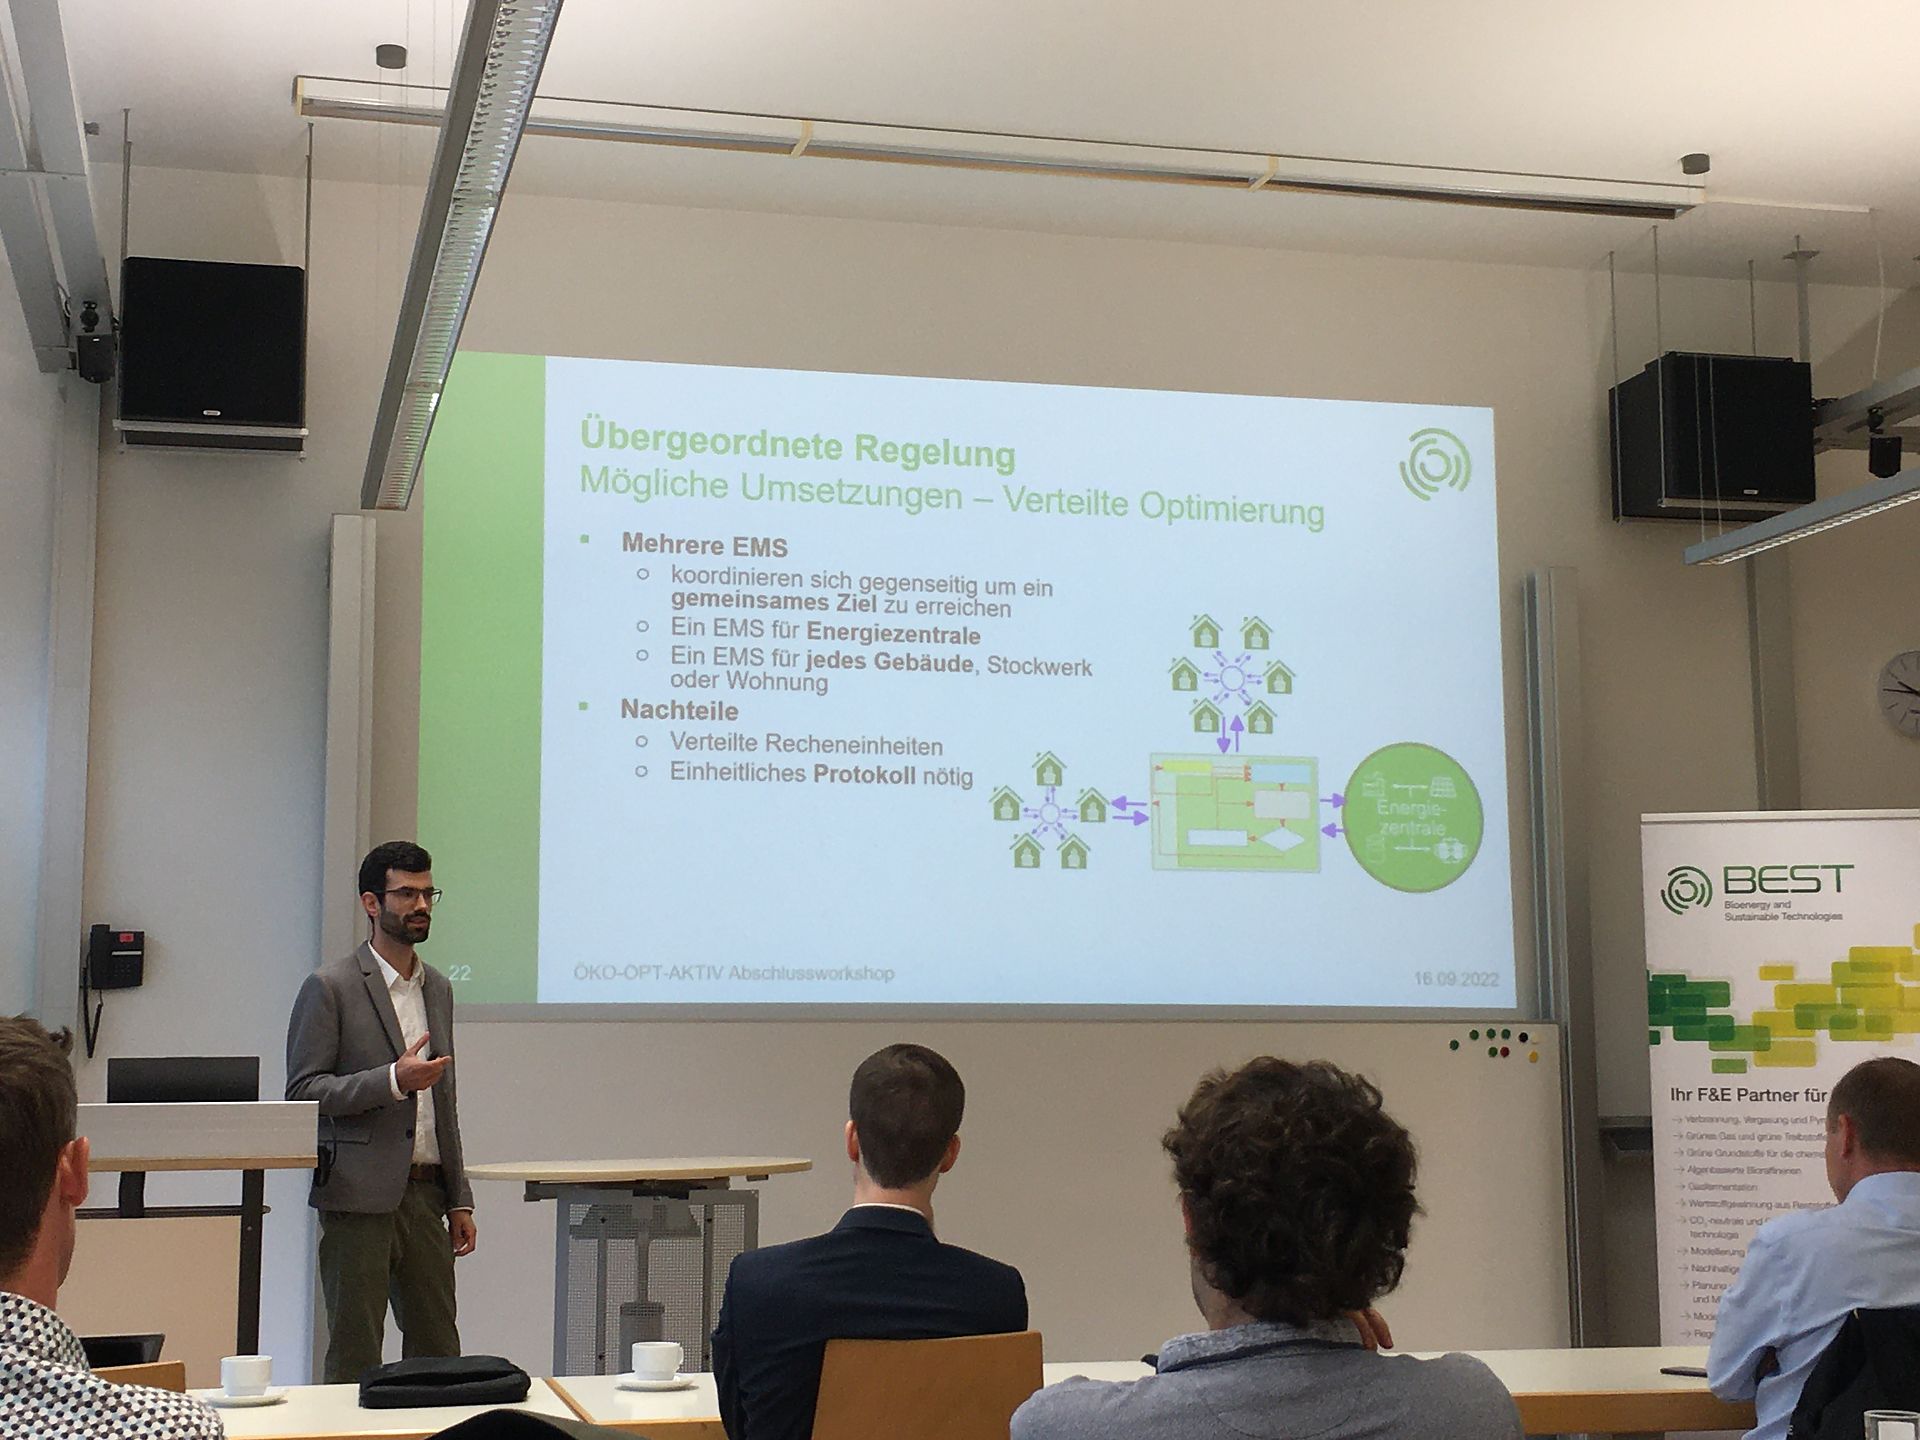
Final workshop ÖKO-OPT-AKTIV
Presentation of Valentin Kaisermayer about the results of the project ÖKO-OPT-AKTIV