Project Image Pool
There are 37 results.
Terms of use: The pictures on this site originate from the projects in the frame of the programmes City of Tomorrow, Building of Tomorrow and the IEA Research Cooperation. They may be used credited for non-commercial purposes under the Creative Commons License Attribution-NonCommercial (CC BY-NC).
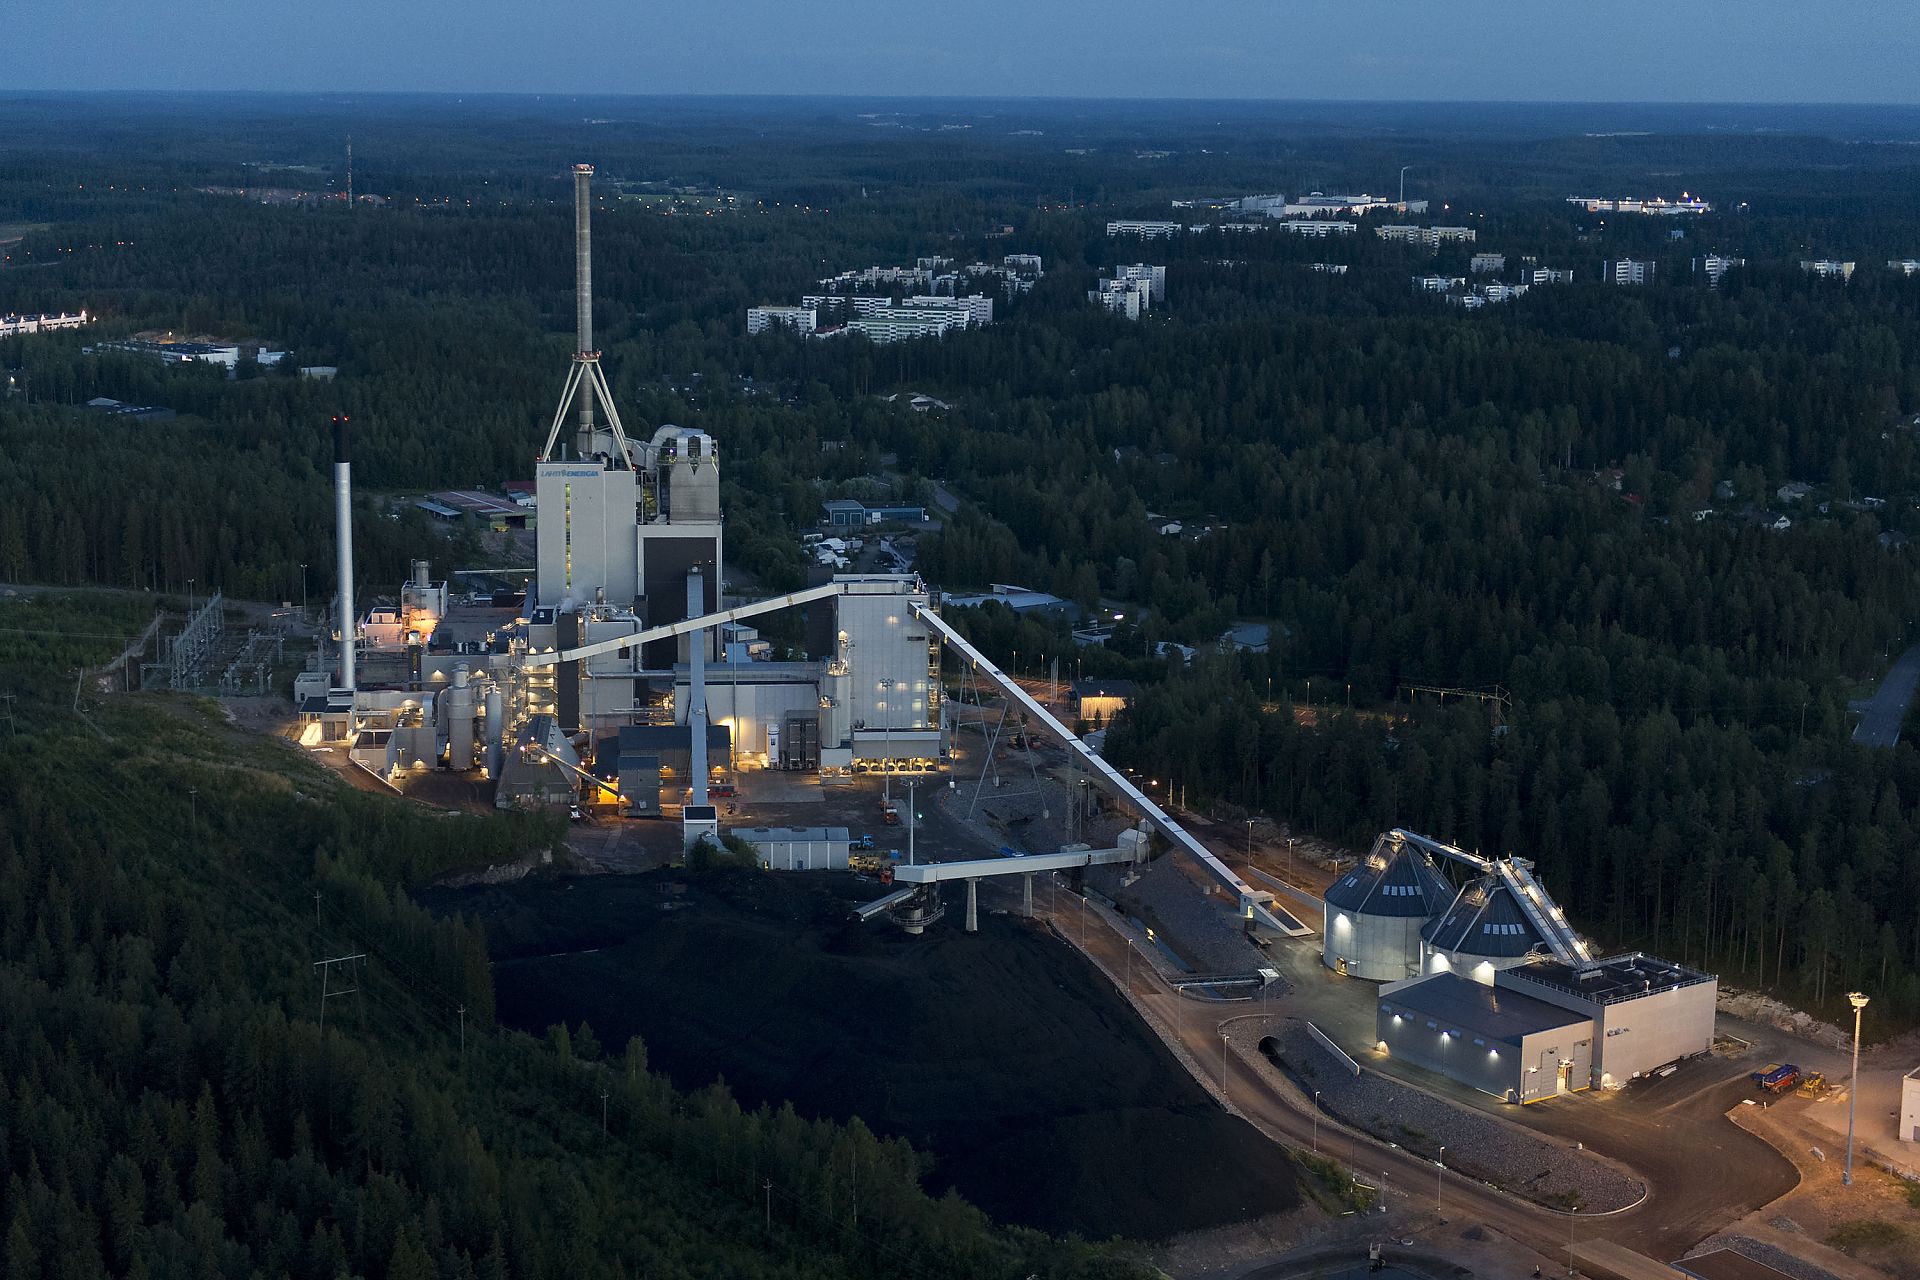
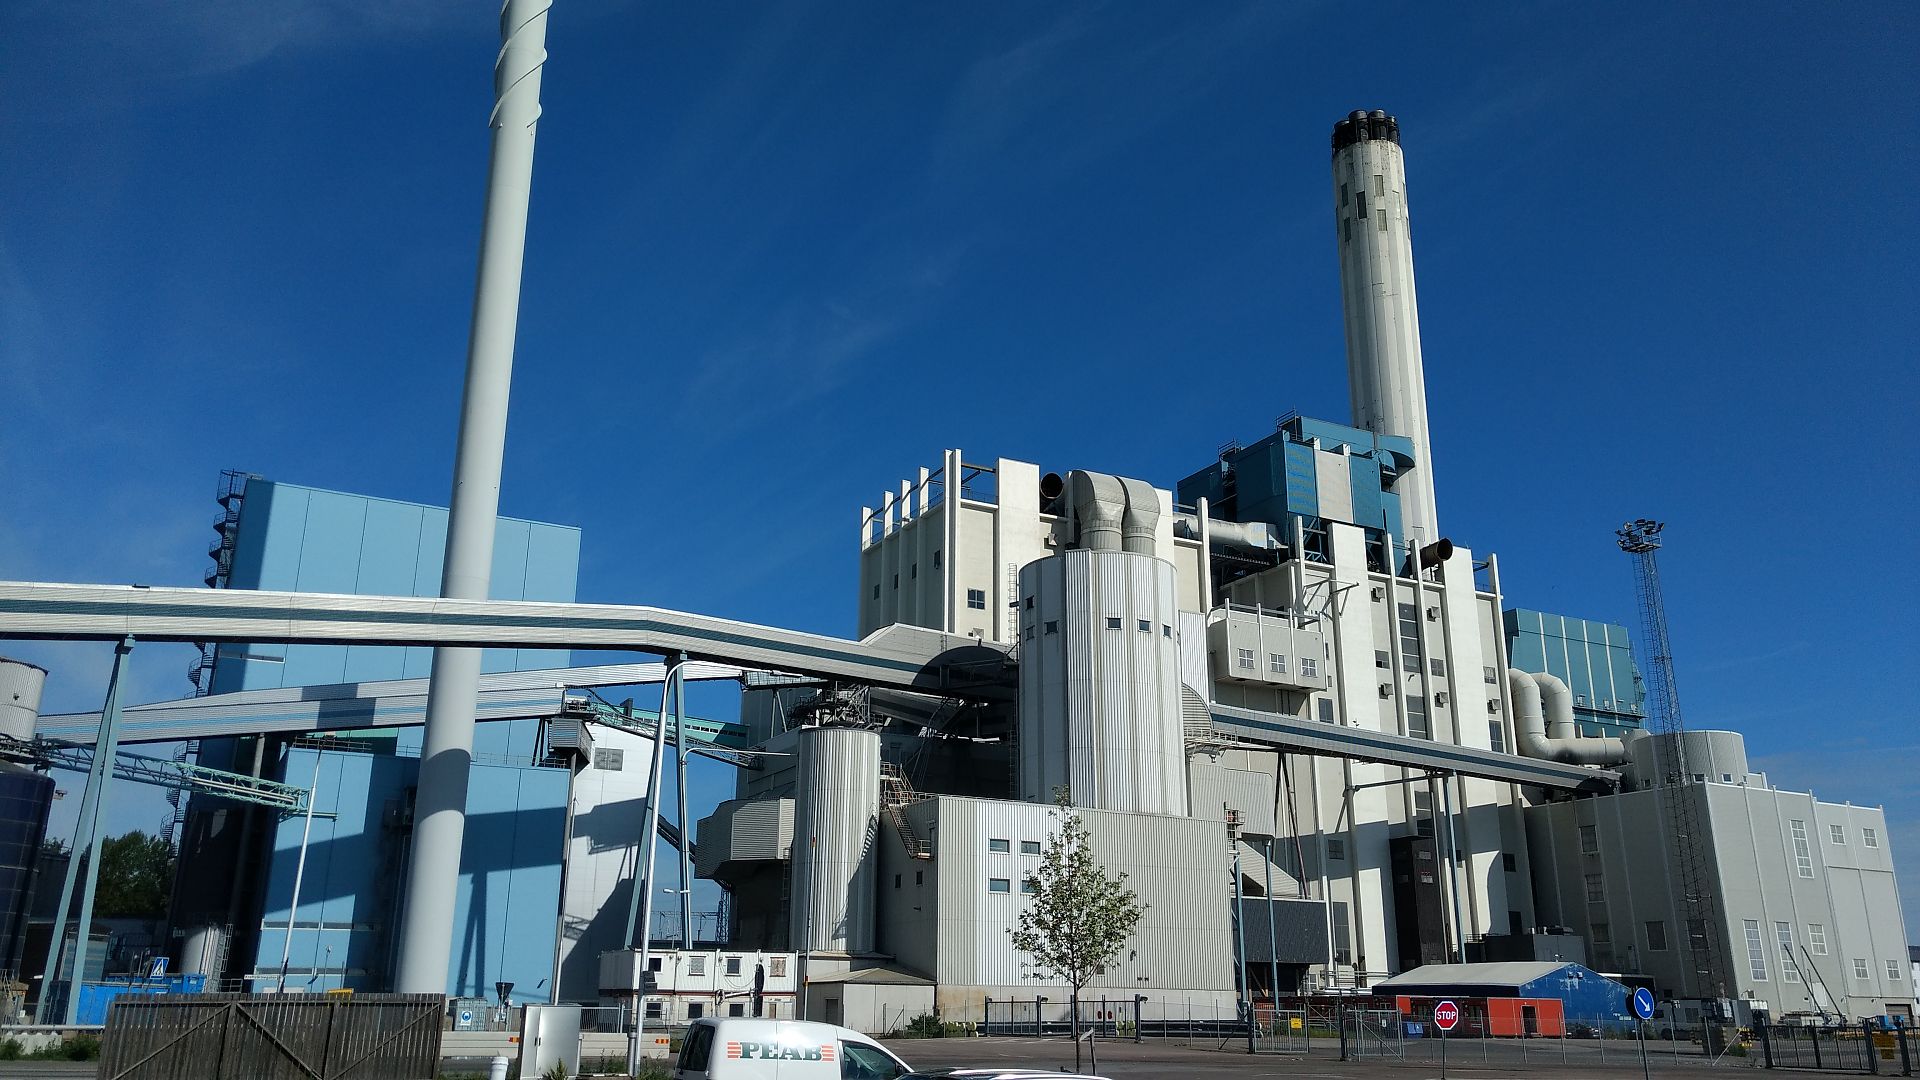
Waste gasification in Lahti
100 kilometers north of Helsinki, Finland, in the city of Lahti, is the world’s first eco-gas fueled power plant. Lahti Energy’s Kymijärvi II power plant runs on SRF.The plant produces 50 MW of electricity and 90 MW of district heat for the city of Lahti. It was officially inaugurated in May of 2012.
Copyright: Lahti Energia Oy

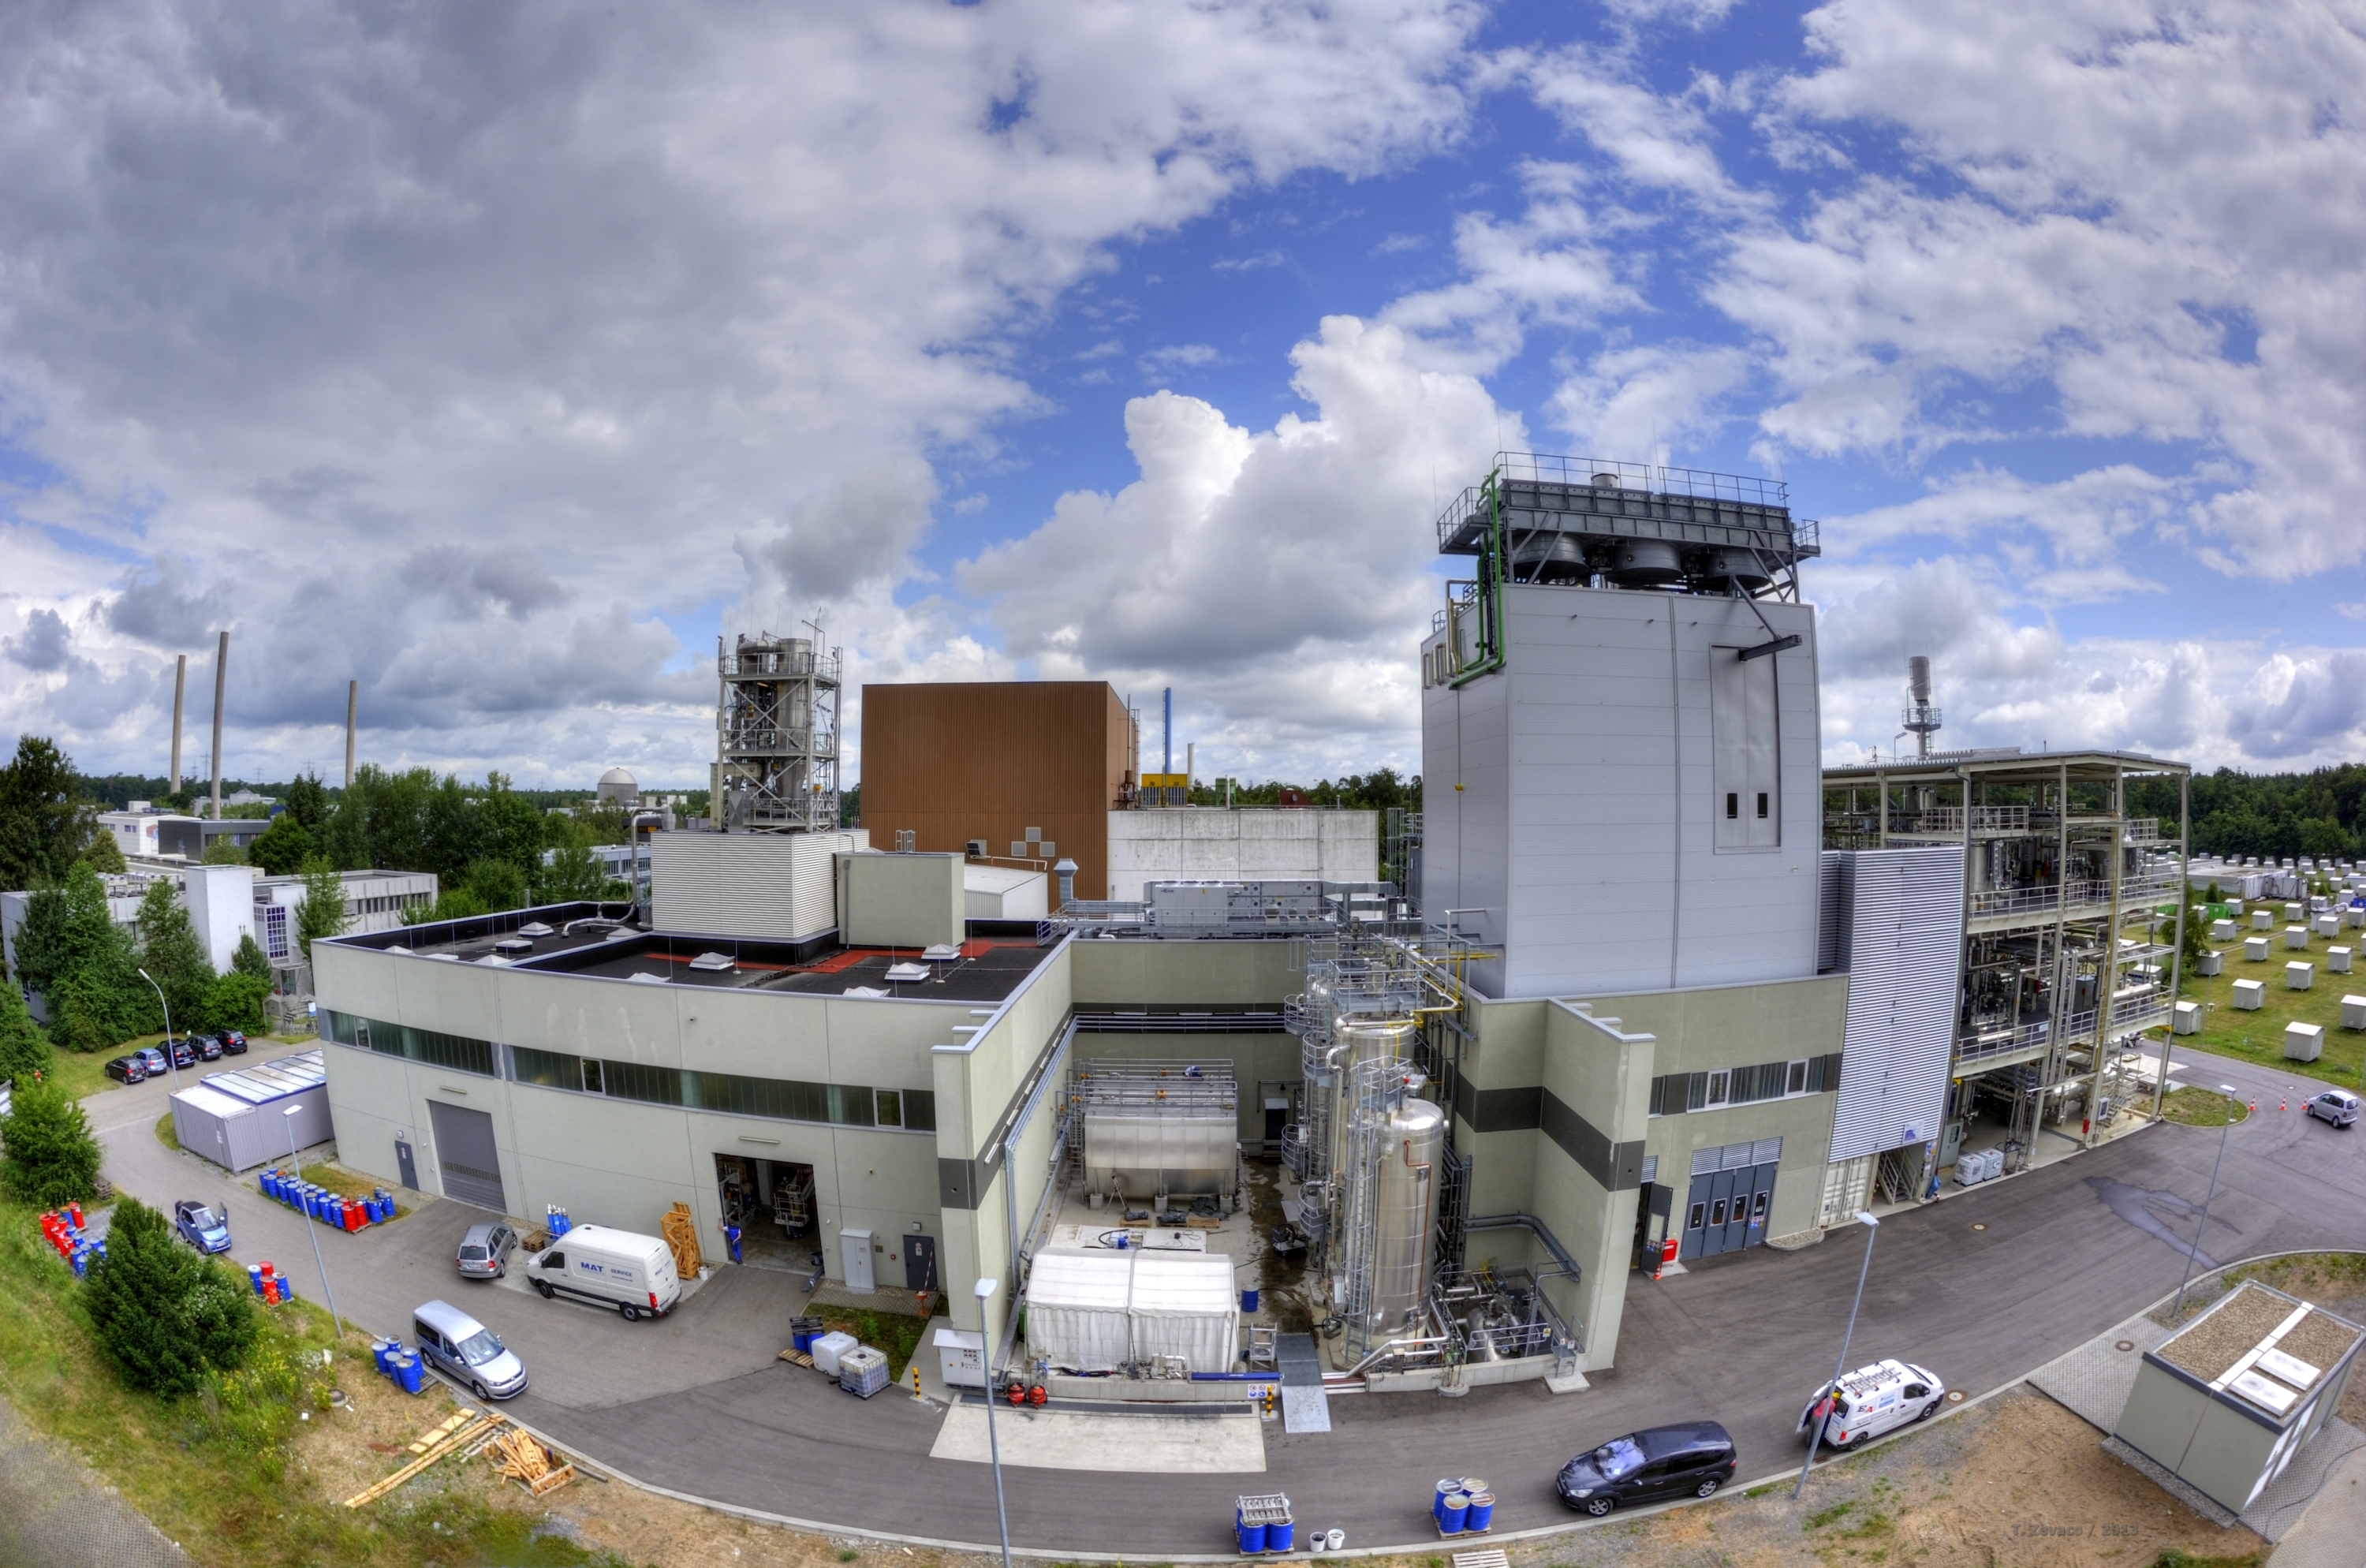
The bioliq® pilot plant
The bioliq® pilot plant covers the complete process chain required for producing customized fuels from residual biomass. Power and heat als the by-products and cover the own demand of the facility. For energy densification of the biomass, fast pyrolysis is applied. The liquid pyrolysis oil and solid char obtained can be processed into intermediate fuels of high energy density. Fuel and chemicals production from syngas requires high pressures. Therefore, syngas production is already performed at pressures up to 80 bar by entrained flow gasification. Gas cleaning and conditioning are conducted at the same pressure at high temperatures allowing for optimal heat recovery and thus improved energy efficiency. In the bioliq® pilot plant the purified syngas is firstly converted into dimethyl ether and then further to gasoline.
Copyright: KIT
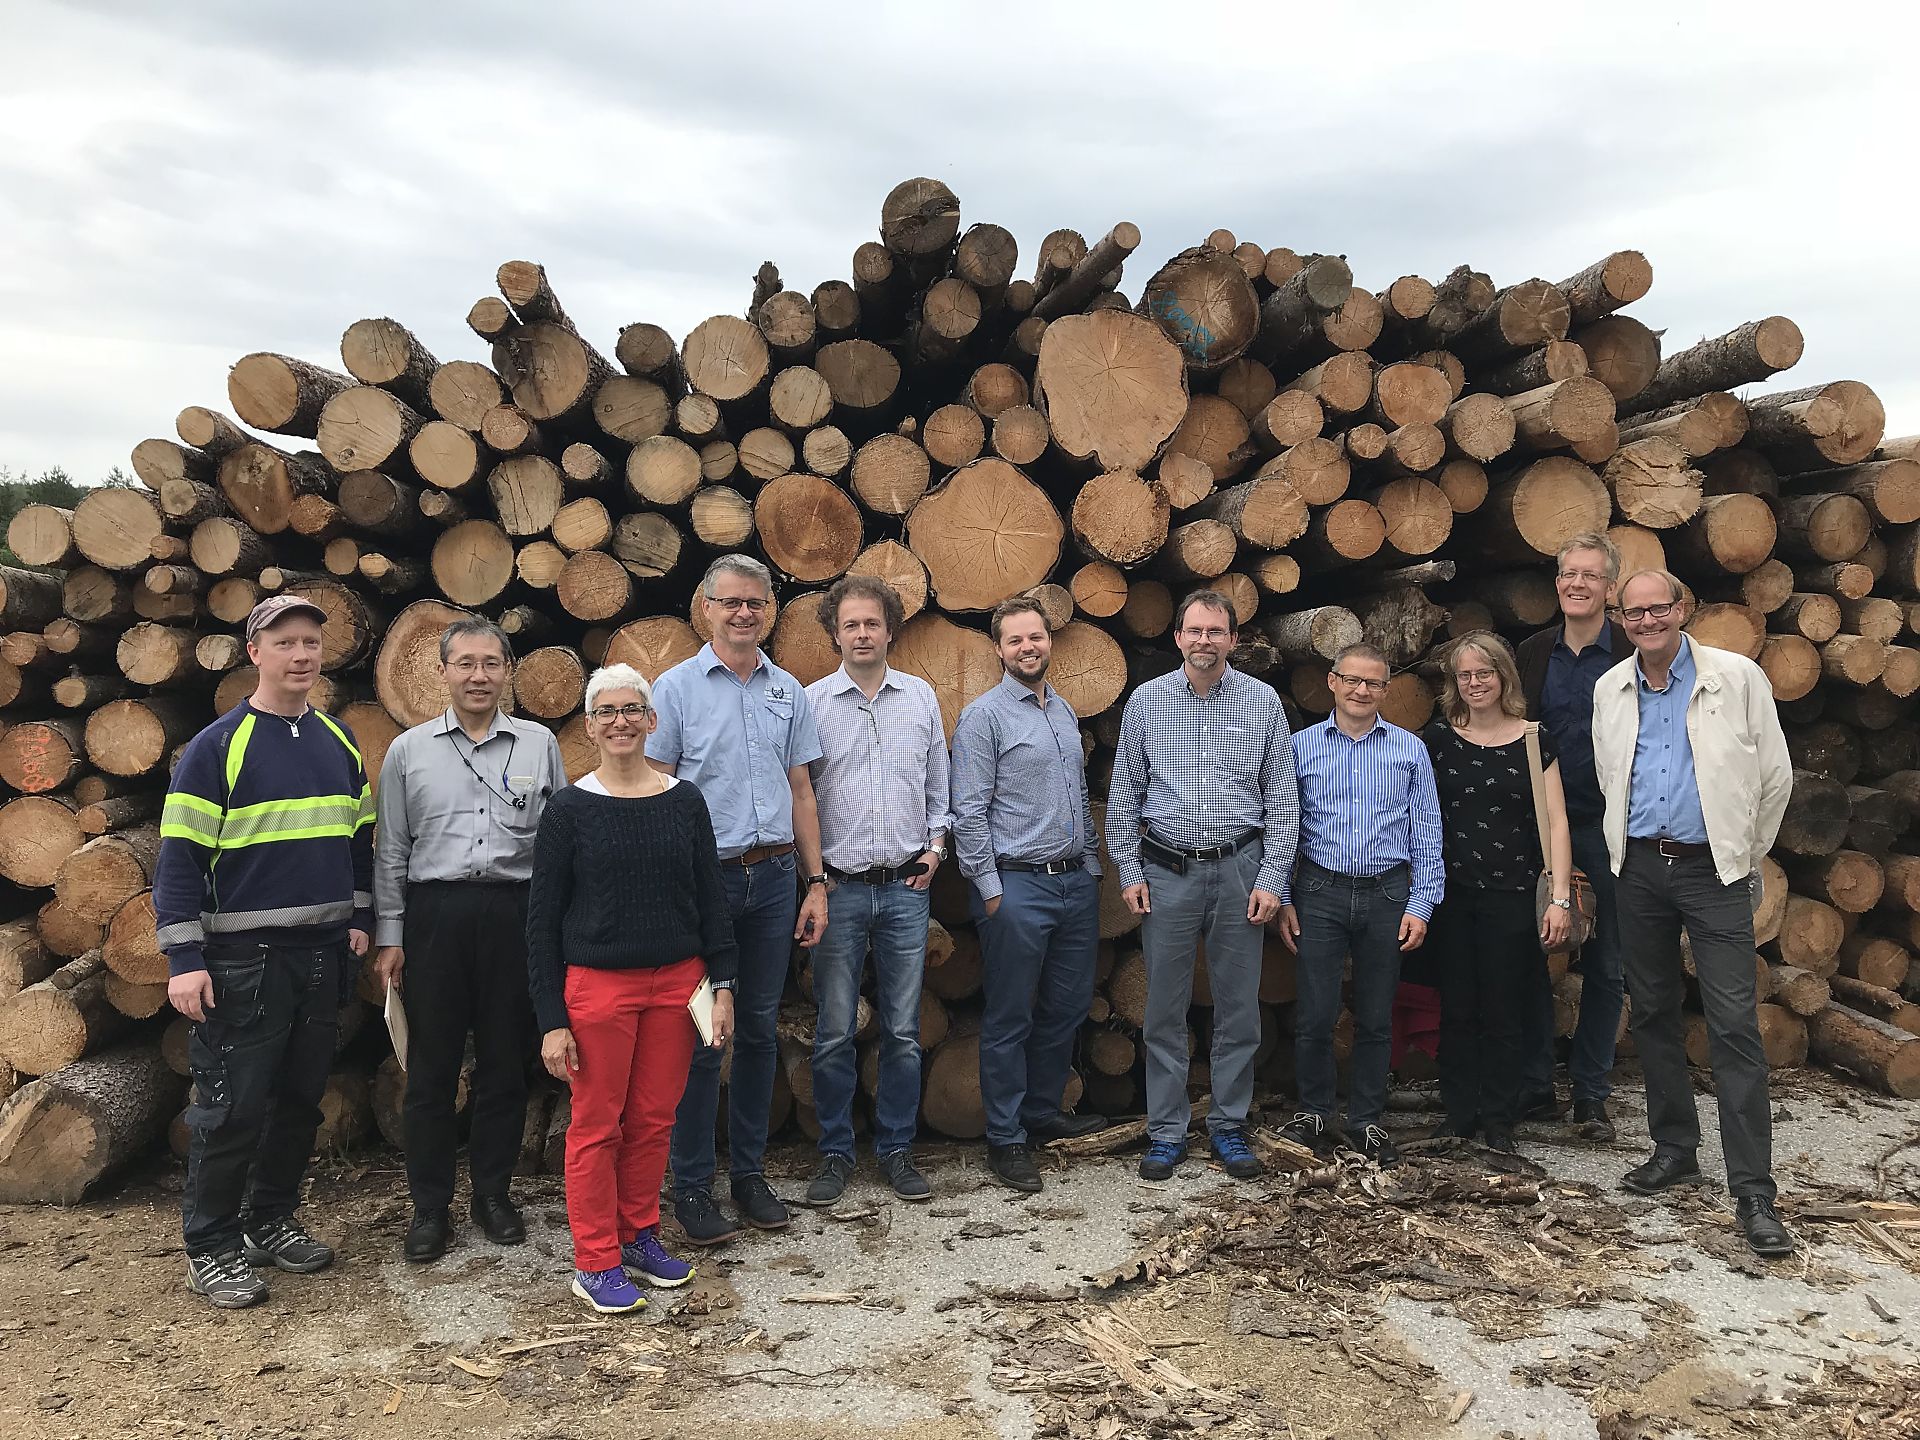
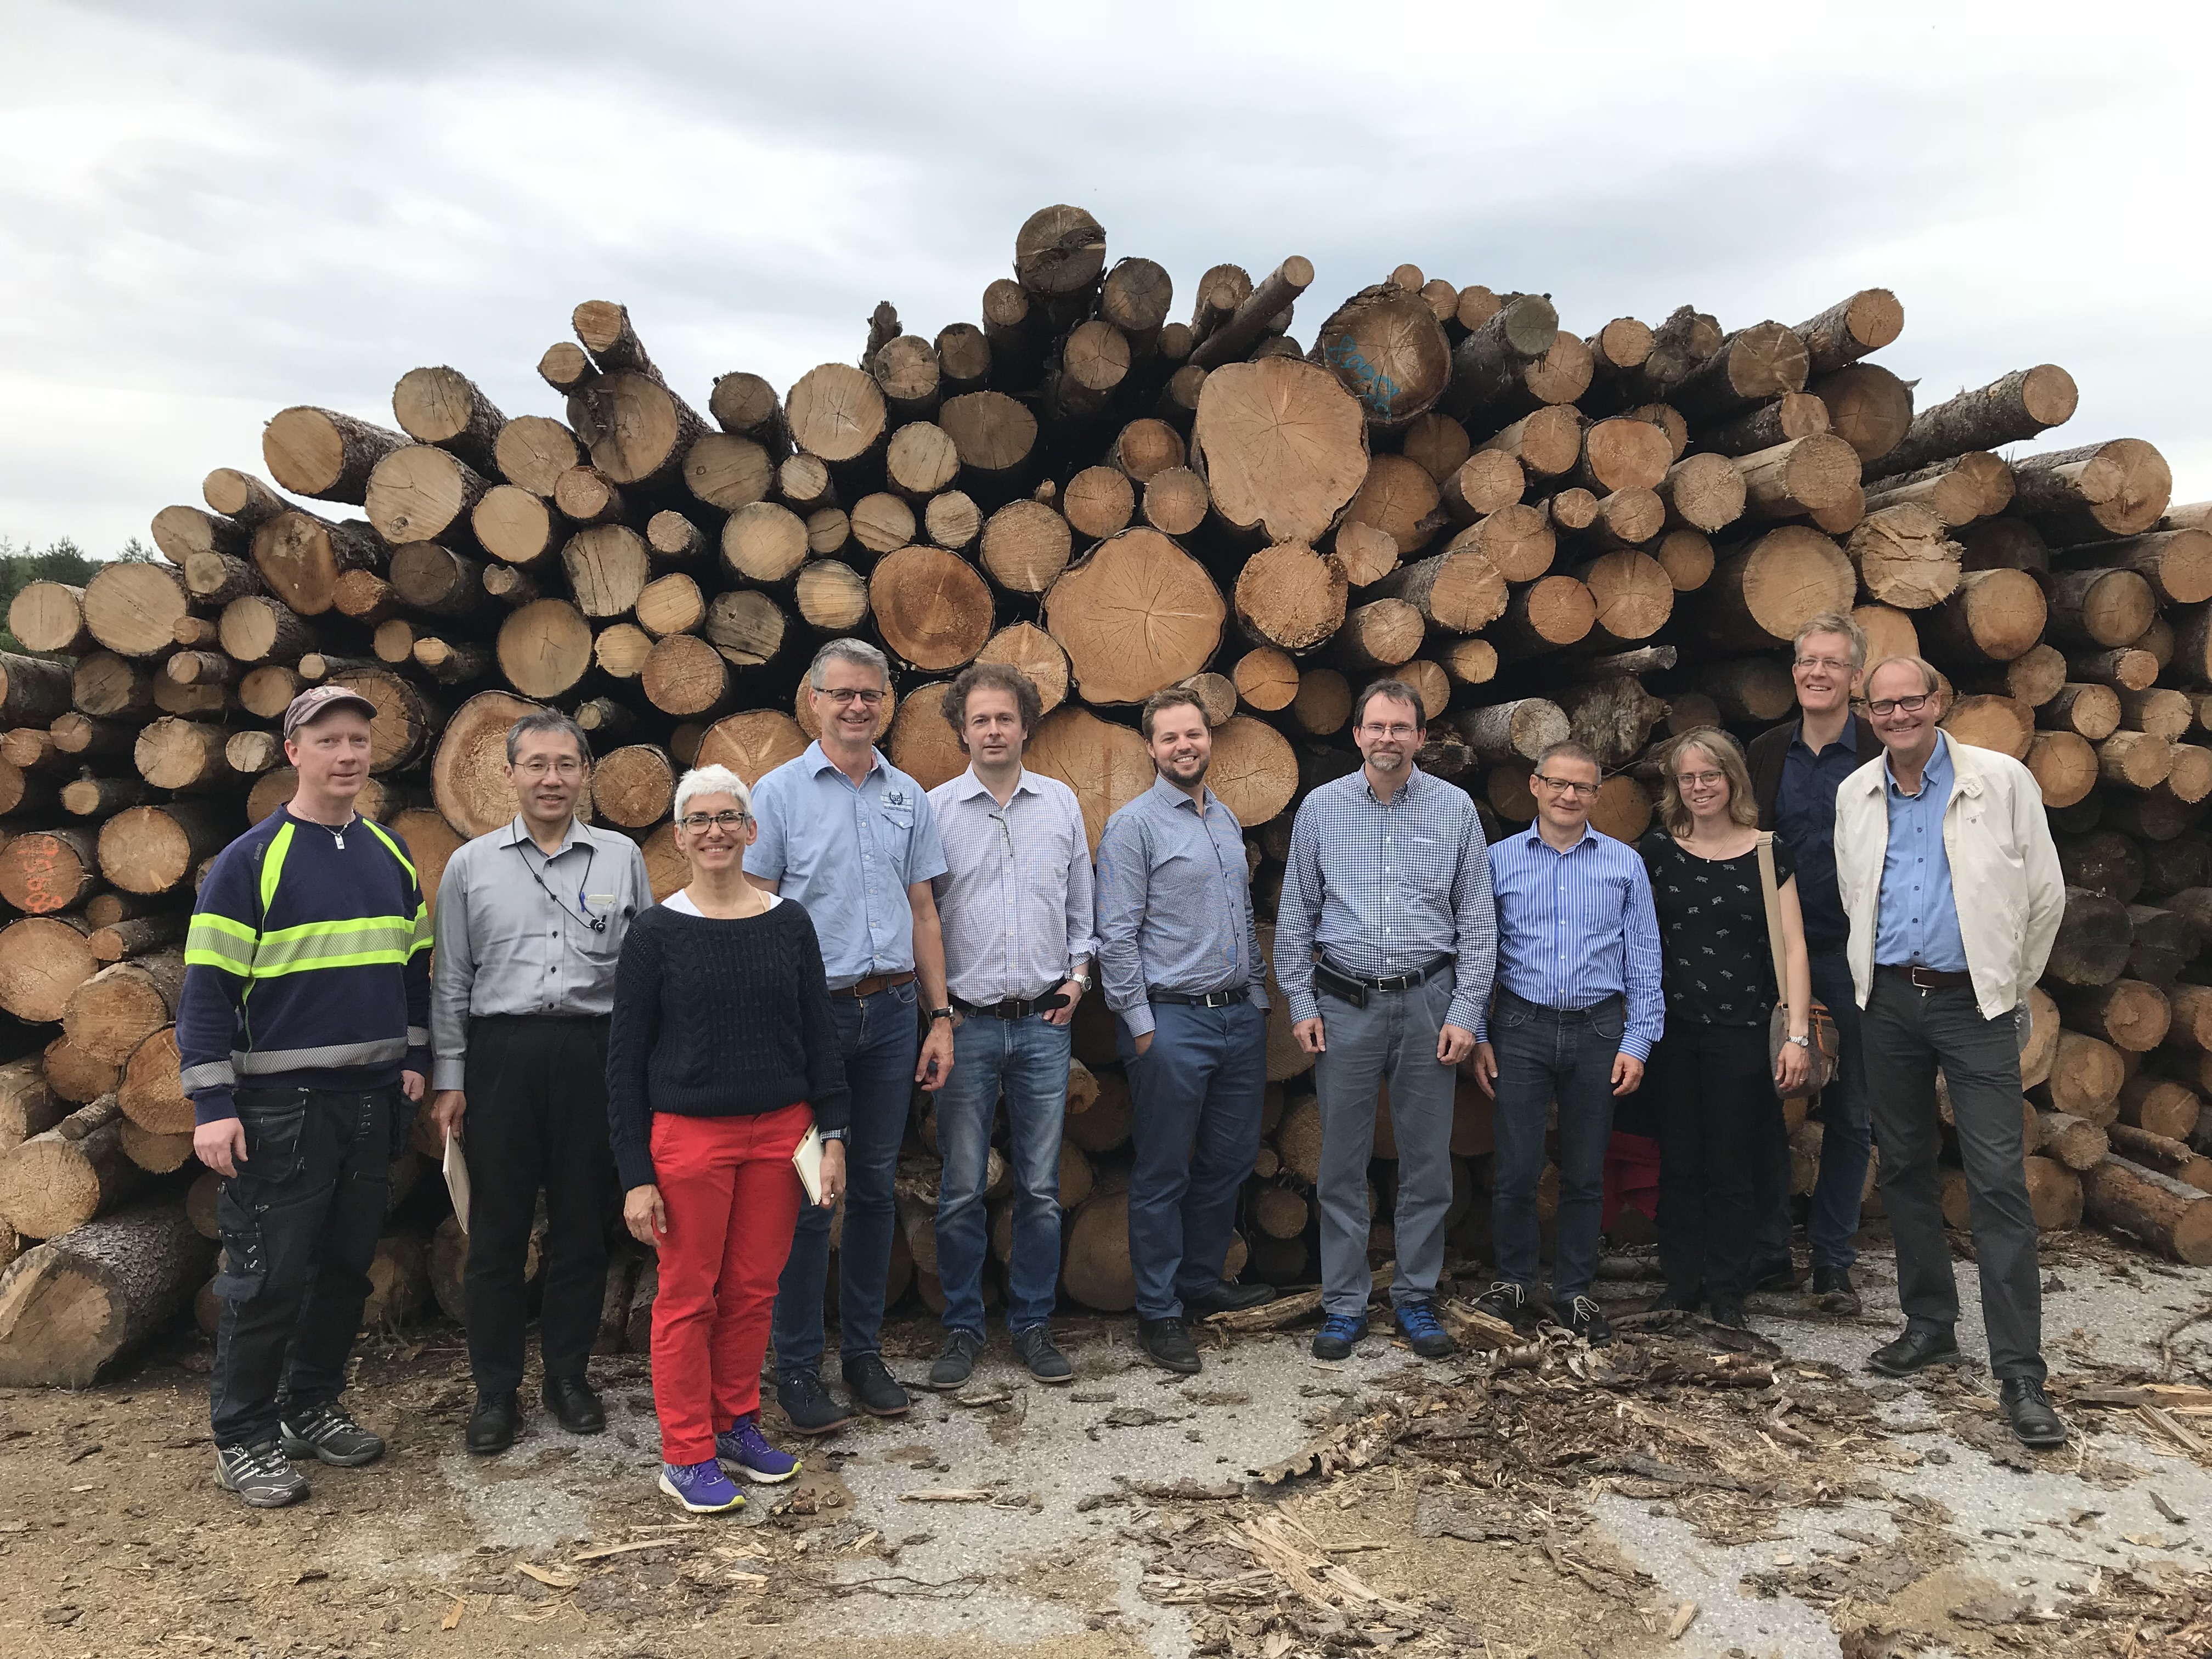
Visit by Task 32 experts to Arbaflame (Norway)
As part of the task meeting in spring 2019, the experts from Task 32 visited the Arbaflame production site in Grasmo (Norway).
Copyright: Morten Tony Hansen

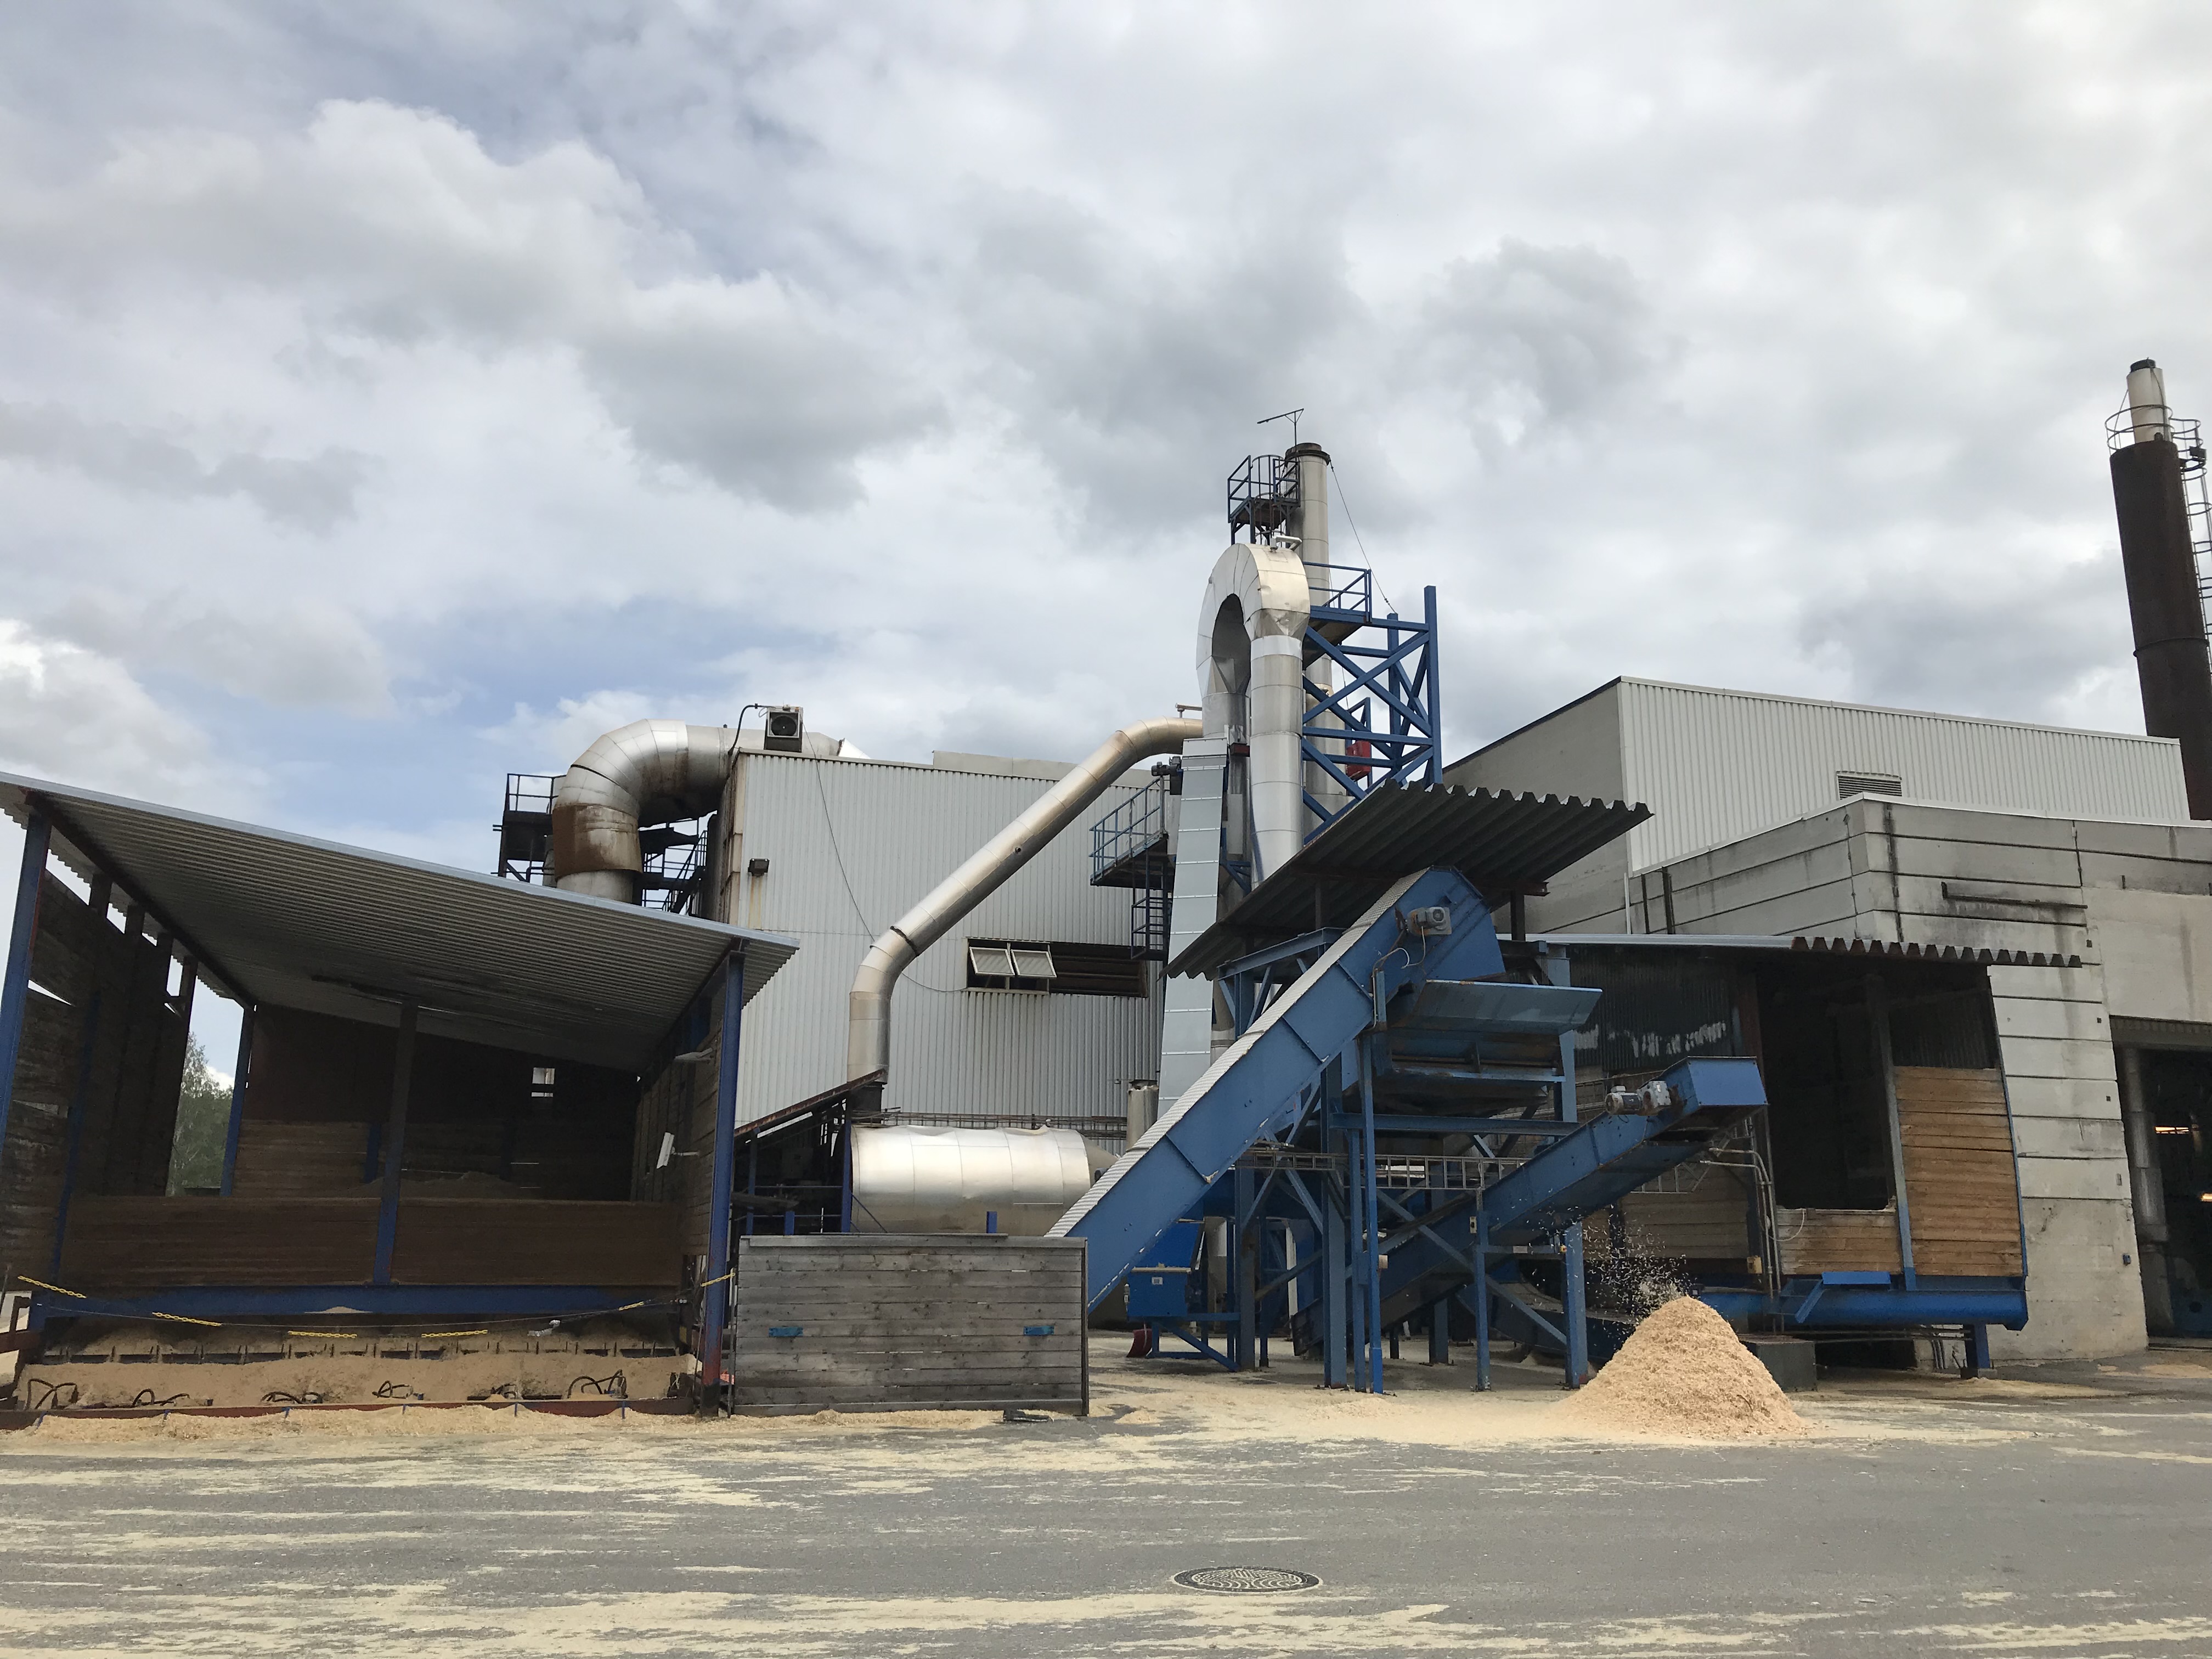
Steam Explosion plant of Arbaflame in Grasmo (Norway)
The ArbaOne plant in Grasmo, outside Kongsvinger, Norway, is the first large-scale commercial plant with an annual production capacity of 70,000 tonnes of steam-exploded pellets.
Copyright: Morten Tony Hansen
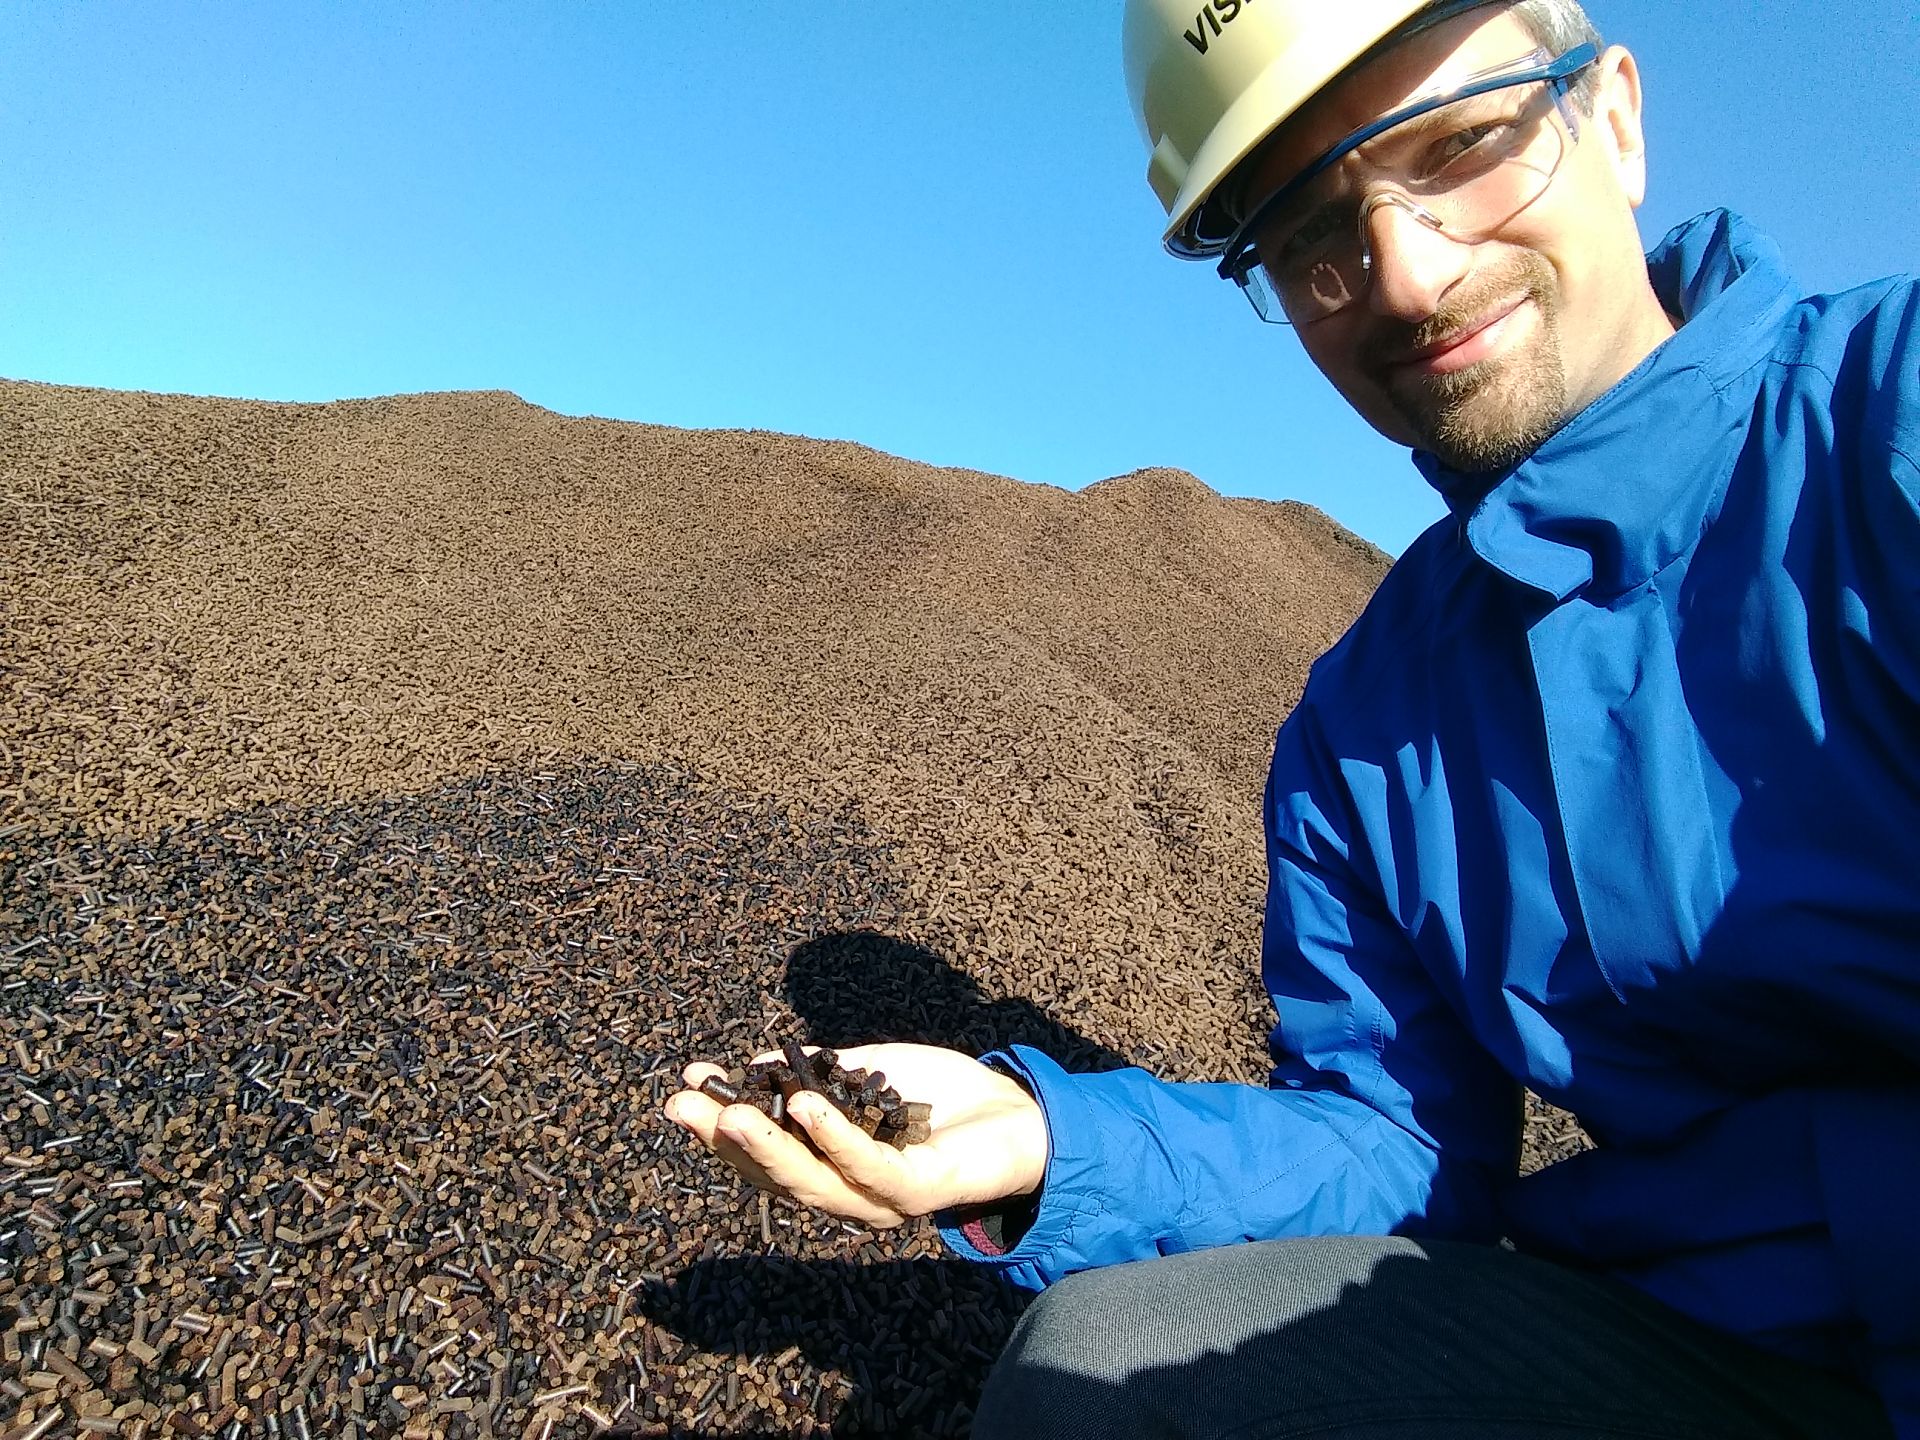
Thermally treated wood pellets
Thermally treated wood pellets (steam exploded) are used in a slightly adapted former coal-fired power plant in Thunder Bay (Canada) as a new climate-friendly fuel for electricity generation.
Copyright: Christoph Schmidl

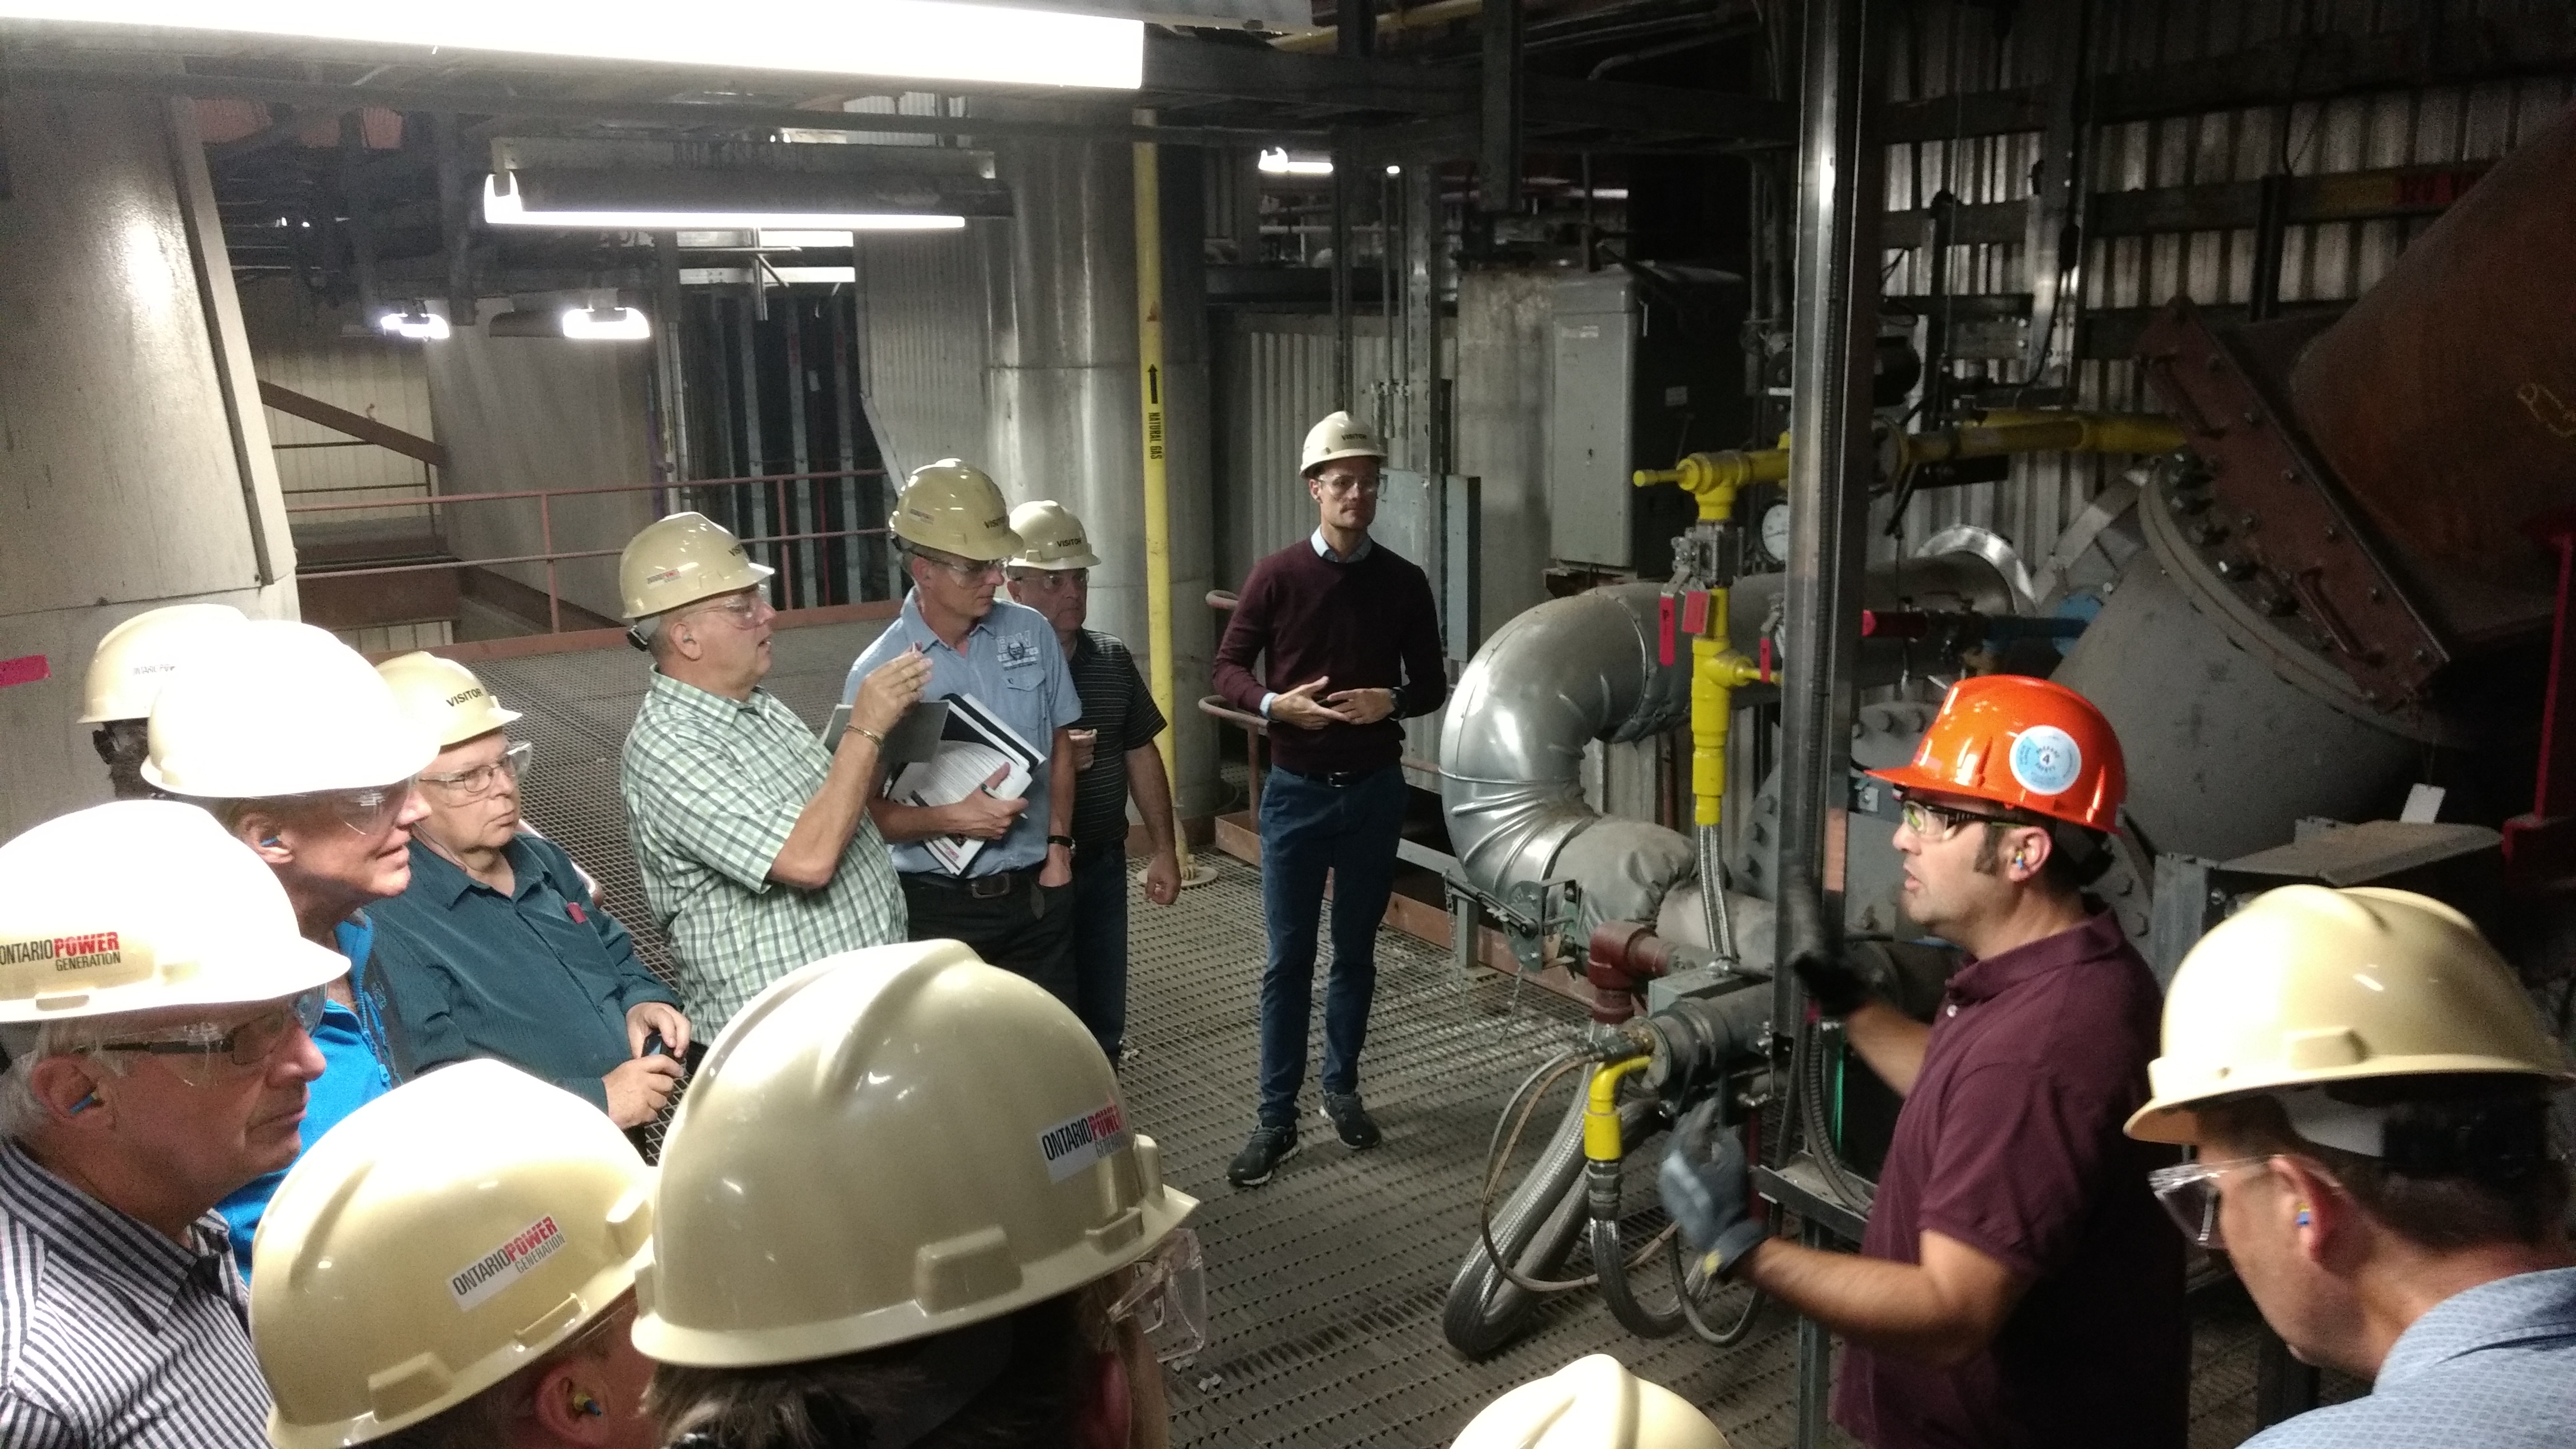
Visit of wood pellet power plant (240MW) in Canada
Plant visit at the 240MW Woodpellet-Powerplant of Ontario Power Generation in Atikoken Canada
Copyright: Christoph Schmidl

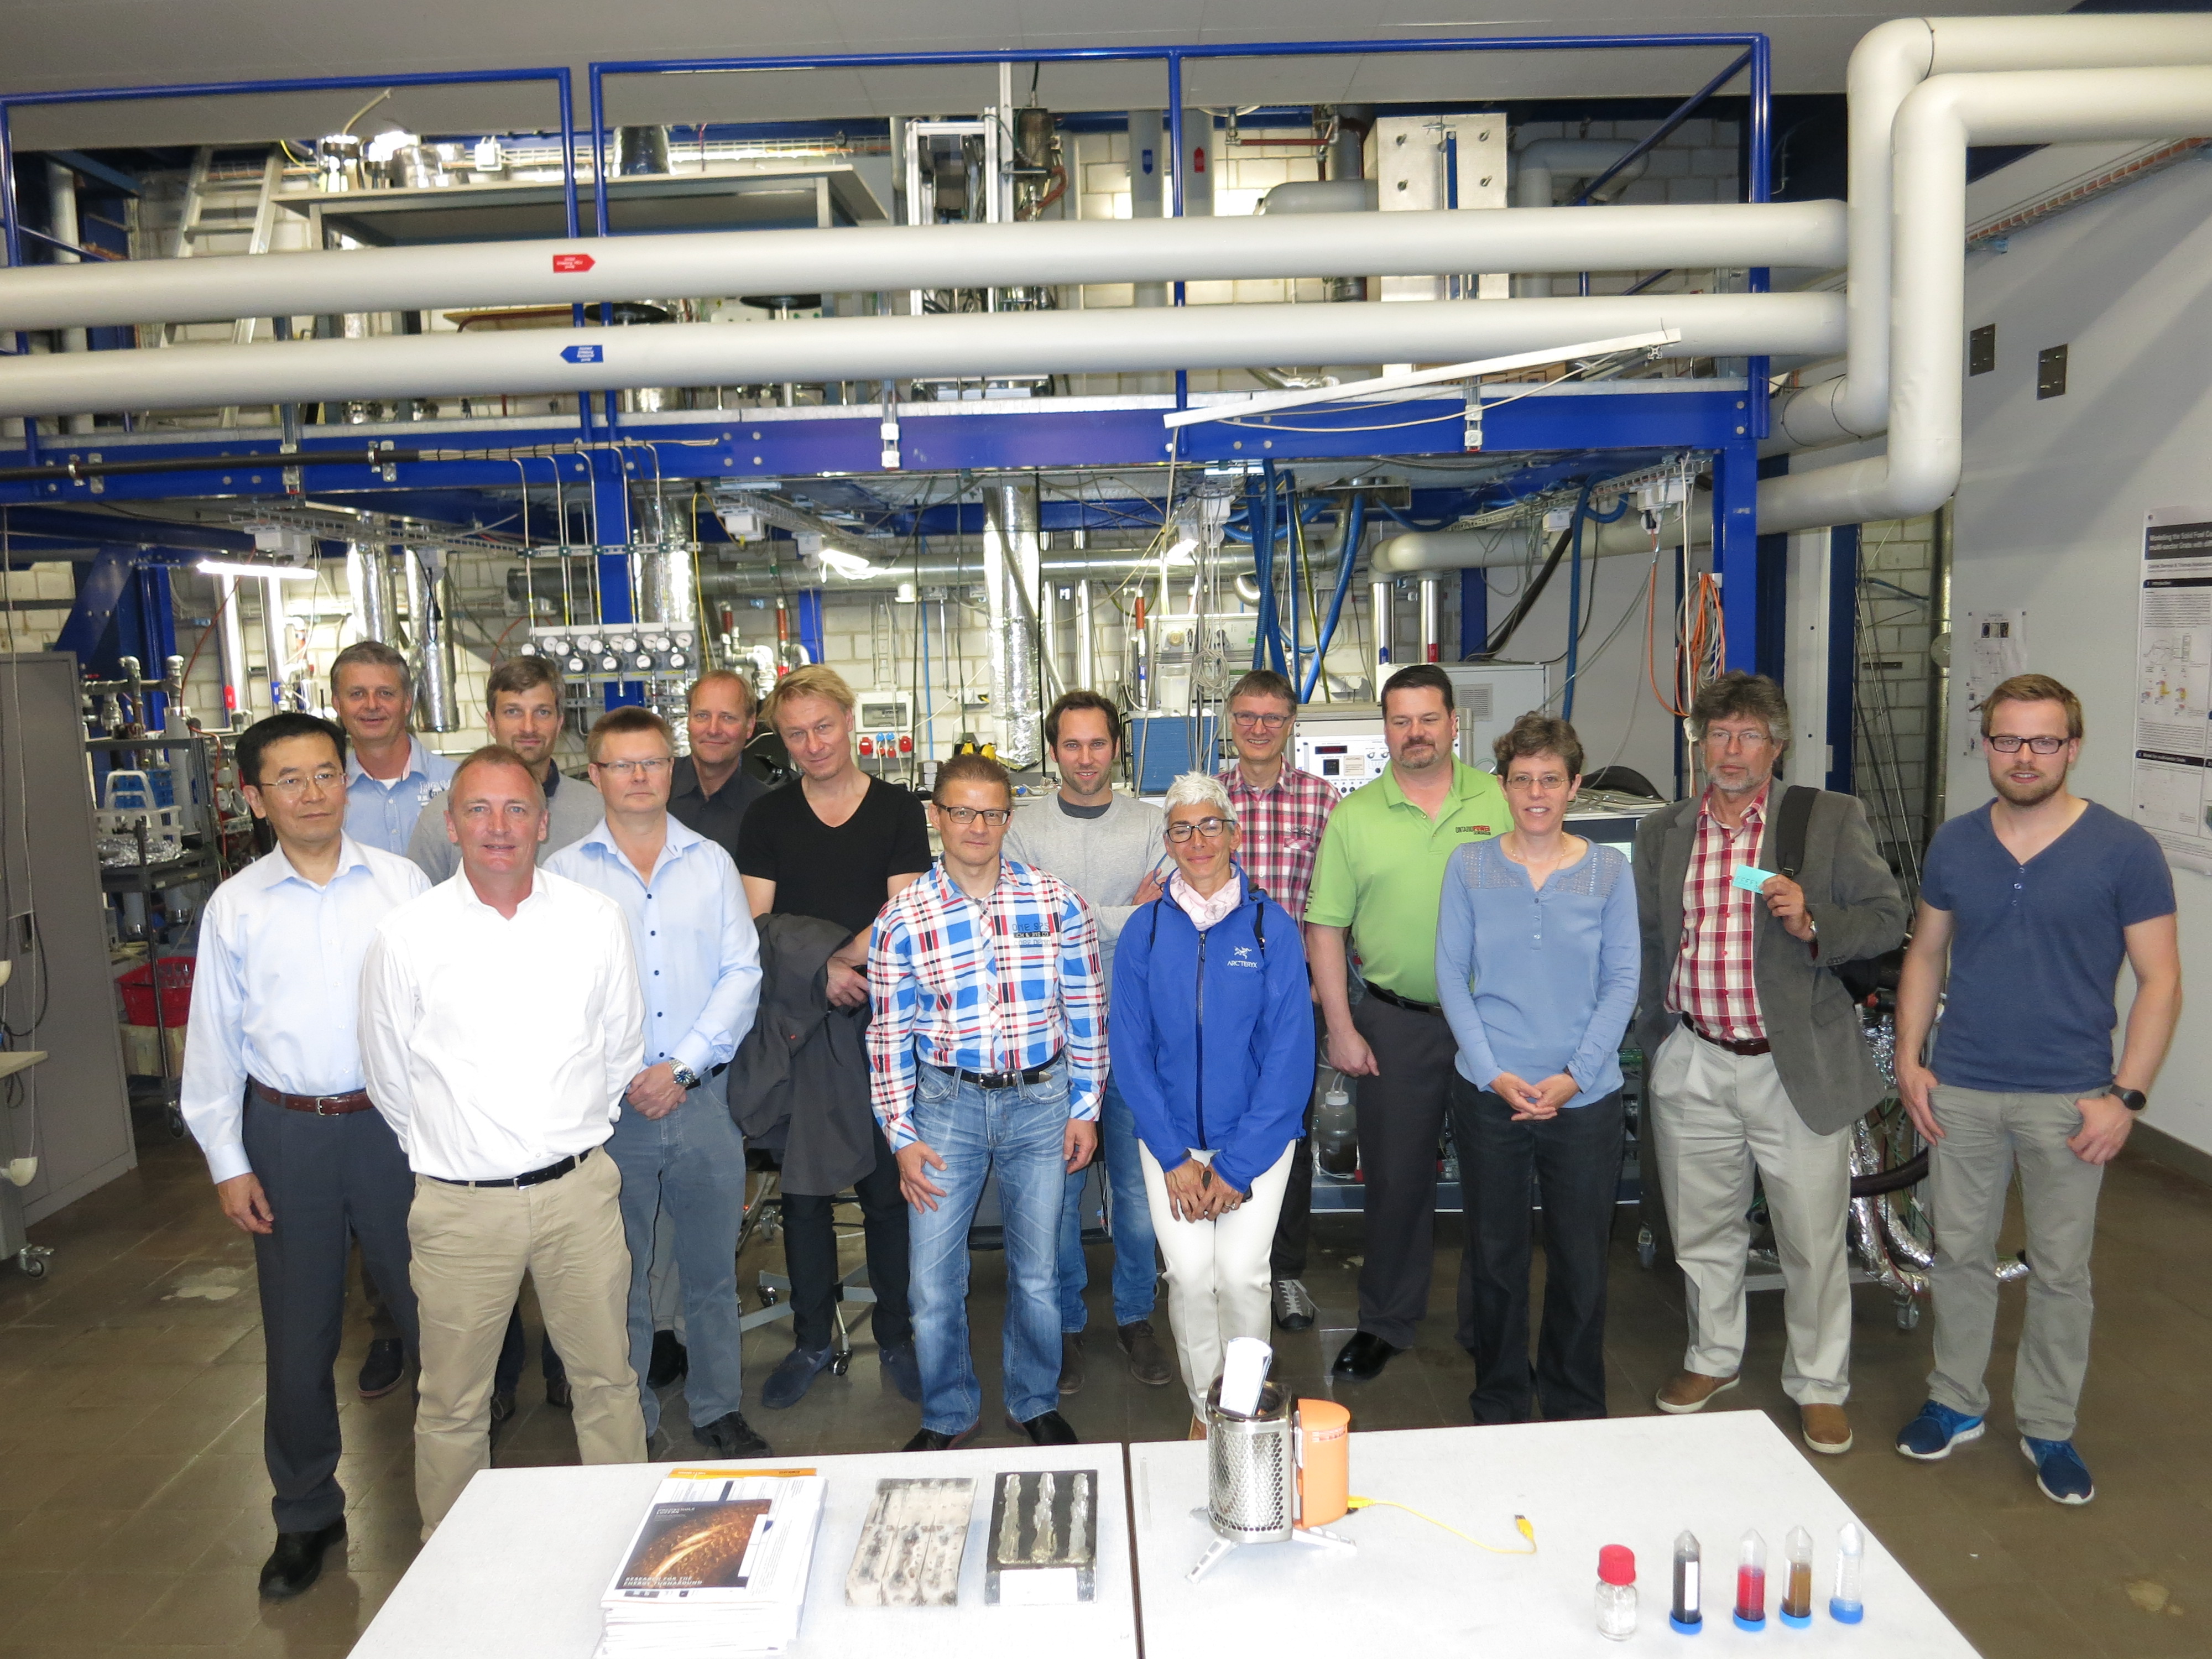
IEA Bioenergy Task 32 Experts
IEA Bioenergy Task 32 experts visiting the bioenergy research laboratory at the Lucerne University of Applied Sciences in the frame of a task meeting in Switzerland
Copyright: Thomas Nussbaumer
Biomass CHP in Västerås (Sweden)
Field trip of IEA BIoenergy Task 32 Experts to the CHP plant in Västerås operated by Mälarenergi in Sweden (close to Stockholm).
Copyright: Christoph Schmidl
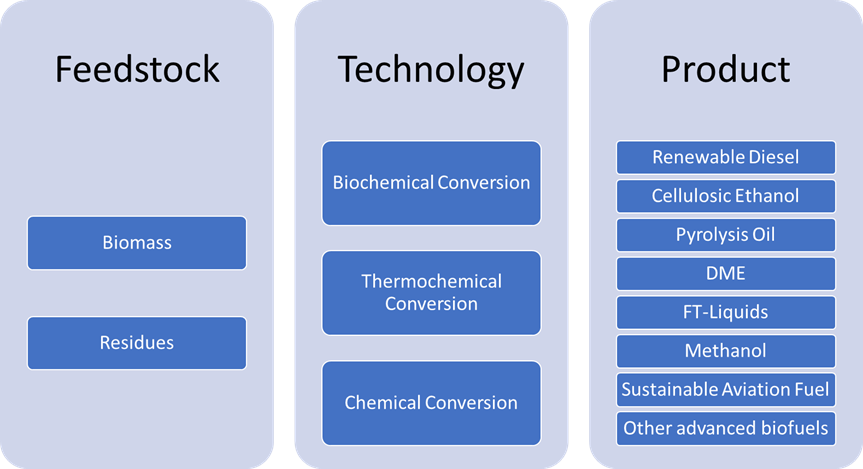
Advanced Biofuel Pathways
Principle pathways of advanced biofuels technologies
Copyright: @BEST
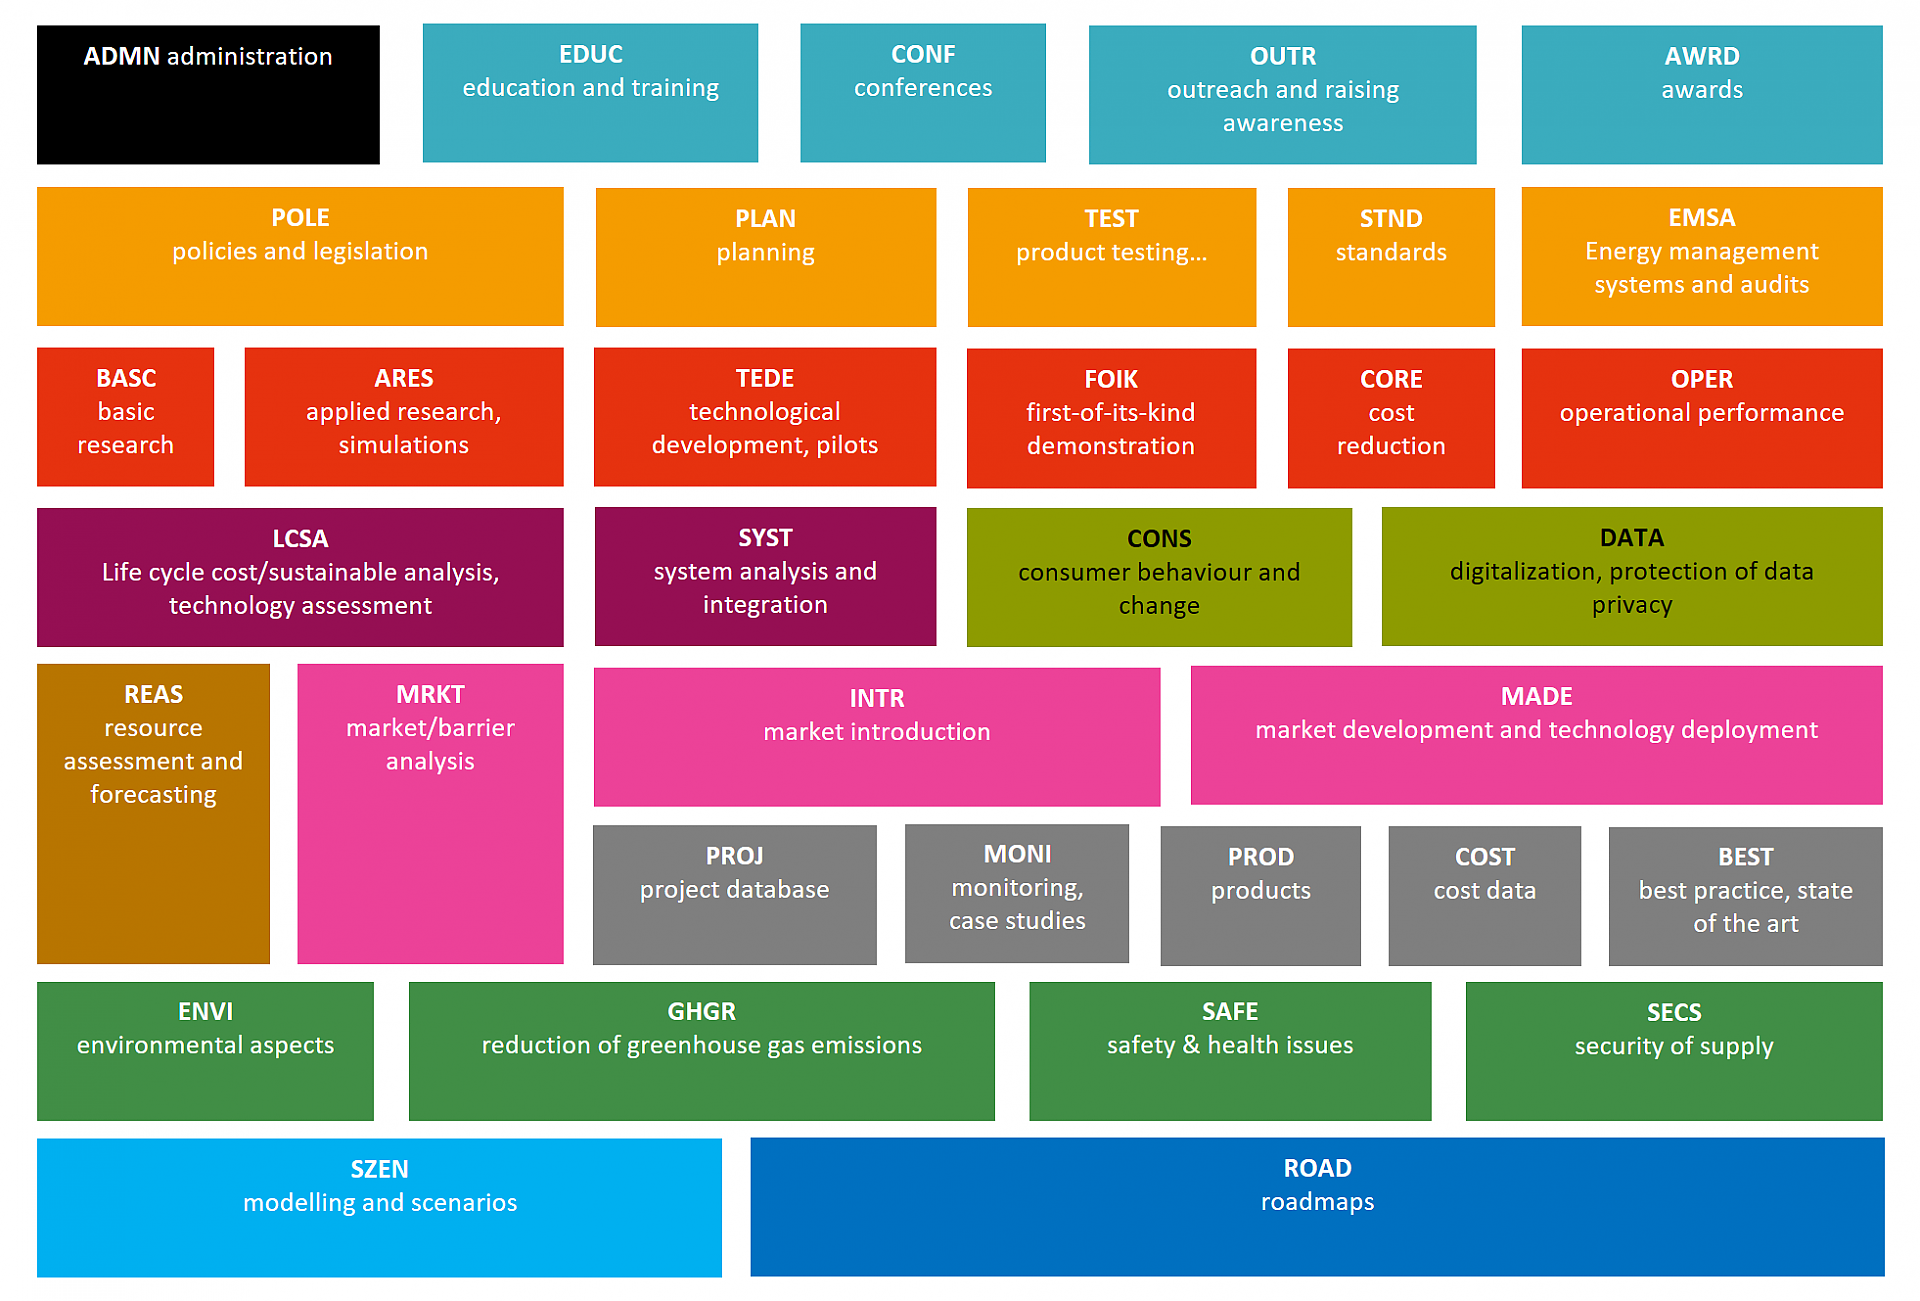
Methods
Set of methods to classify the type of activity of TCP Tasks and Annexes.
Copyright: Austrian Energy Agency
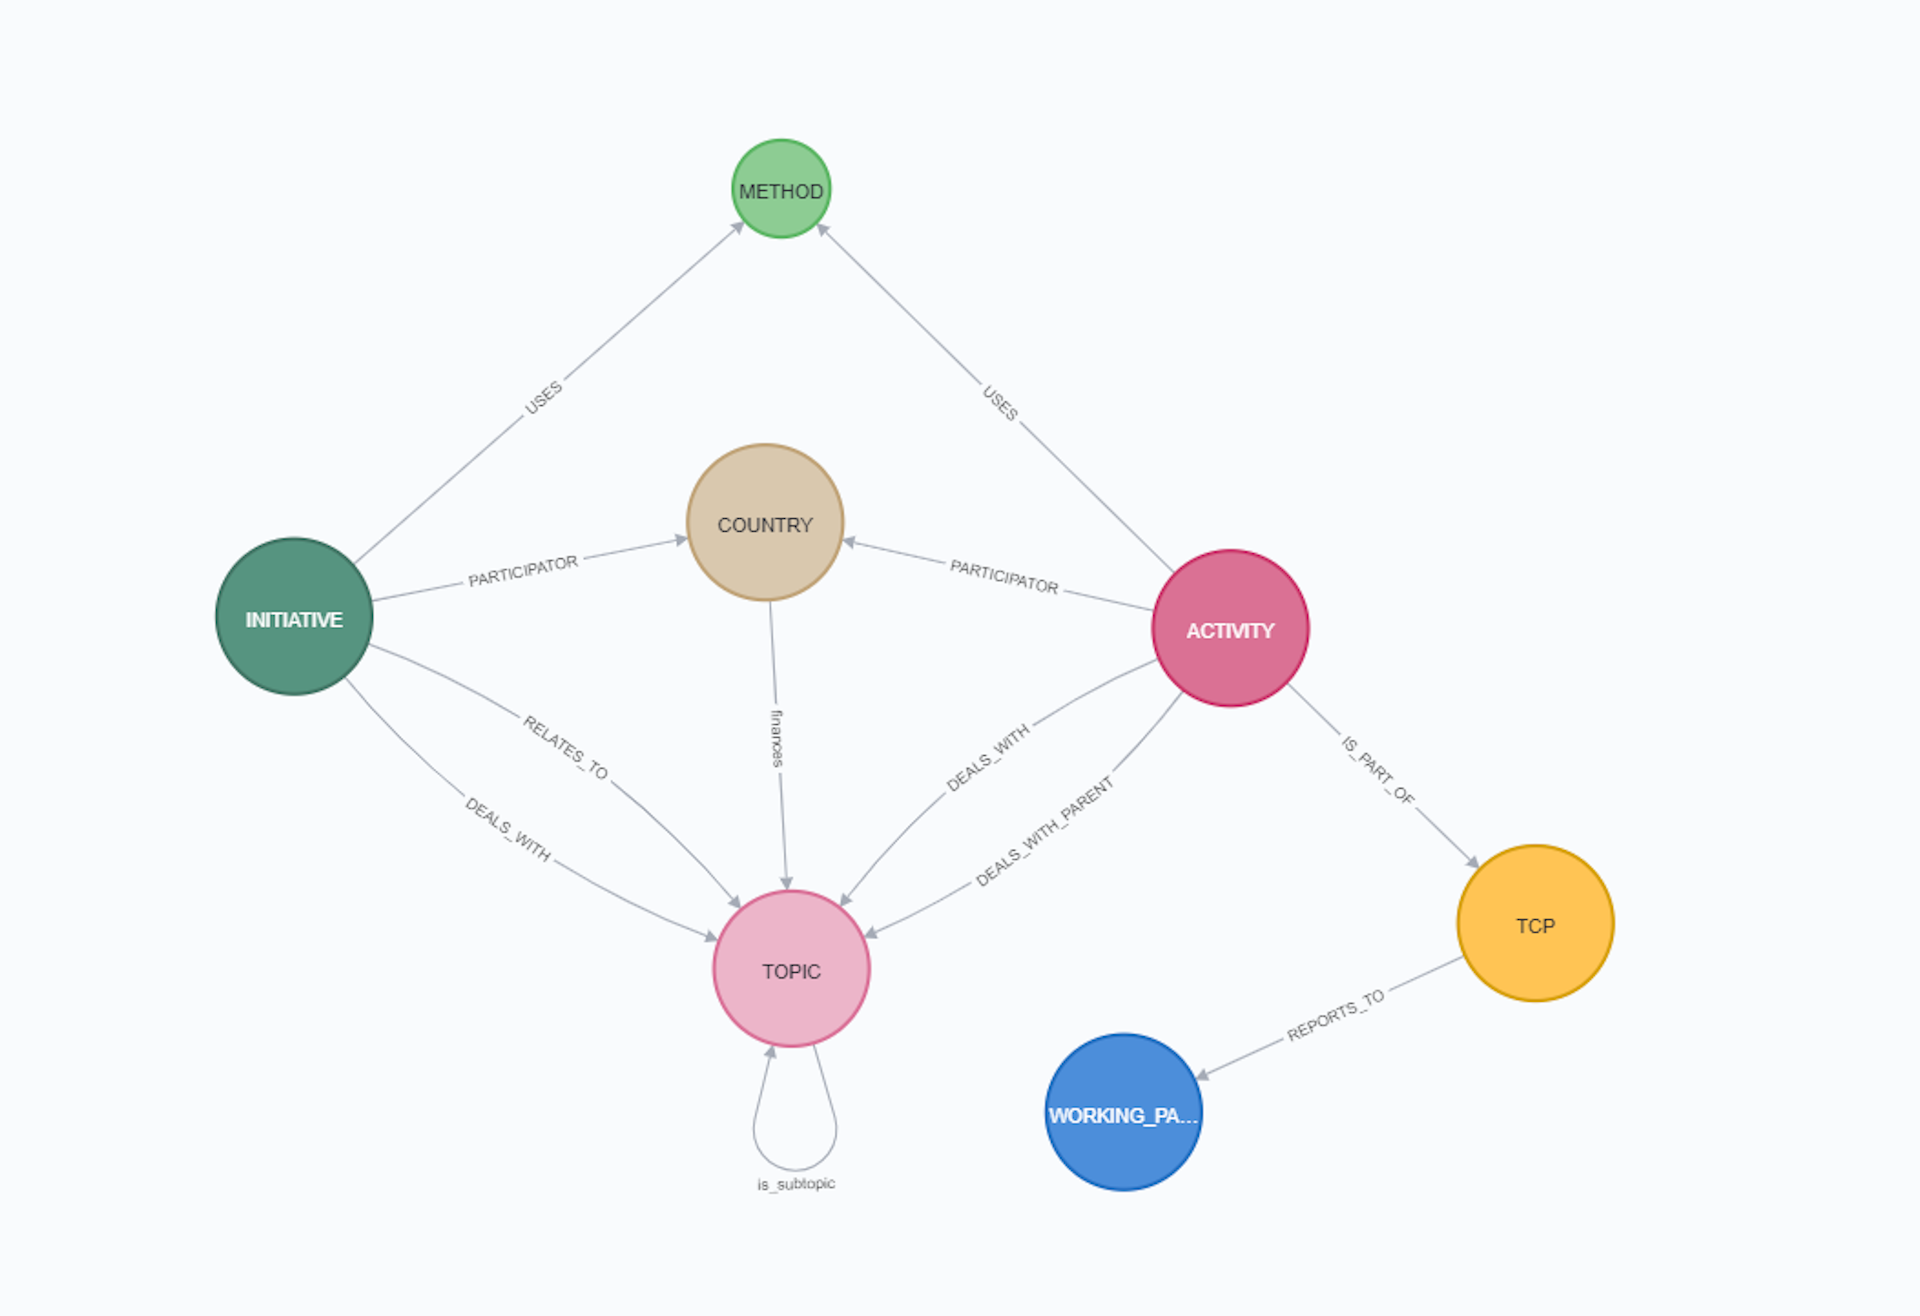
Graph Datastructure
Graphbased datastructure of the open access IEA-TCP dataset.
Copyright: Austrian Energy Agency
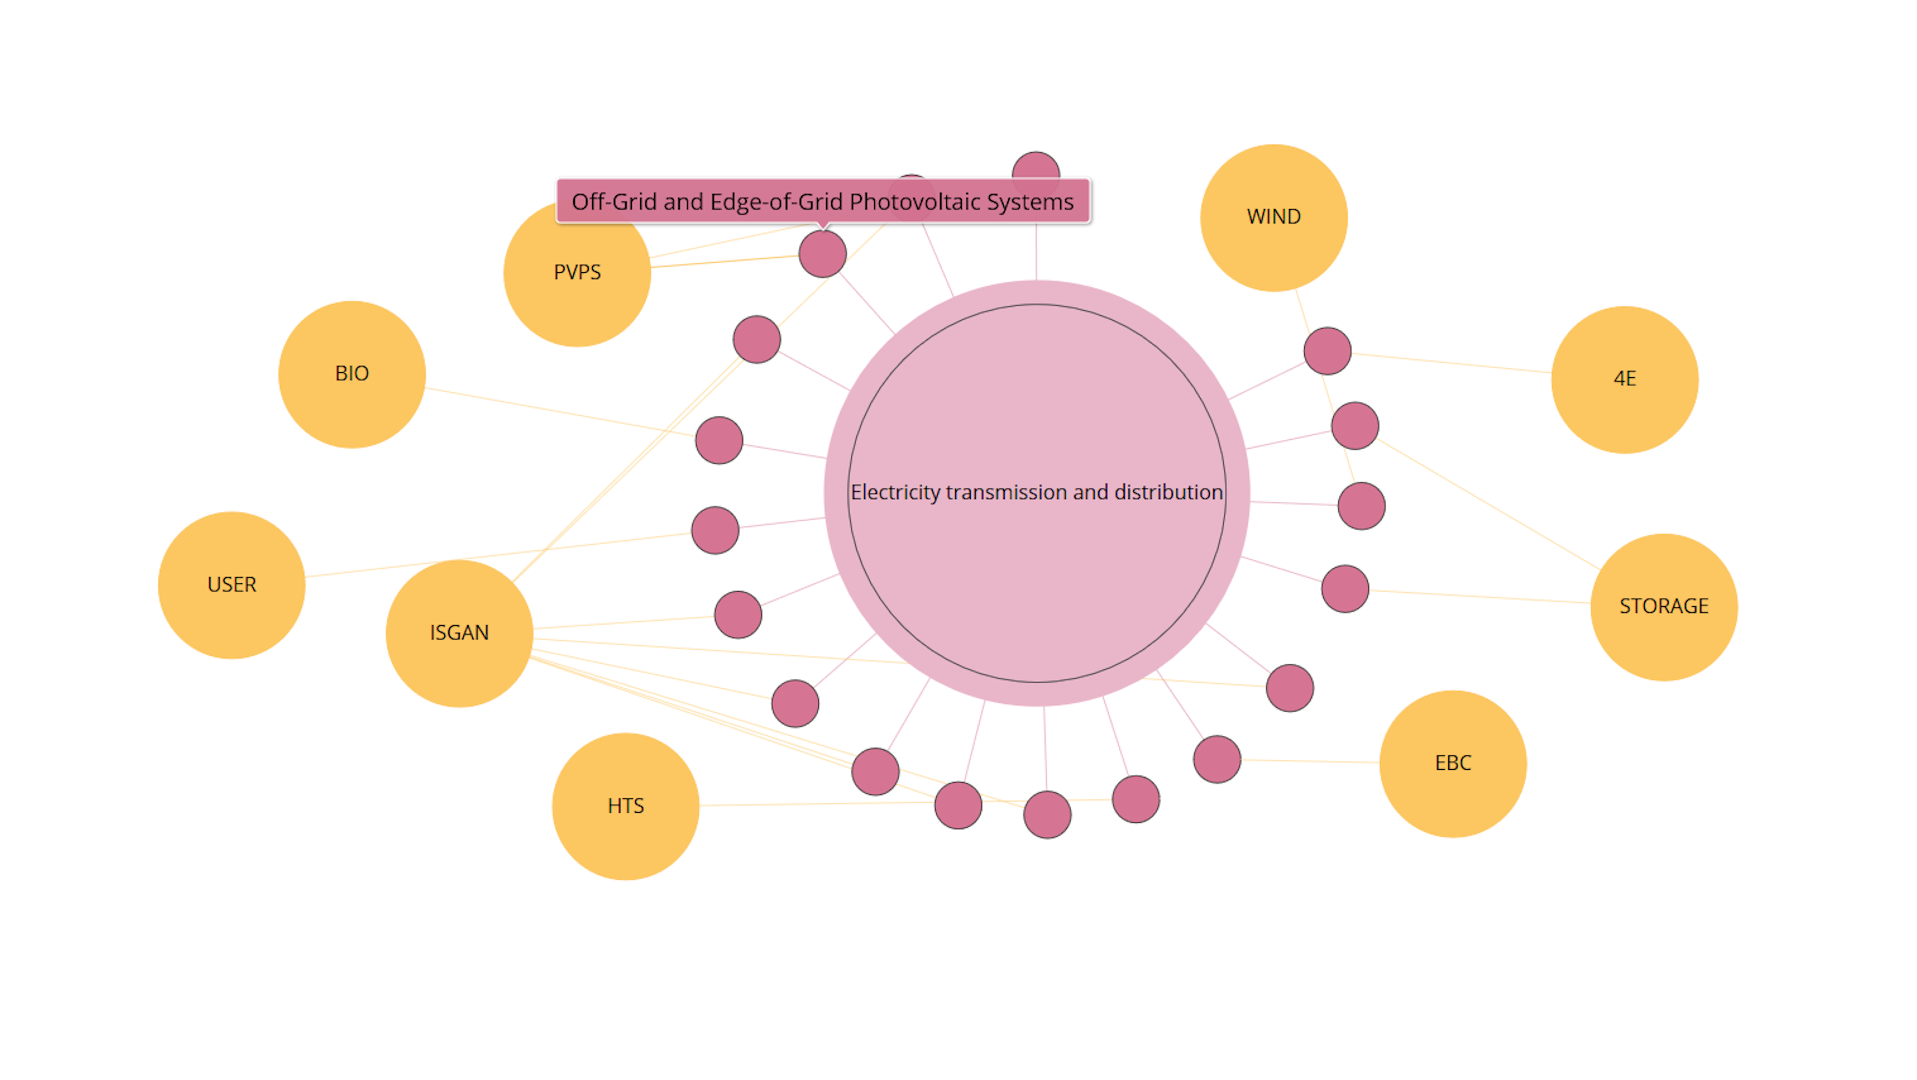
Visualisation of TCPs
After selecting a topic (in this example "Electricity transmission and distribution" was selected), this graph shows all tasks (activities) focussing on the selected topic. The topics are structured according to the IEA energy RD&D budget/expenditure statistics. Additionally, you can see the related Technology Collaboration Programmes (TCPs). Activities which had been ongoing in Summer 2020 from all IEA-TCPs are covered in this analysis. You can re-arrange the different bubbles to better meet the needs of your analysis. If a TCP consists of more than one task (activity), it also contains one entry in the database labelled “ExCo-Activities”. Available at https://nachhaltigwirtschaften.at/en/iea/visualisations/tcps-focussing-on-a-topic.php
Copyright: Austrian Energy Agency
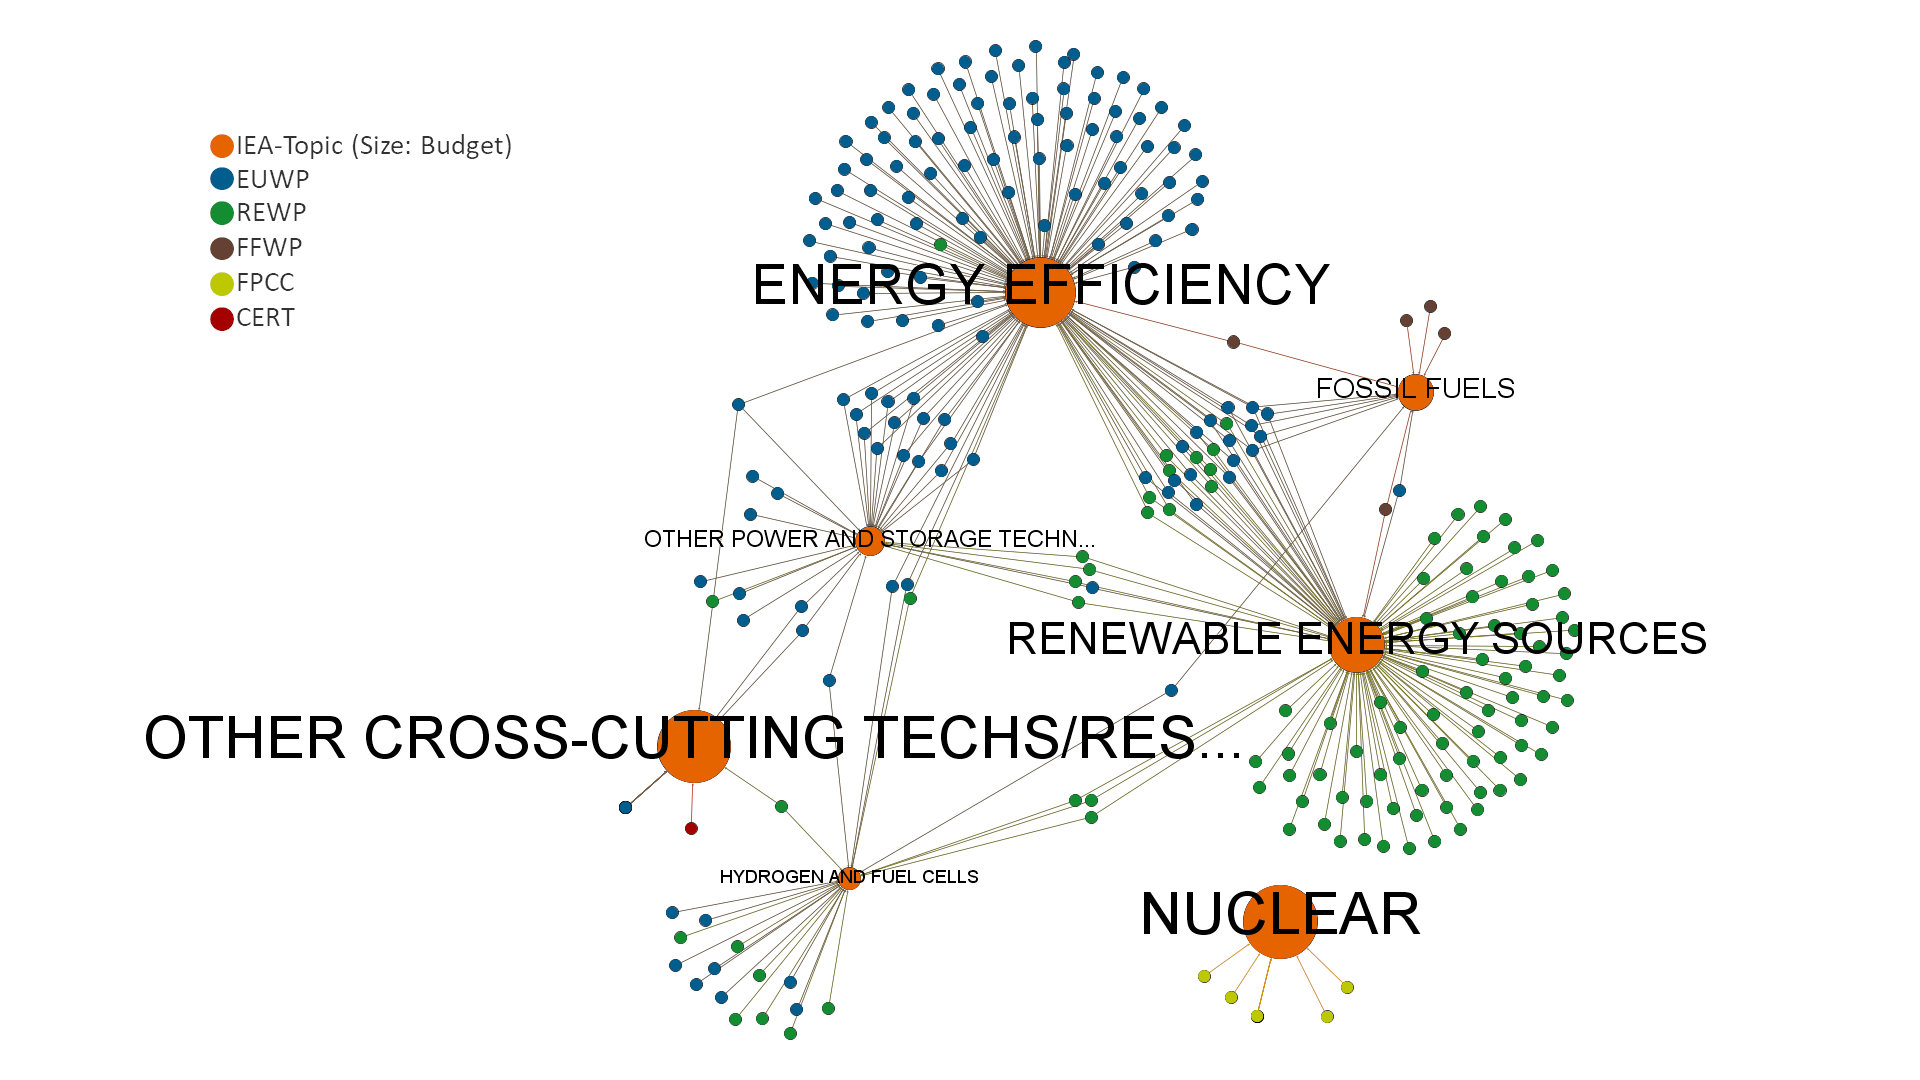
R&D Map
Visualisation of all ongoing Tasks and Annexes ("Activities") and their respective research topics.
Copyright: Austrian Energy Agency
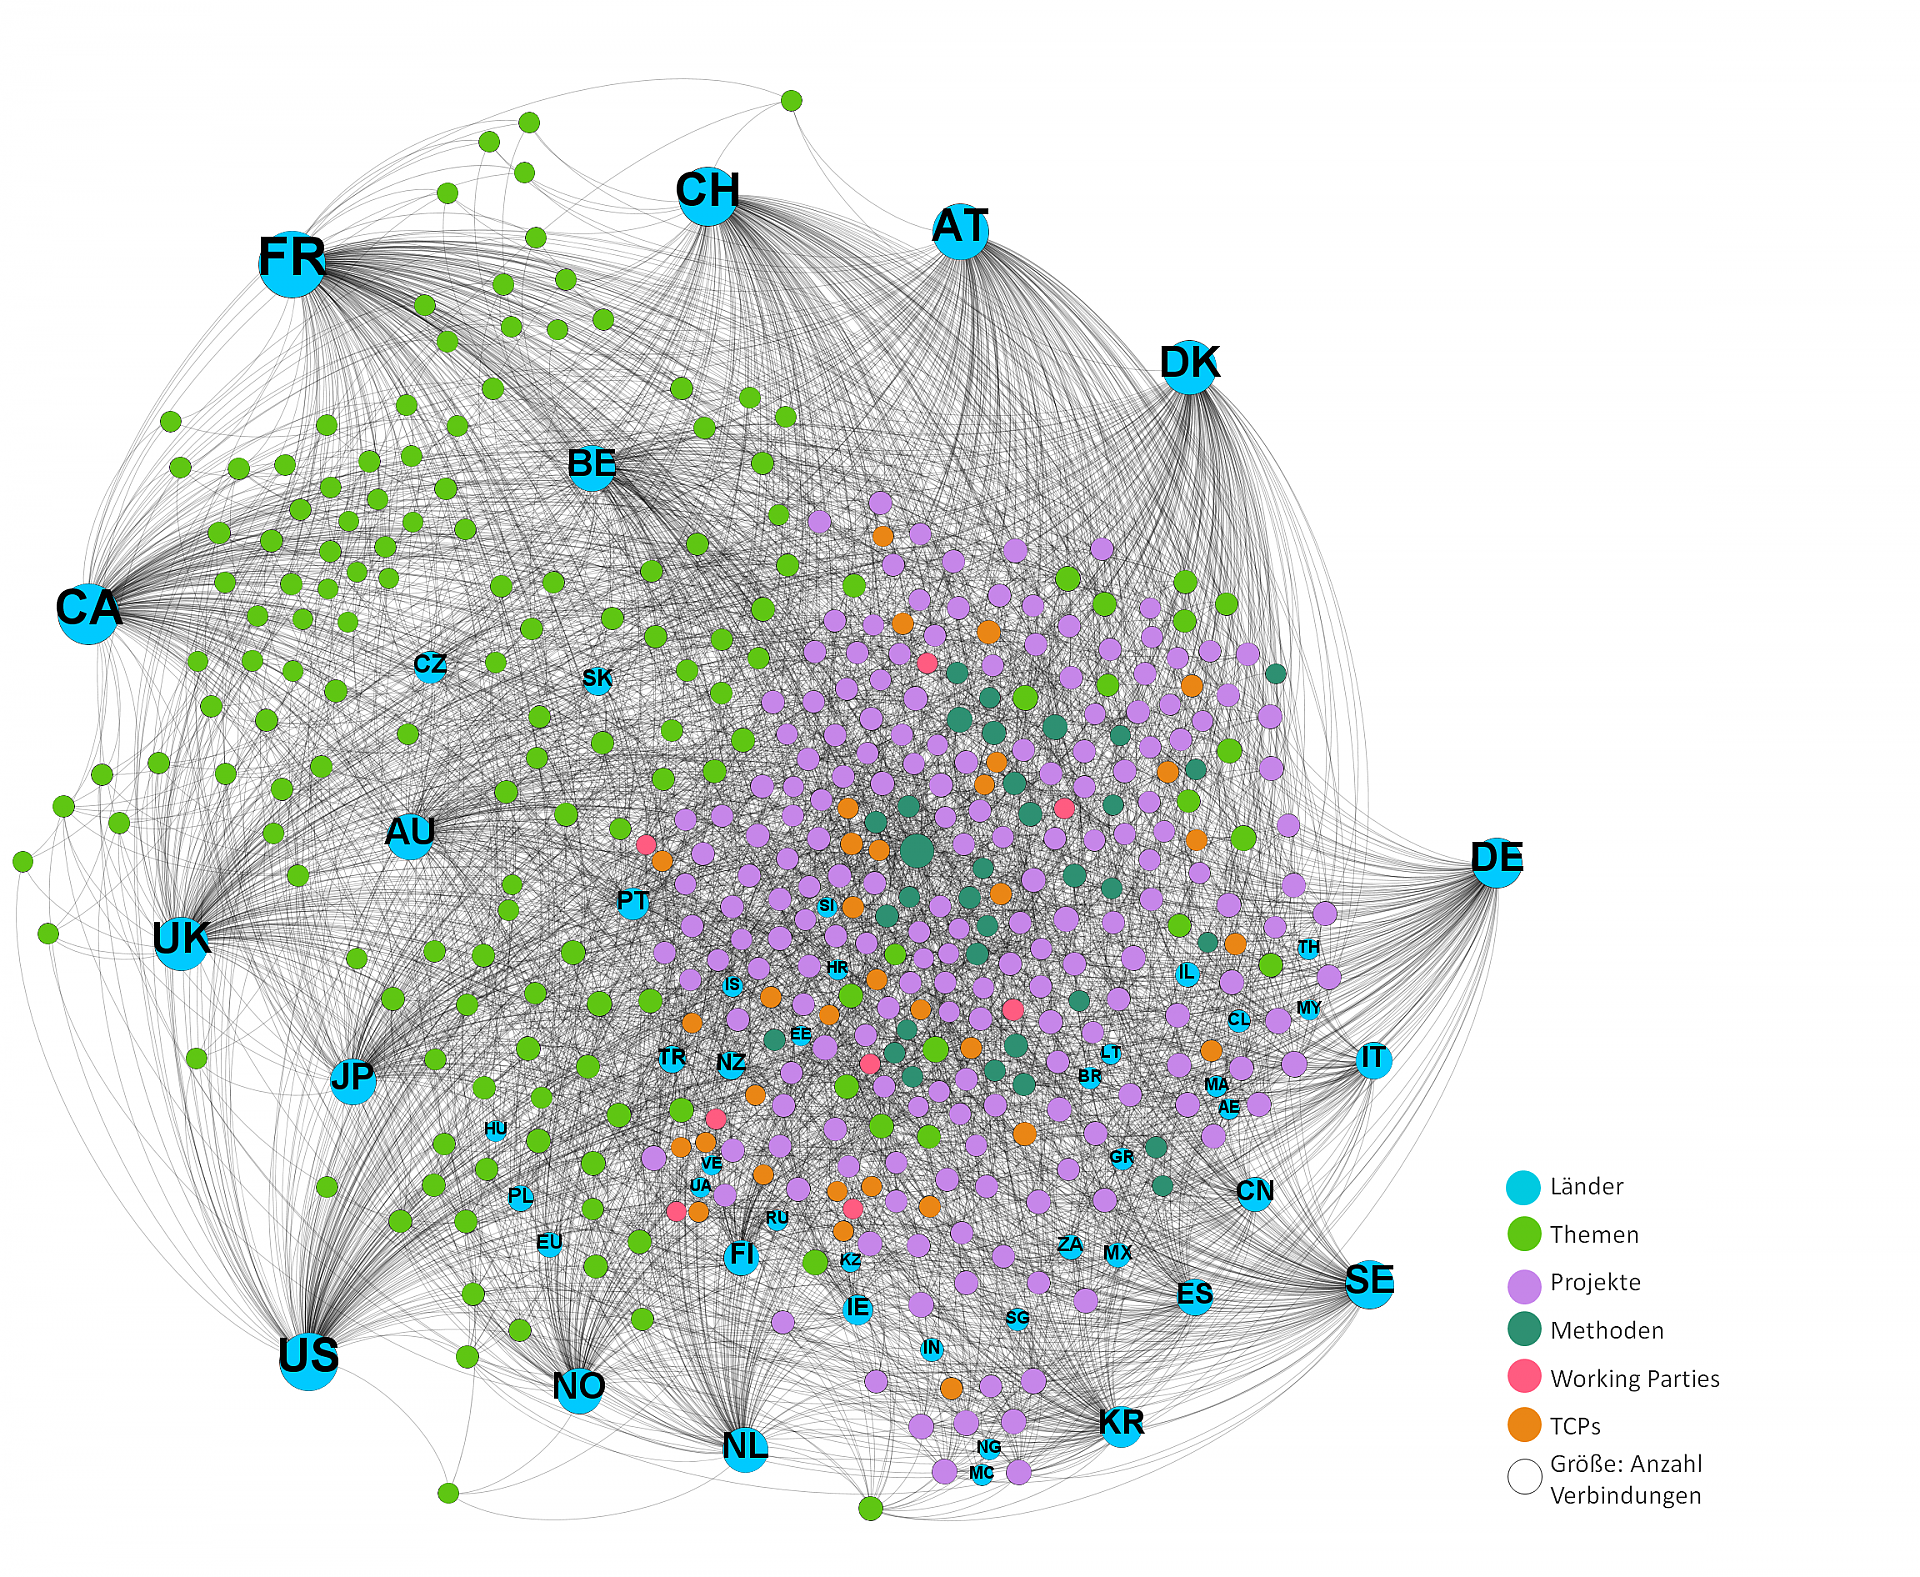
IEA-TCP Graph: Visualization of all nodes and edges in the IEA-TCP data model
Size of the nodes corresponds to the number of connections, color to the type of node (see legend).
Copyright: Österreichische Energieagentur 2018
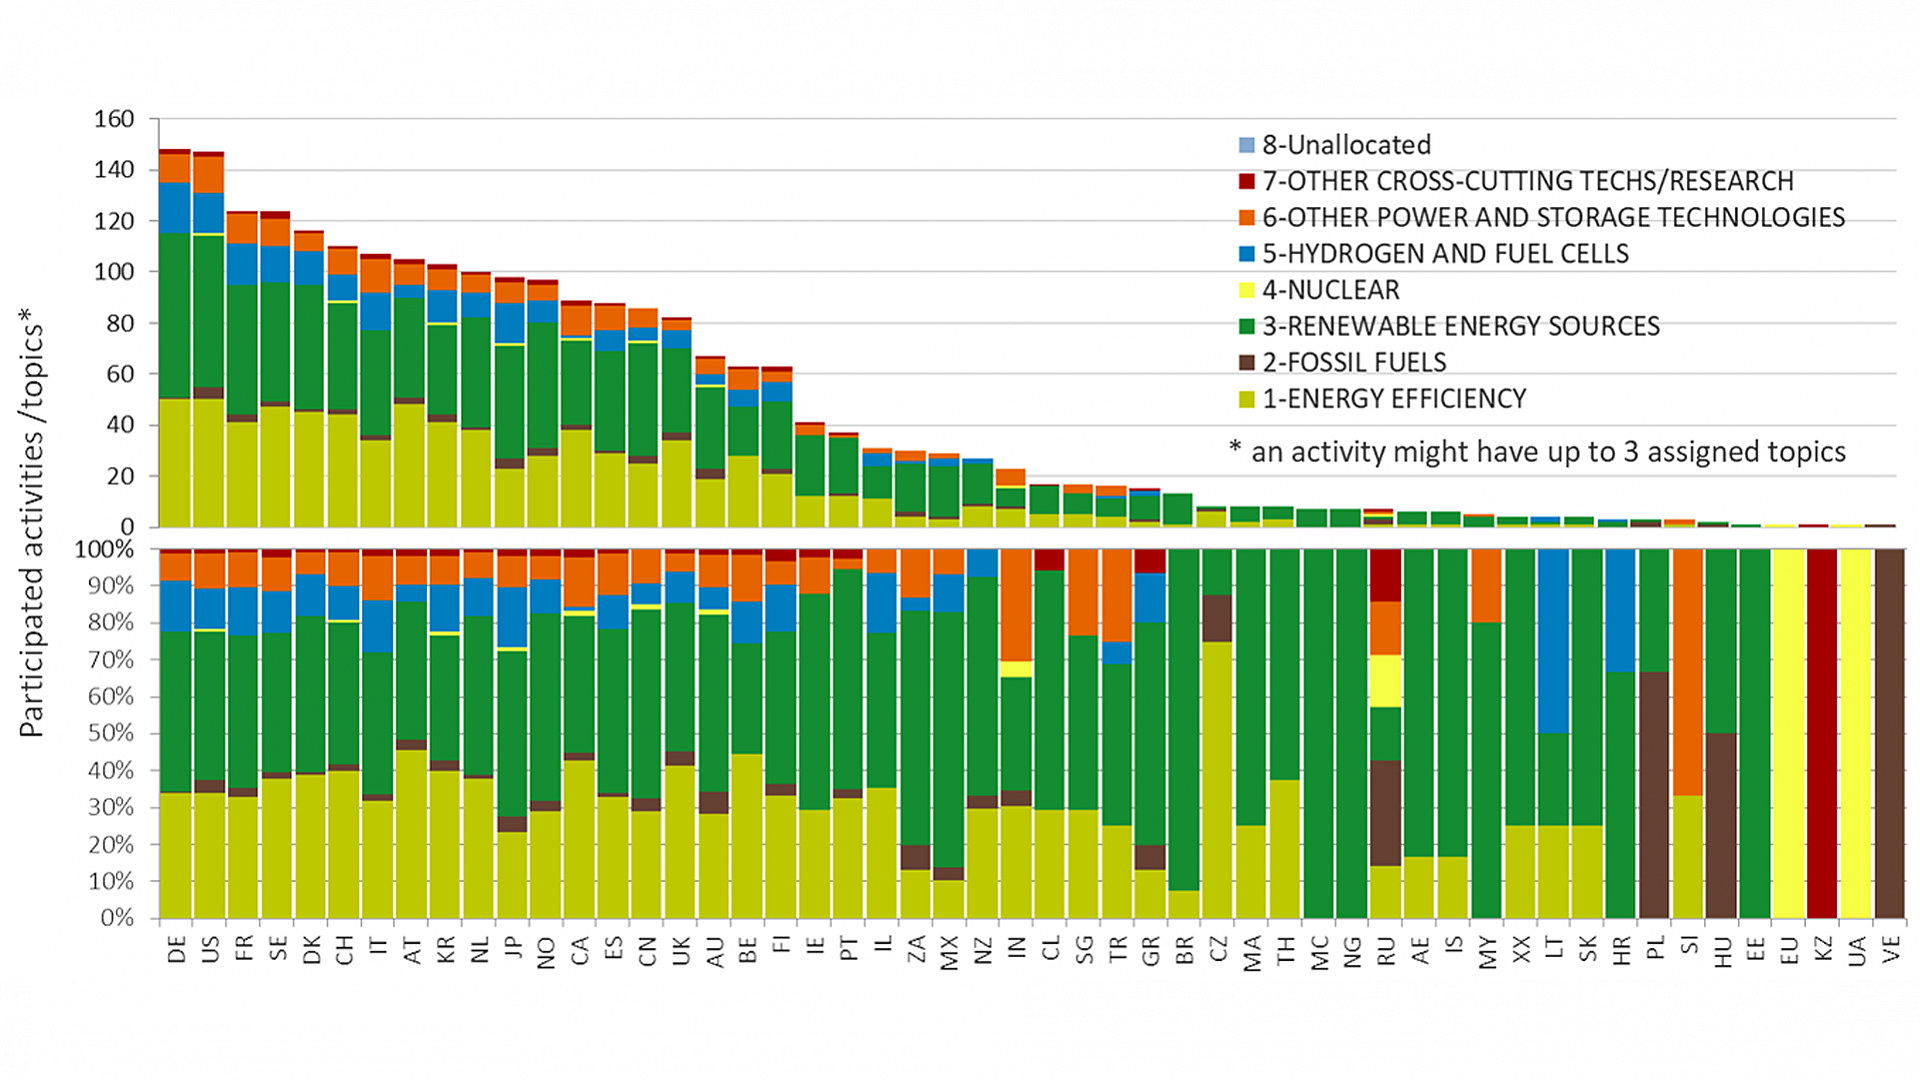
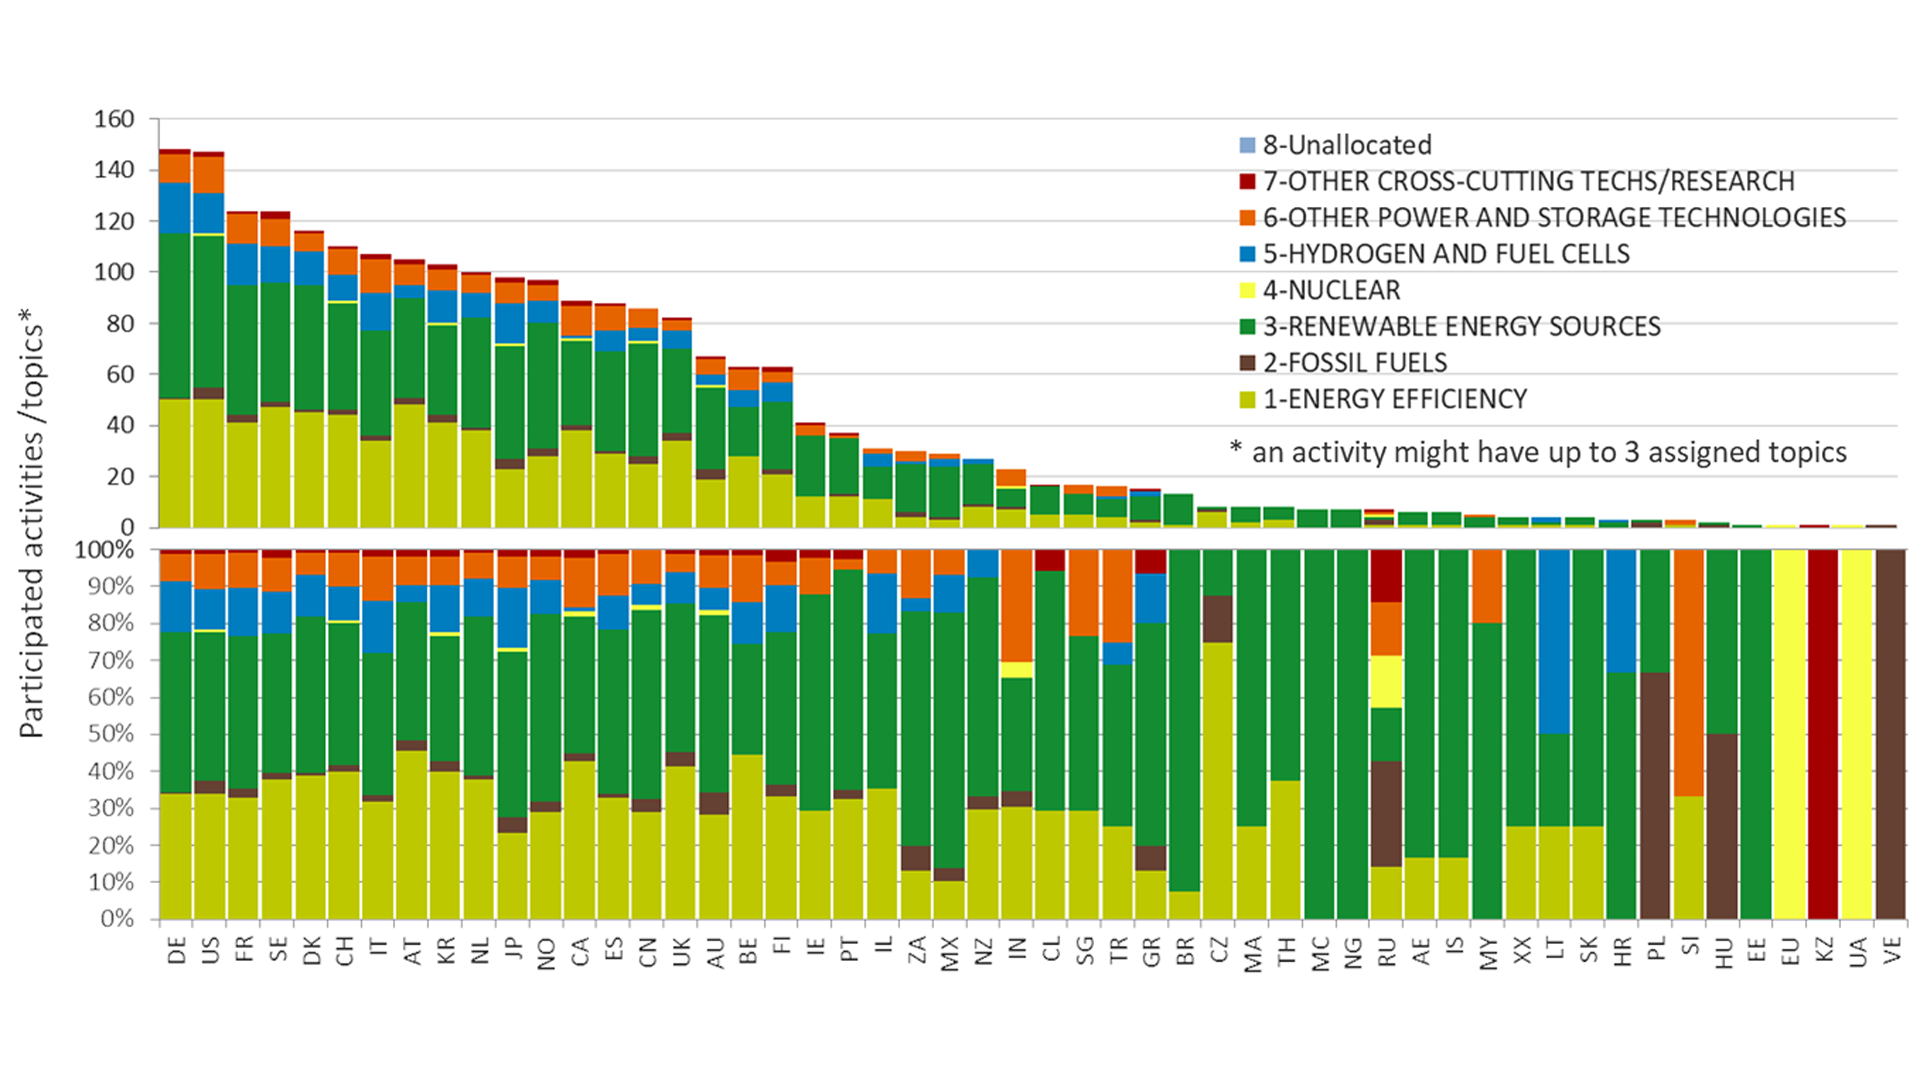
Participation of countries in IEA Technology Collaboration Programmes and Related Research Topics
Absolute (upper chart) and relative (lower chart) number of TCP-activities that countries are participating in. The color code shows how the assigned activities are related to the IEA-Topics and how the countries set their priorities with regard to the research topics (based on the IEA RD&D taxonomy).
Copyright: Österreichische Energieagentur, 2018
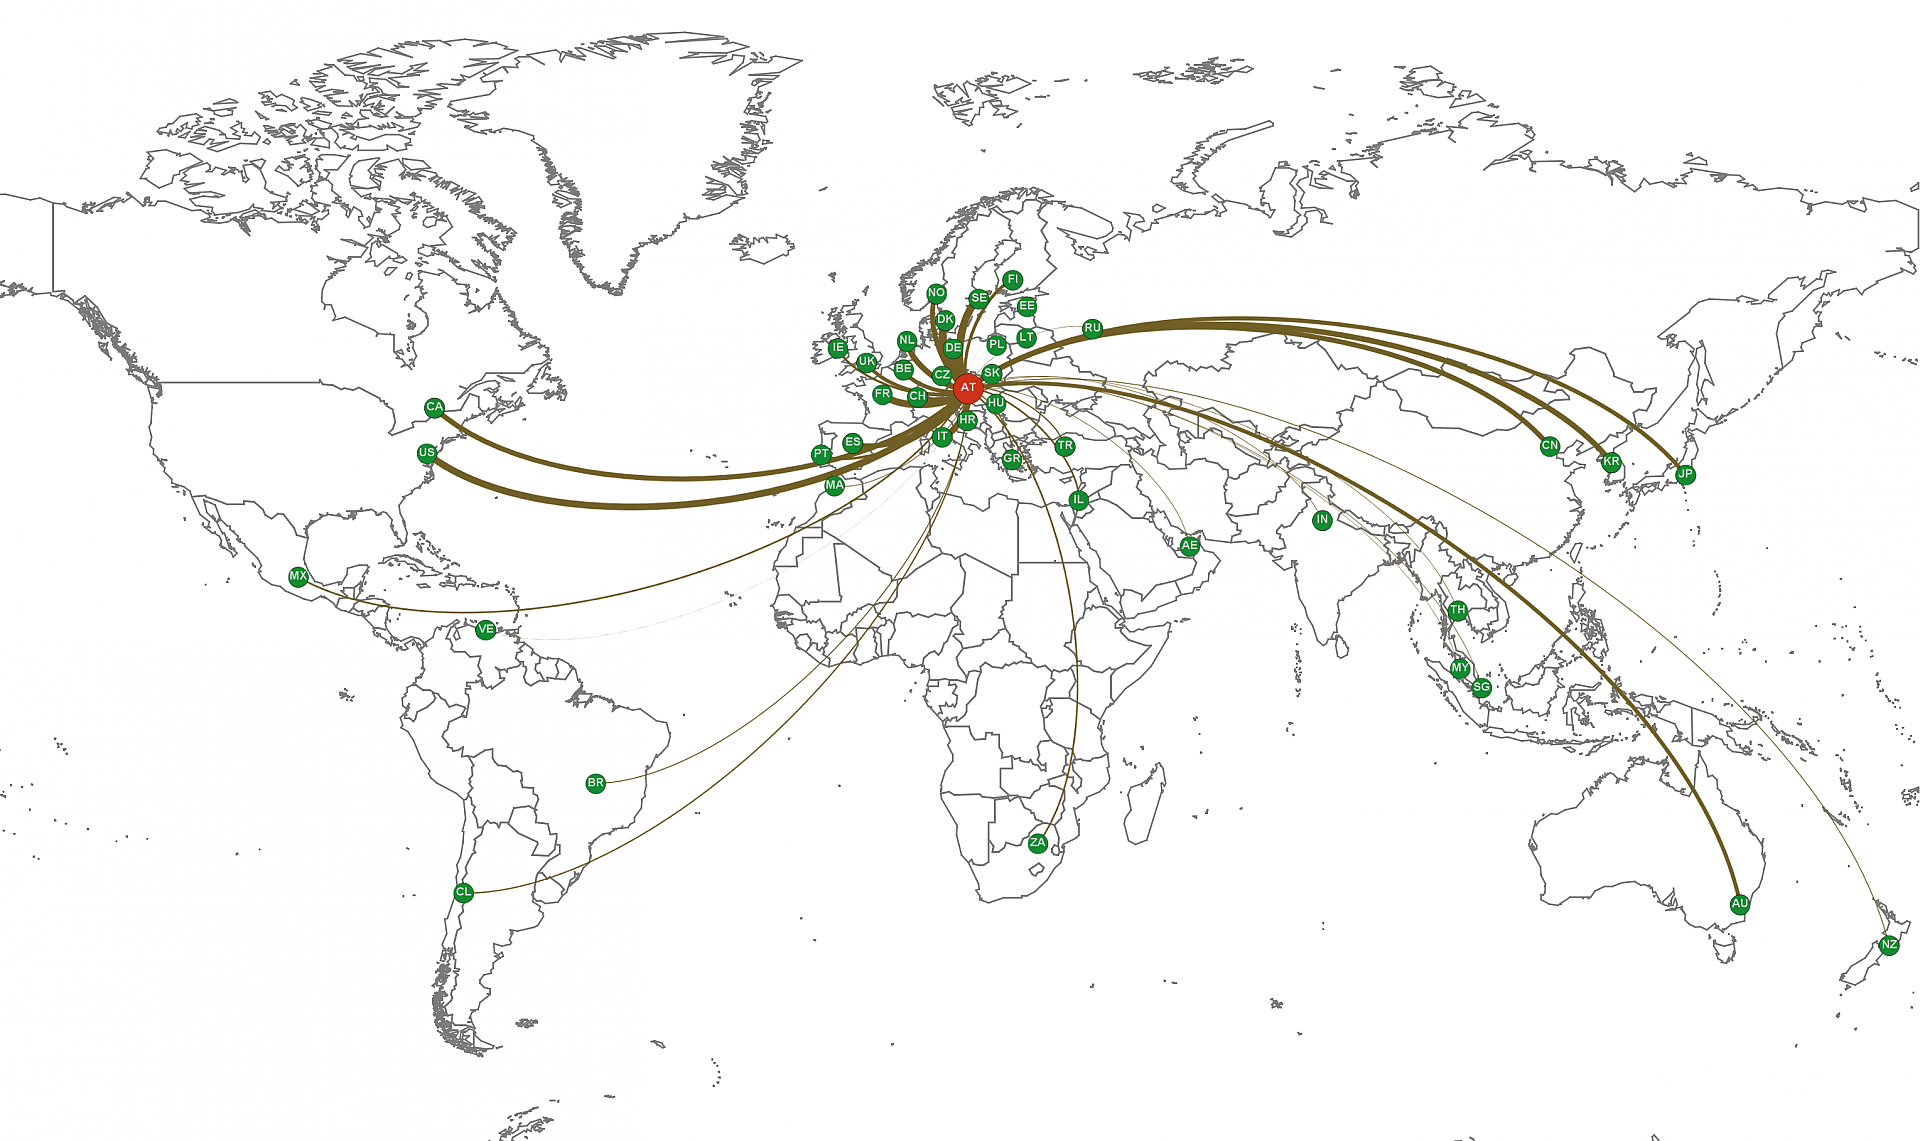
International cooperations of Austria in context of TCP activities.
Worldmap of Austrias cooperations with other countries in context of the IEA Technology Collaboration Program reasearch activities. Line thickness indicates the number of cooperations.
Copyright: Österreichische Energieagentur 2018
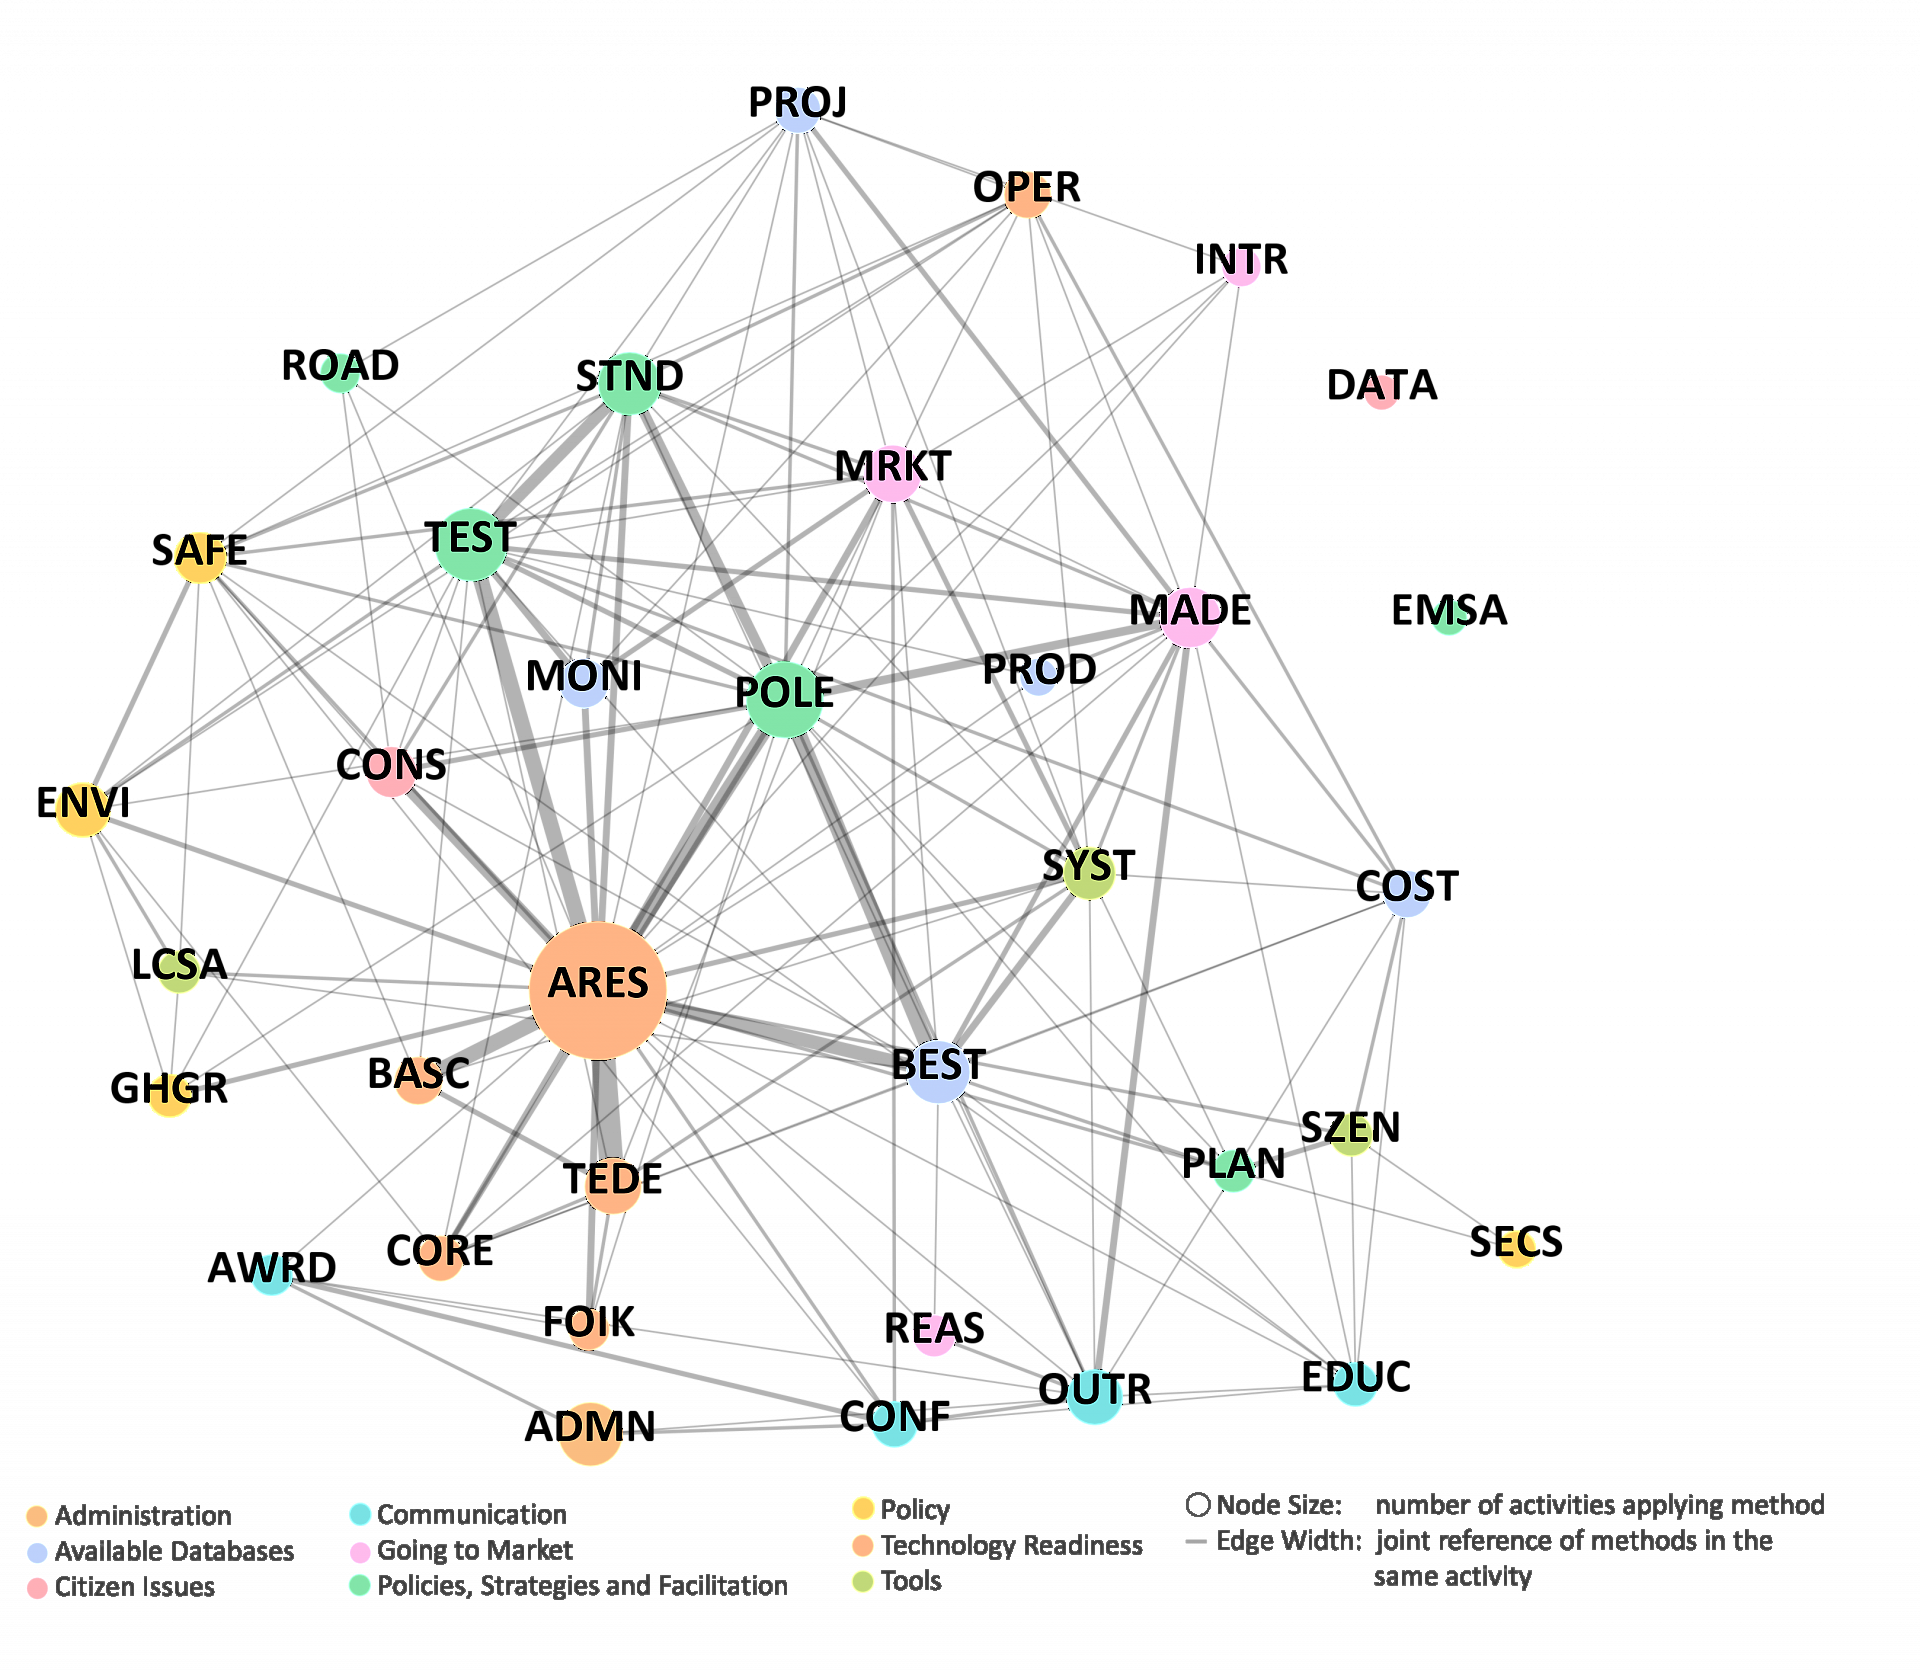
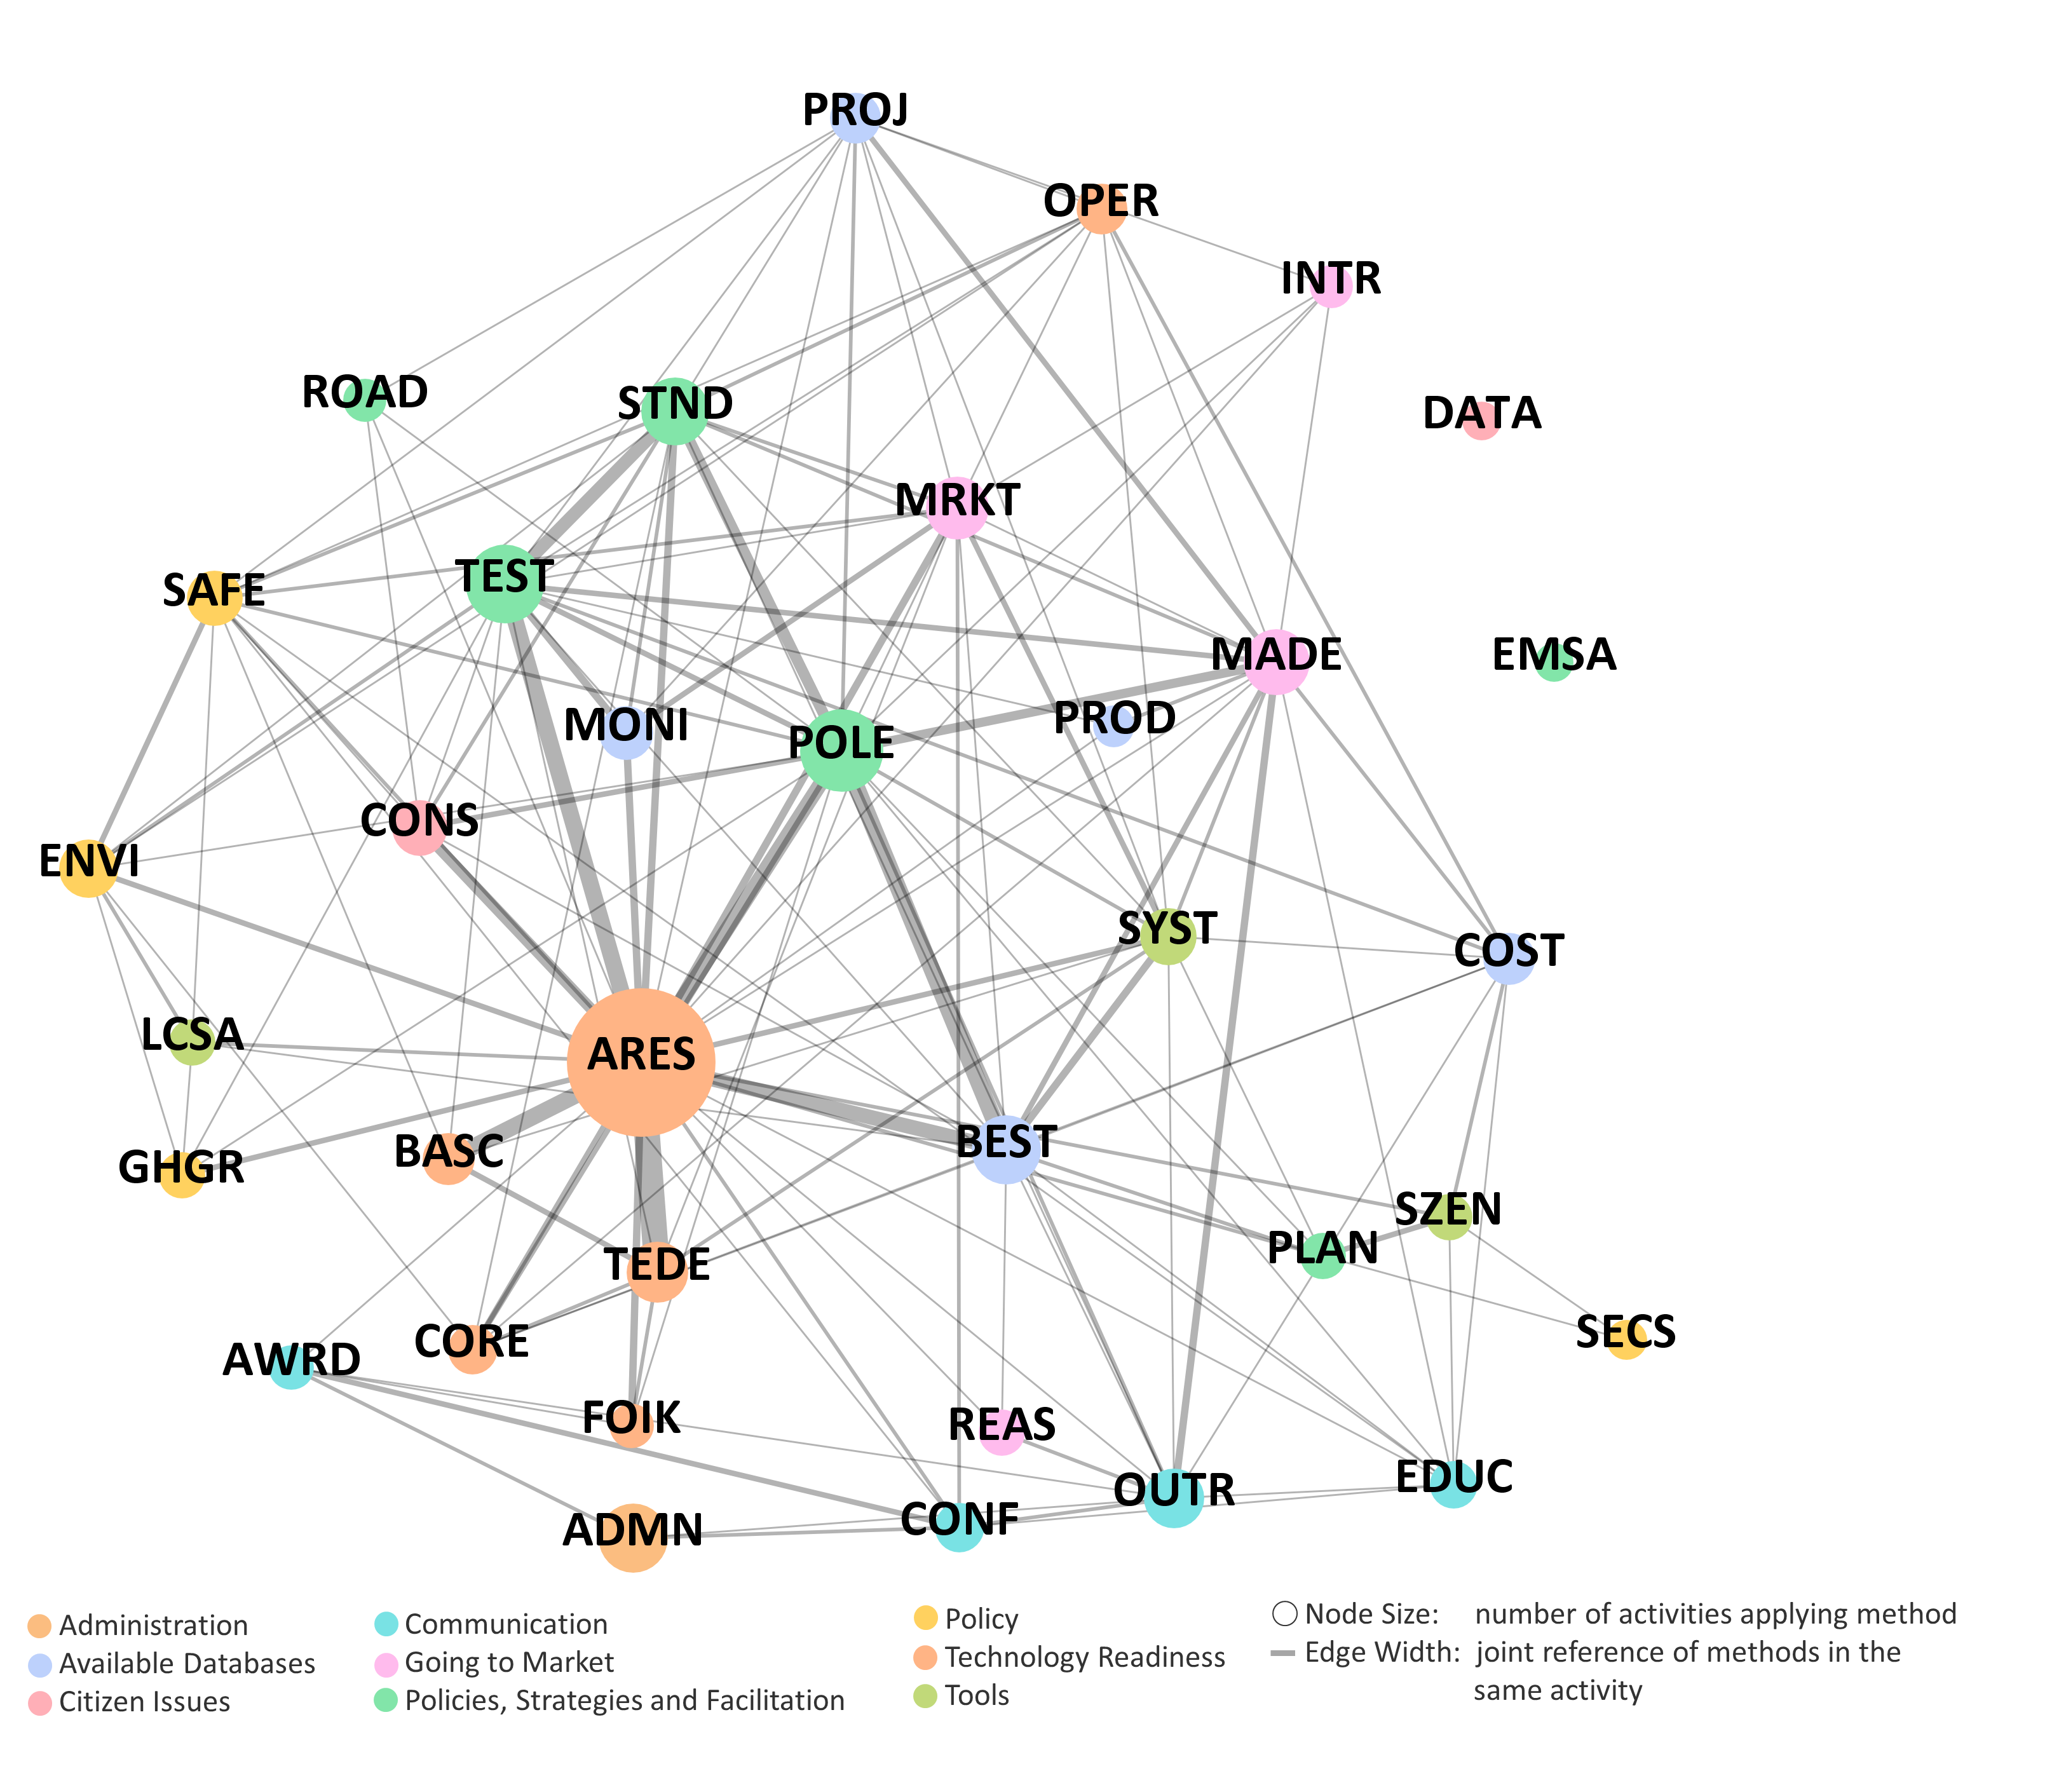
Combination of Methods used by TCP-Activities
A set of methods was developed to categorize the kind of project work that is done in the activities. The figure shows which methods are applied how often in total (node size), and which methods were frequently applied together (edge width) by activities. The color corresponds to the different method cate-gories described in chapter.