Project Image Pool
There are 404 results.
Terms of use: The pictures on this site originate from the projects in the frame of the programmes City of Tomorrow, Building of Tomorrow and the IEA Research Cooperation. They may be used credited for non-commercial purposes under the Creative Commons License Attribution-NonCommercial (CC BY-NC).
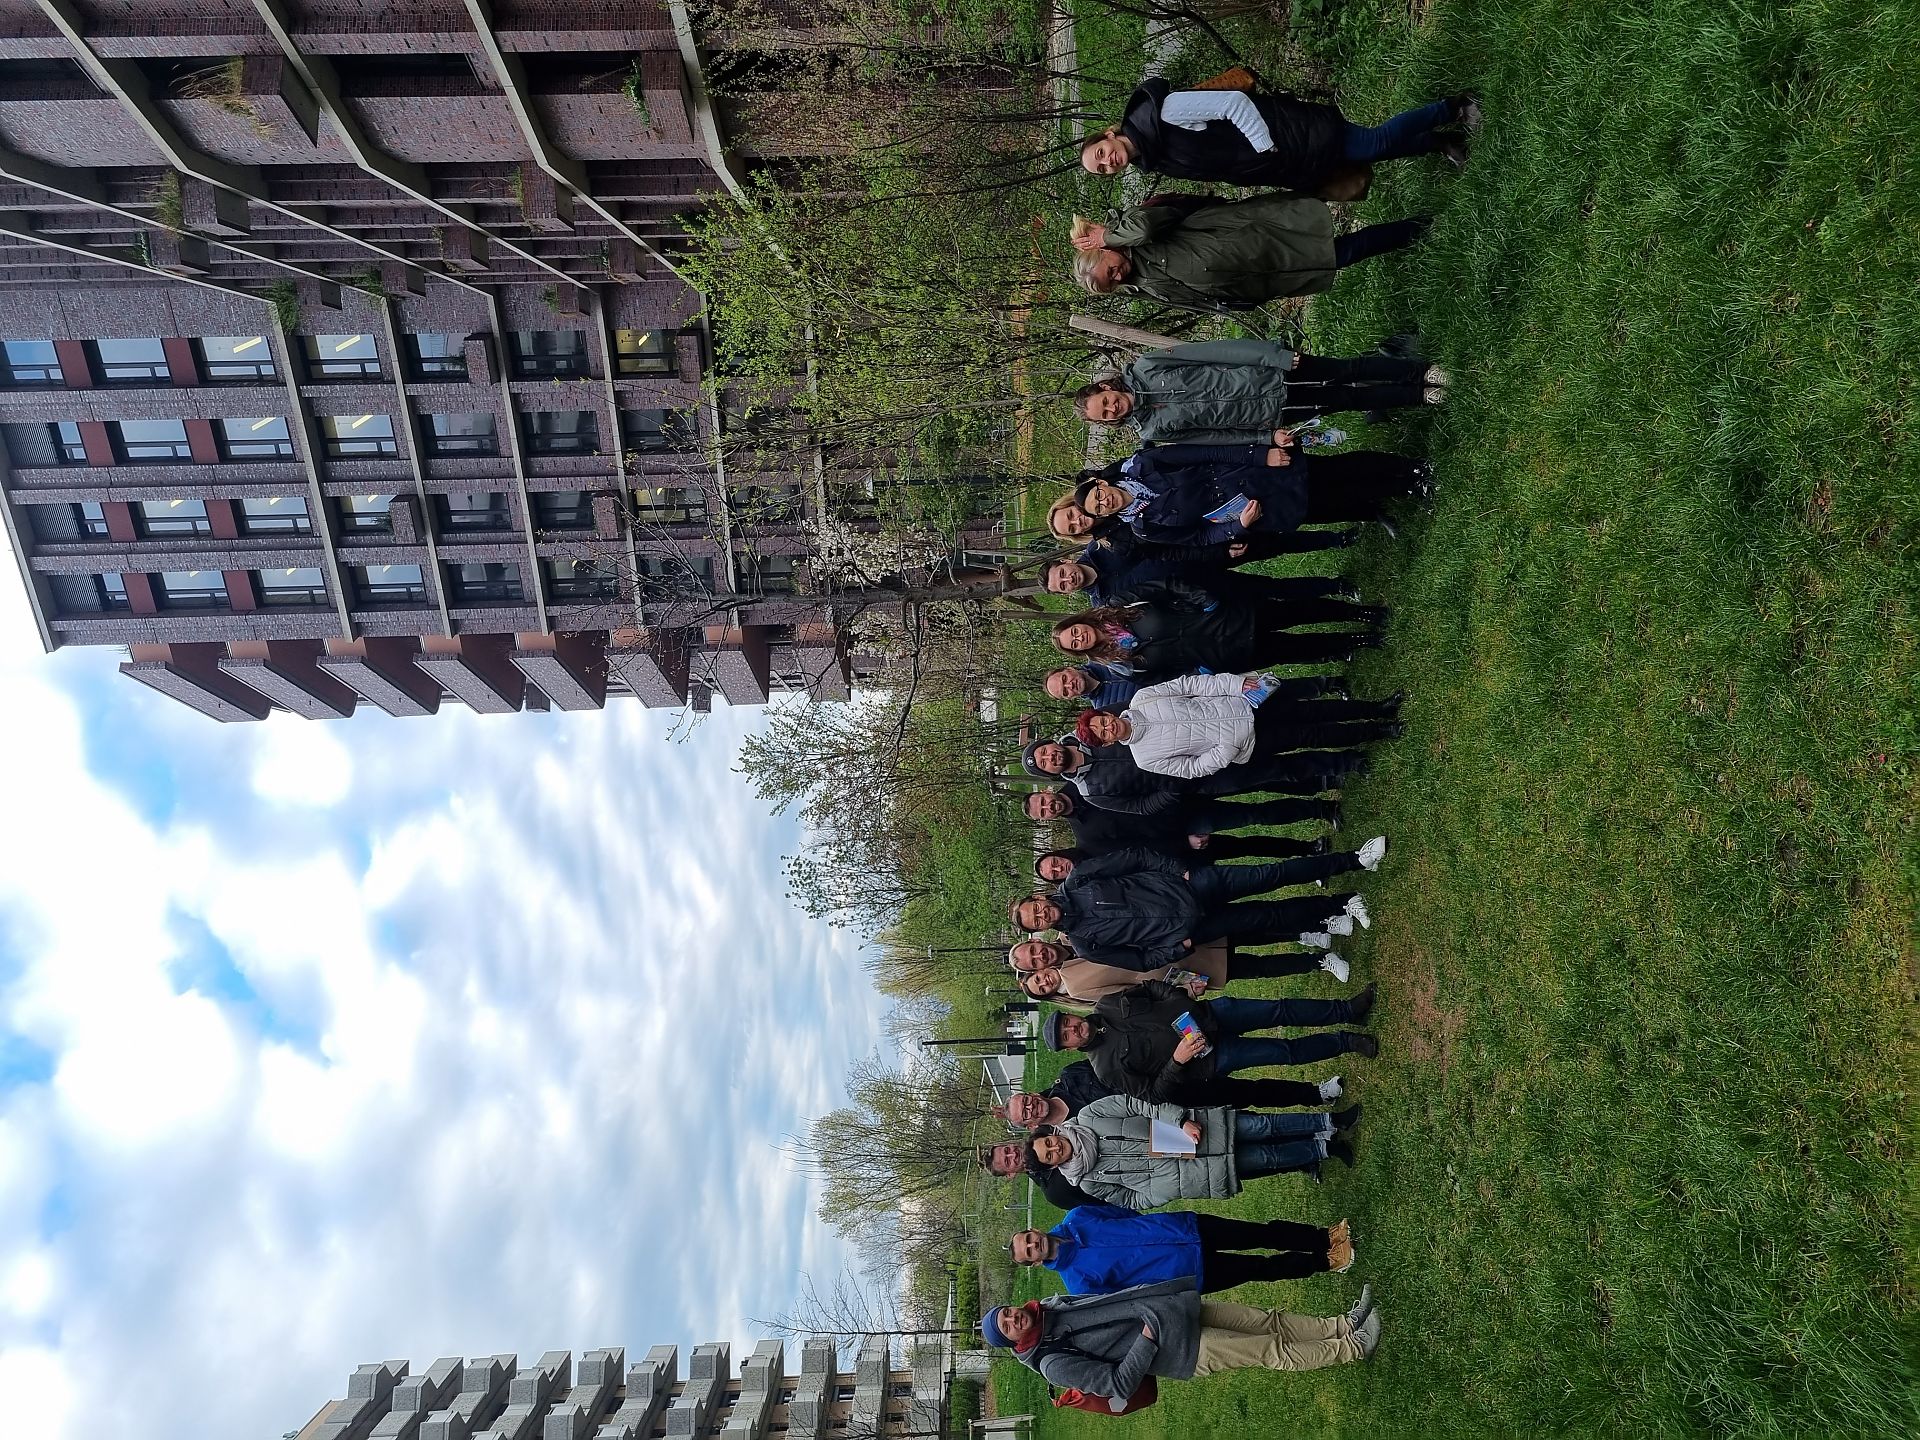
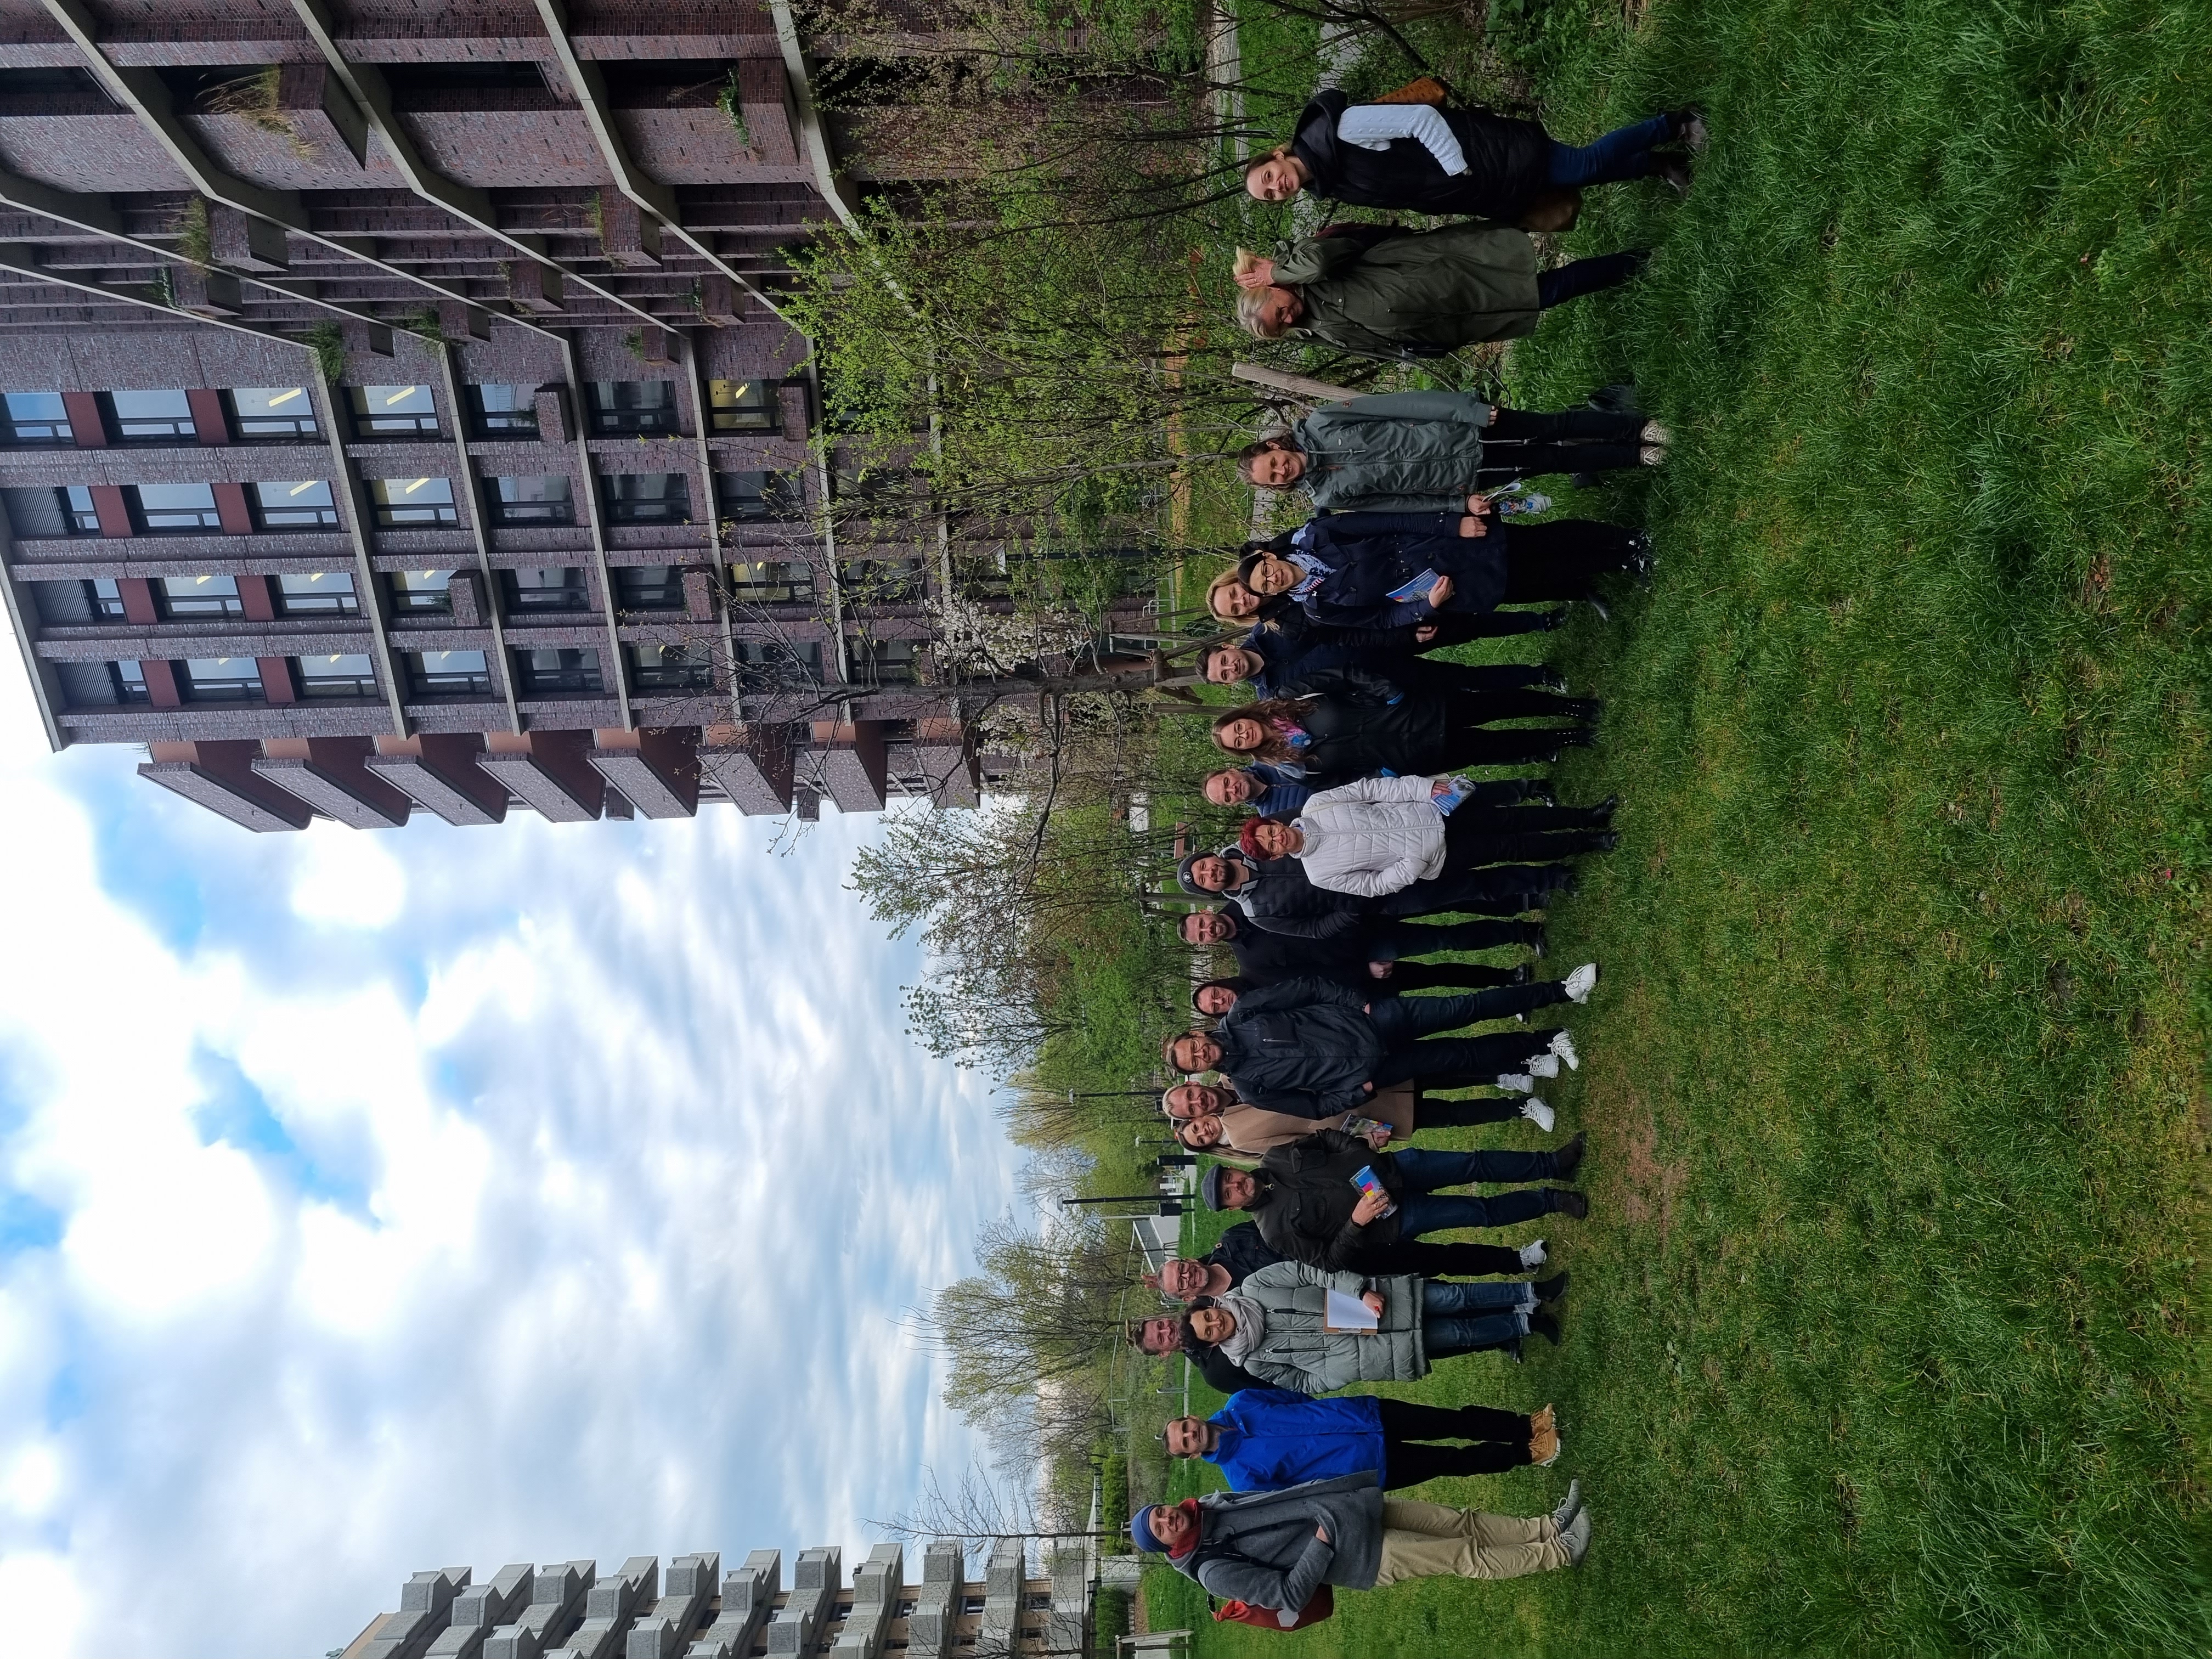
Group photo Study tour on urban greening and renovation projects in Vienna
The picture shows the participants of the study tour to Vienna, which was carried out as part of the project "Reallabor Gebäude - Gebäude als Reallabor für klimaneutrales, bedarfsgerechtes und leistbares Wohnen".
Copyright: StadtLABOR Innovationen für urbane Lebensqualität GmbH
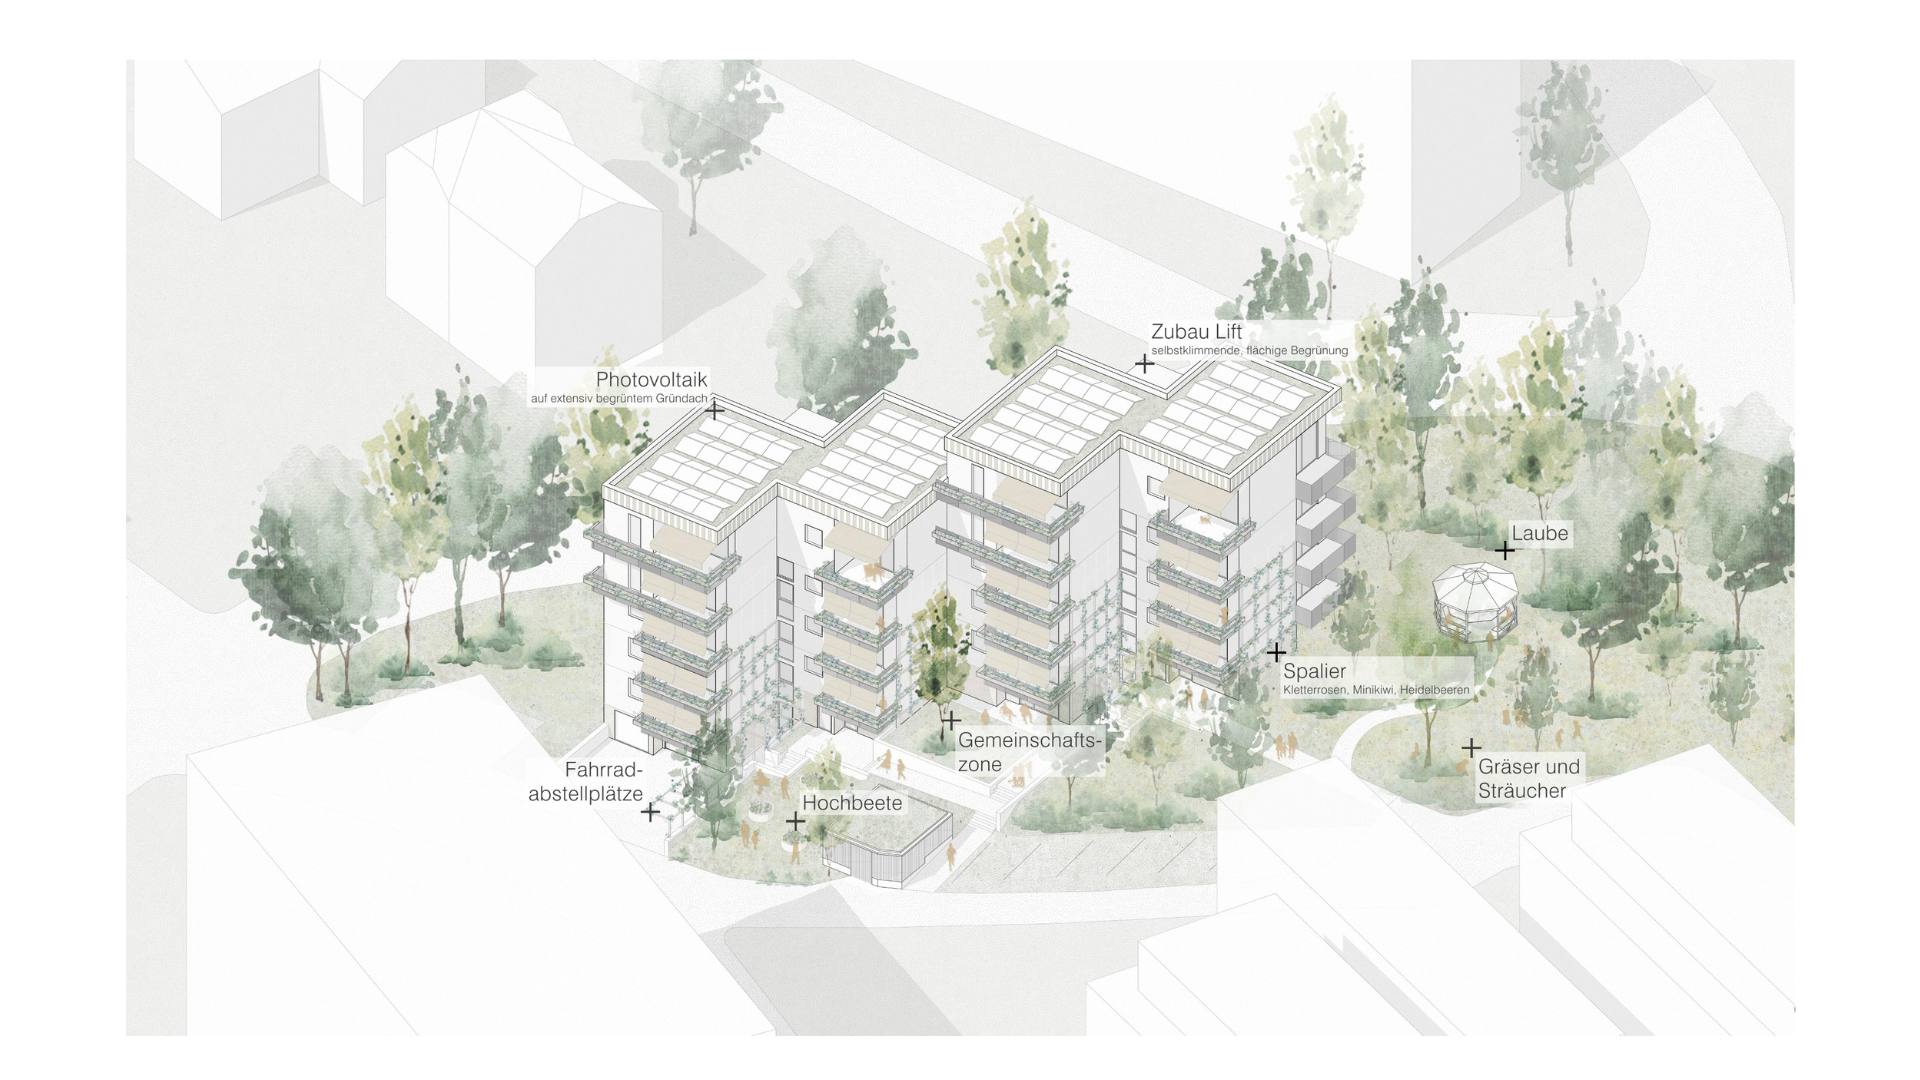
Axonometry architectural study in the project "Reallabor Gebäude - Gebäude als Reallabor für klimaneutrales, bedarfsgerechtes und leistbares Wohnen"
The illustration shows an excerpt from the architectural study that was carried out as part of the project "Reallabor Gebäude - Gebäude als Reallabor für klimaneutrales, bedarfsgerechtes und leistbares Wohnen". This is a refurbishment project including an extension.
Copyright: Gangoly & Kristiner Architekten ZT GmbH
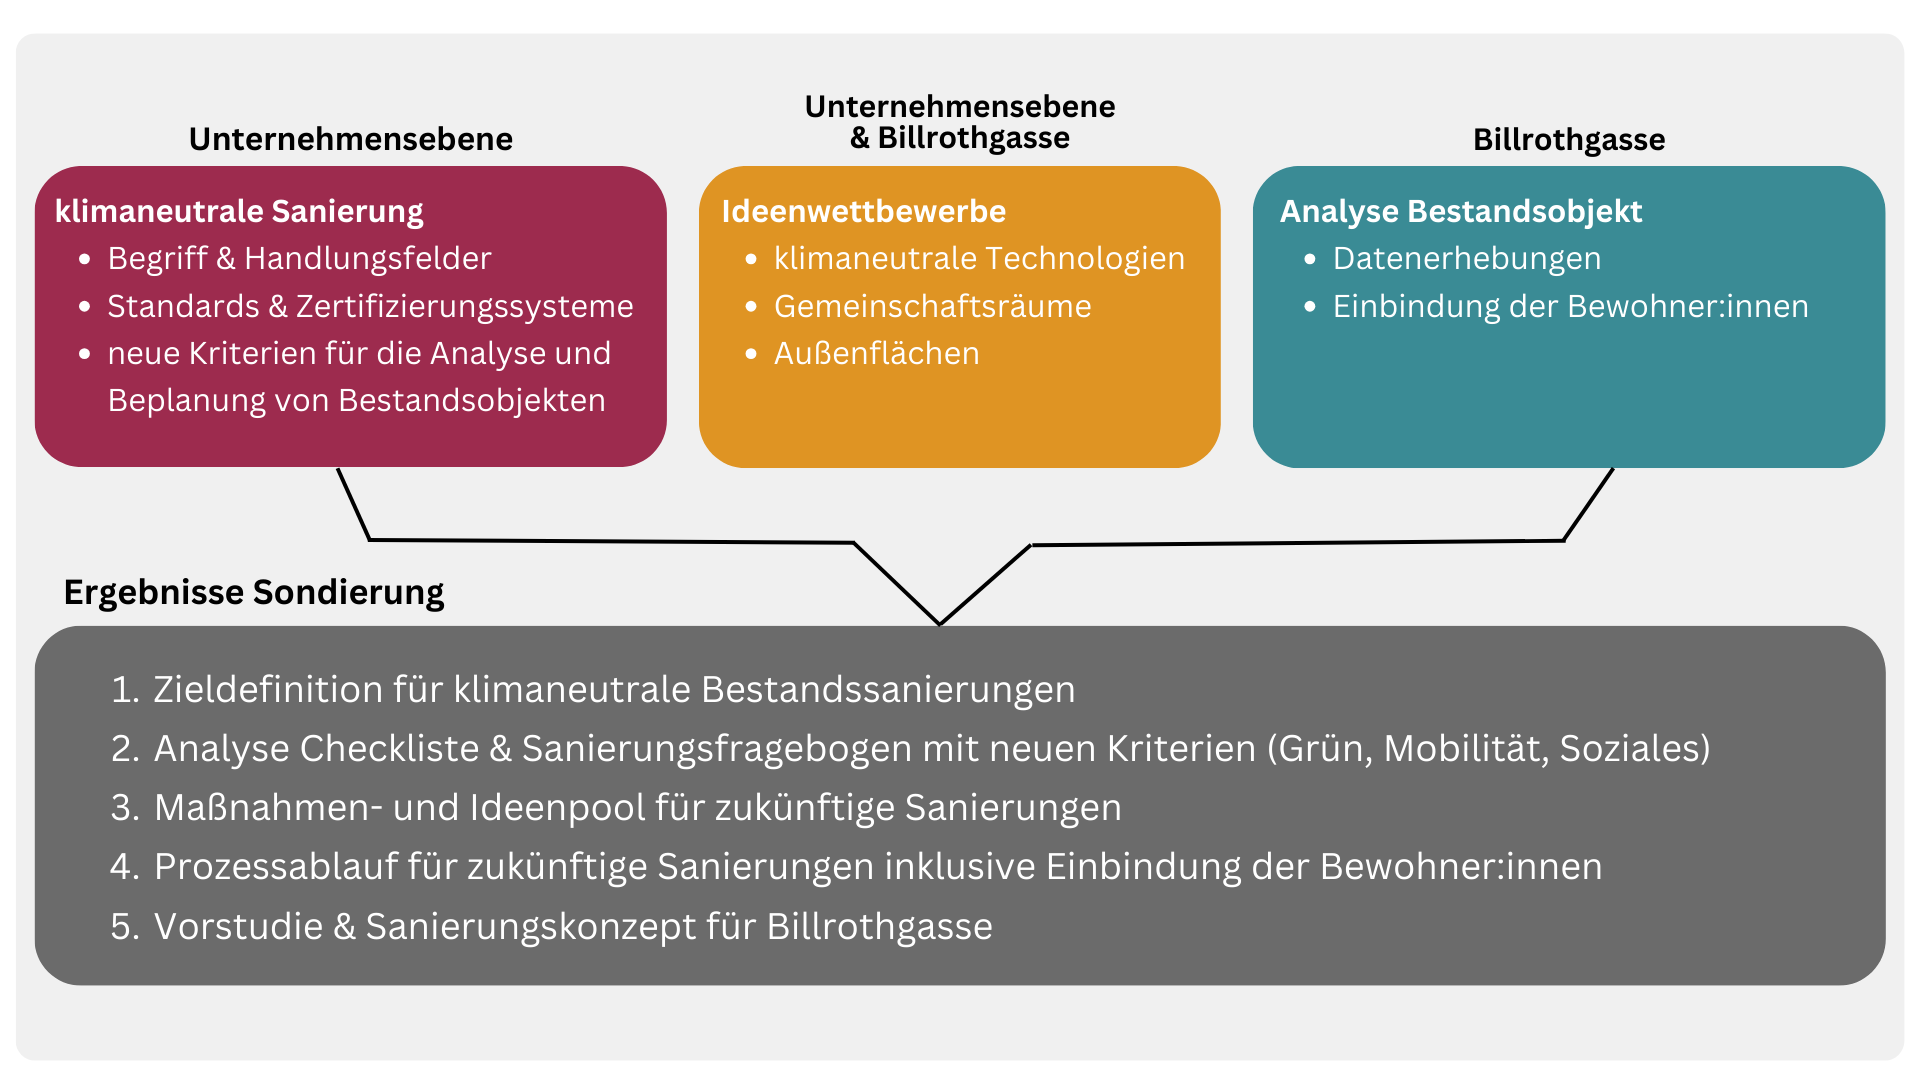
Big picture exploratory project "Gebäude als Reallabor für klimaneutrales, bedarfsgerechtes und leistbares Wohnen"
The illustration shows a big picture of the exploratory project "Gebäude als Reallabor für klimaneutrales, bedarfsgerechtes und leistbares Wohnen". The graphic shows the objectives and planned results of the exploratory project.
Copyright: StadtLABOR Innovationen für urbane Lebensqualität GmbH
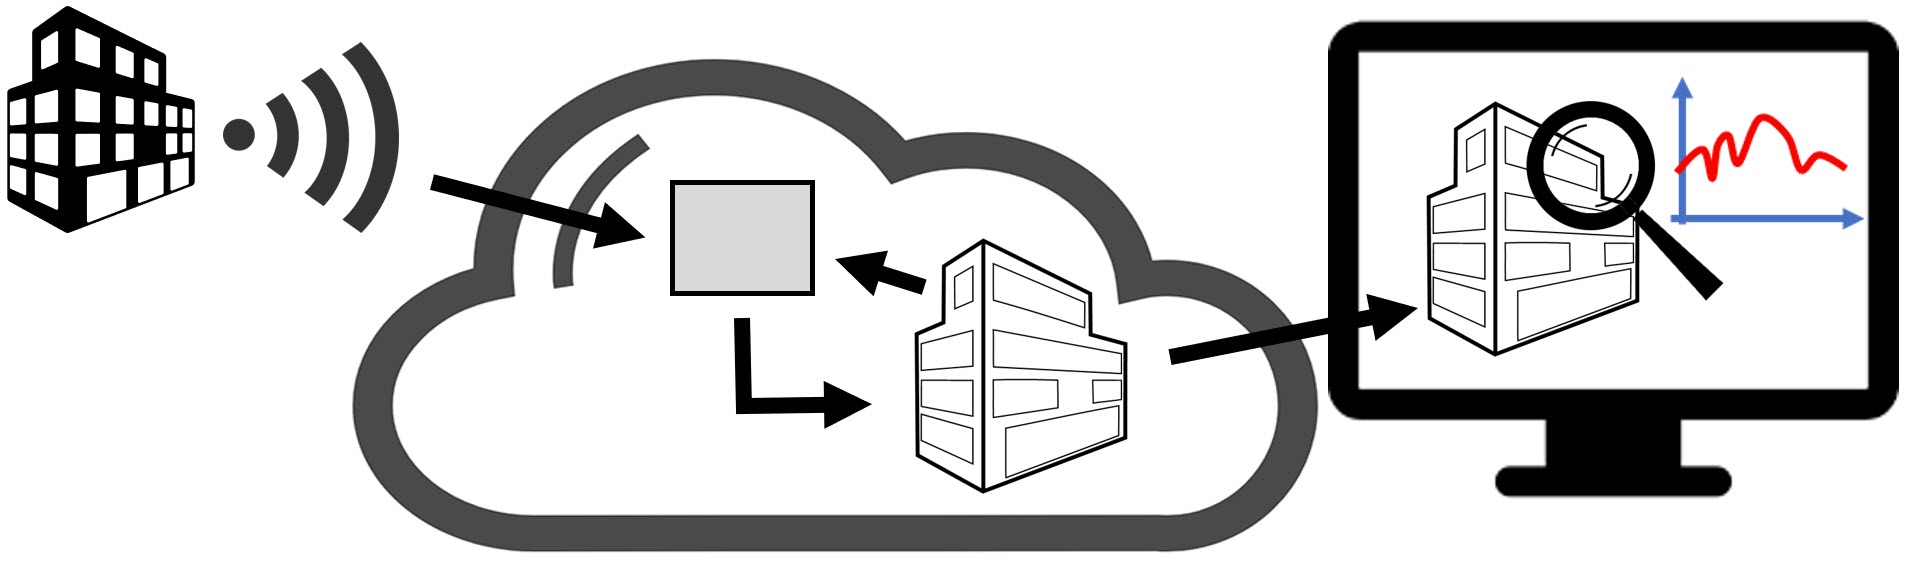
Graphic representation of a digital twin
Graphic representation of a digital twin connected to real-time metering data from a building. The digital twin runs in a cloud. With the so-called State Estimator, the simulation model is continuously adapted to the current measurement data from the building.
Copyright: EQUA
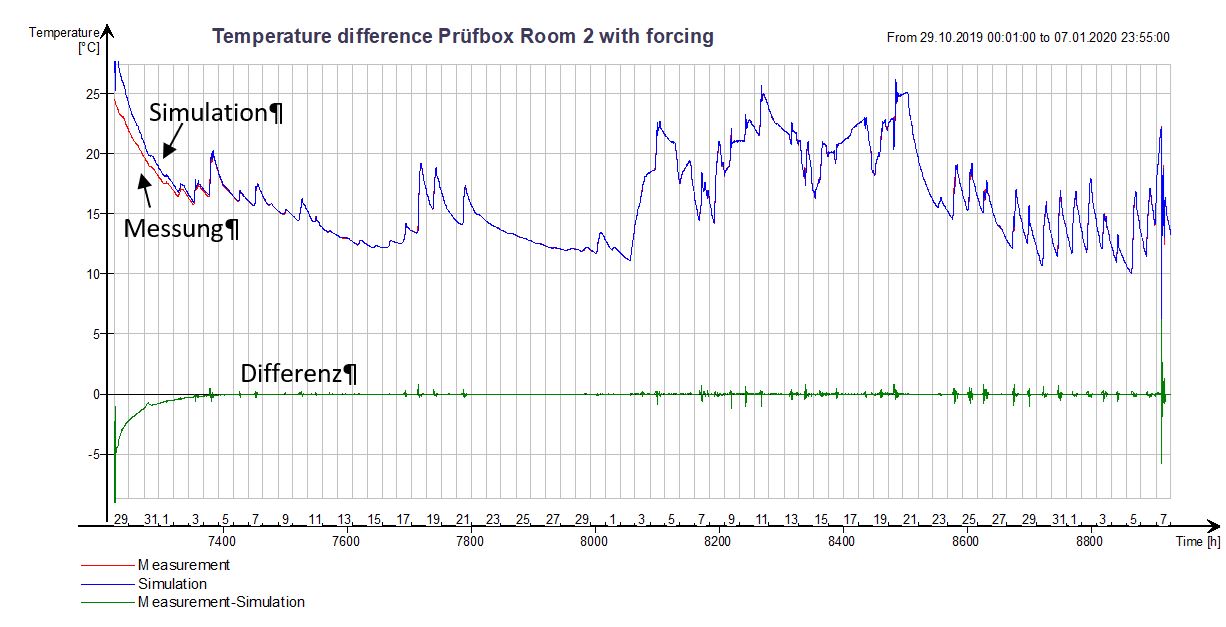
Time series with forcing terms
Time series of an experiment where the digital twin was adapted to the measurement data using forcing terms. At the beginning of the experiment, the measured and simulated temperatures do not yet match. After that, the differences between the two values are very small. See also other image showing the heat sources and sinks needed for this.
Copyright: EQUA
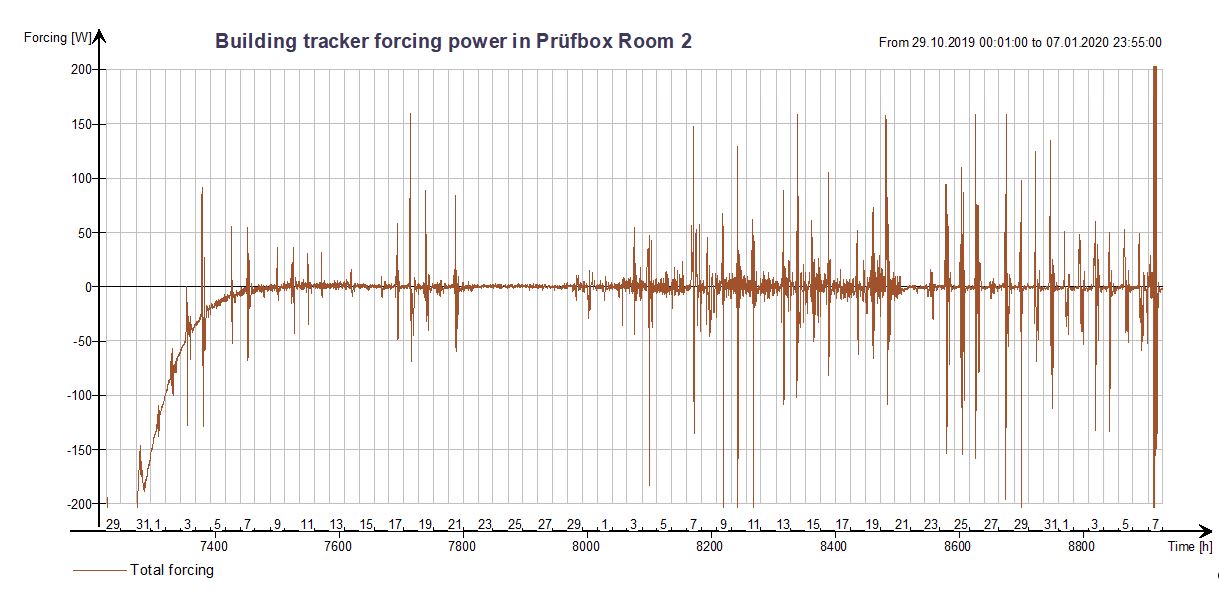
Calculated heat sources and sinks for the digital twin
Time series of an experiment where the digital twin was fitted to the measurement data using forcing terms. The graphic shows the required "Forcing Terms" = heat sources and sinks. See also the other graph with the associated measured and simulated temperatures during the experiment.
Copyright: EQUA

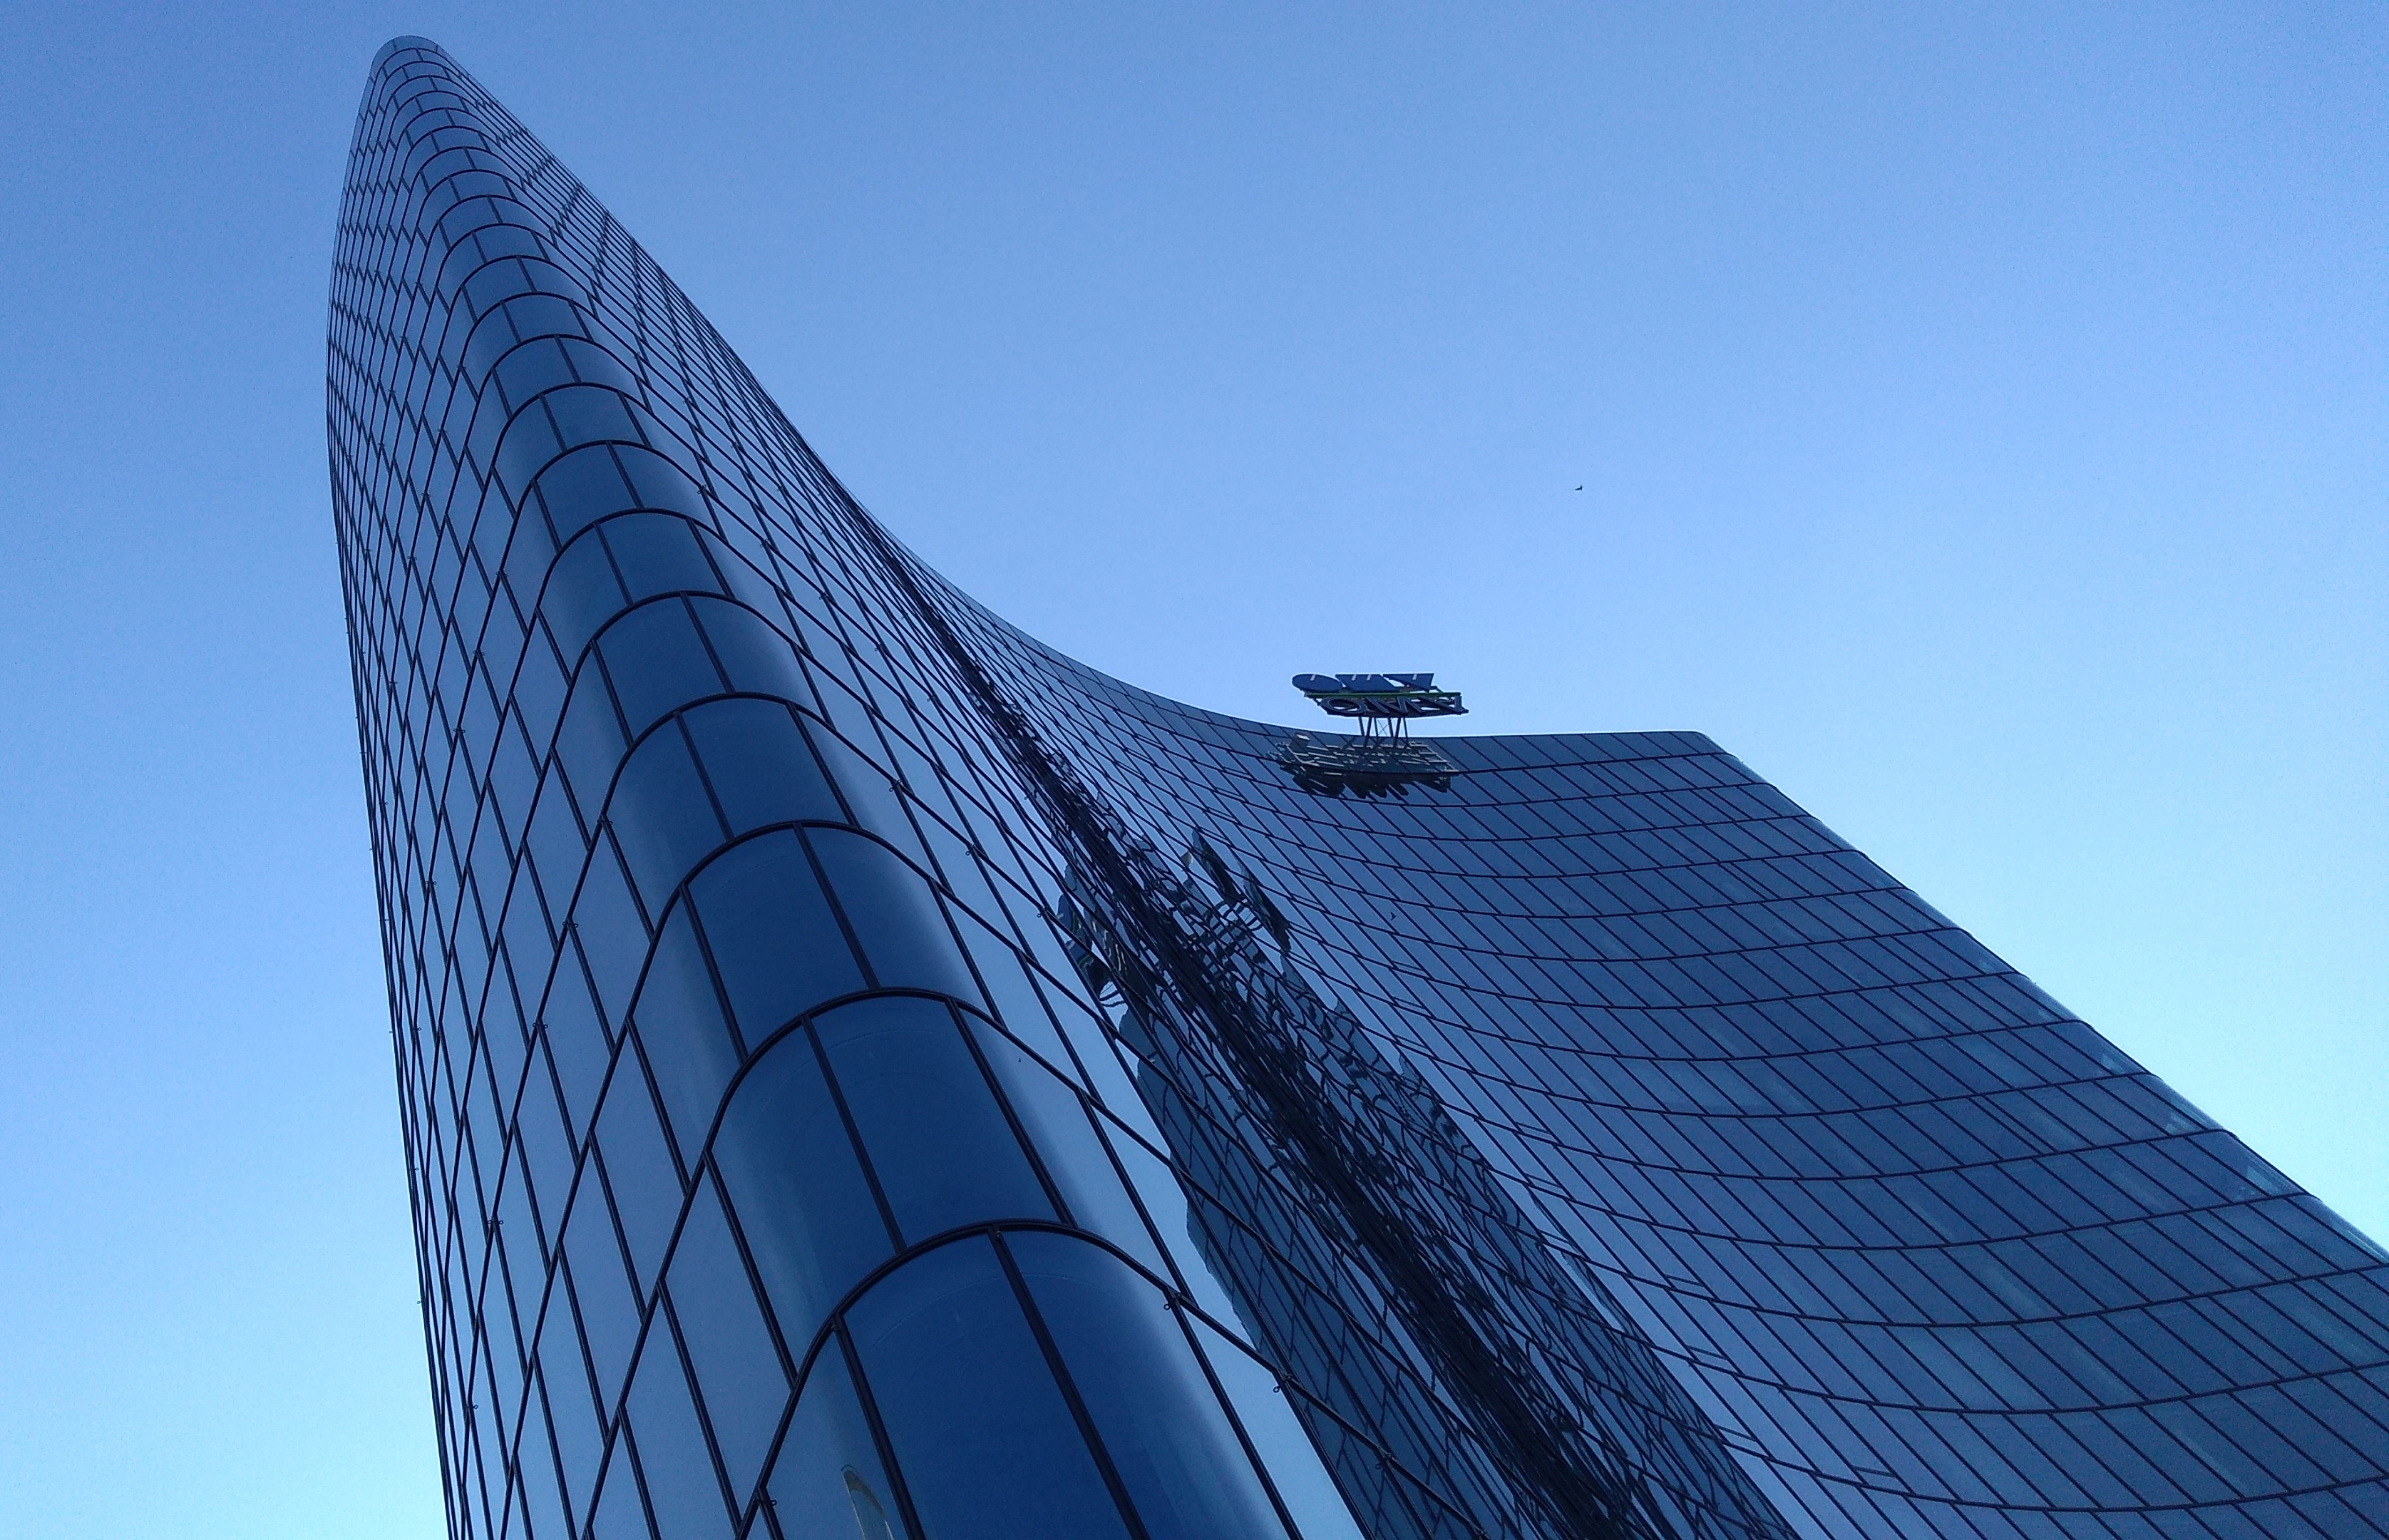
Façade office building H2
View of the facade of the H2 office building in Vienna, where a digital twin of a cooling system and a model floor was tested.
Copyright: AEE INTEC

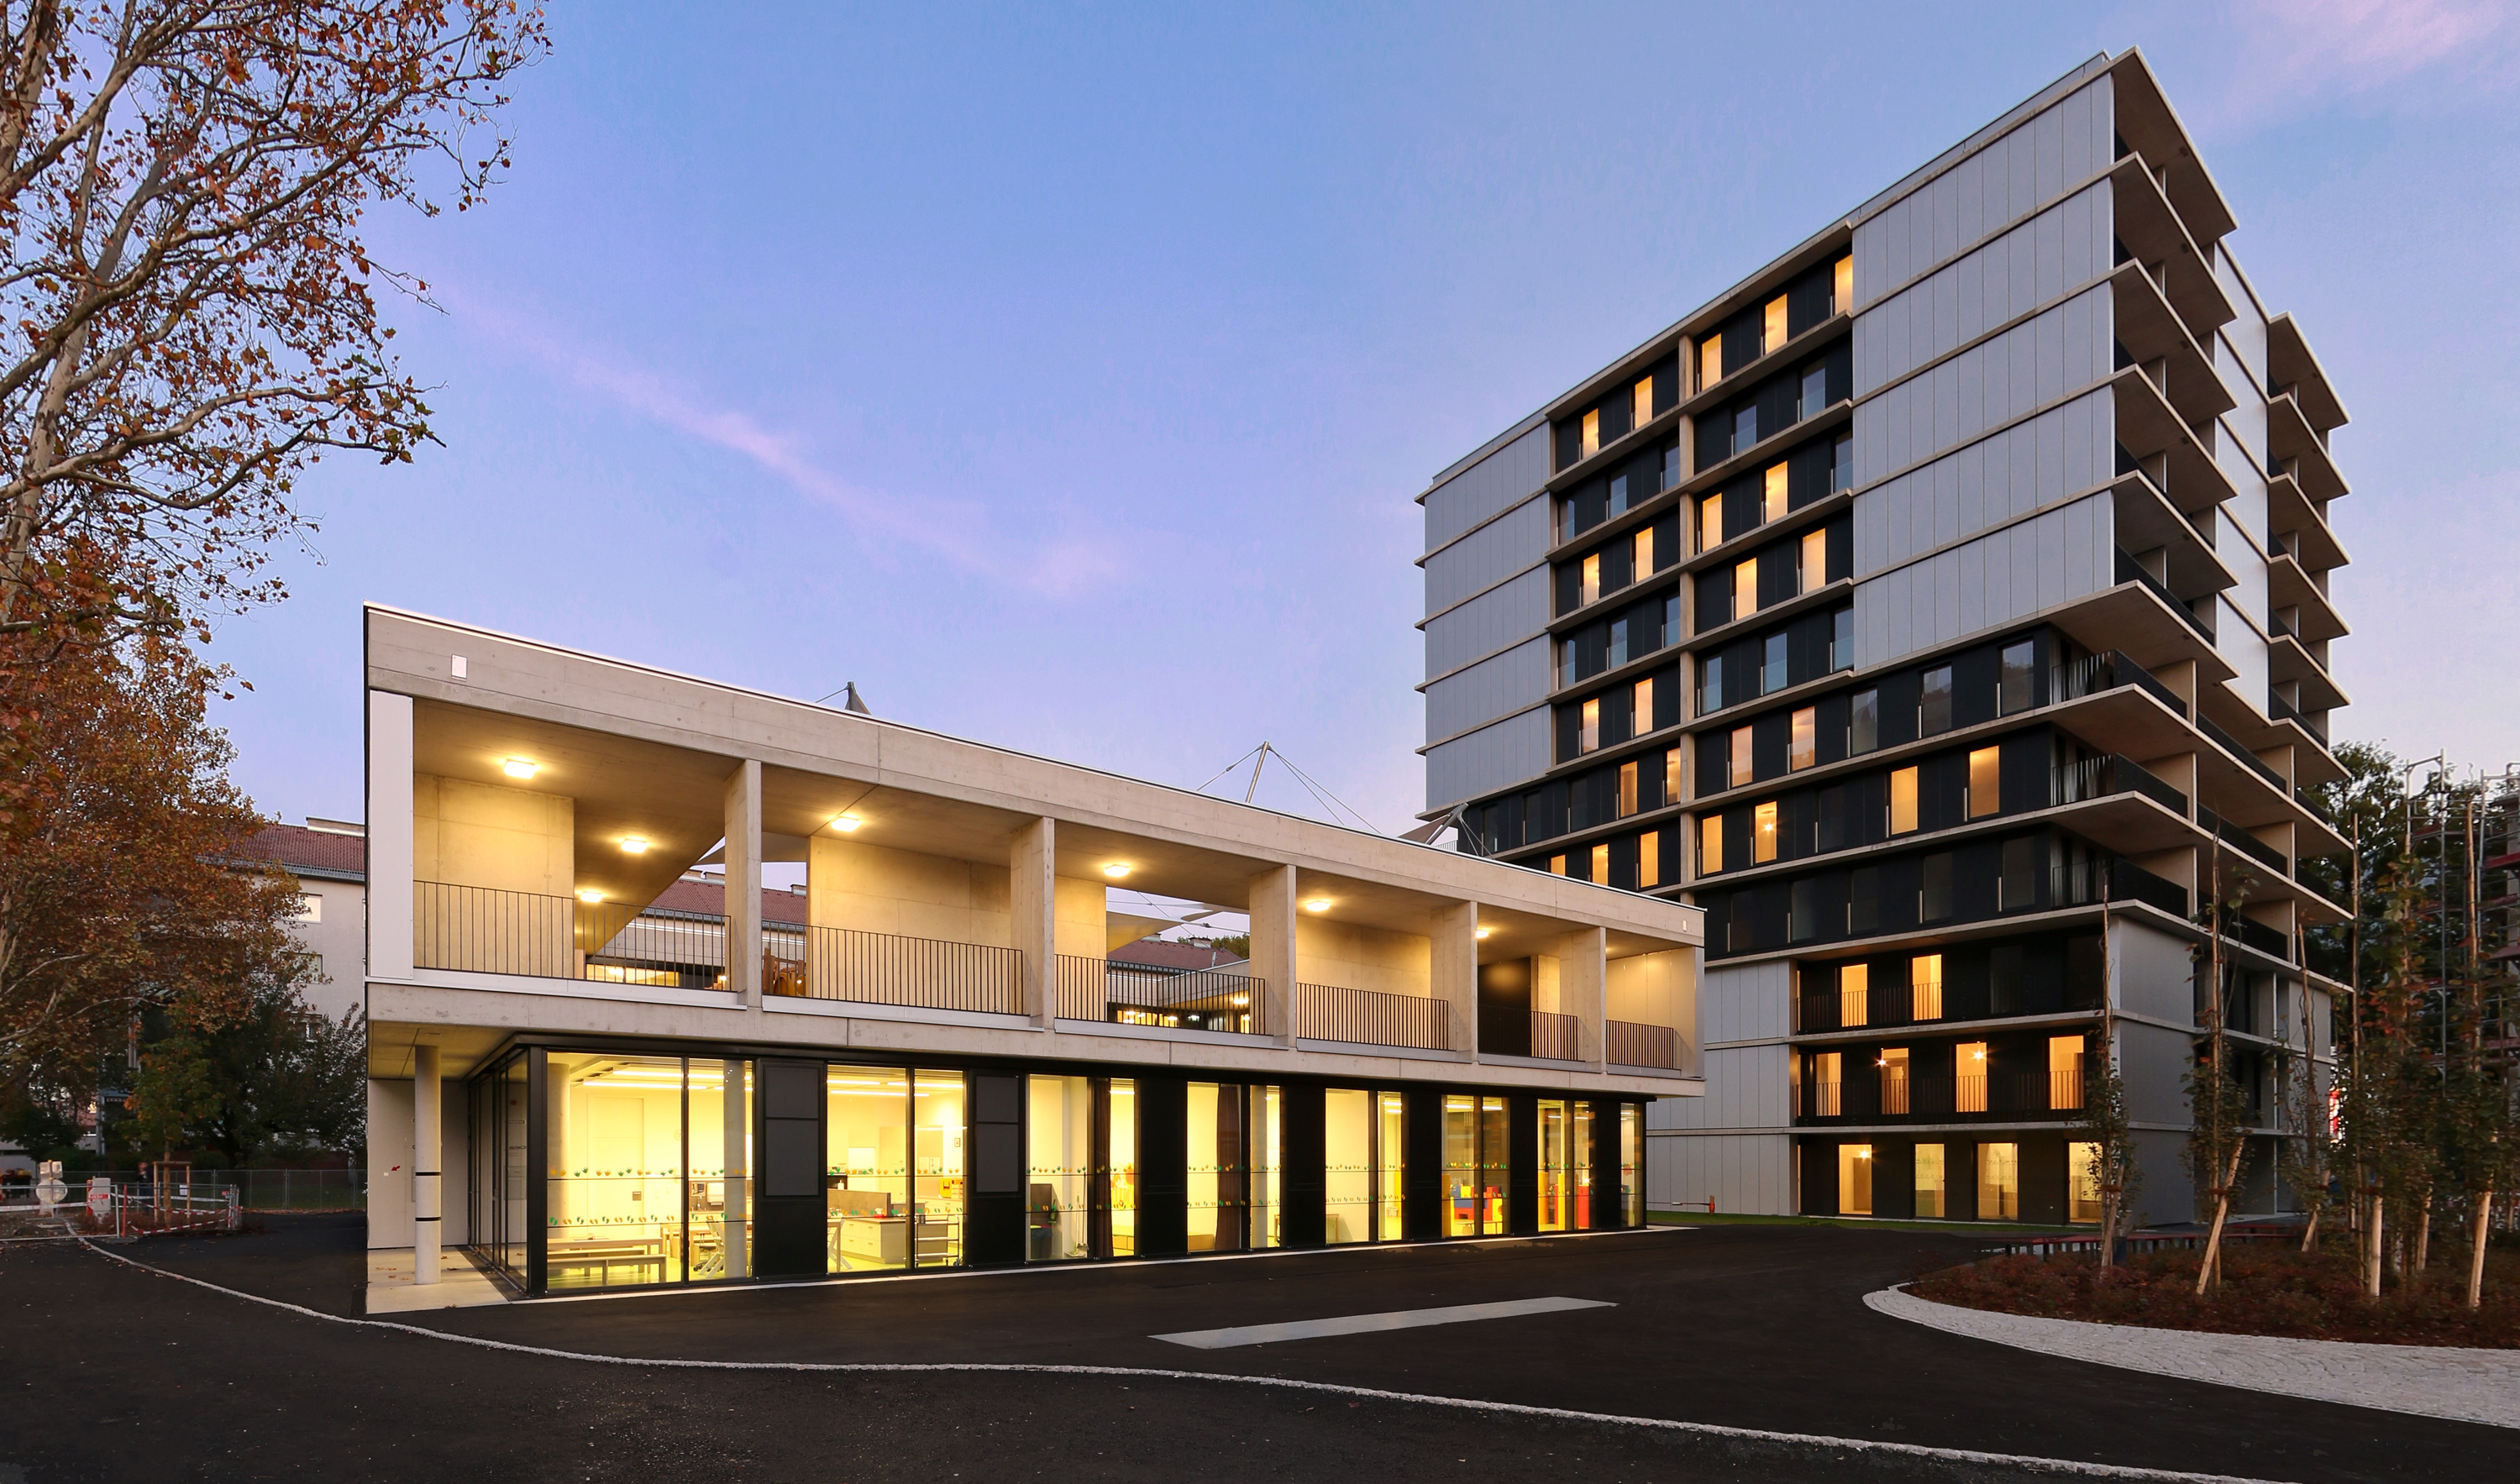
residential building St. Paulus
residential building St. Paulus
Copyright: NEUE HEIMAT TIROL Gemeinnützige WohnungsGmbH

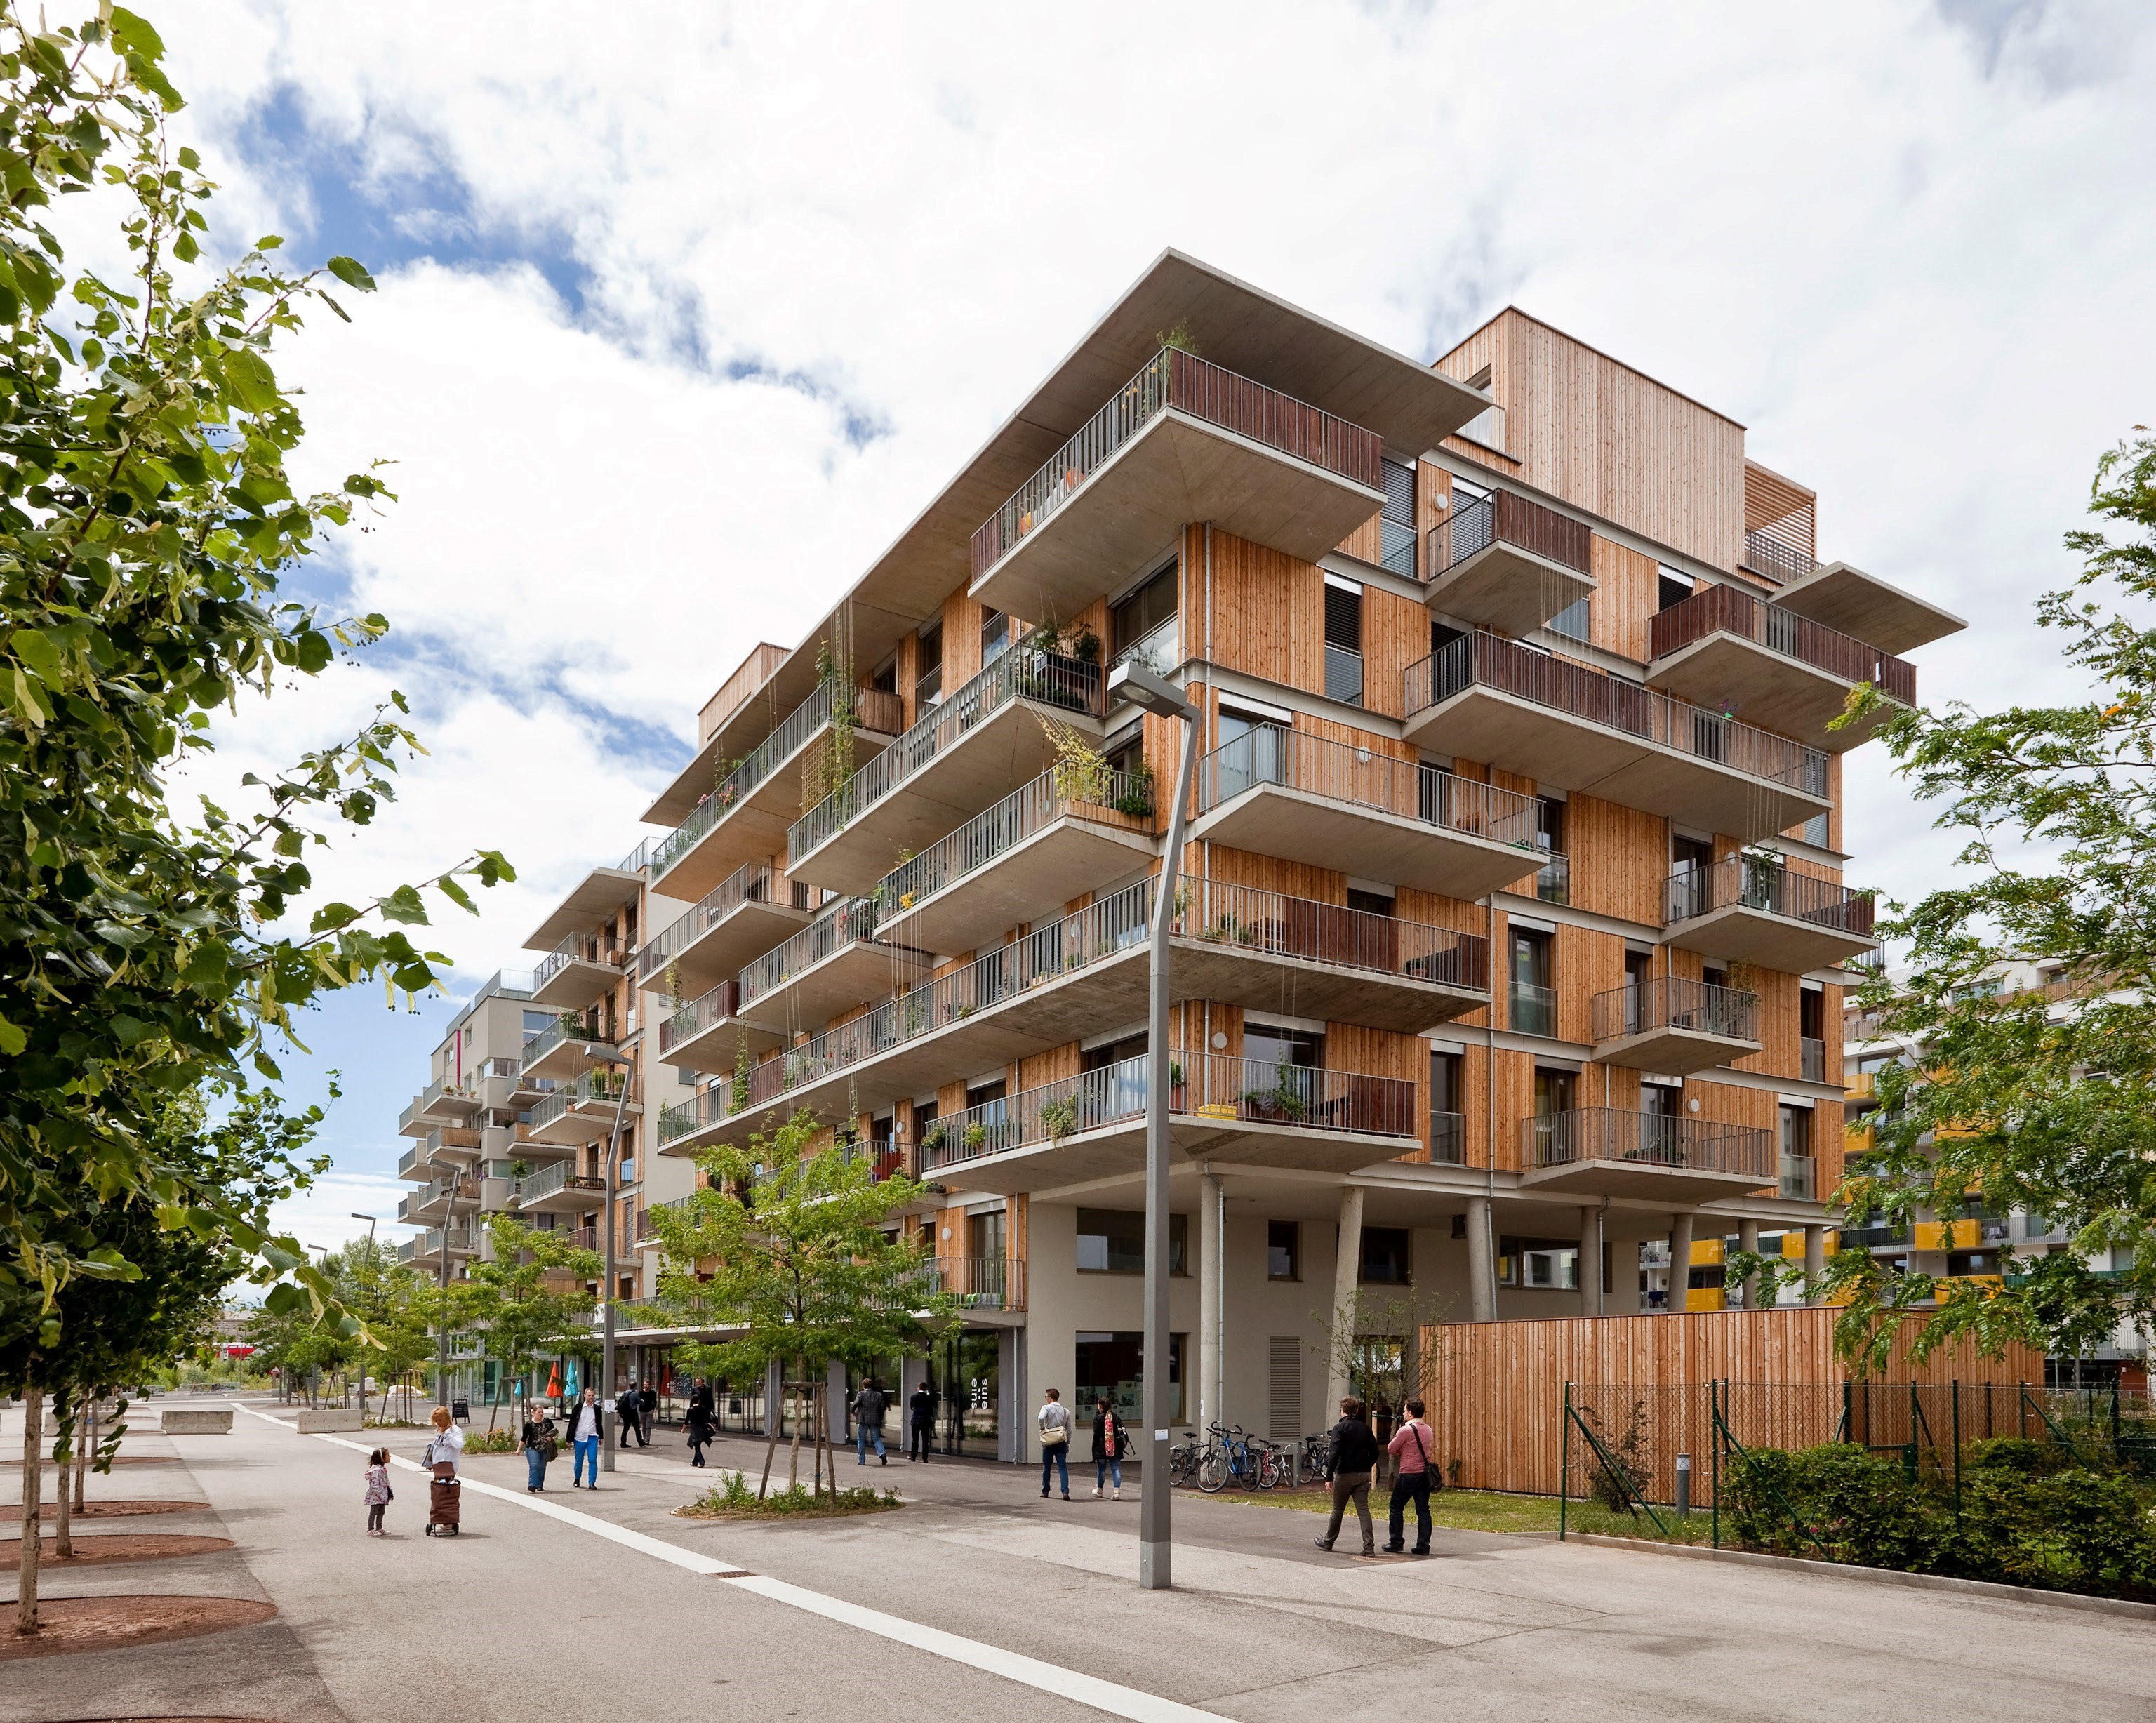
residential building St. Paulus, northwest view
residential building St. Paulus, northwest view
Copyright: NEUE HEIMAT TIROL Gemeinnützige WohnungsGmbH

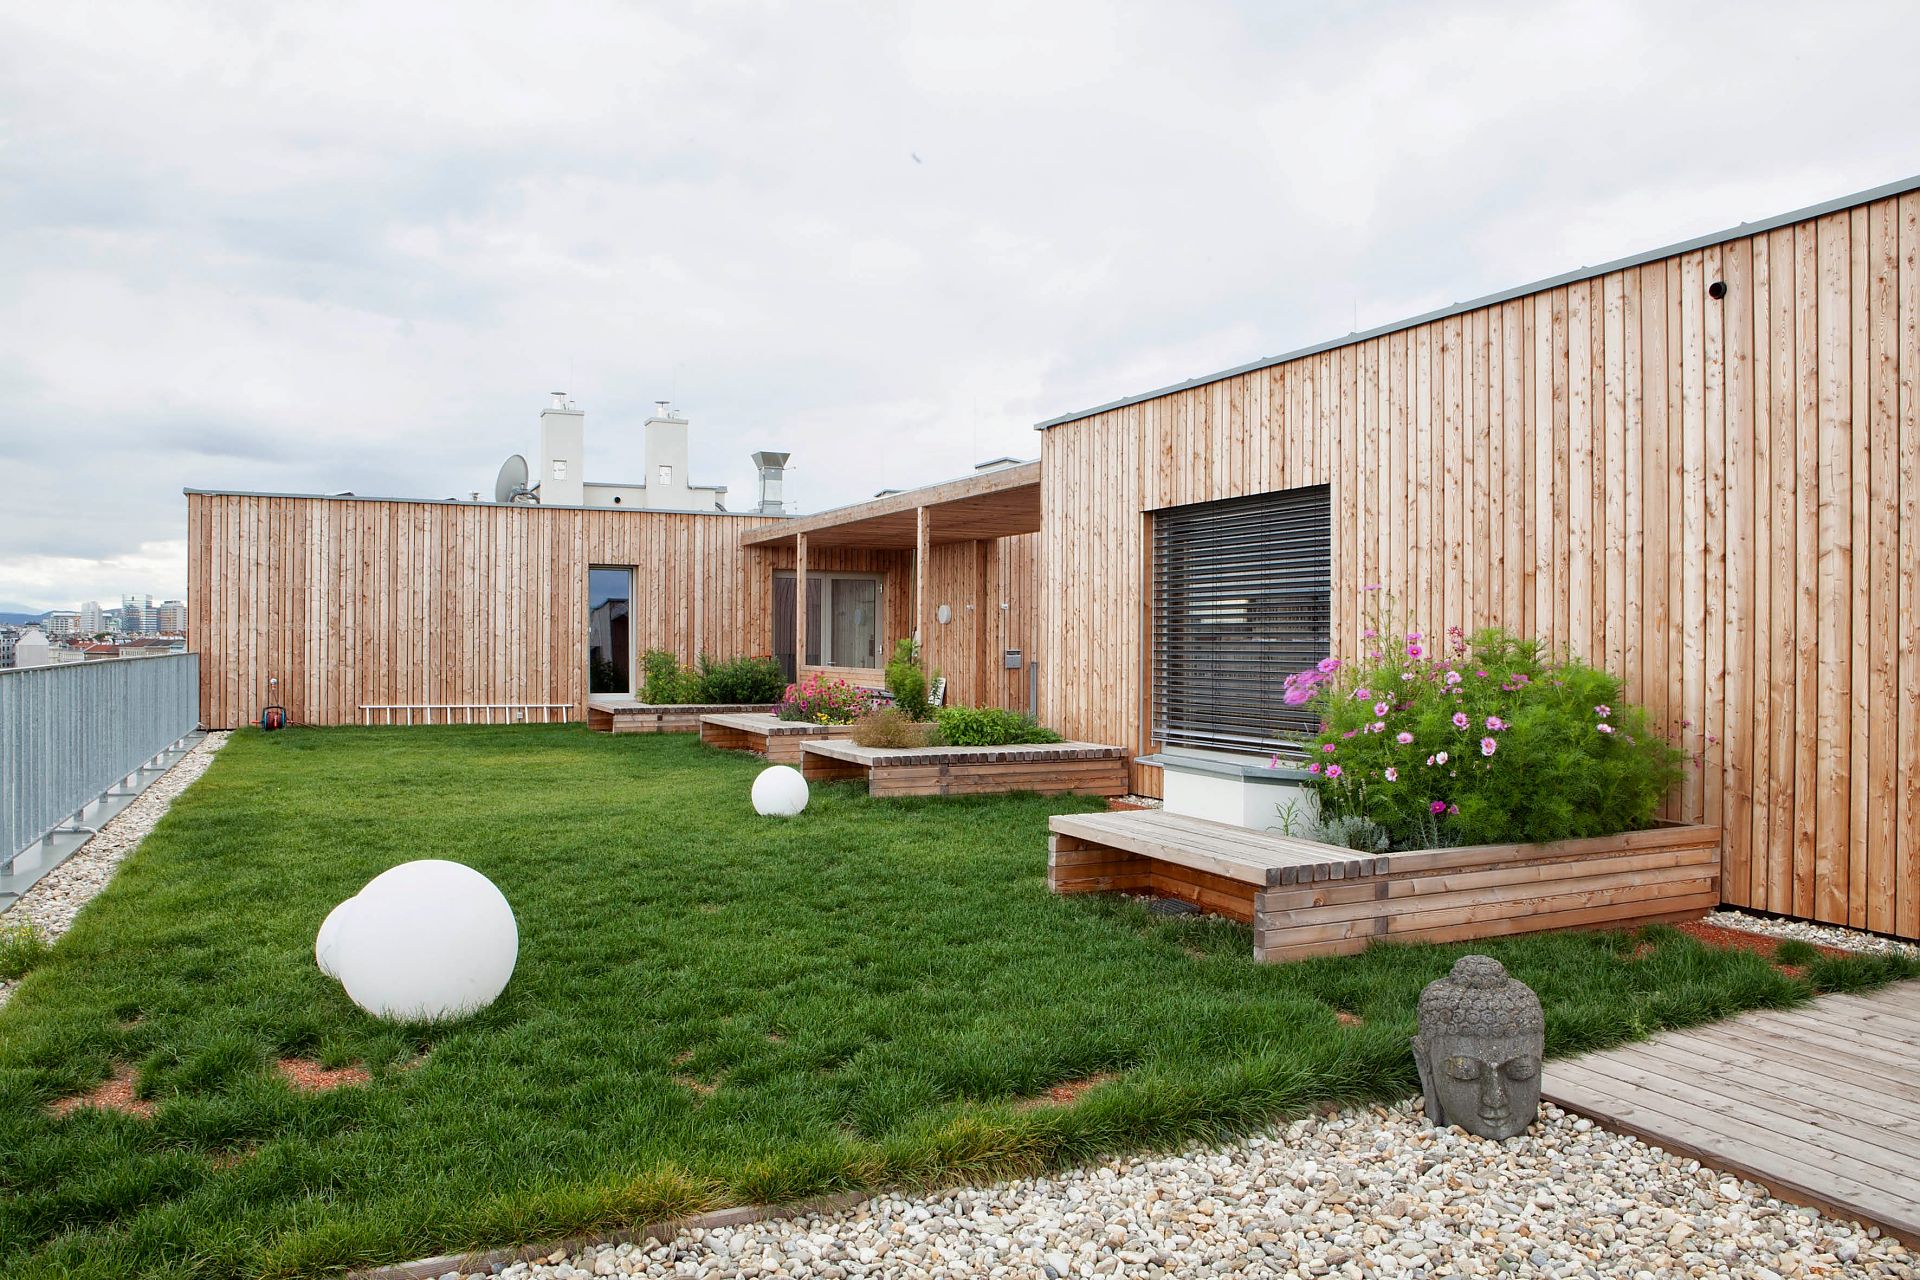
view from the roof terrace, north-east view
view from the roof terrace, north-east view
Copyright: Wohnprojekt Wien
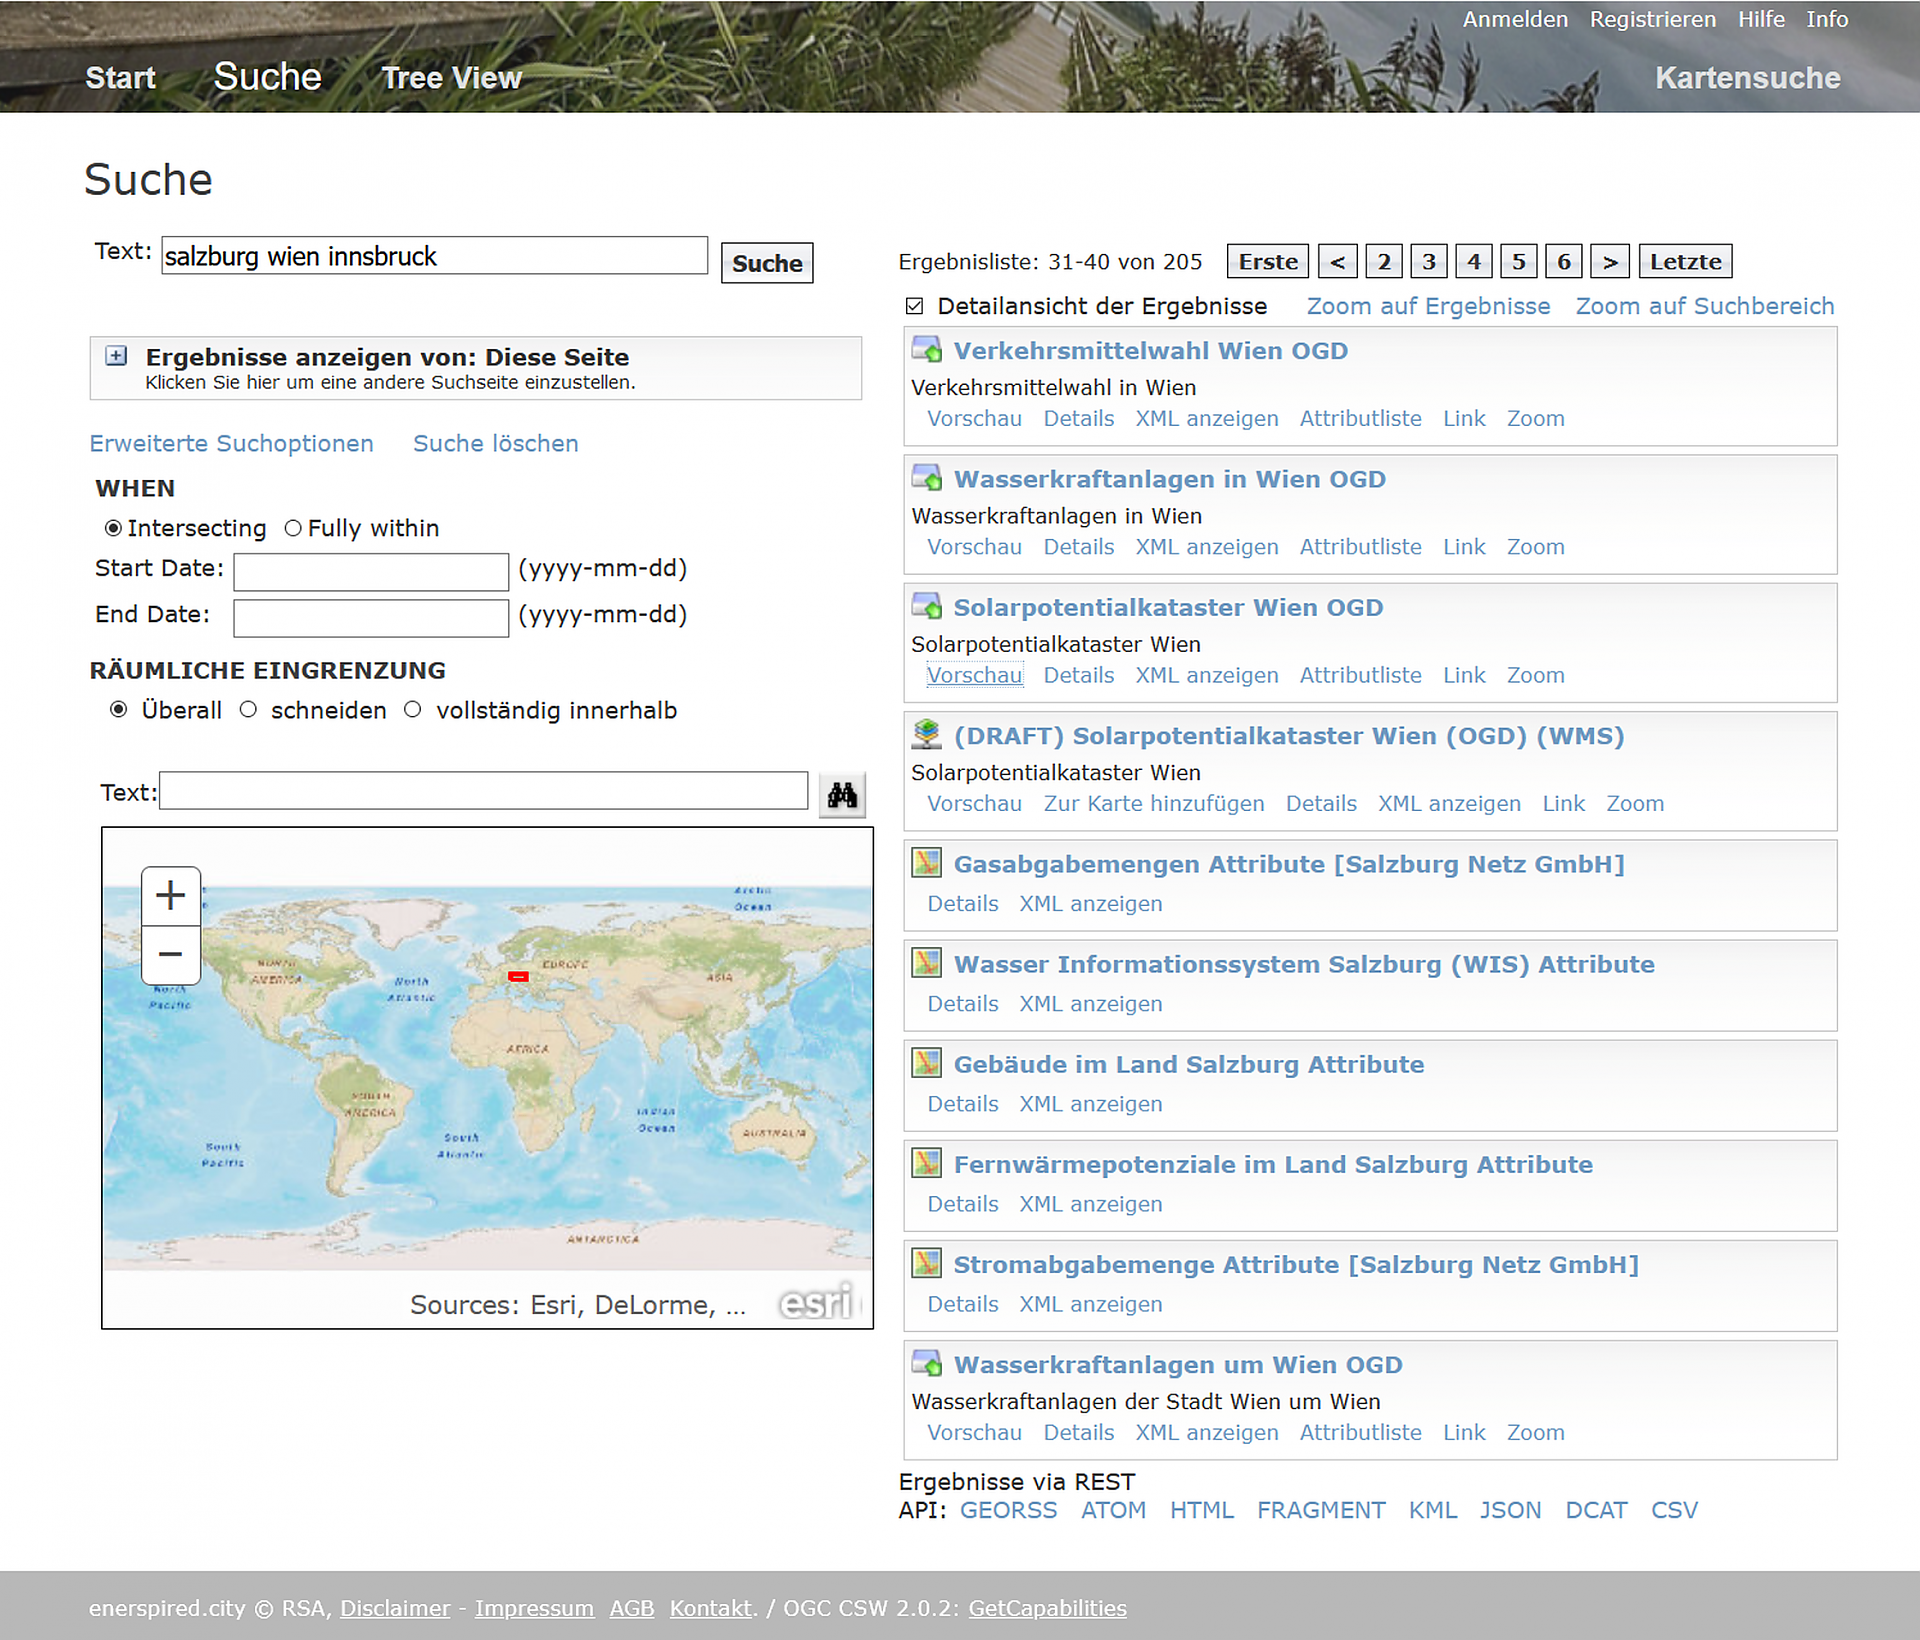
Enerspired Cities metadata portal
Metadata portal of datasets researched in Enerspired Cities and identified as relevant to energy-oriented urban planning.
Copyright: RSA FG - iSPACE

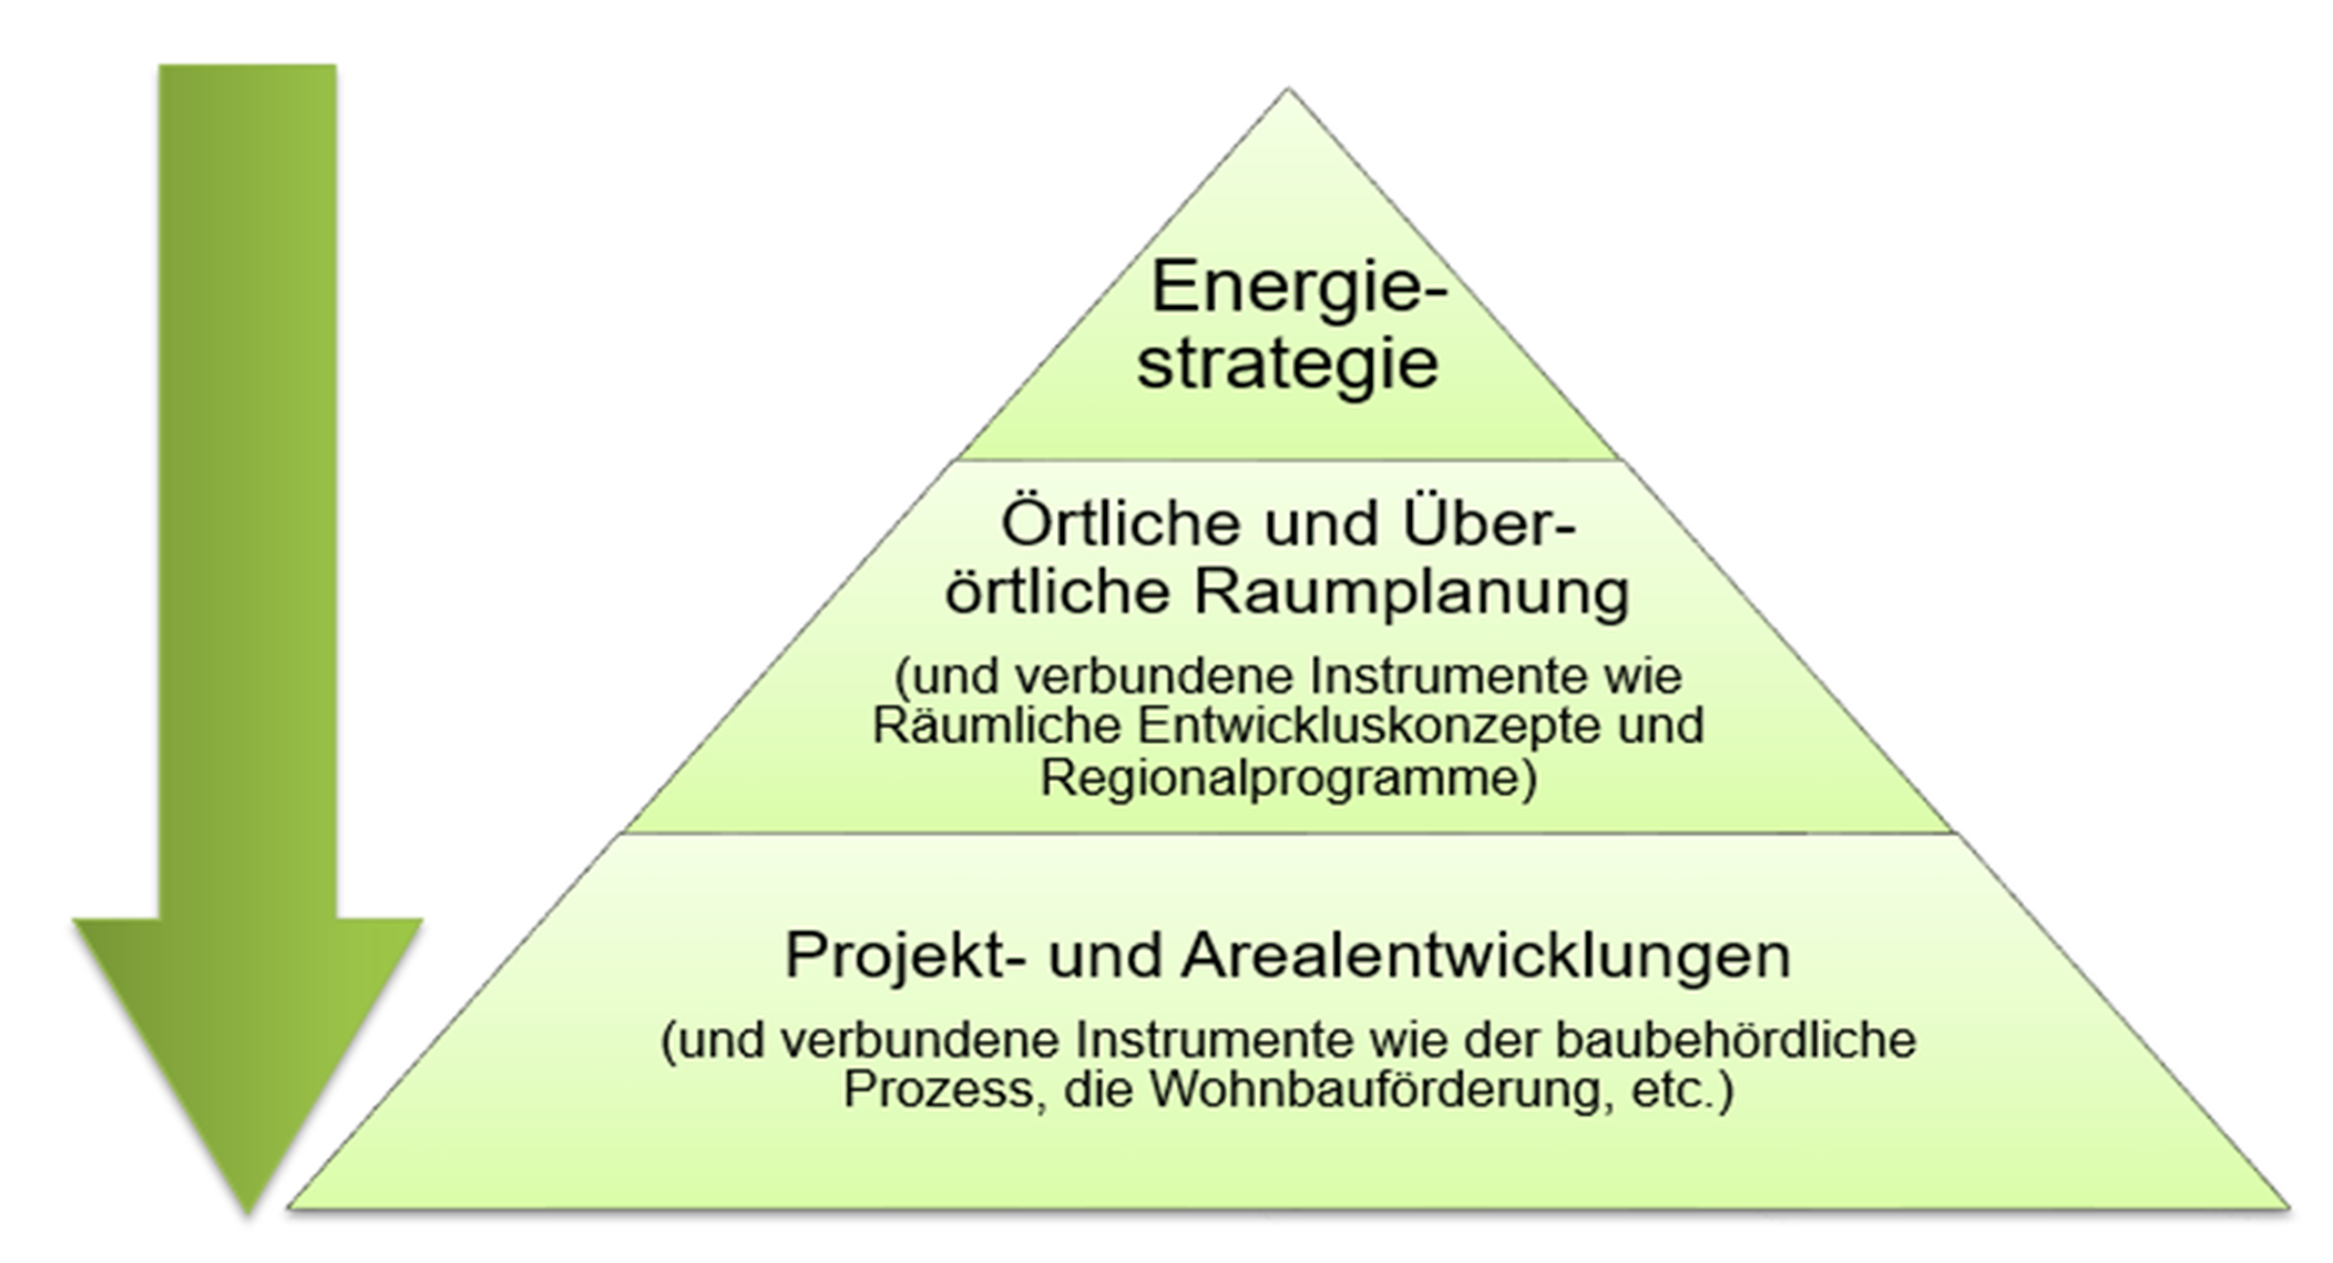
Domains of energy-oriented urban planning
Domains of hierarchically structured energy-oriented urban planning
Copyright: SIR
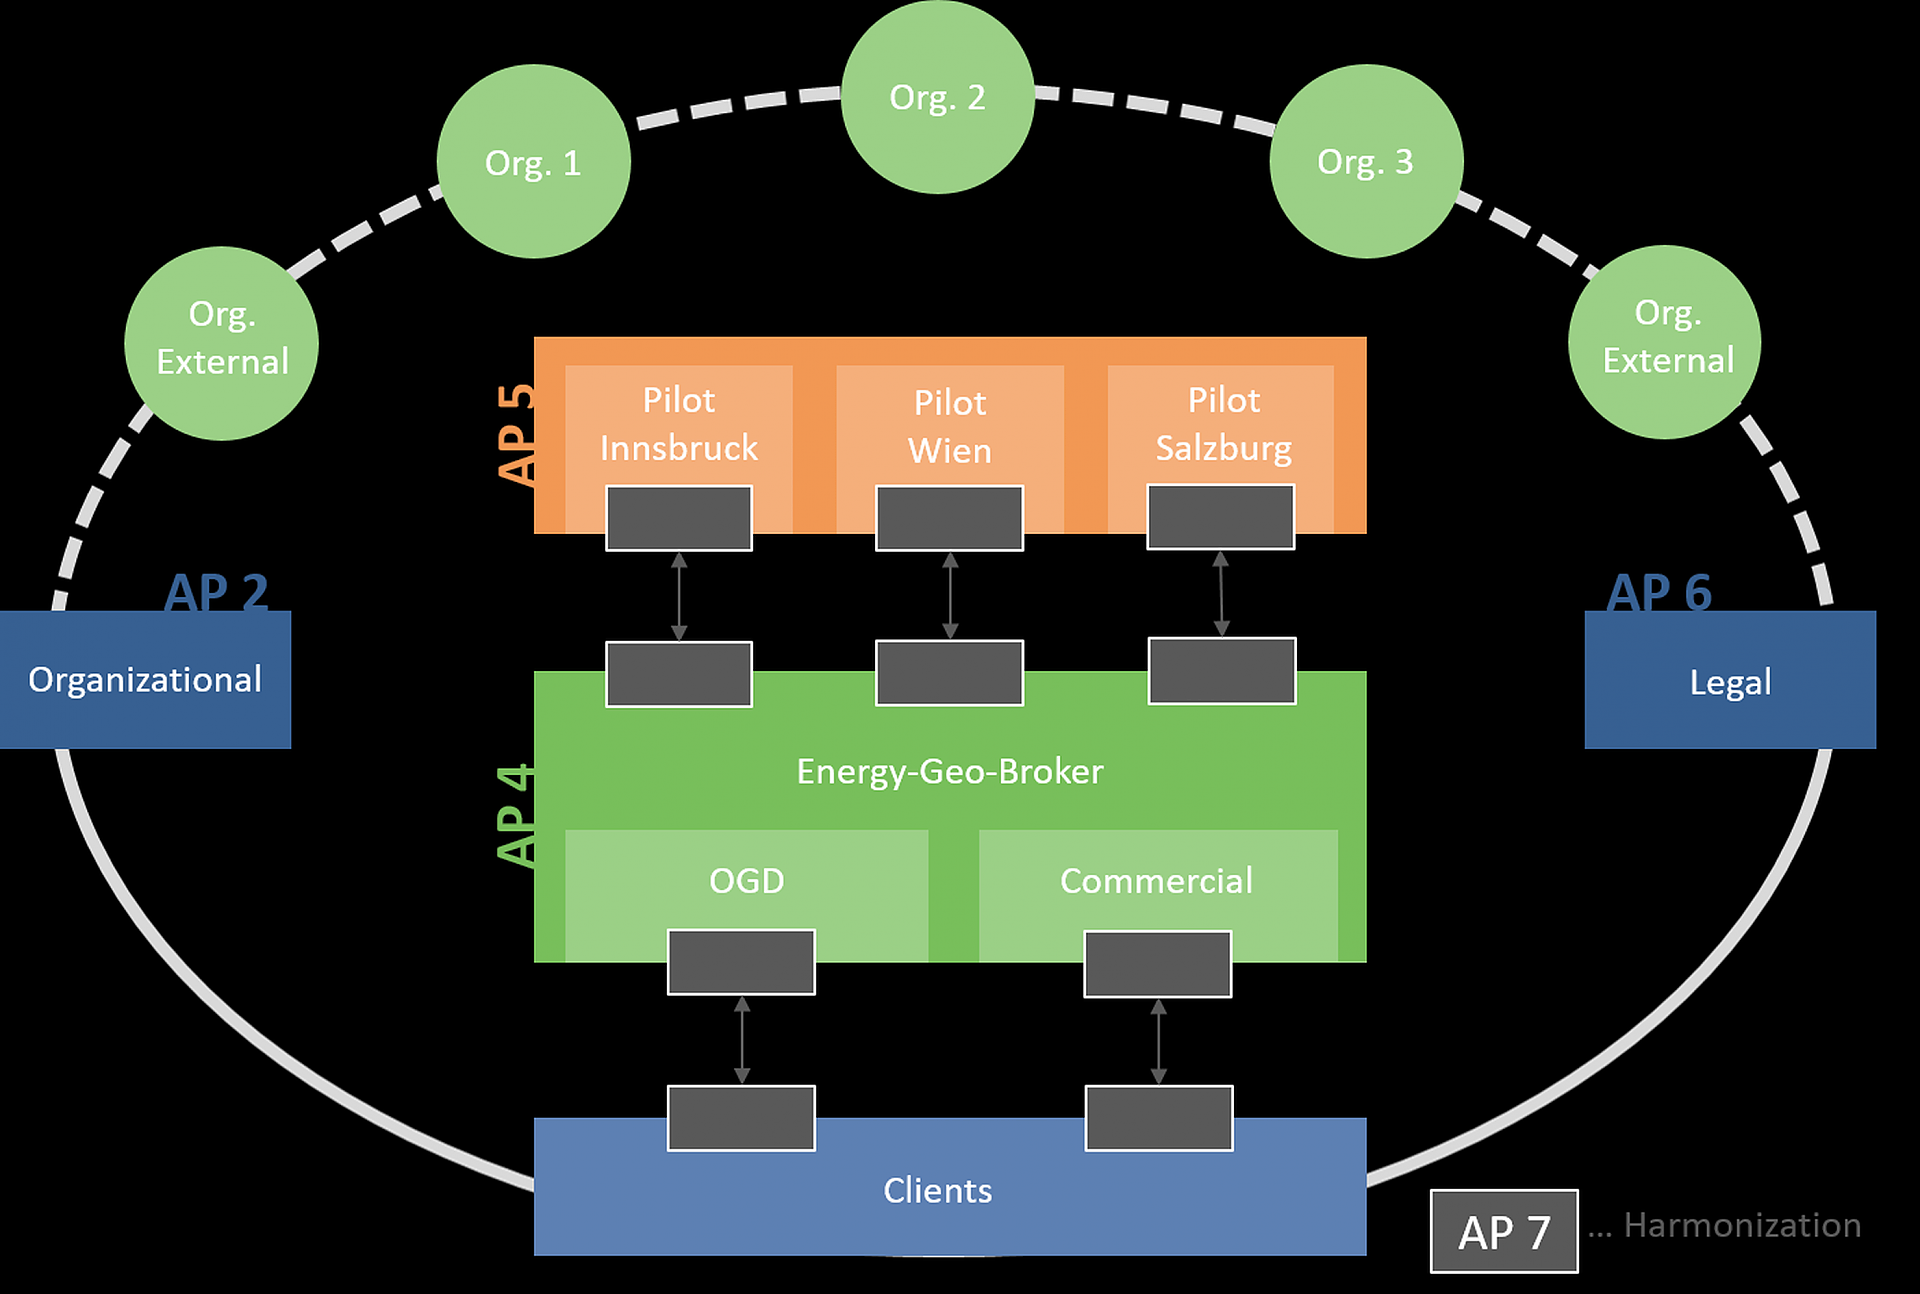
Enerspired Cities - Frame
Graphic of content and services developed in Enerspired Cities embedded in the context of the user community
Copyright: RSA FG - iSPACE
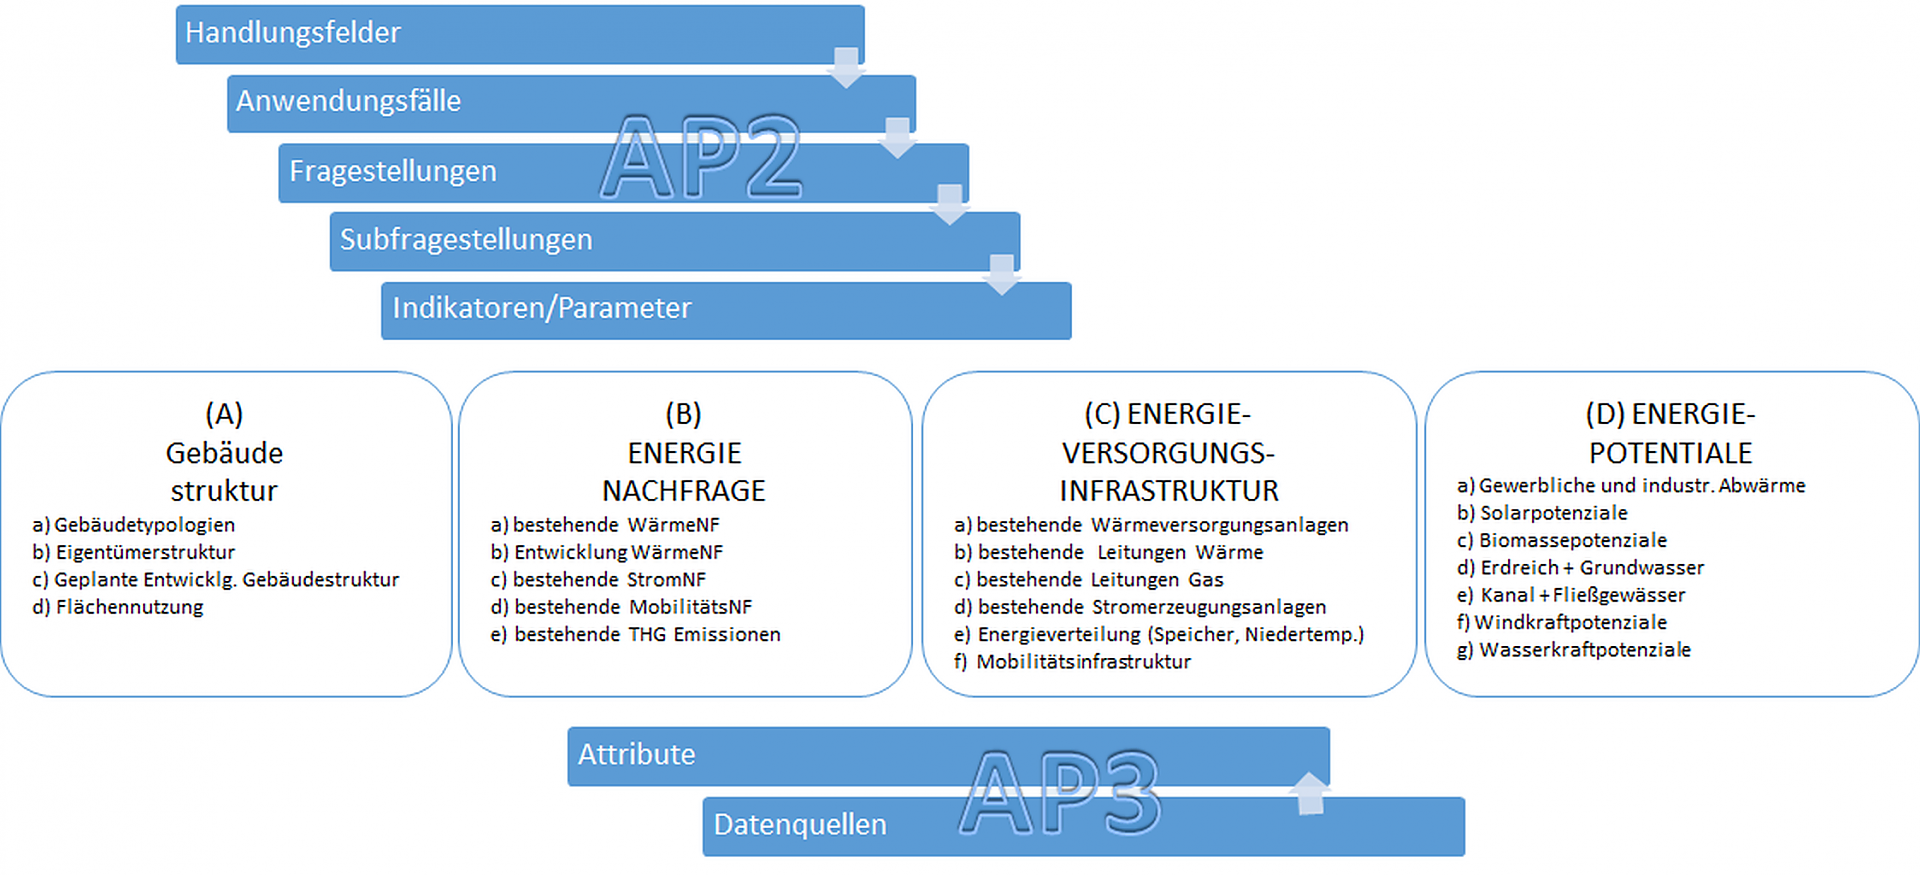
Thematic structuring
Thematic structuring of use cases and integration in context
Copyright: SIR
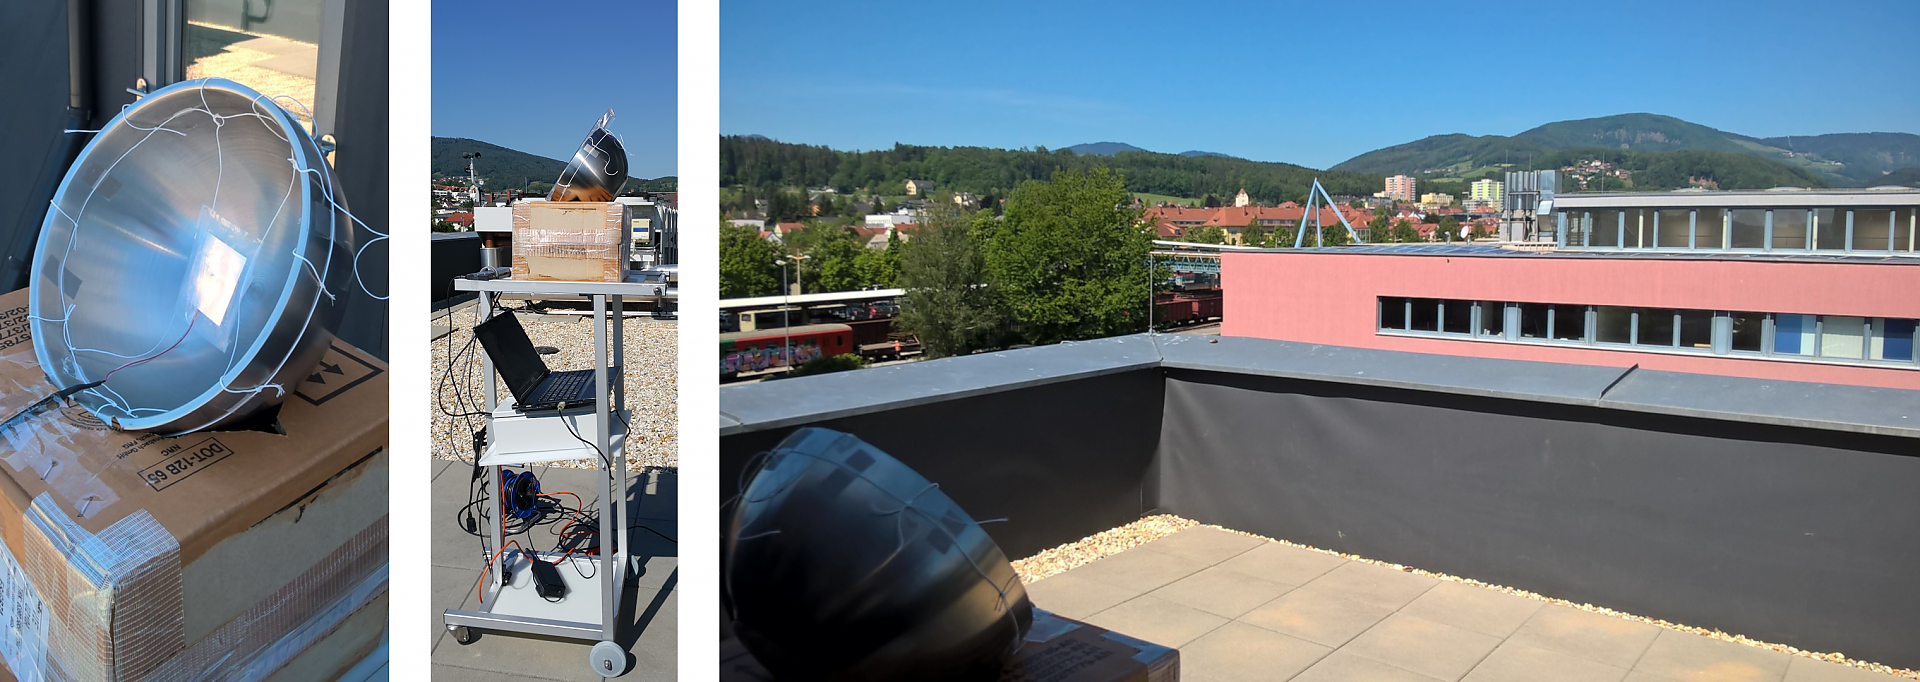
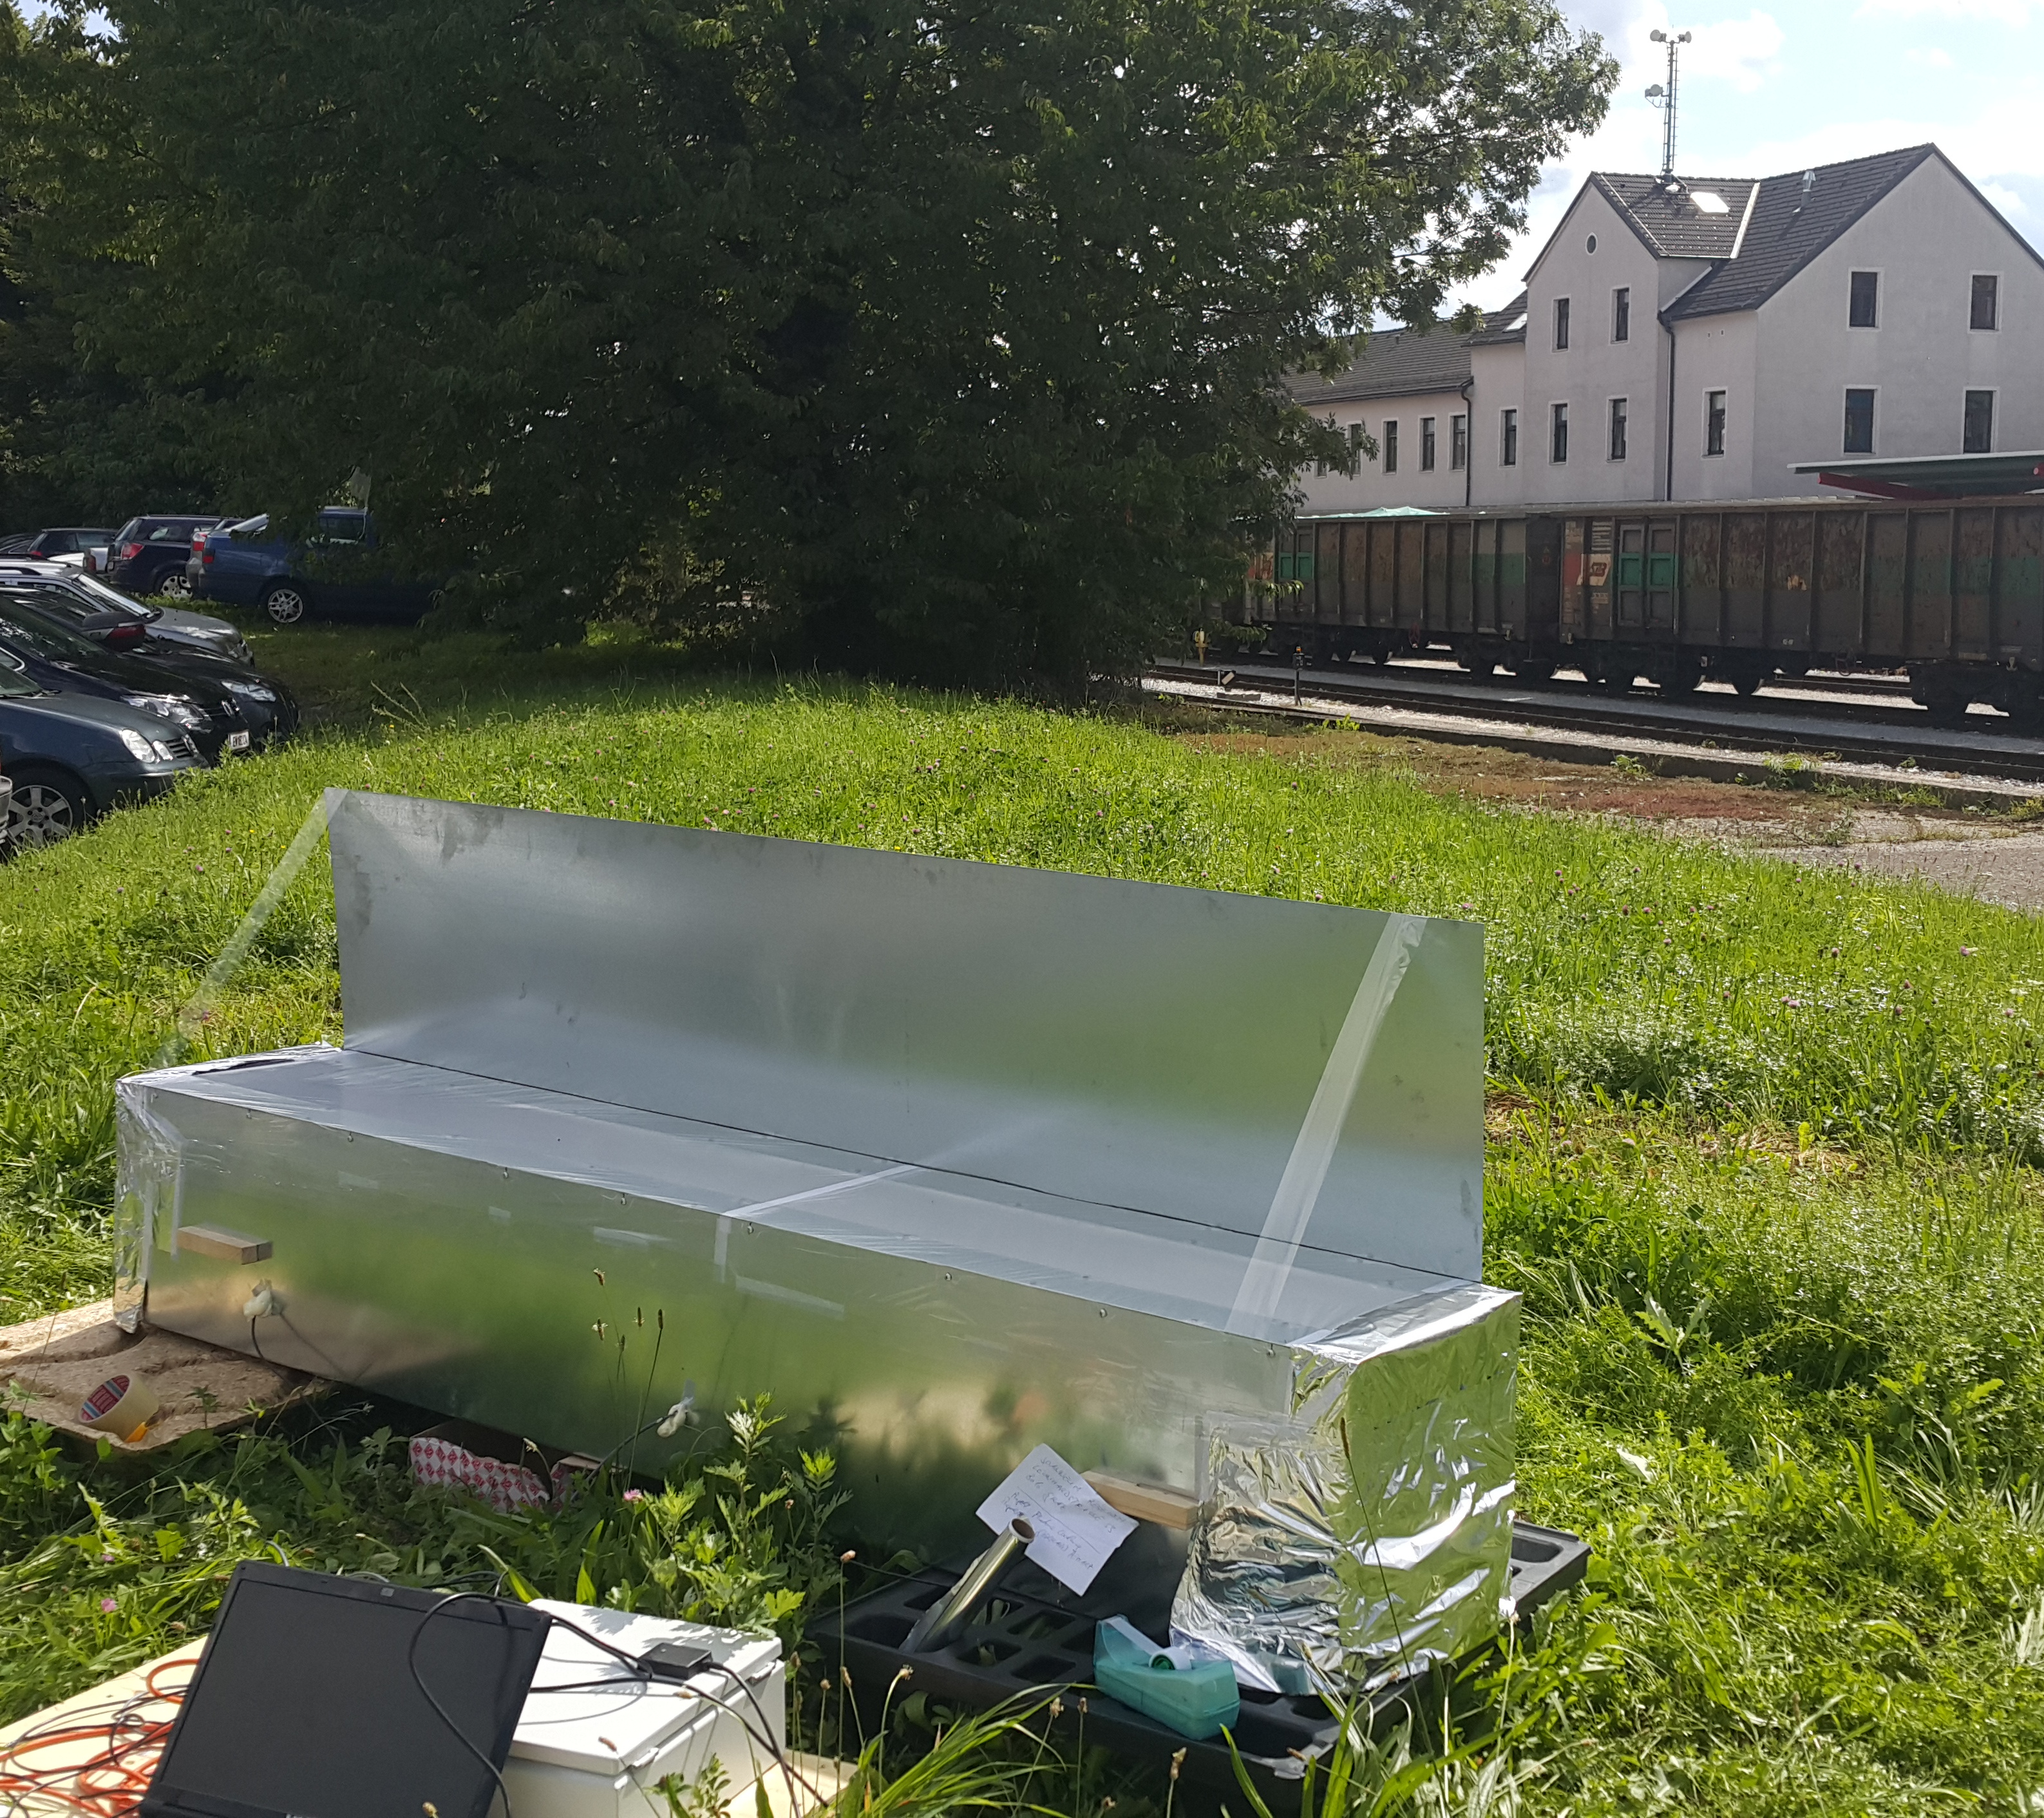
Photonic Cooling measurement setup with parabolic reflector
An example of a measurement setup used during the project photonic cooling employing a parabolic reflector. Reflector-Sample-Peltier-module unit in detail (left), complete measurement setup (middle) as well as an overview of the surroundings next to the measurement setup. Image taken on 17.5.2017, Weiz.
Copyright: JOANNEUM RESEARCH
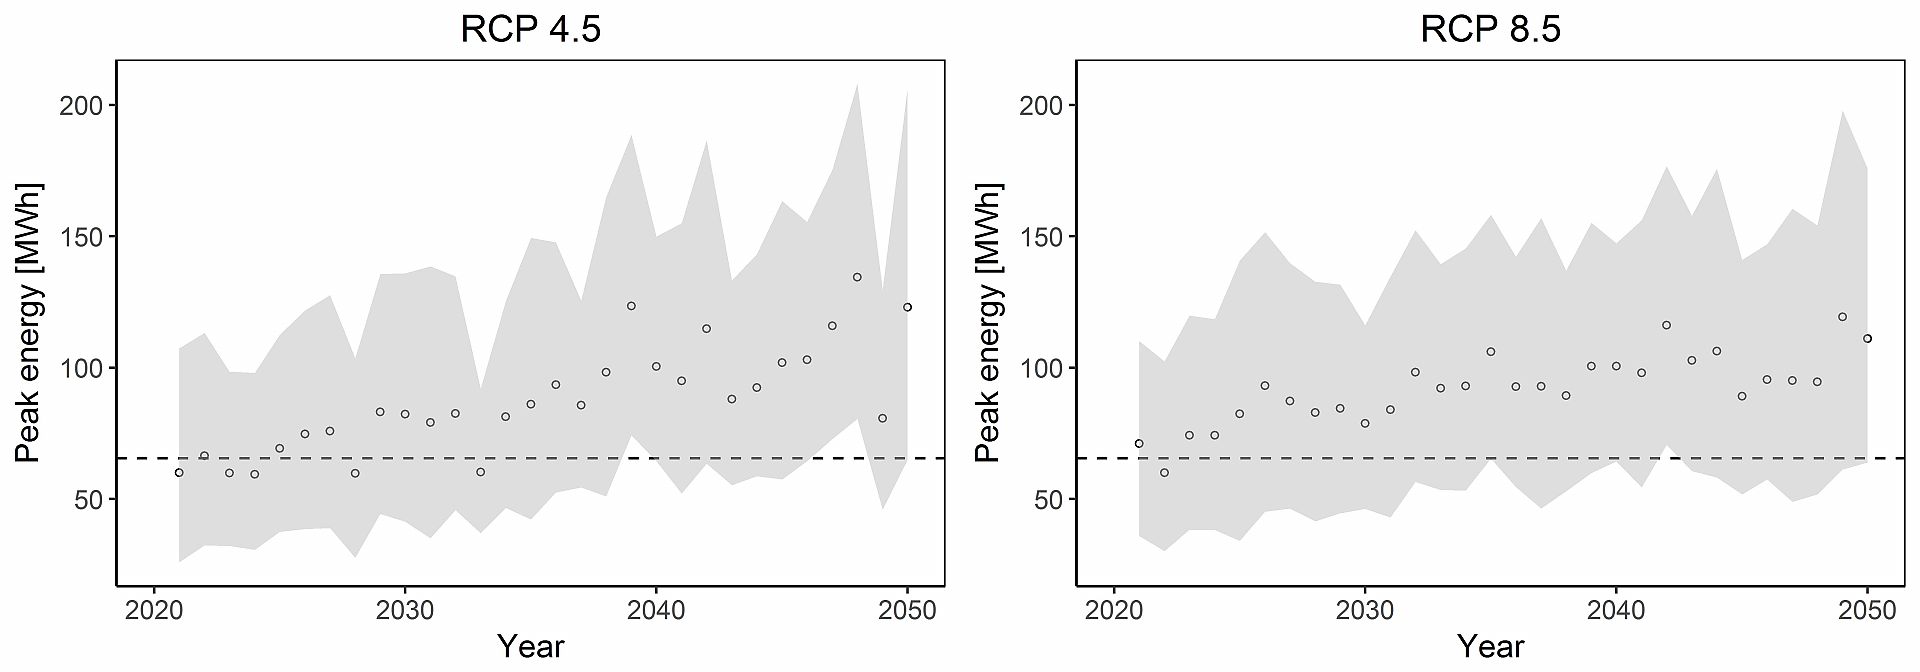
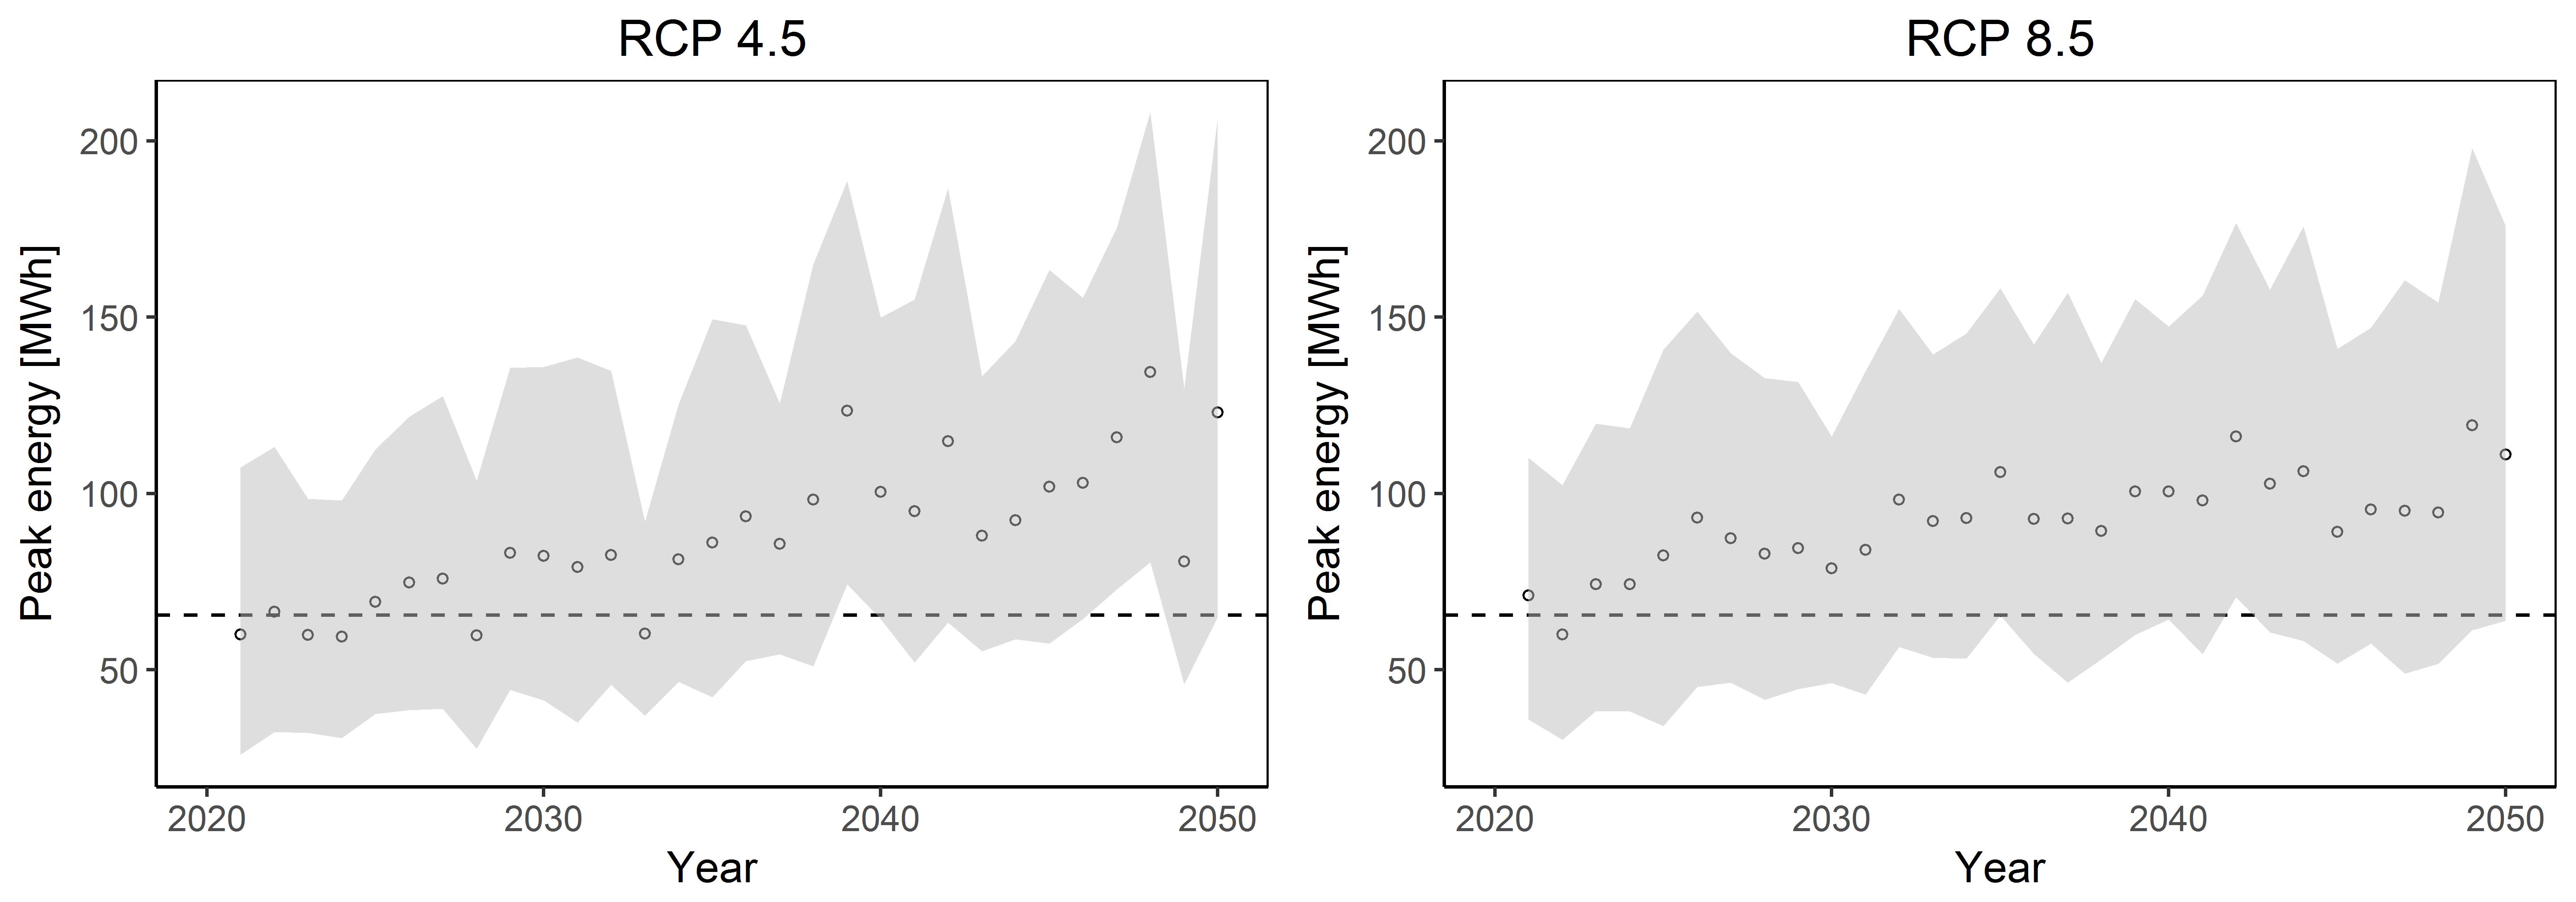
Estimated annual peak demand for air conditioning in Vienna for different climate scenarios
Estimated annual peak demand needed for air conditioning in Vienna according to the model calculations applied for the climate scenario RCP4.5 (left) and RCP8.5(right). Data points represent the average annual peak demand, the grey area the uncertainty with a 95% confidence interval and the dashed line the peak demand in Vienna for 2016.
Copyright: JOANNEUM RESEARCH

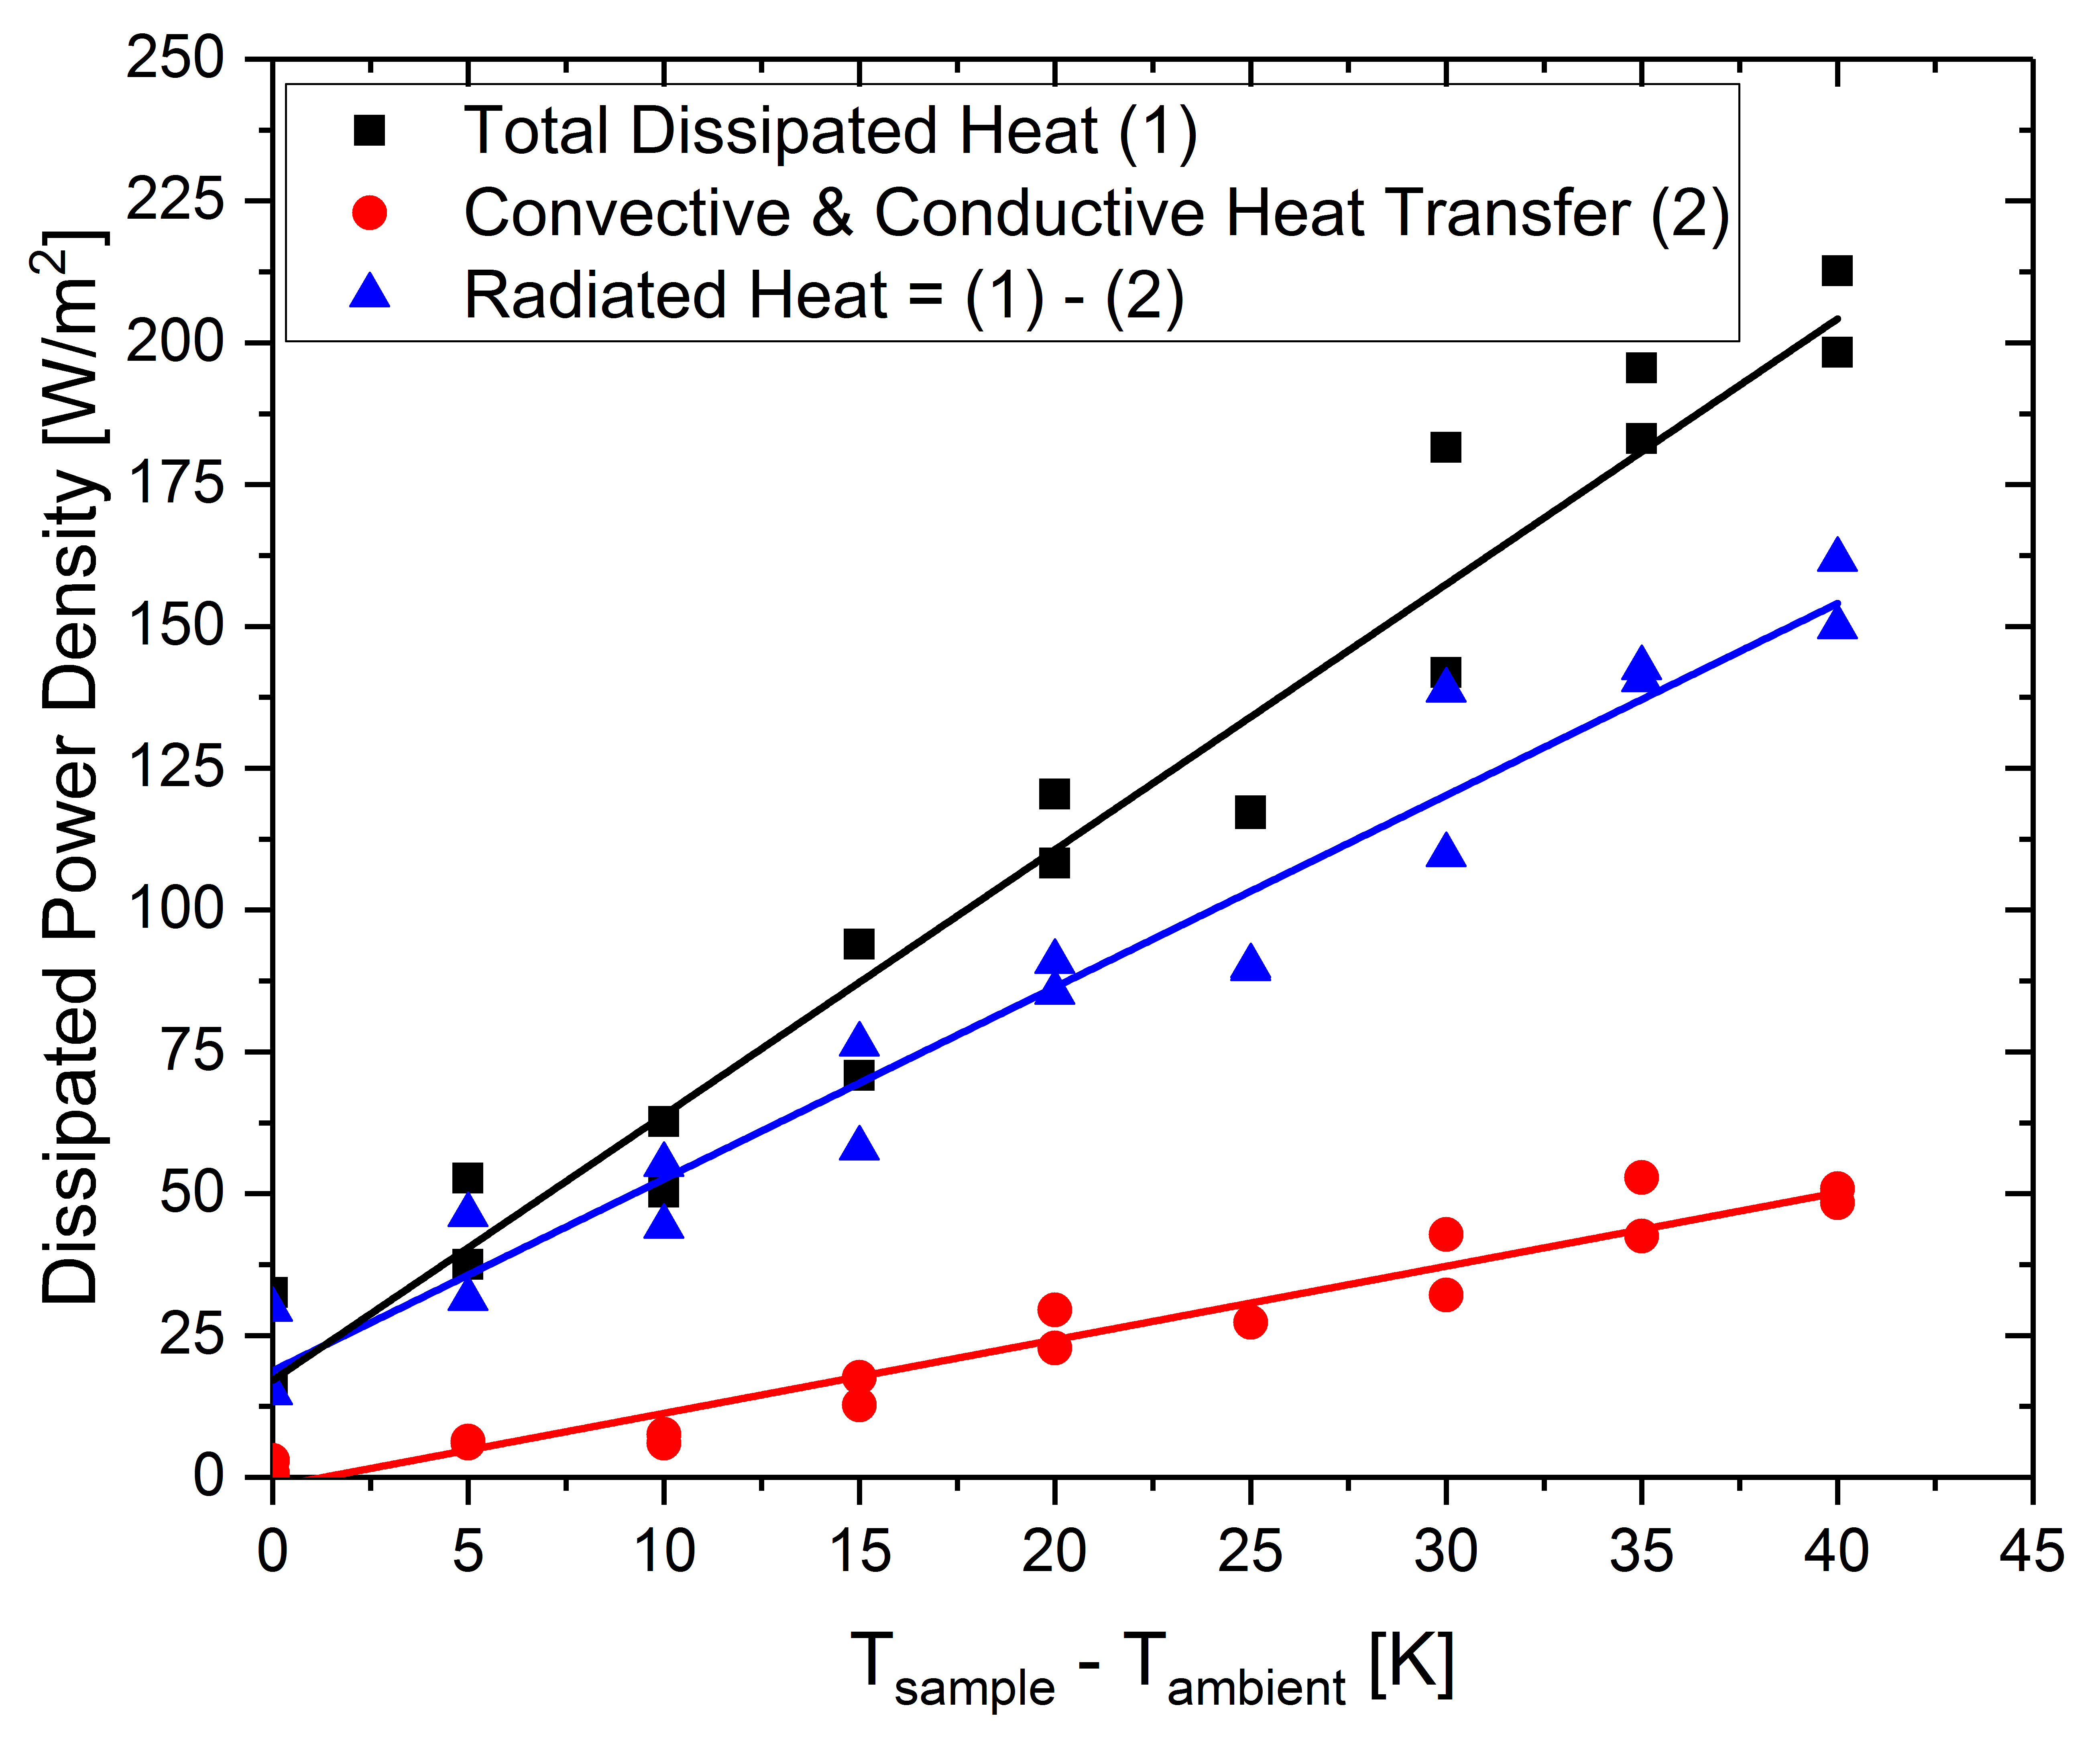
Dissipated power density in dependence of the temperature difference between sample and its surroundings
The figure shows the dissipated power density in dependence of the temperature difference between sample and its surroundings. The highest power density was observed when no design element blocking the radiation of the sample was used. In this case the heat was transferred from the sample to its surroundings by heat conduction, heat radiation and heat convection. Applying a heat radiation blocking element led to a significantly decreased power density as heat was transferred only by heat conduction and heat convection. The intensity of the dissipated heat radiation was evaluated by calculating the difference of the power densities observed for the two different situations (i.e whether the heat radiation blocking element was used or not).
Copyright: JOANNEUM RESEARCH

Outdoor use of a Photonic Cooling functional model
Image taken on 04.09.2017, Weiz.
Copyright: JOANNEUM RESEARCH
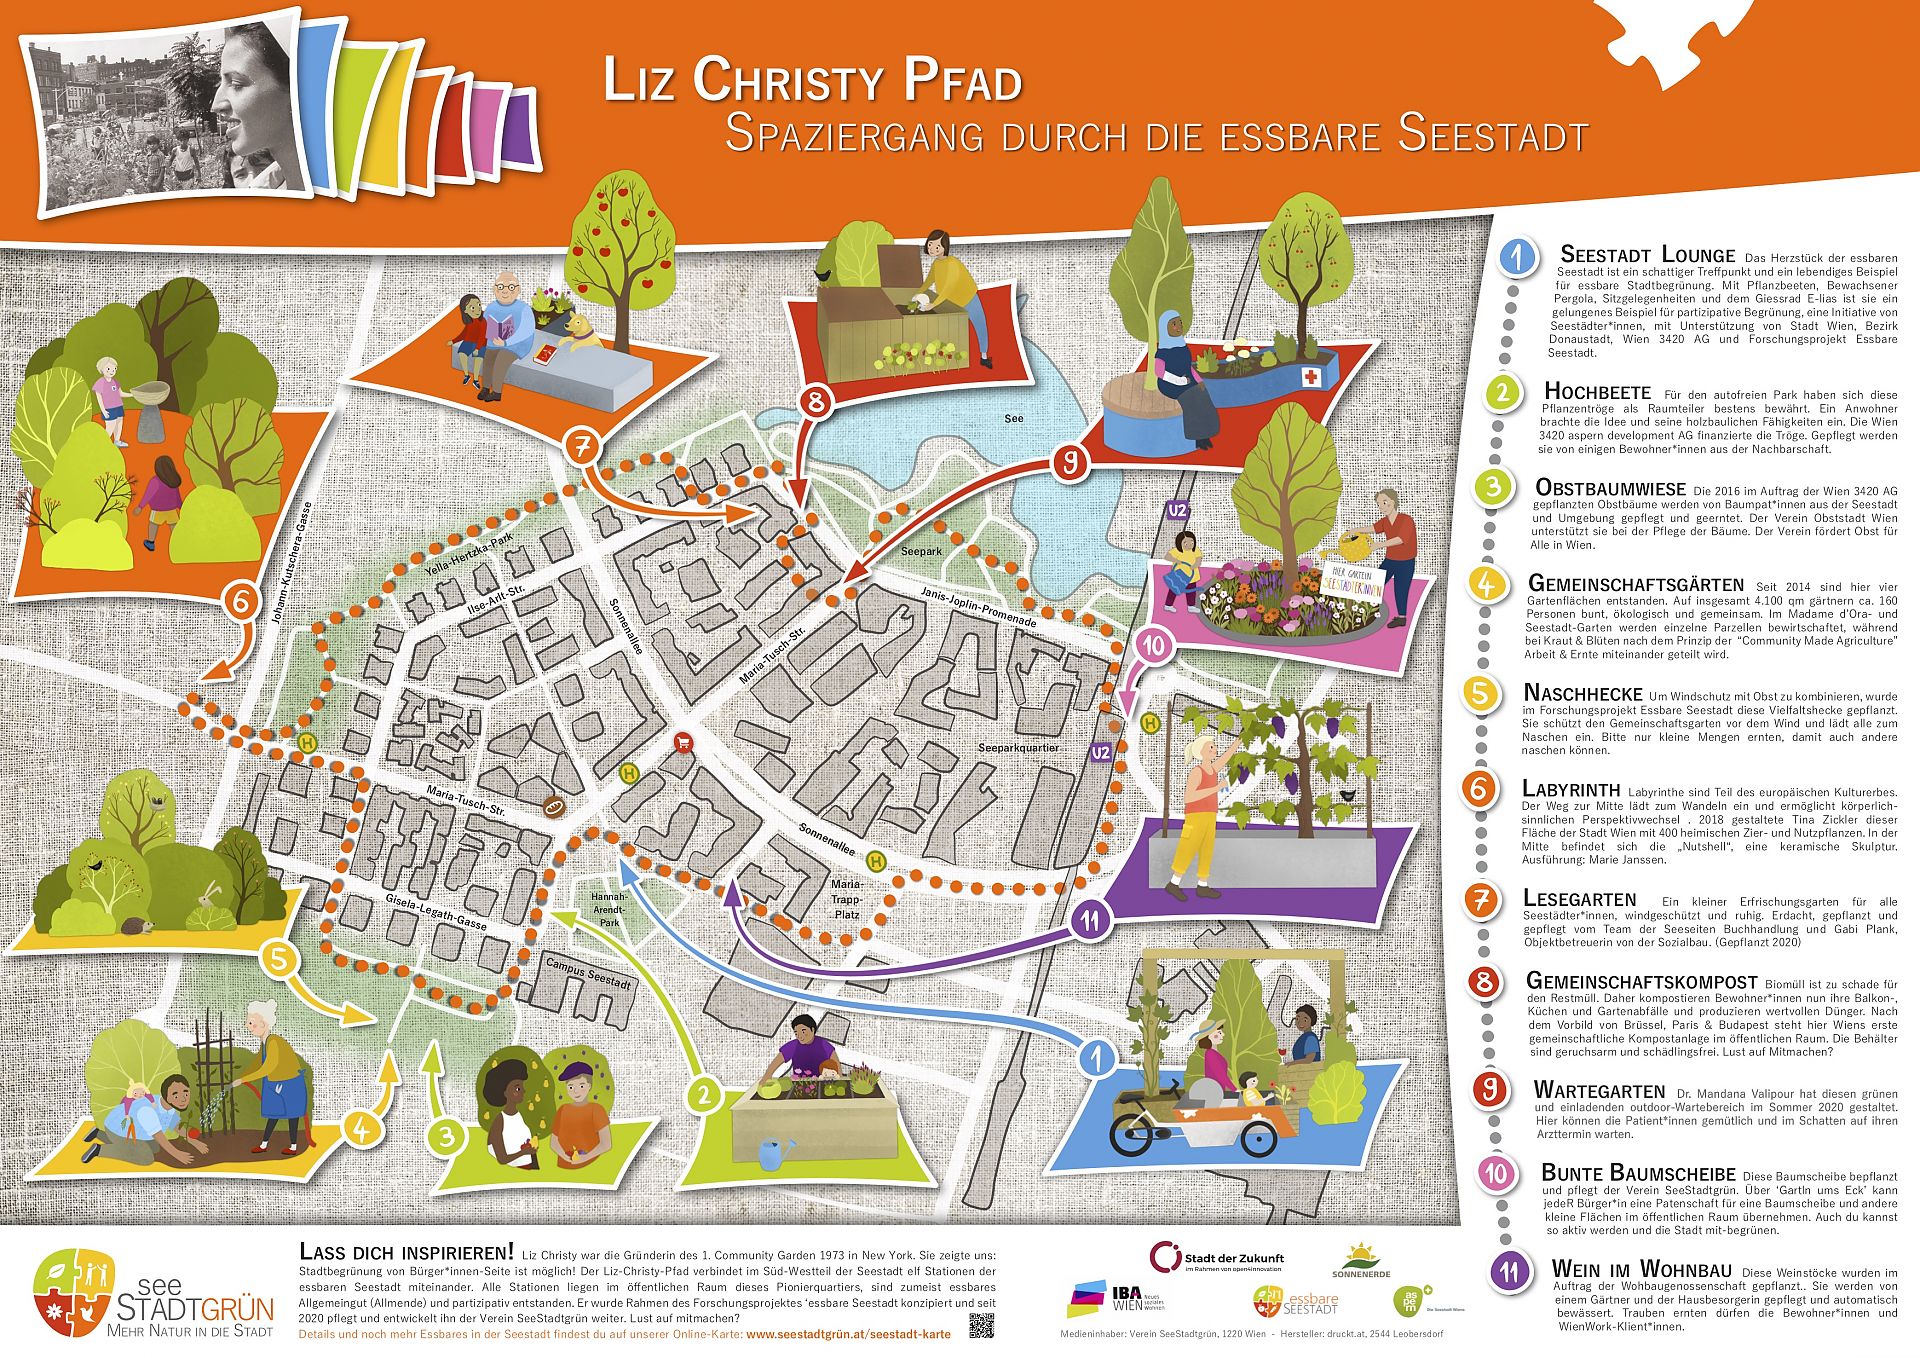
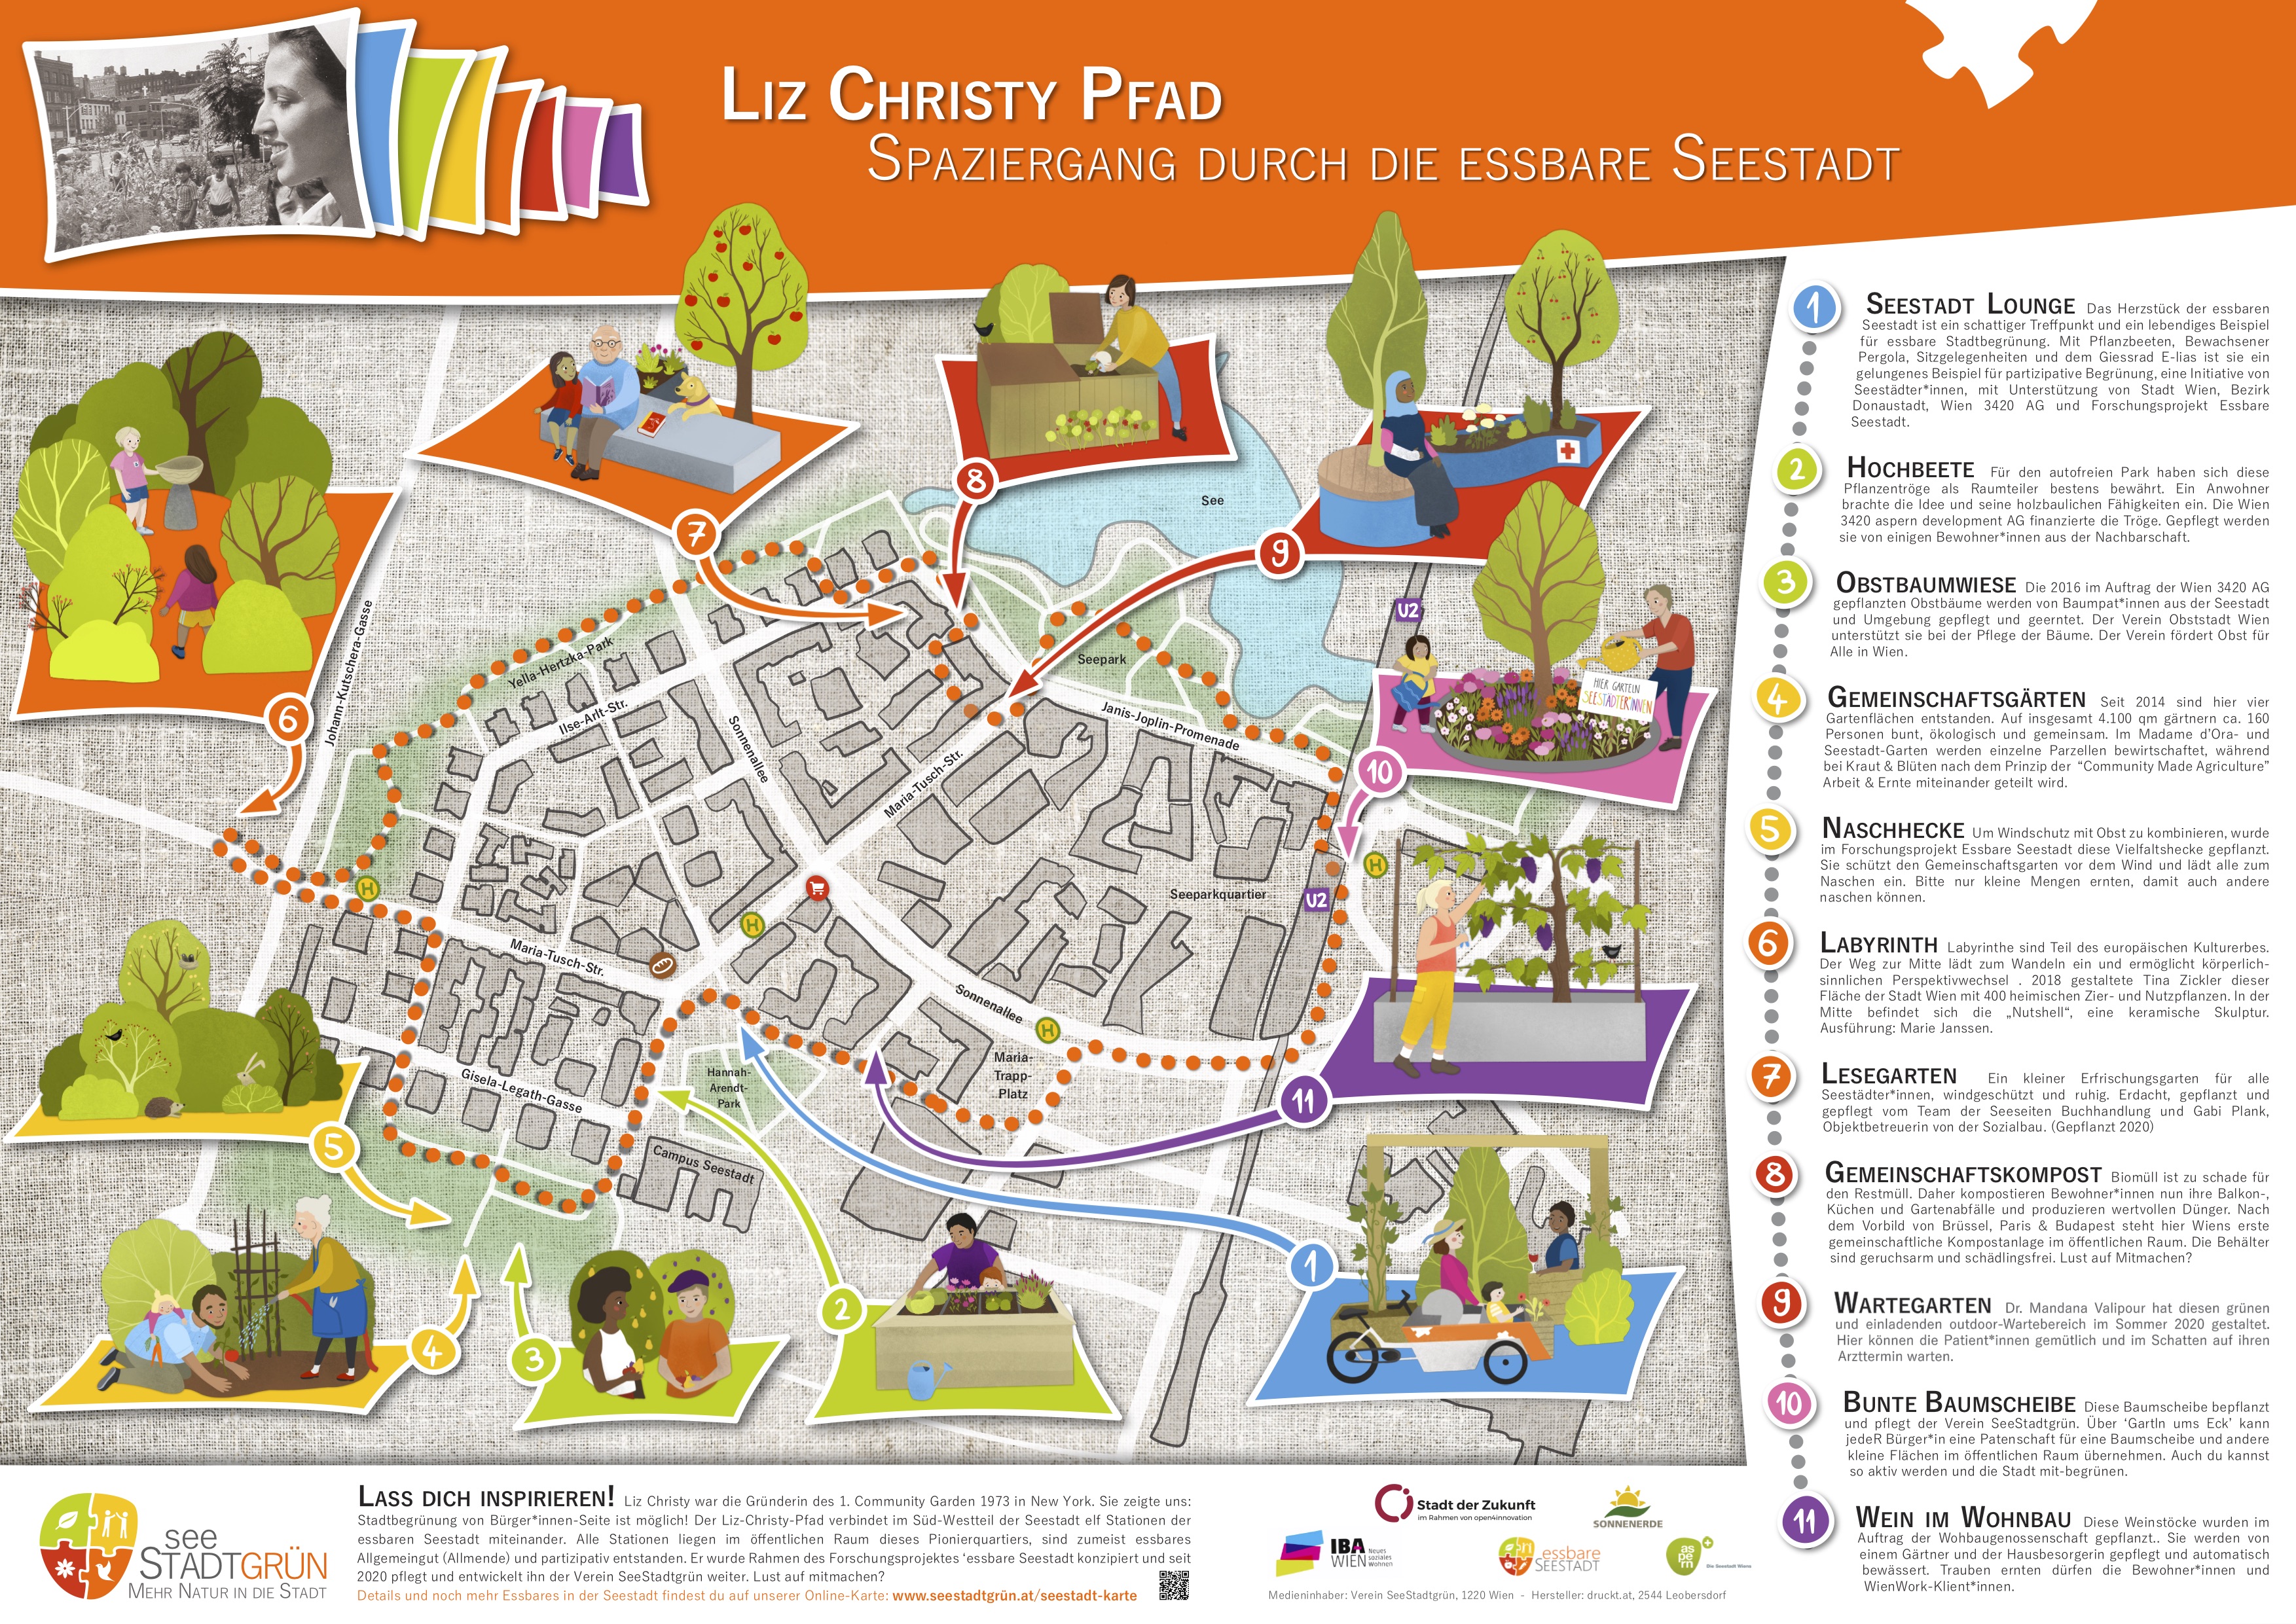
Overview-panel of the Liz Christy path
The Liz-Christy-path connects eleven stations of the edible Seestadt in Vienna- Aspern. It states good practice examples and gives inspiration and courage for establishing edible urban gardening projects.