
Project Image Pool
There are 199 results.
Terms of use: The pictures on this site originate from the projects in the frame of the programmes City of Tomorrow, Building of Tomorrow and the IEA Research Cooperation. They may be used credited for non-commercial purposes under the Creative Commons License Attribution-NonCommercial (CC BY-NC).
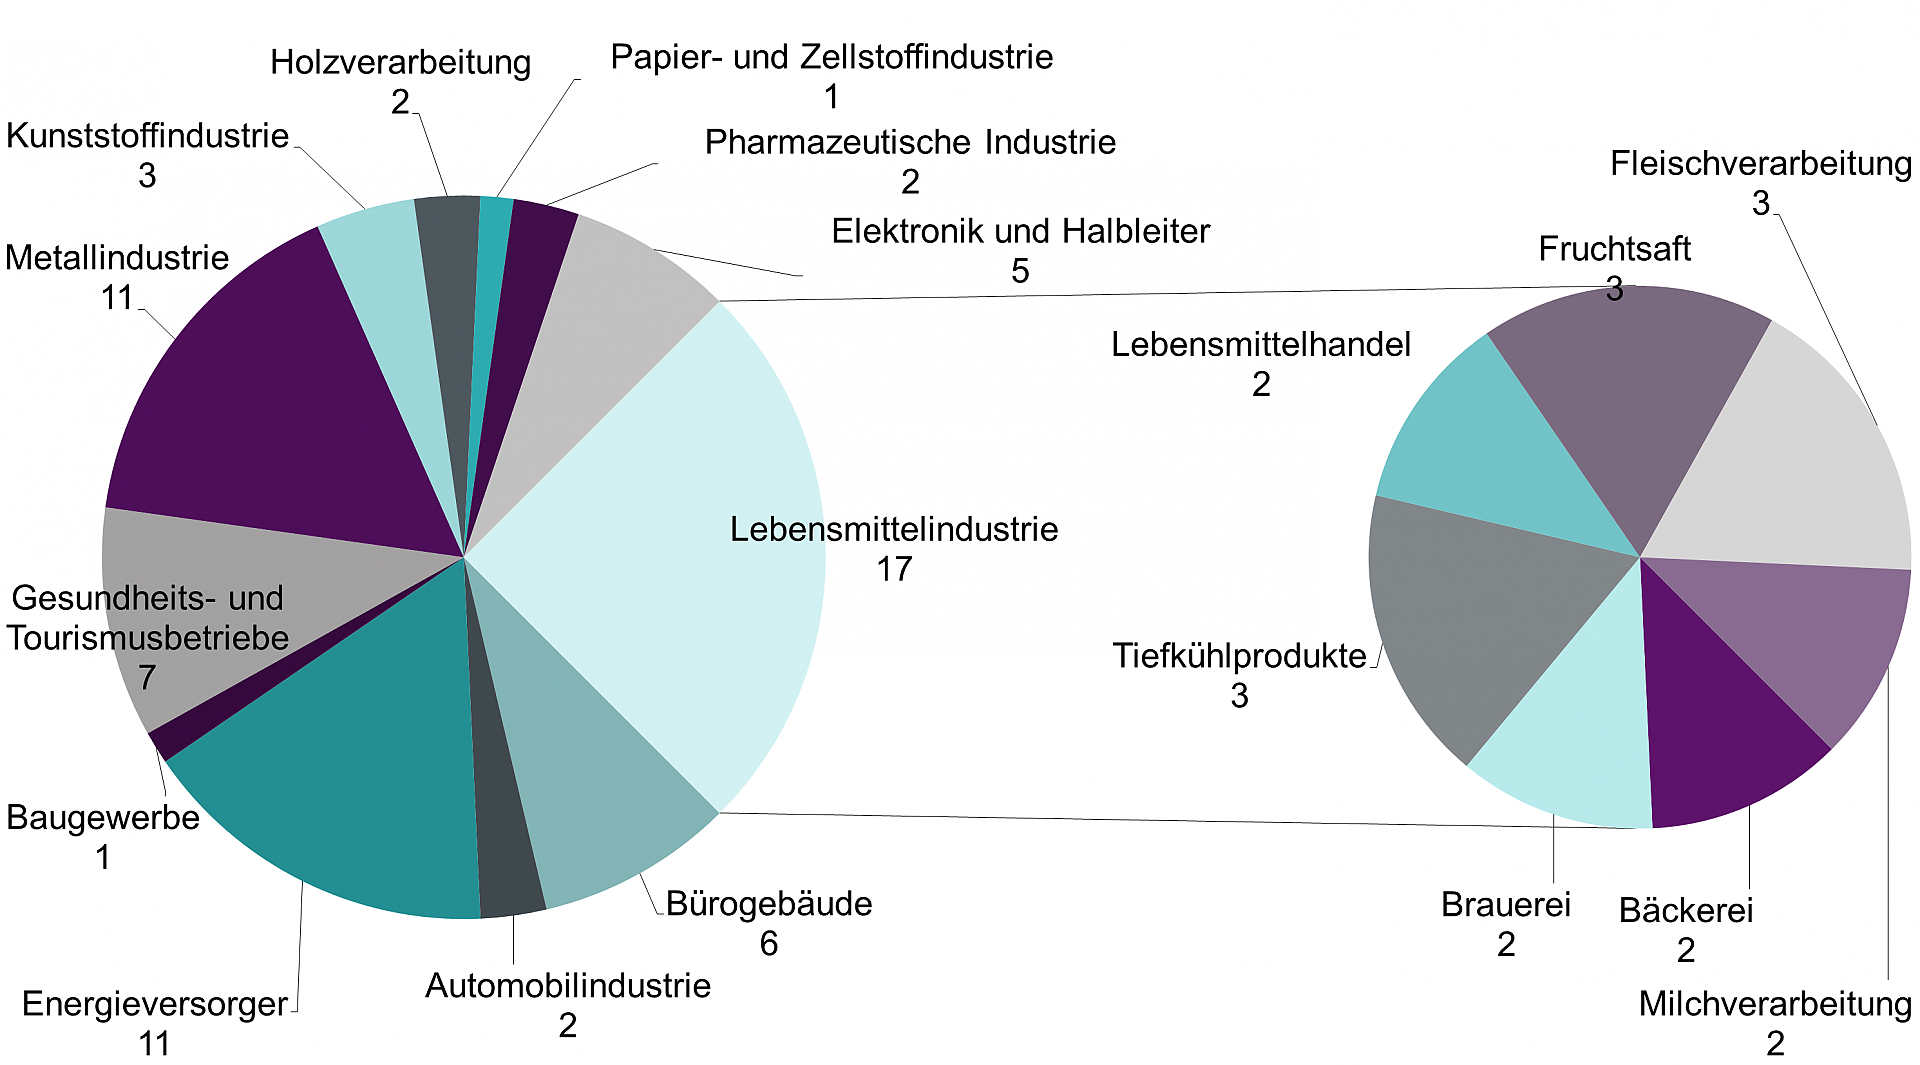
Austrian examples for industrial heat pumps, distribution in industrial sectors
A total of 68 examples of industrial heat pumps in Austria were collected. Those systems are considered that are integrated into an industrial or commercial process on the heat source and/or sink side. The examples come from various sectors whose good suitability for heat pumps is already known, such as the food industry (17 examples), energy suppliers (11 examples) and the metal processing industry (11 examples).
Copyright: AIT Austrian Institute of Technology GmbH, TU Graz

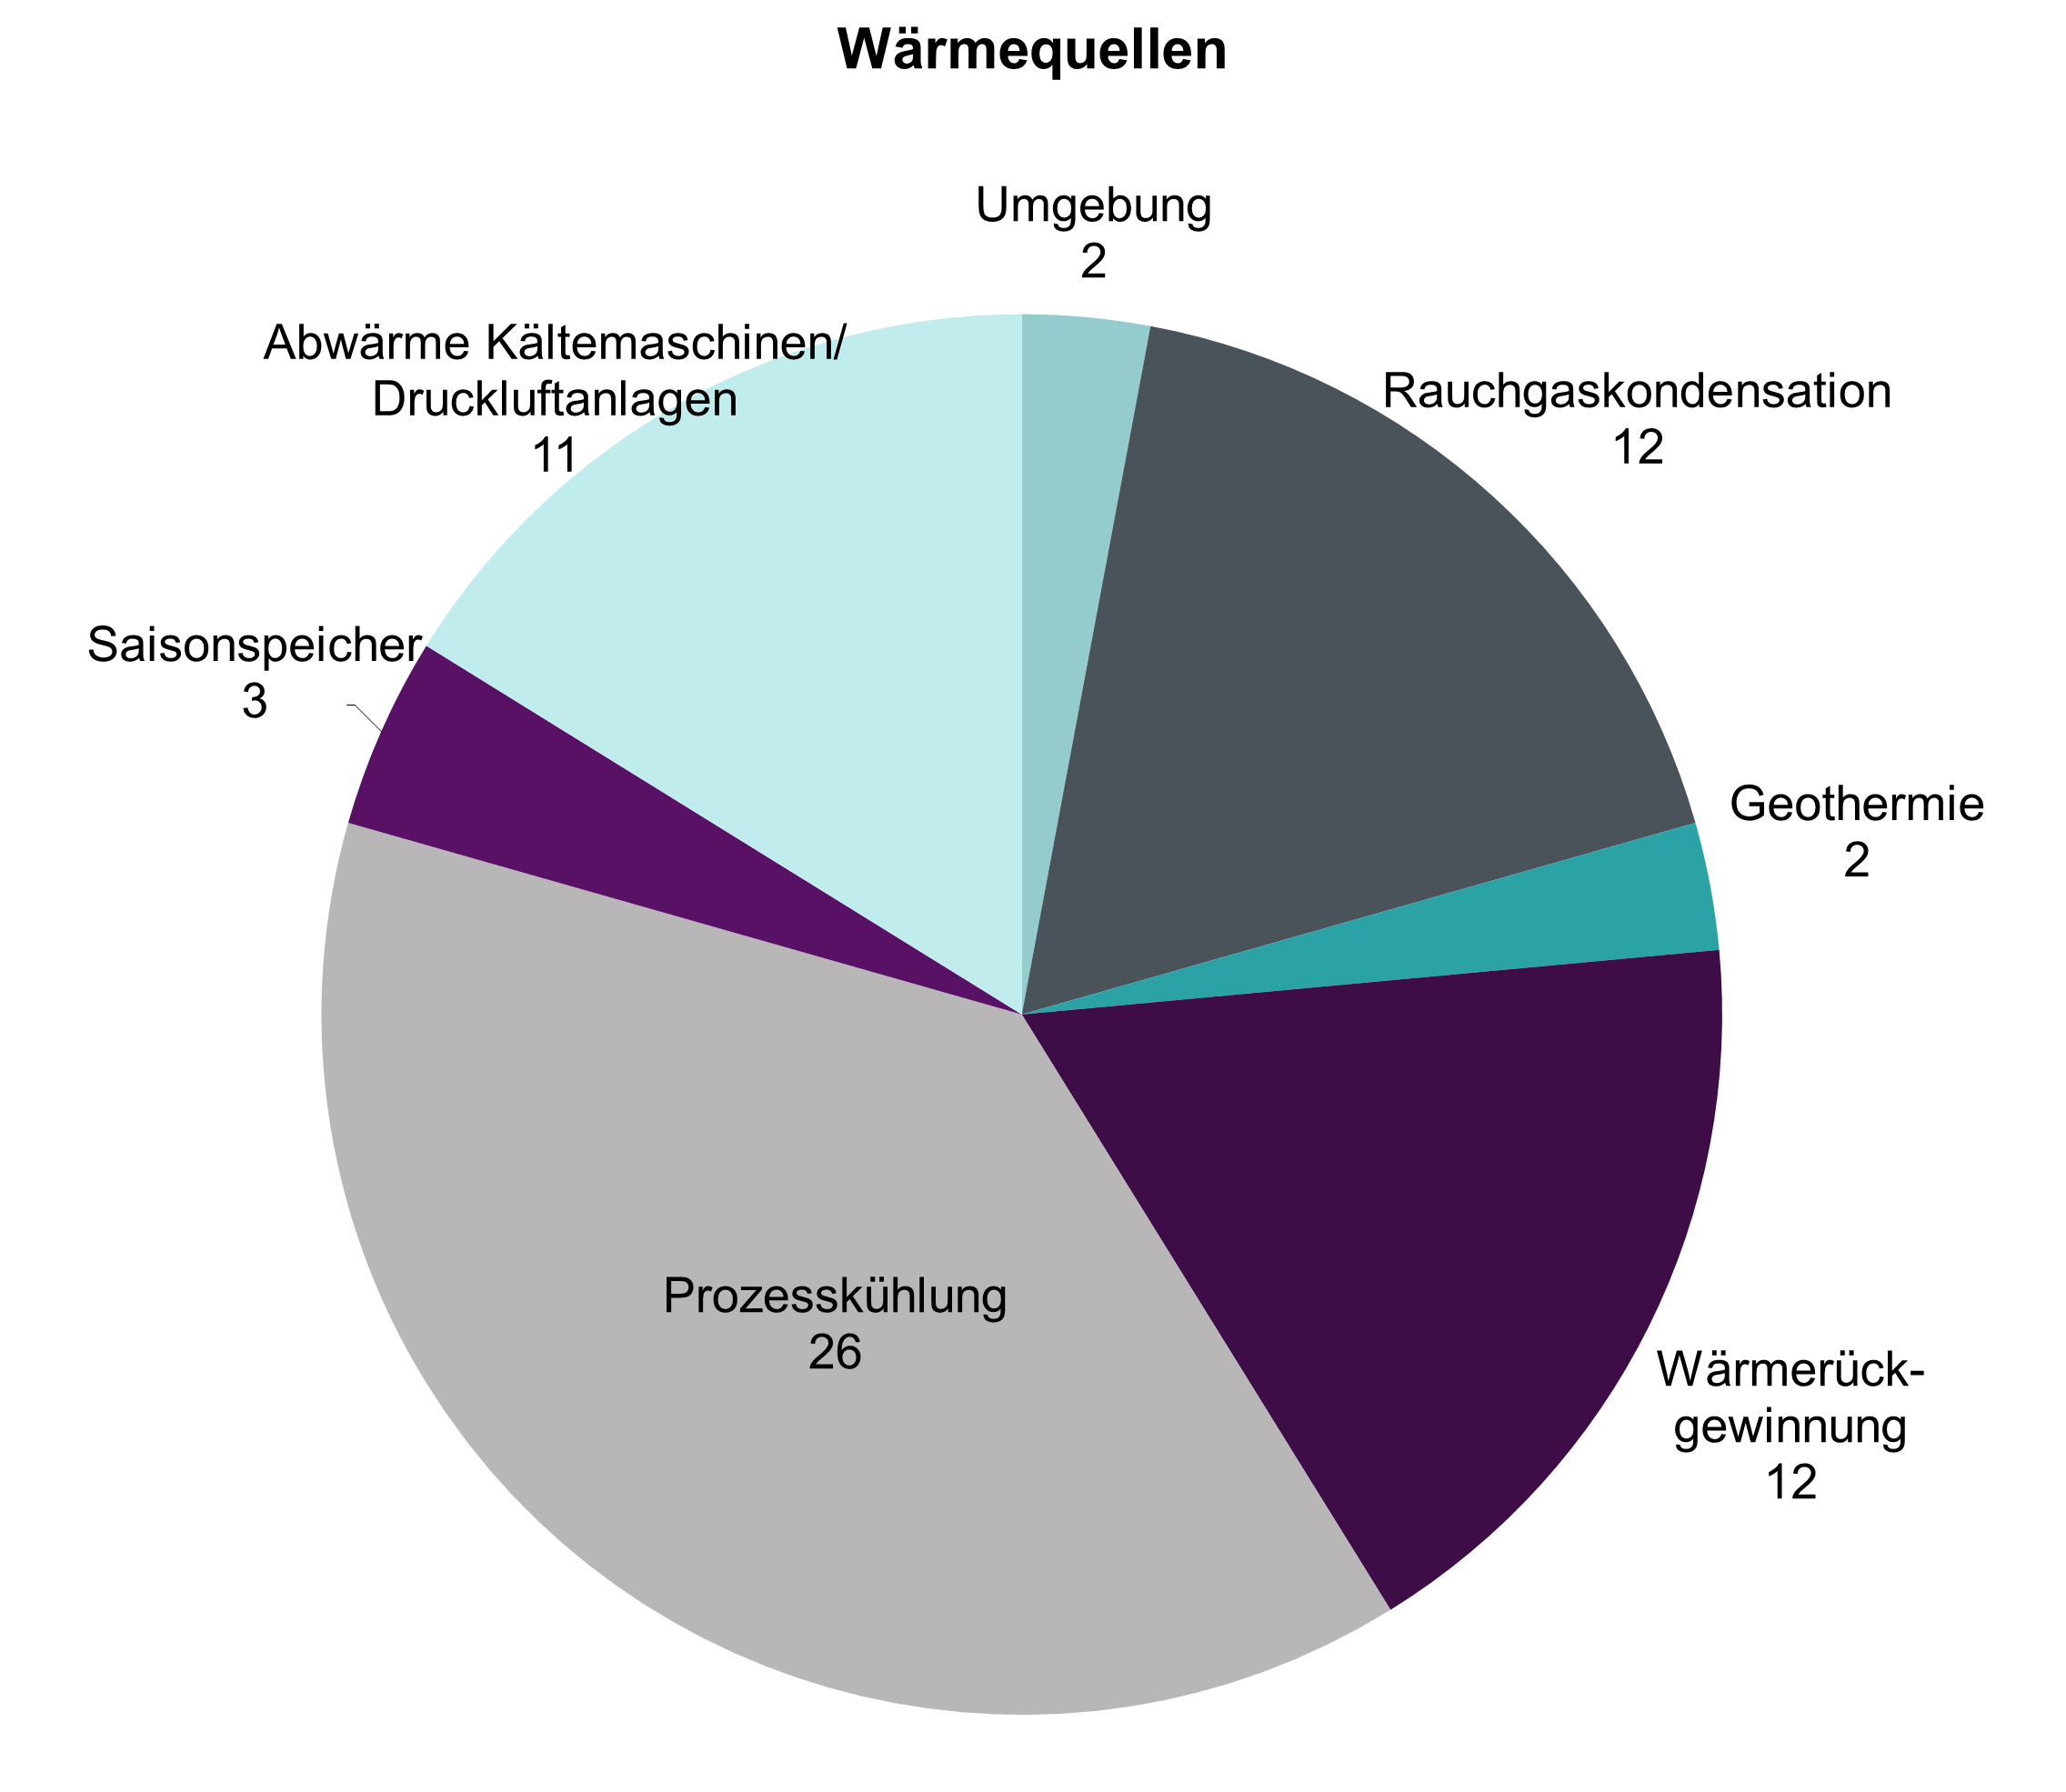
Austrian examples for industrial heat pumps: heat sources
Different heat sources are used. The most common heat sources are processes that need to be cooled and waste heat streams, that still usable heat. In addition, waste heat from refrigerating machines and compressed air systems as well as flue gas condensation is used.
Copyright: AIT Austrian Institute of Technology GmbH, TU Graz
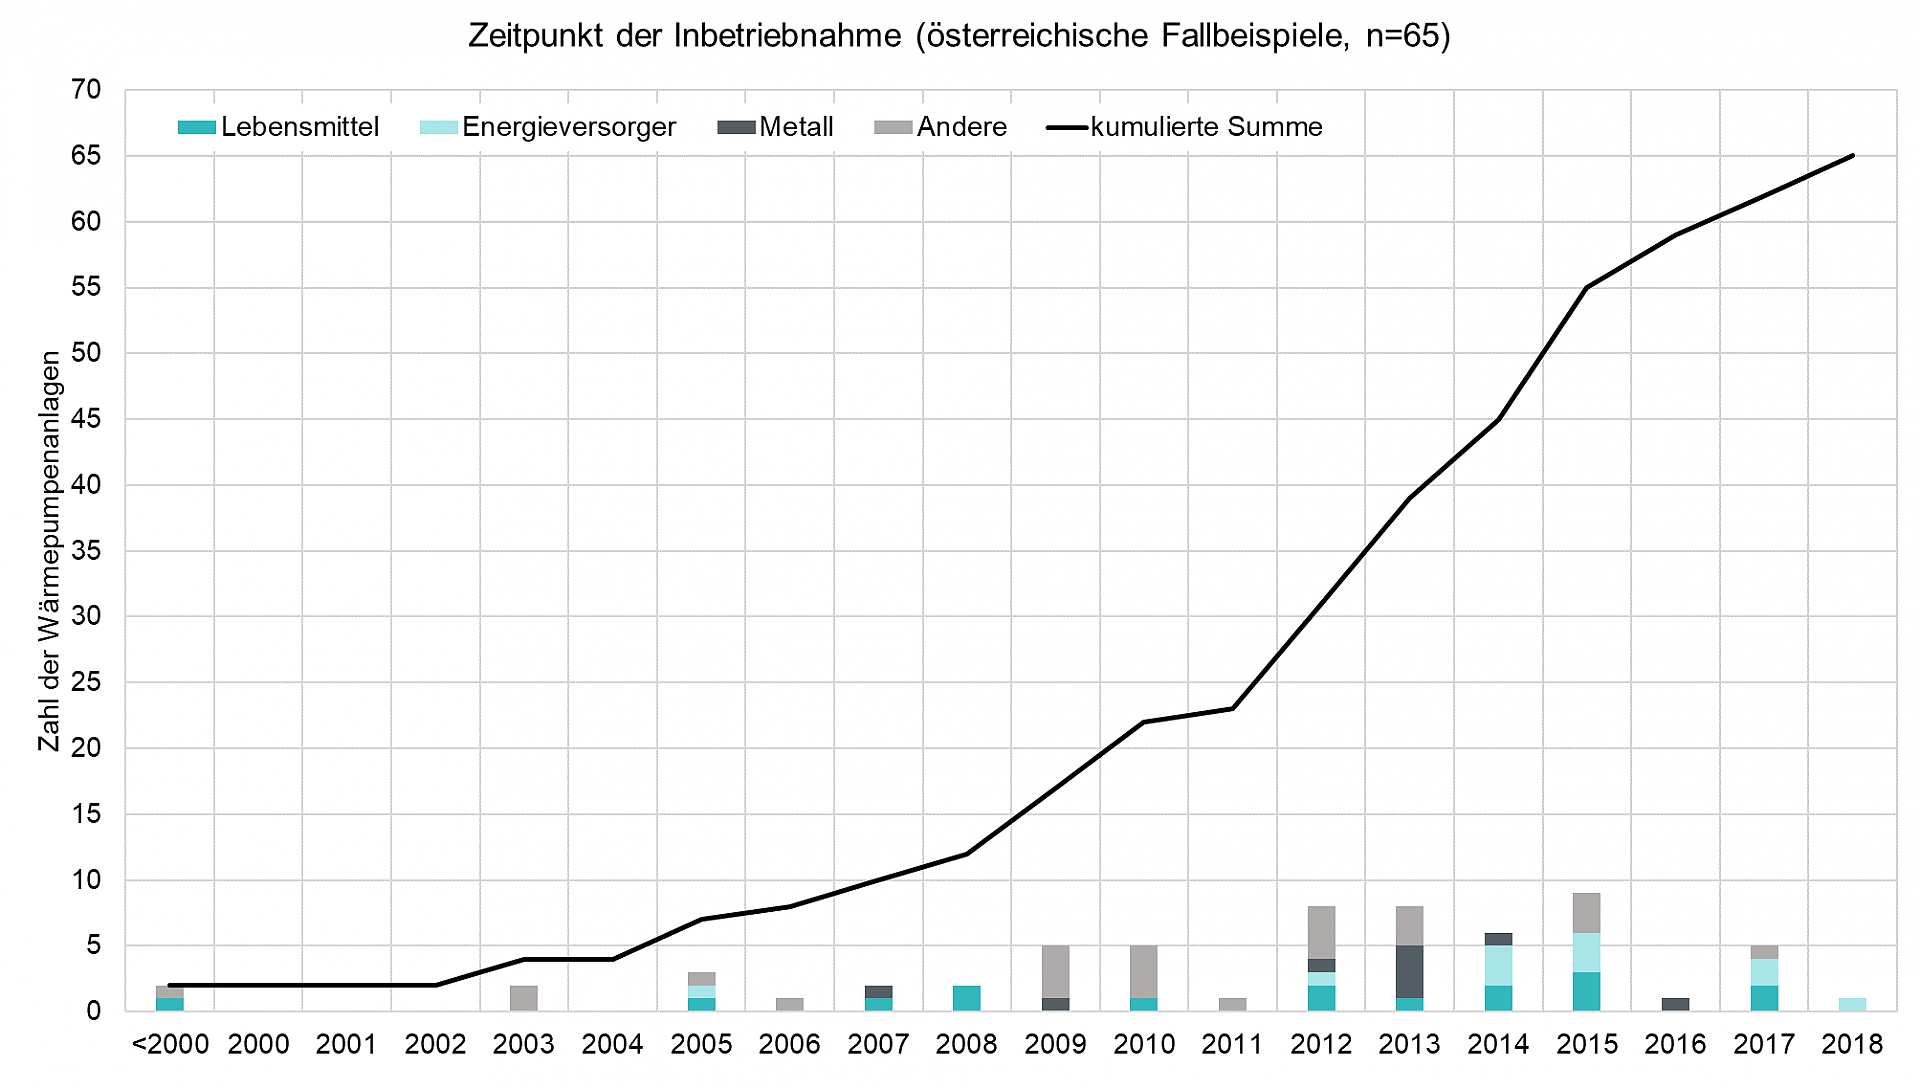
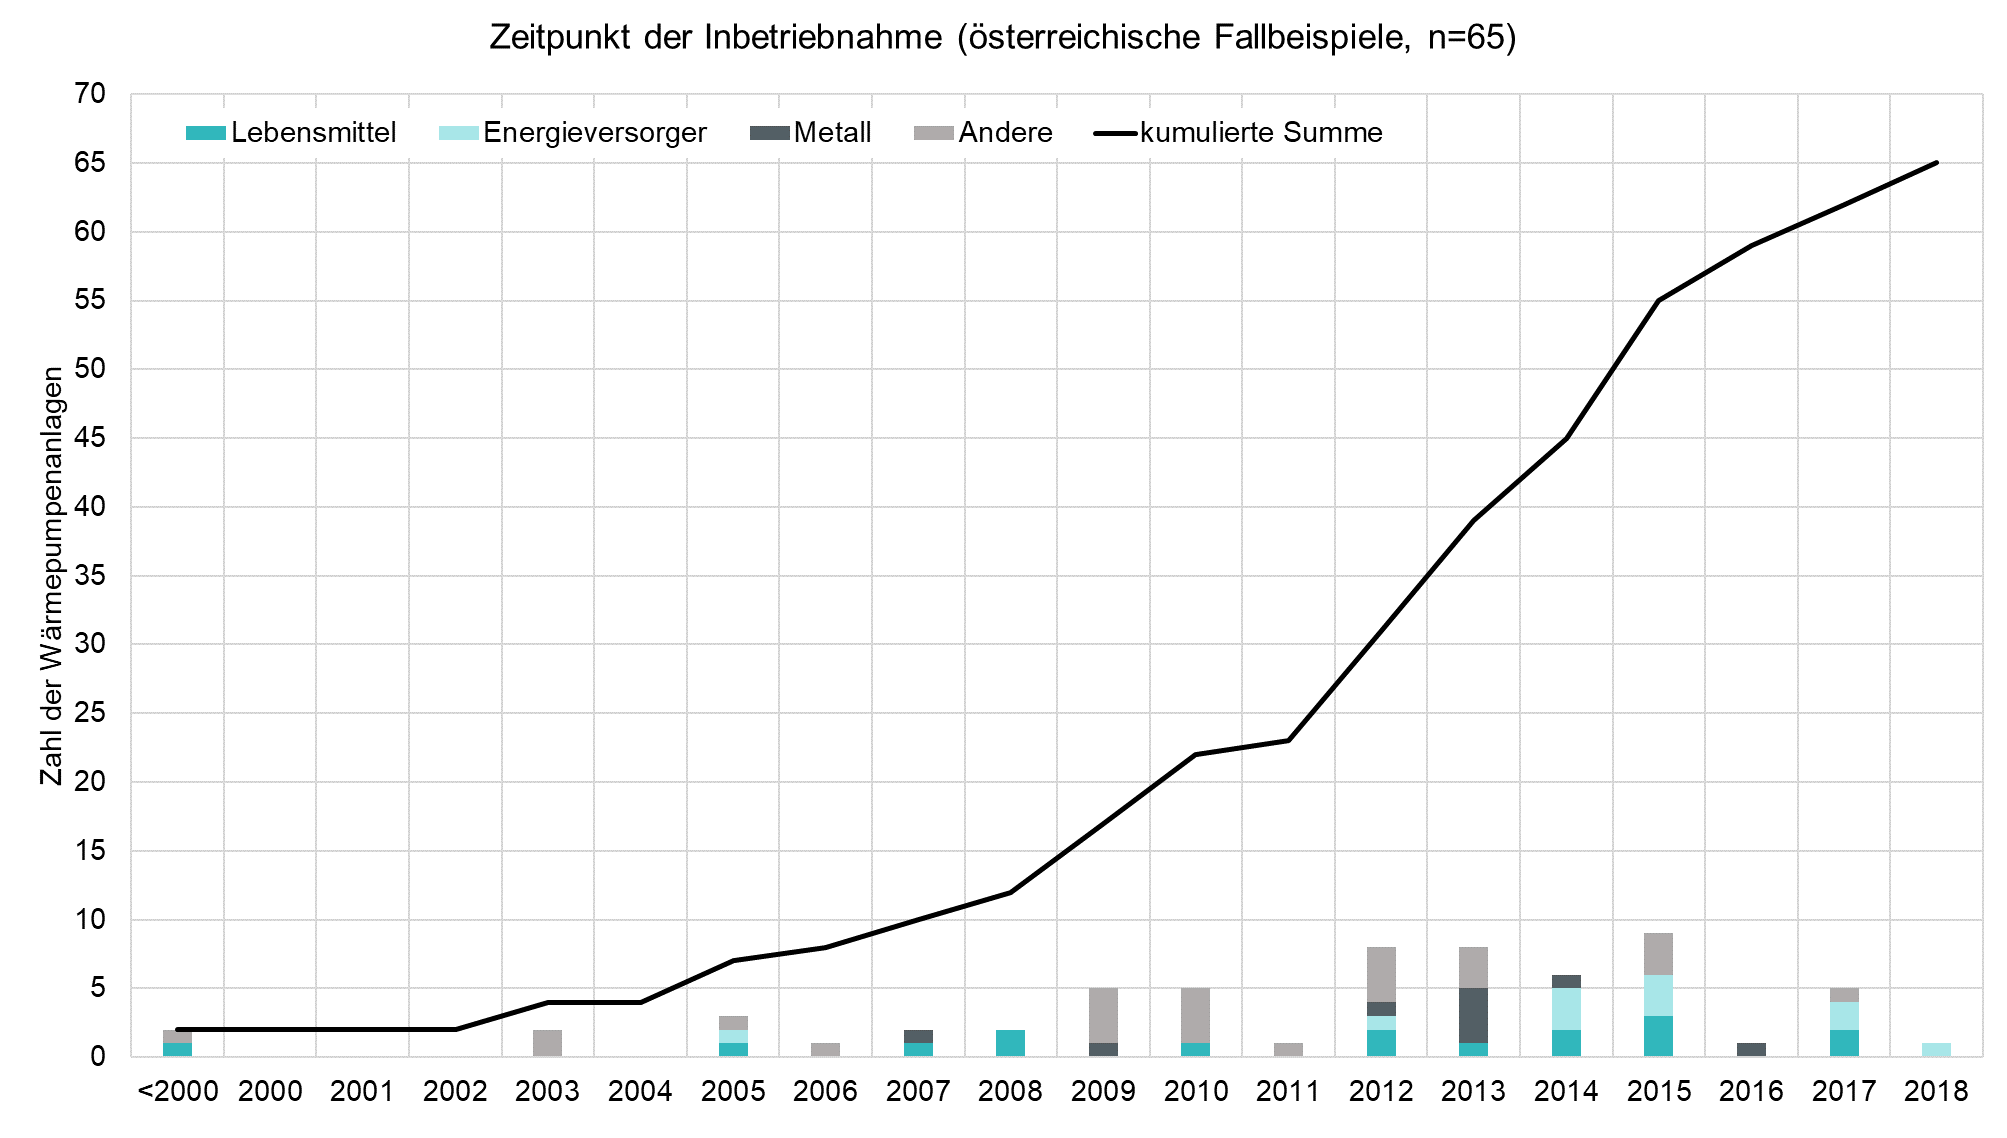
Austrian examples for industrial heat pumps: time of commissioning
Numerous industrial heat pumps were put into operation after 2012. This clearly shows that the spread of industrial heat pumps in Austria is increasing and that more information about these systems is also being published.
Copyright: AIT Austrian Institute of Technology GmbH, TU Graz
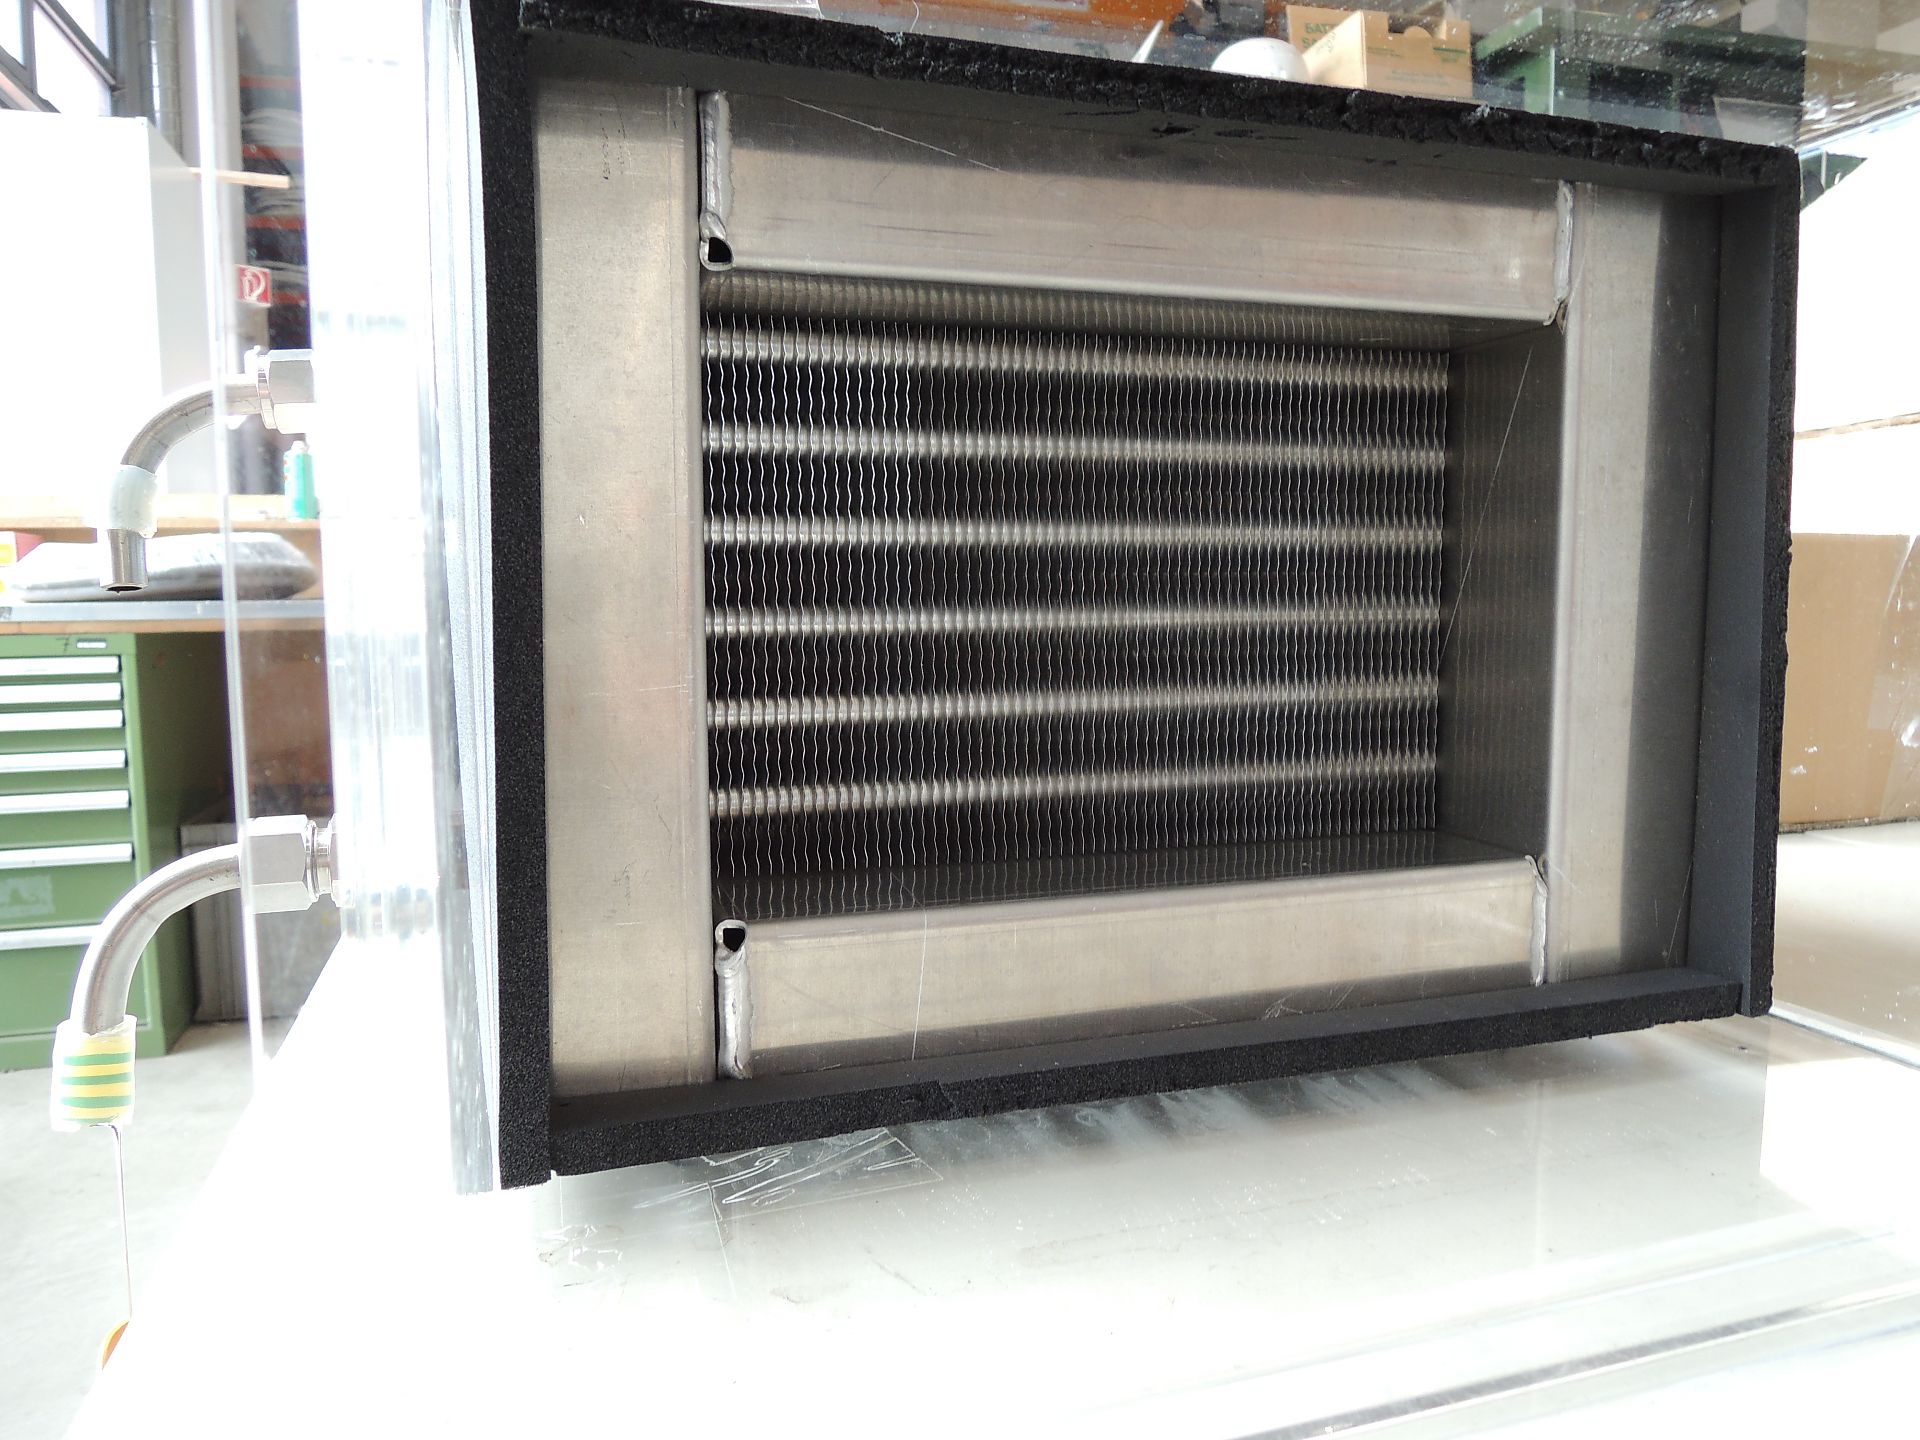
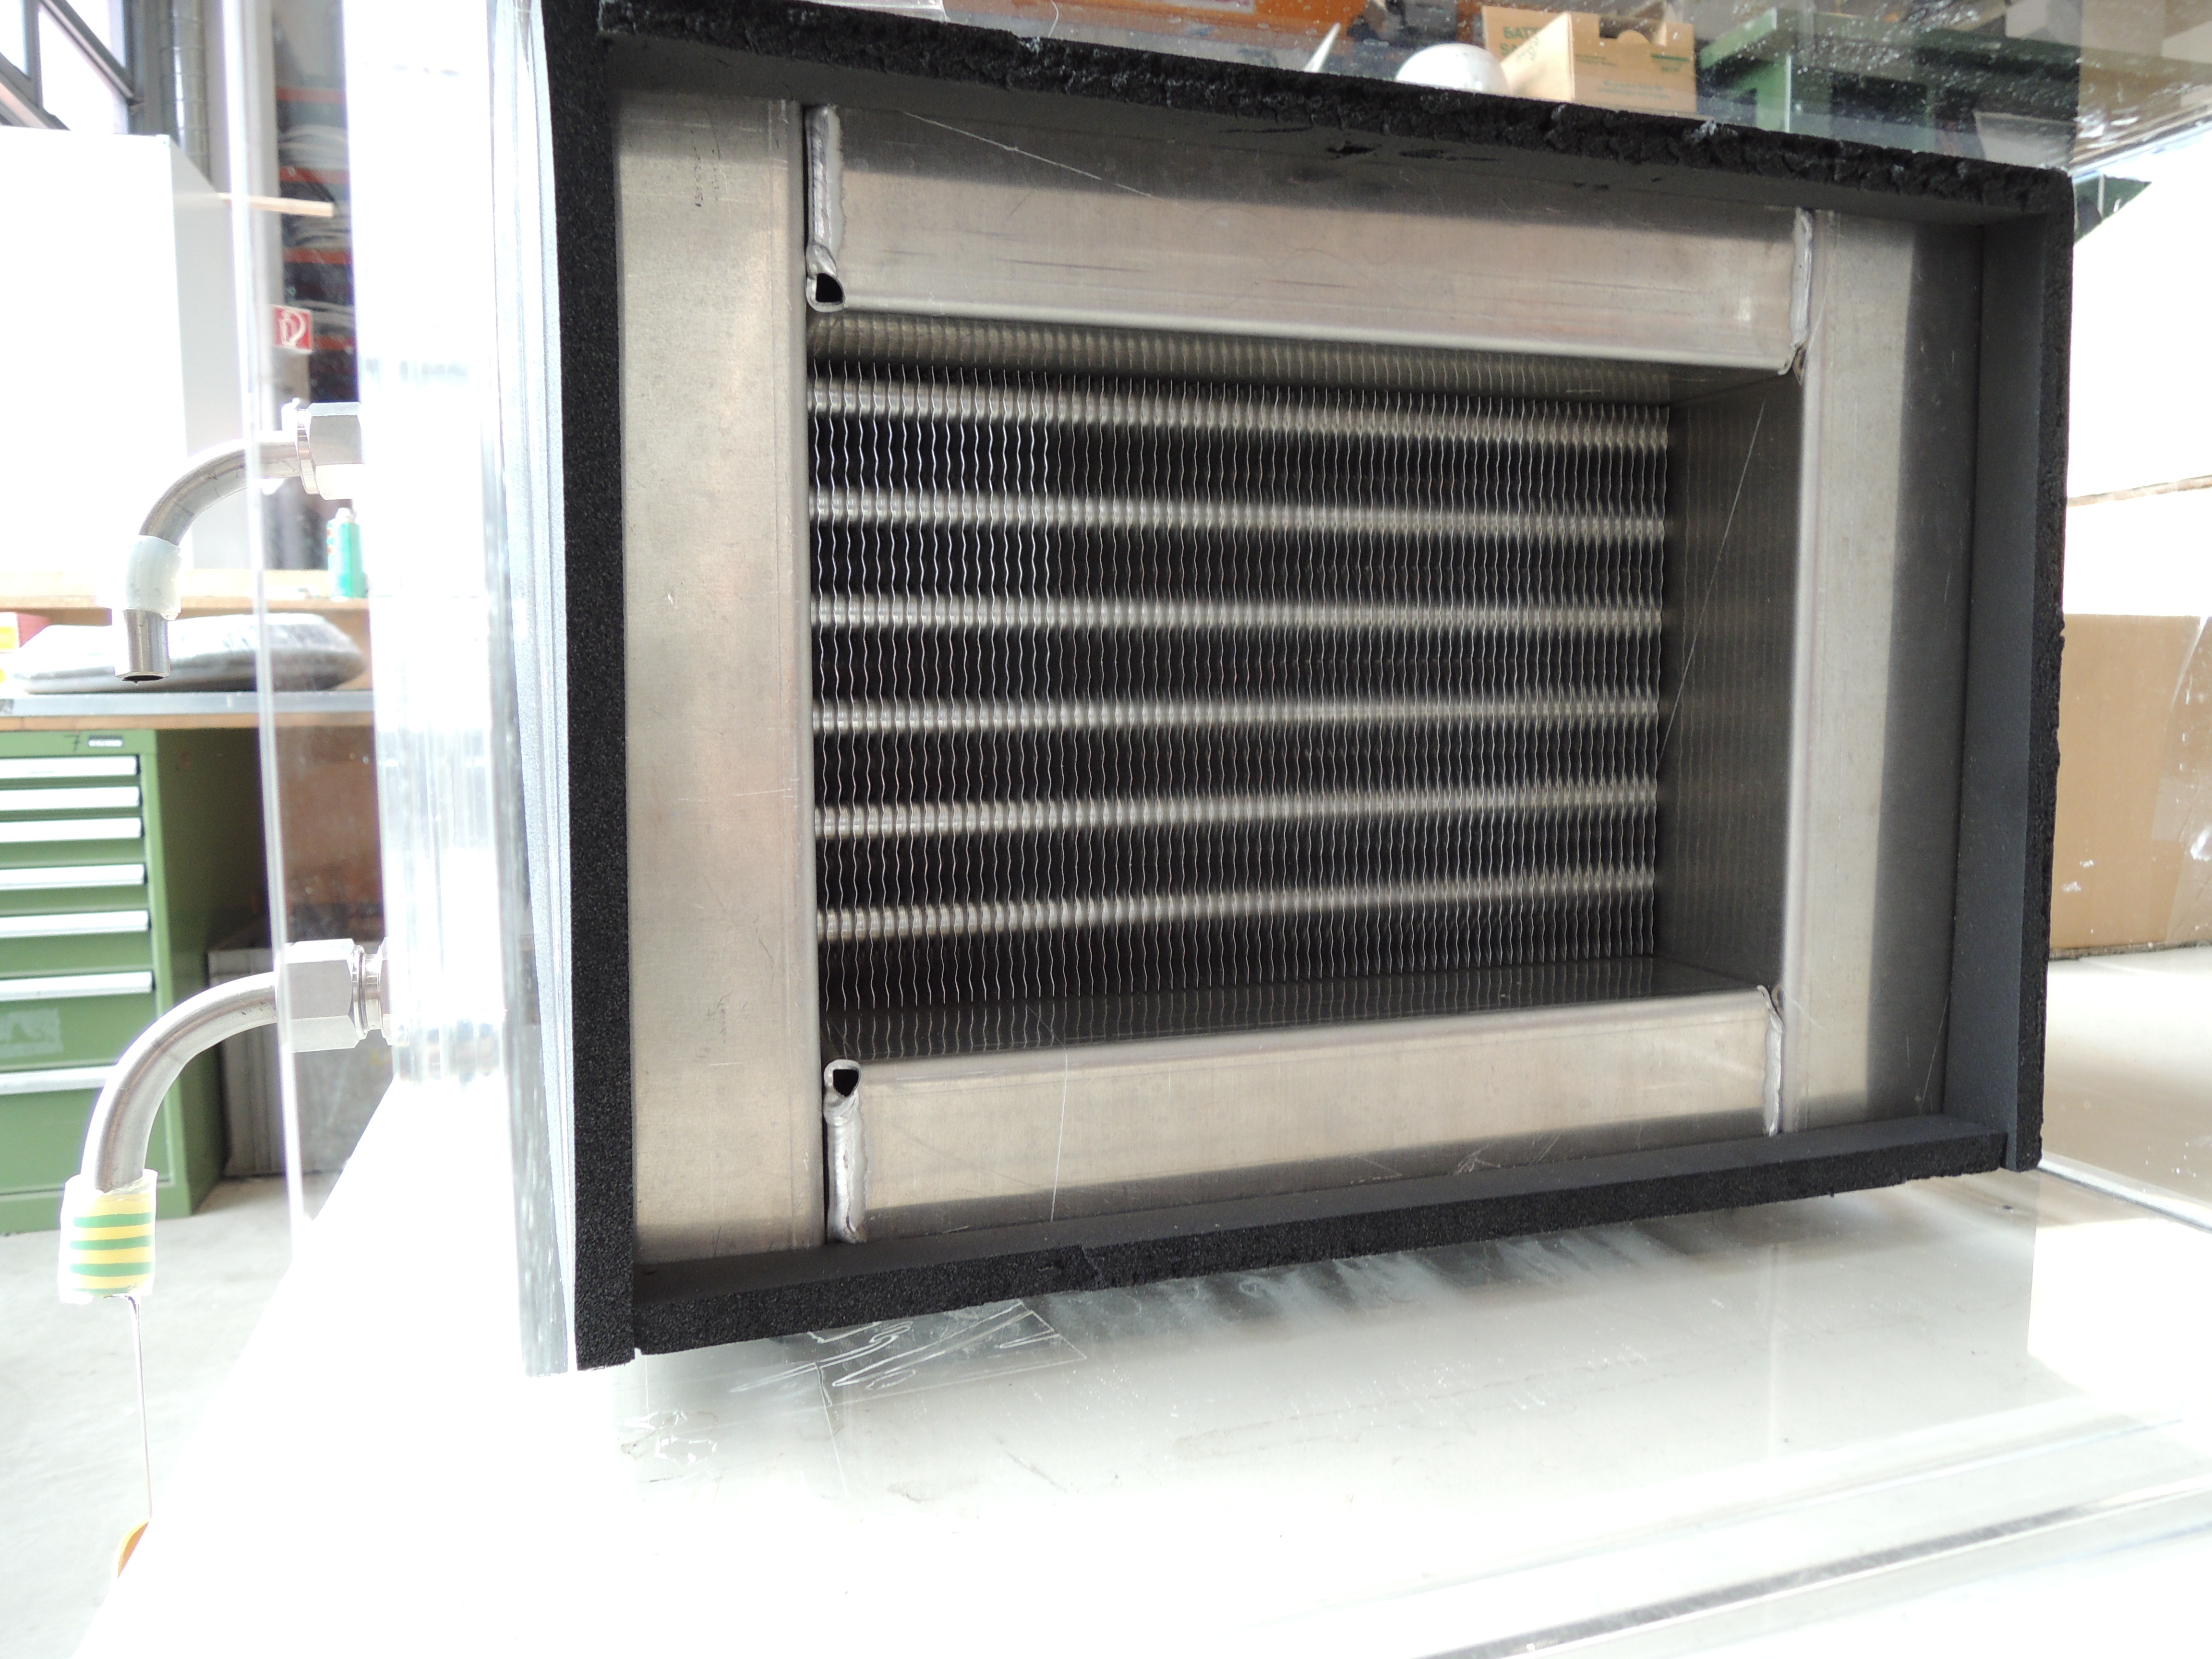
CTfin heat exchanger
Copyright: AIT Austrian Institute of Technology, Center for Energy, Sustainable Thermal Energy Systems
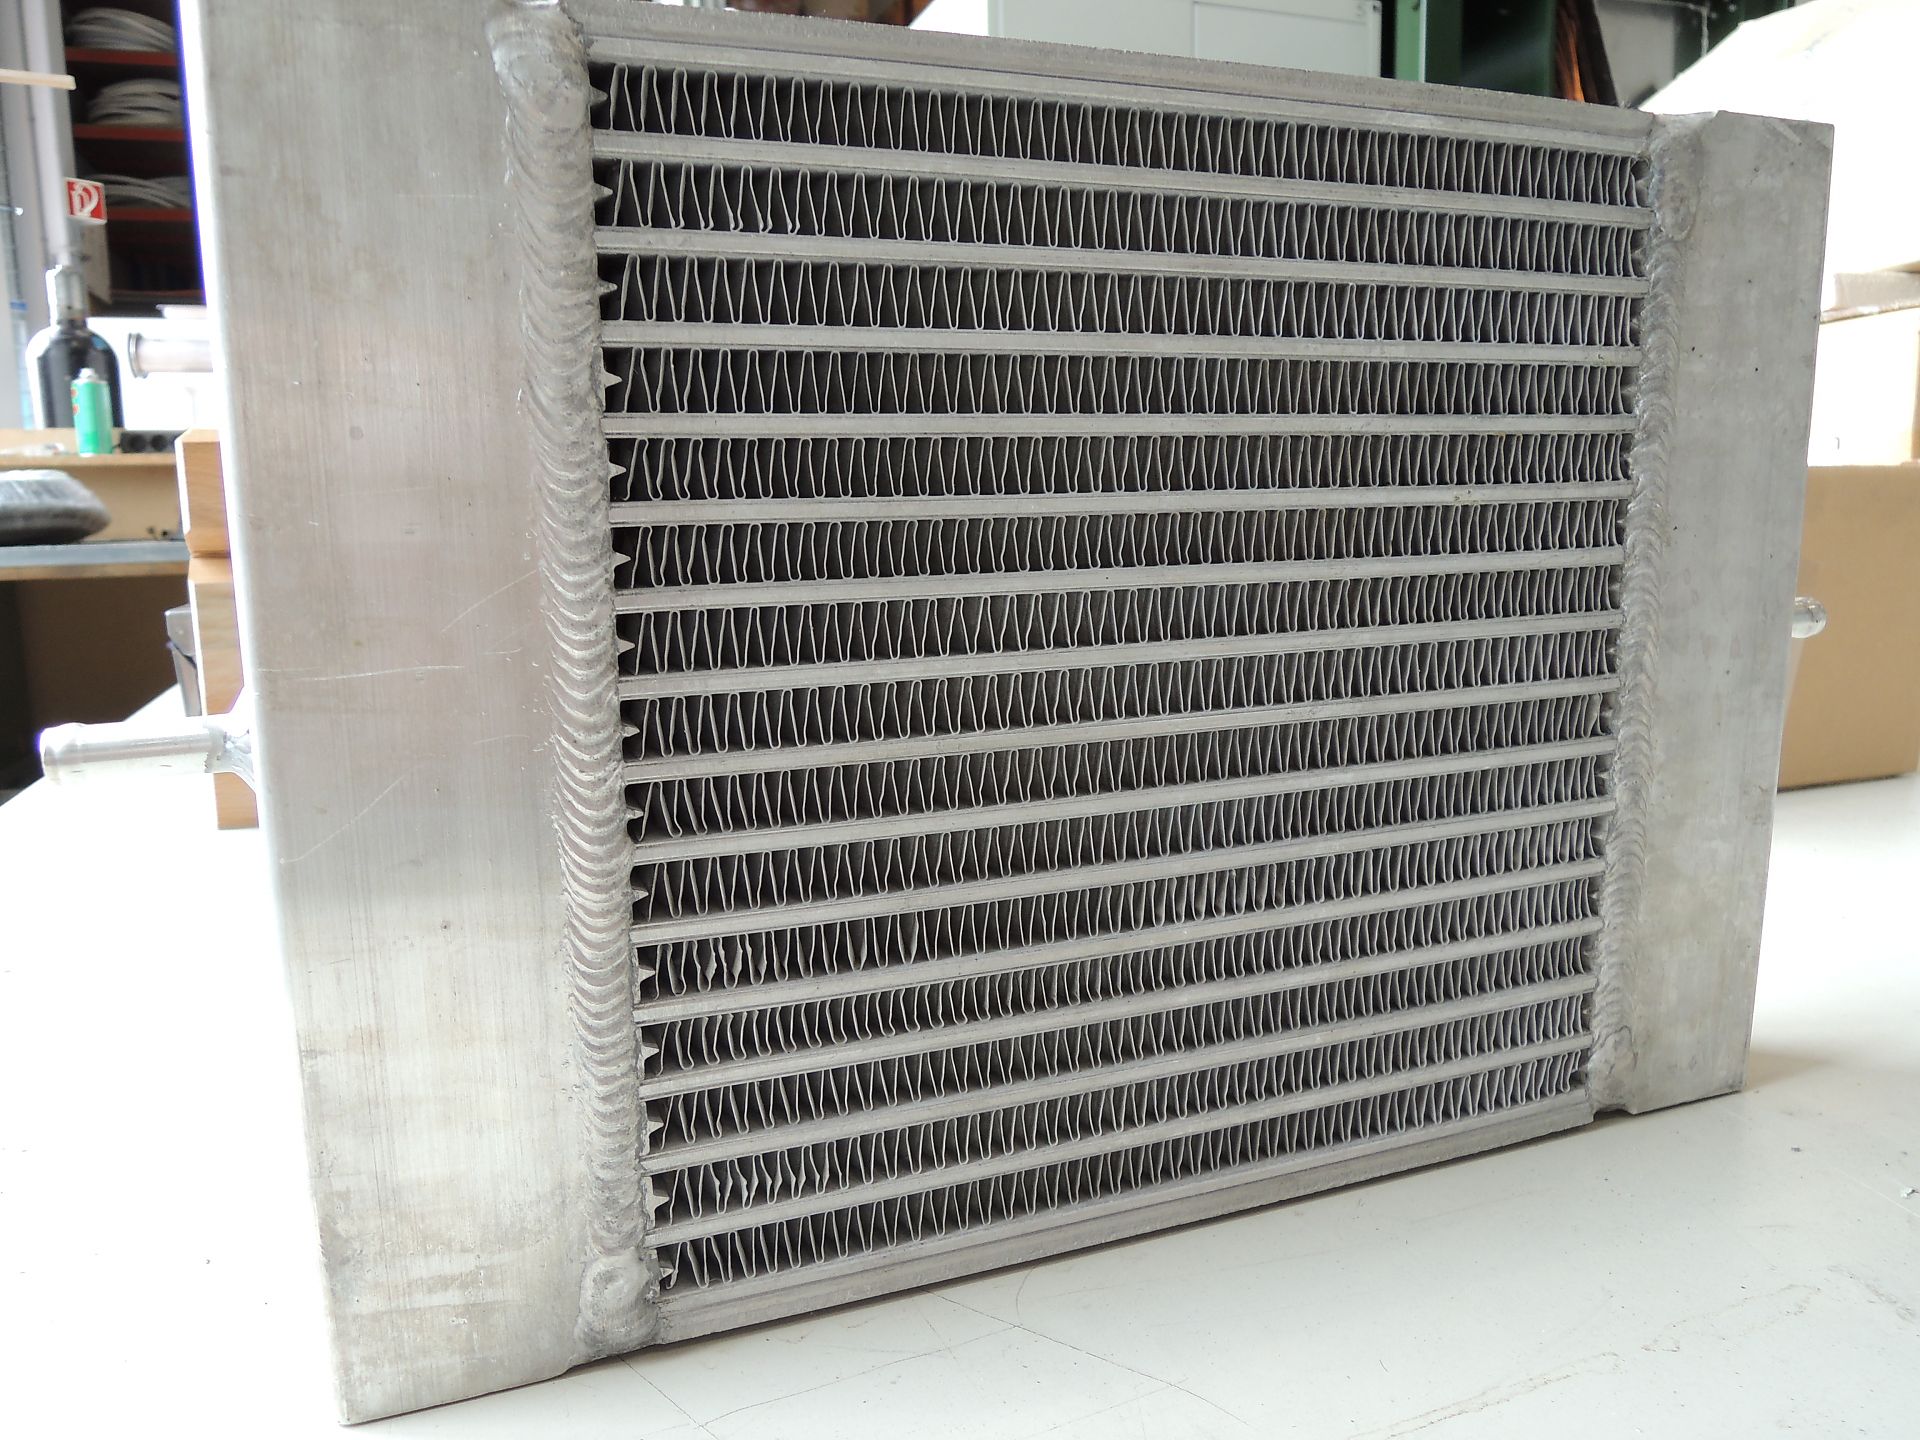
MPEfin heat exchanger
Copyright: AIT Austrian Institute of Technology, Center for Energy, Sustainable Thermal Energy Systems
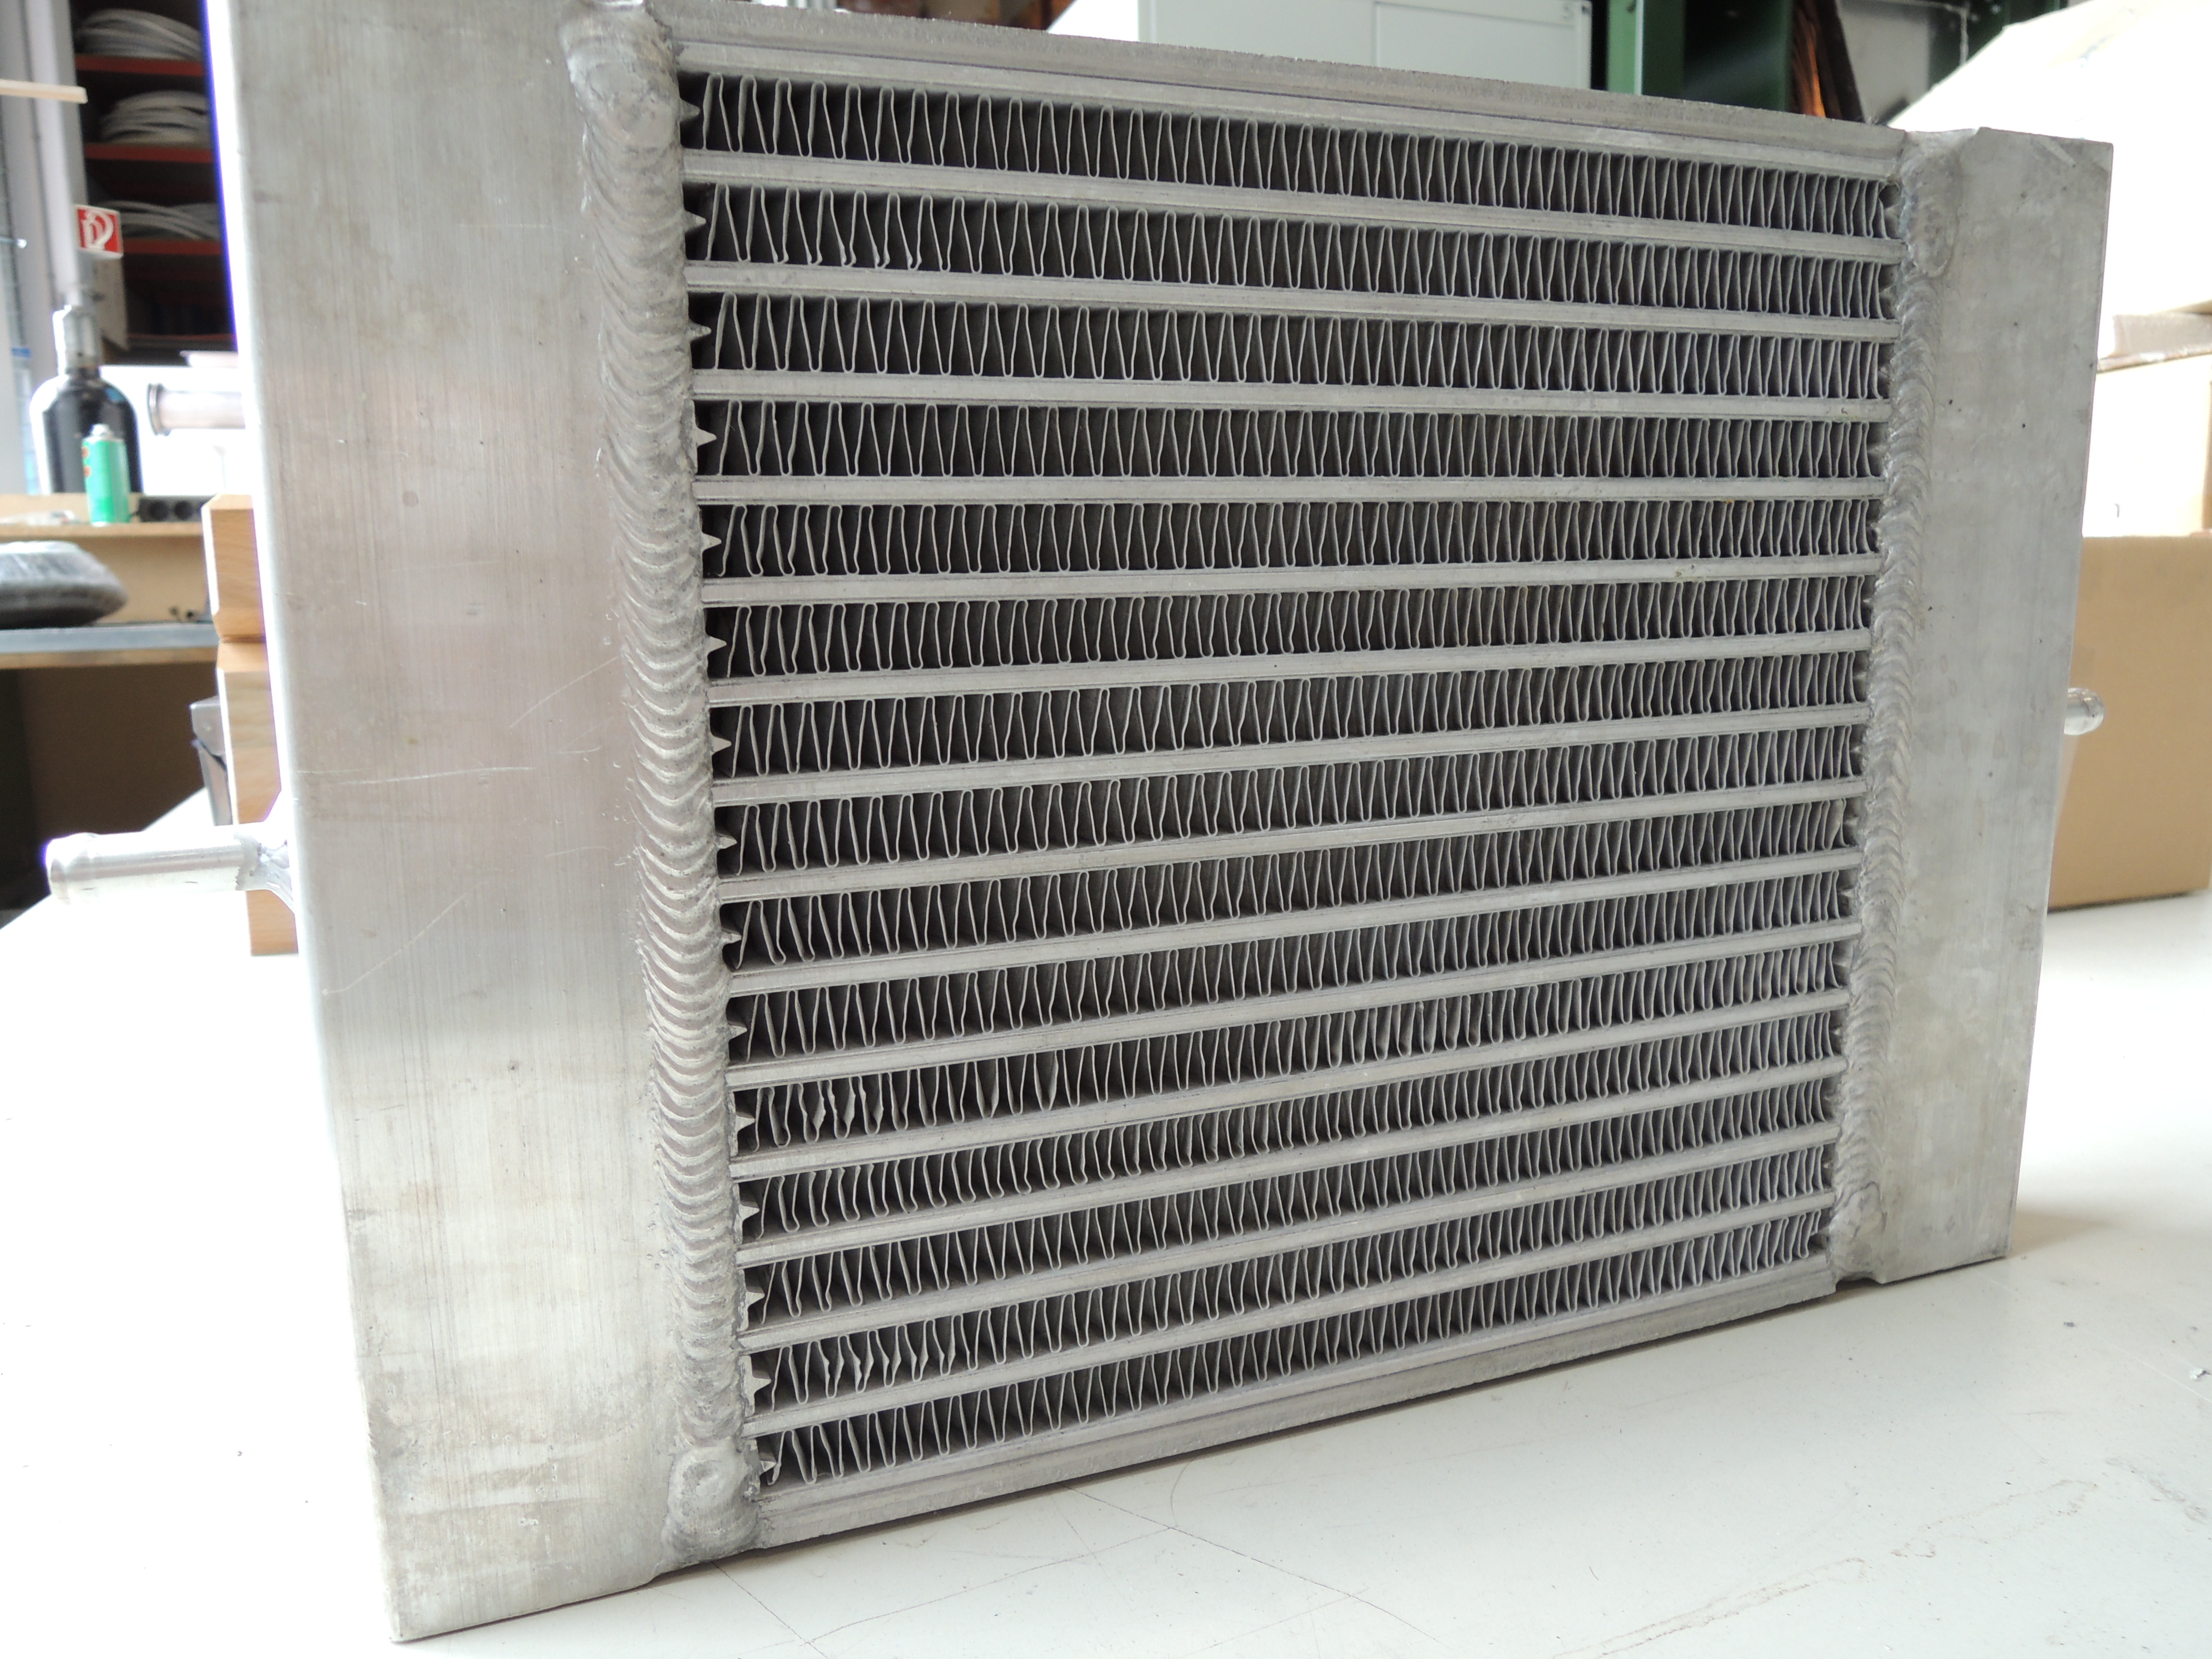
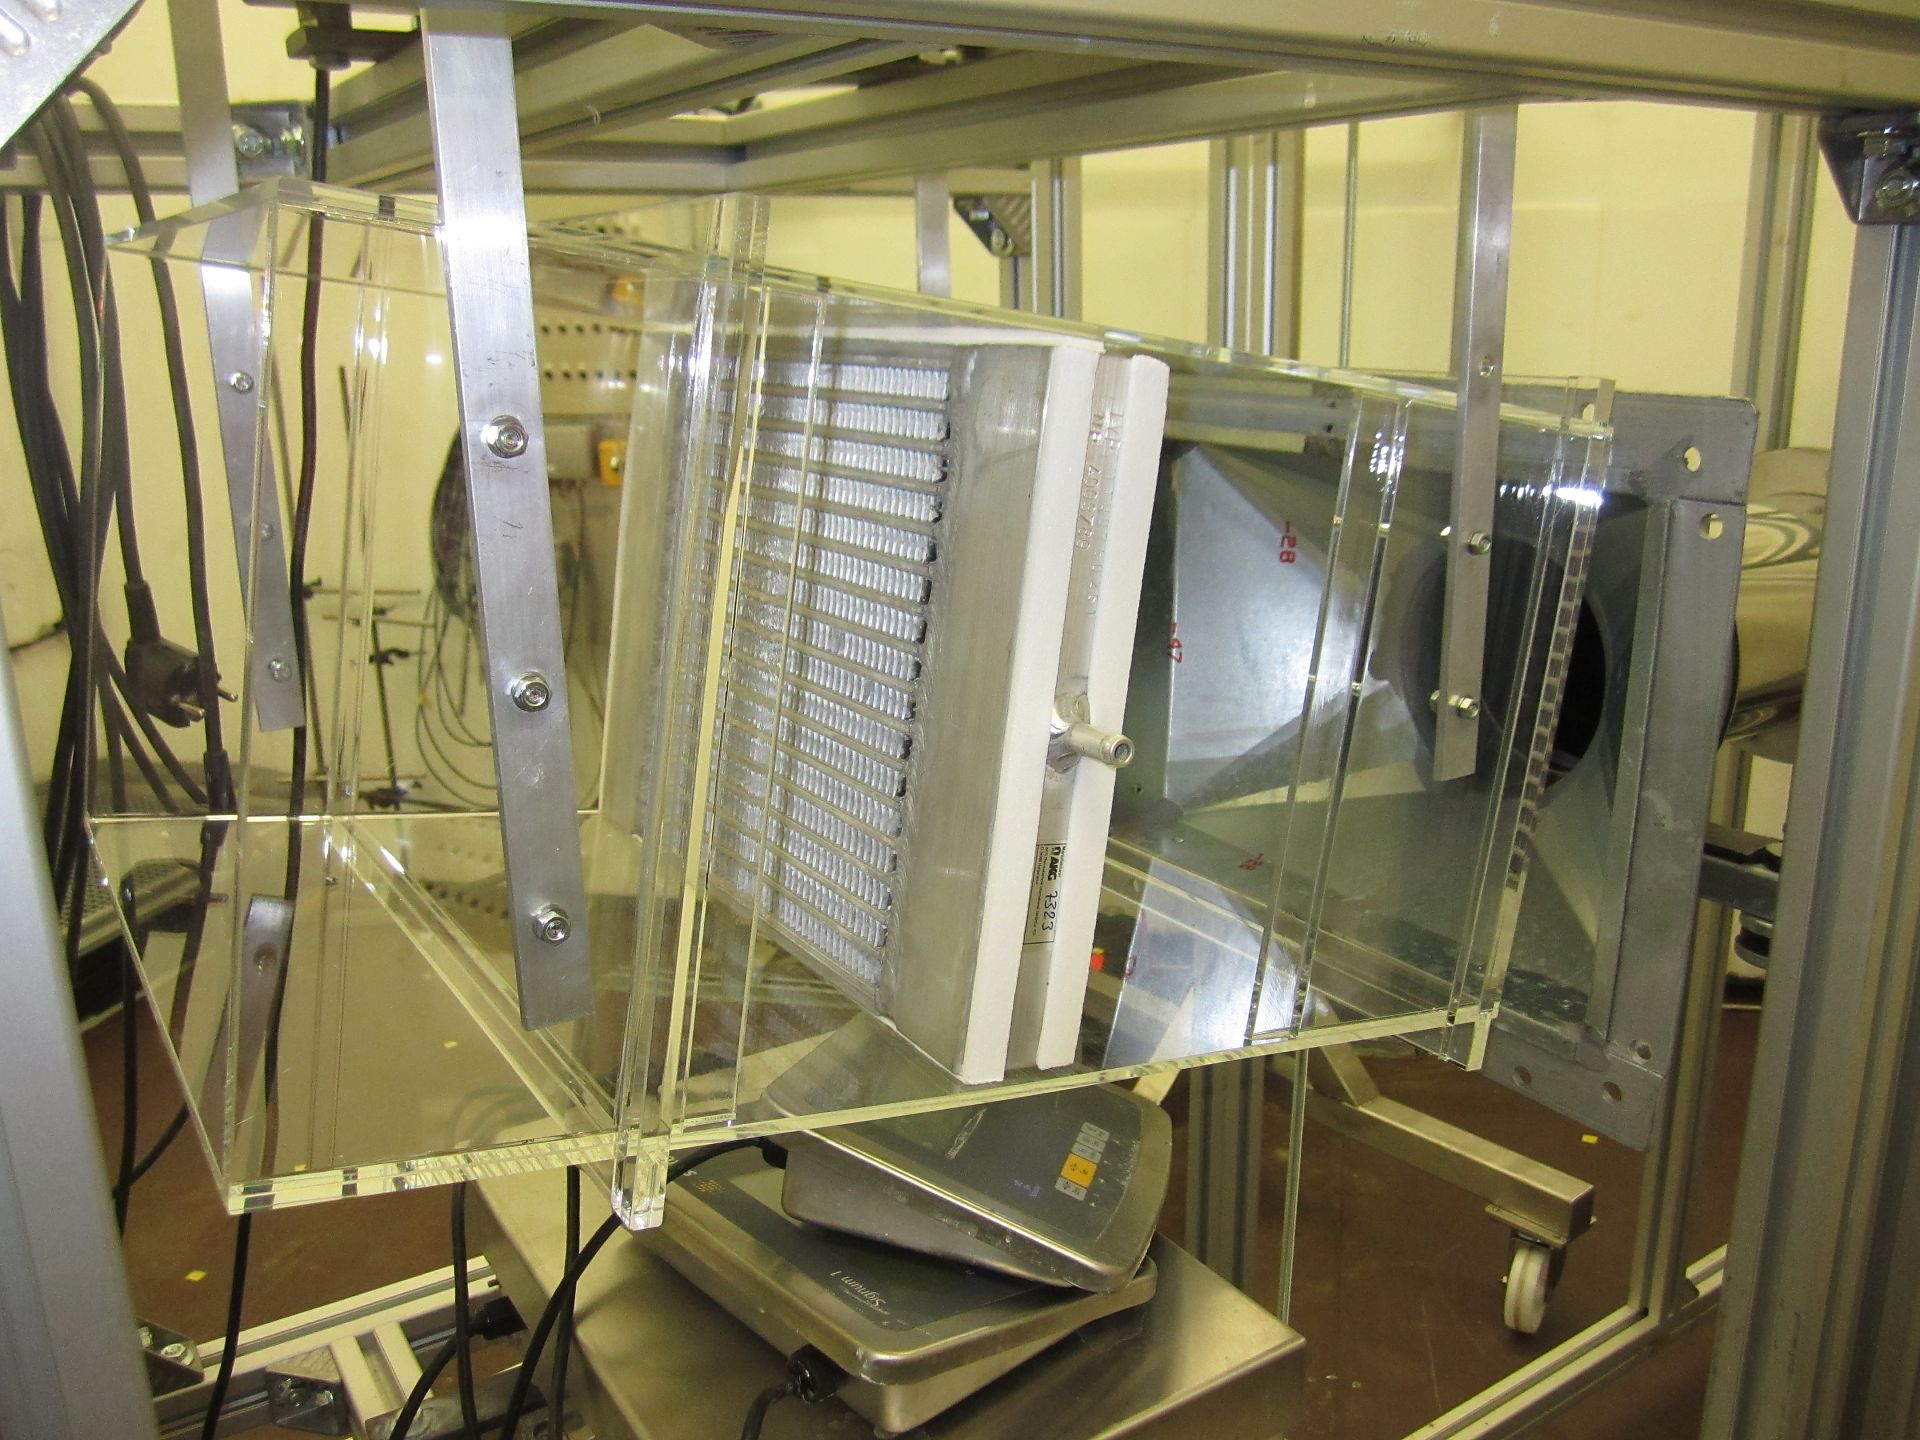
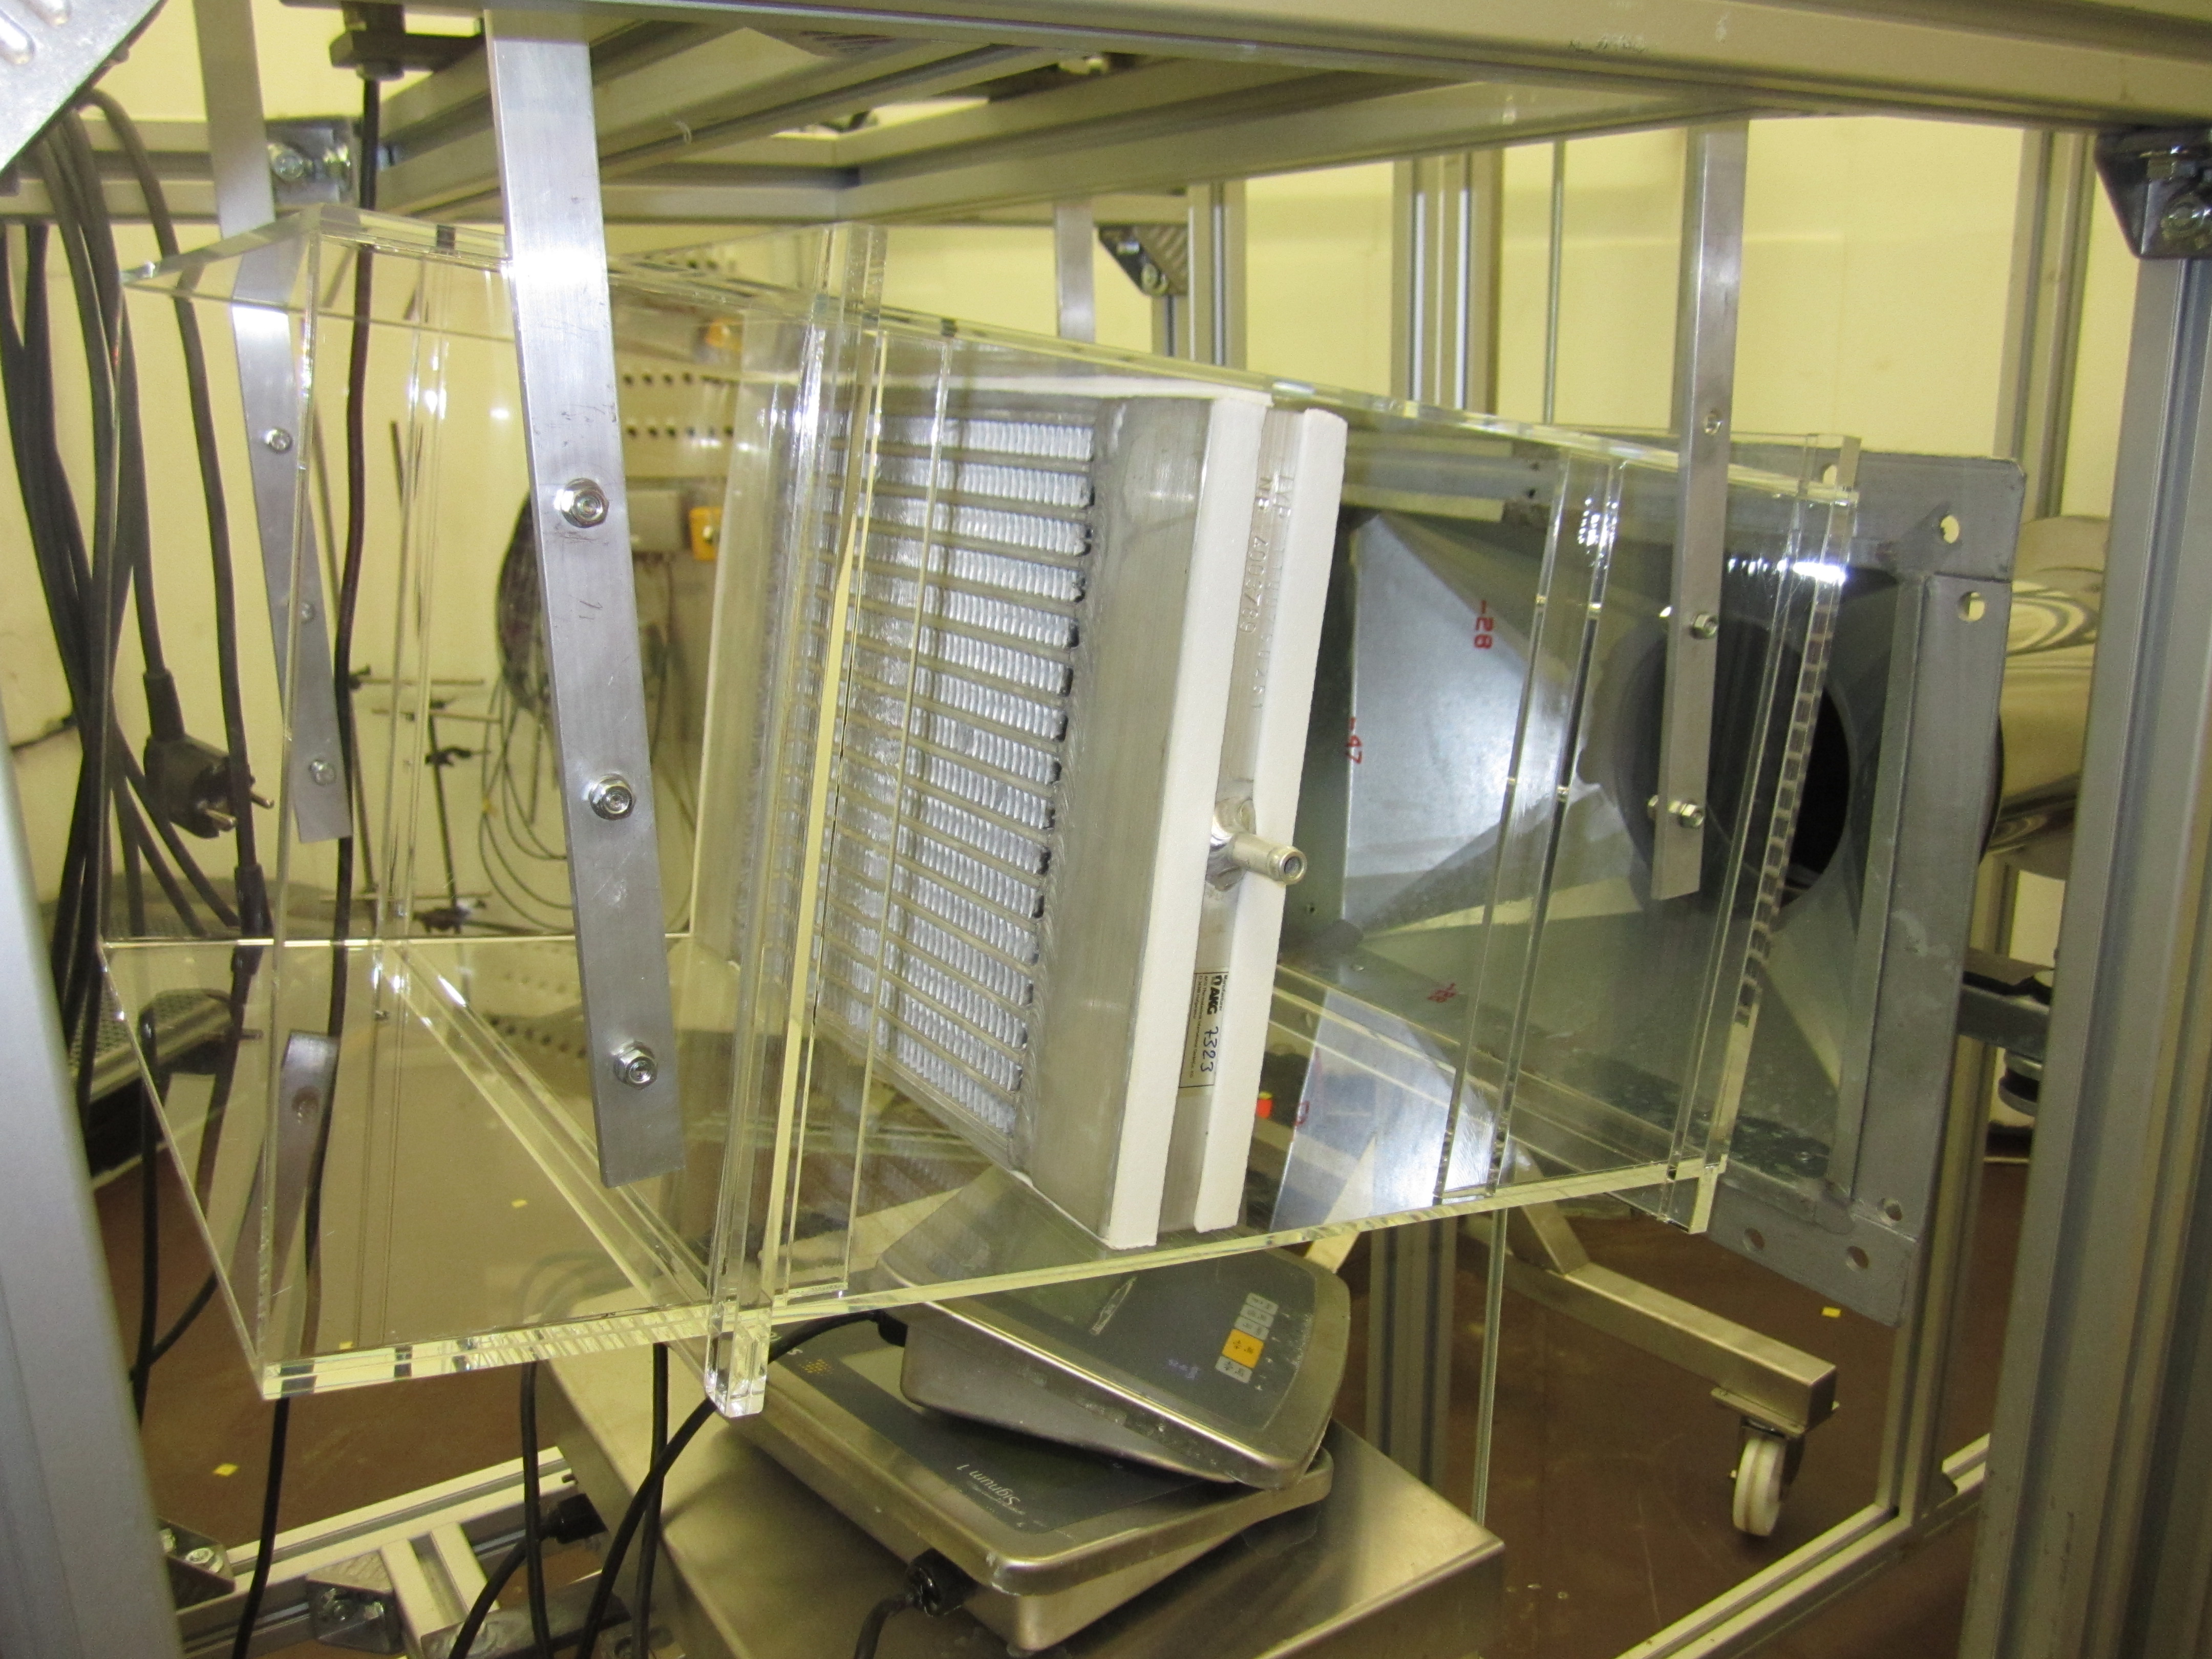
MPEfin Heat exchangers mounted in the flow channel
Copyright: AIT Austrian Institute of Technology, Center for Energy, Sustainable Thermal Energy Systems

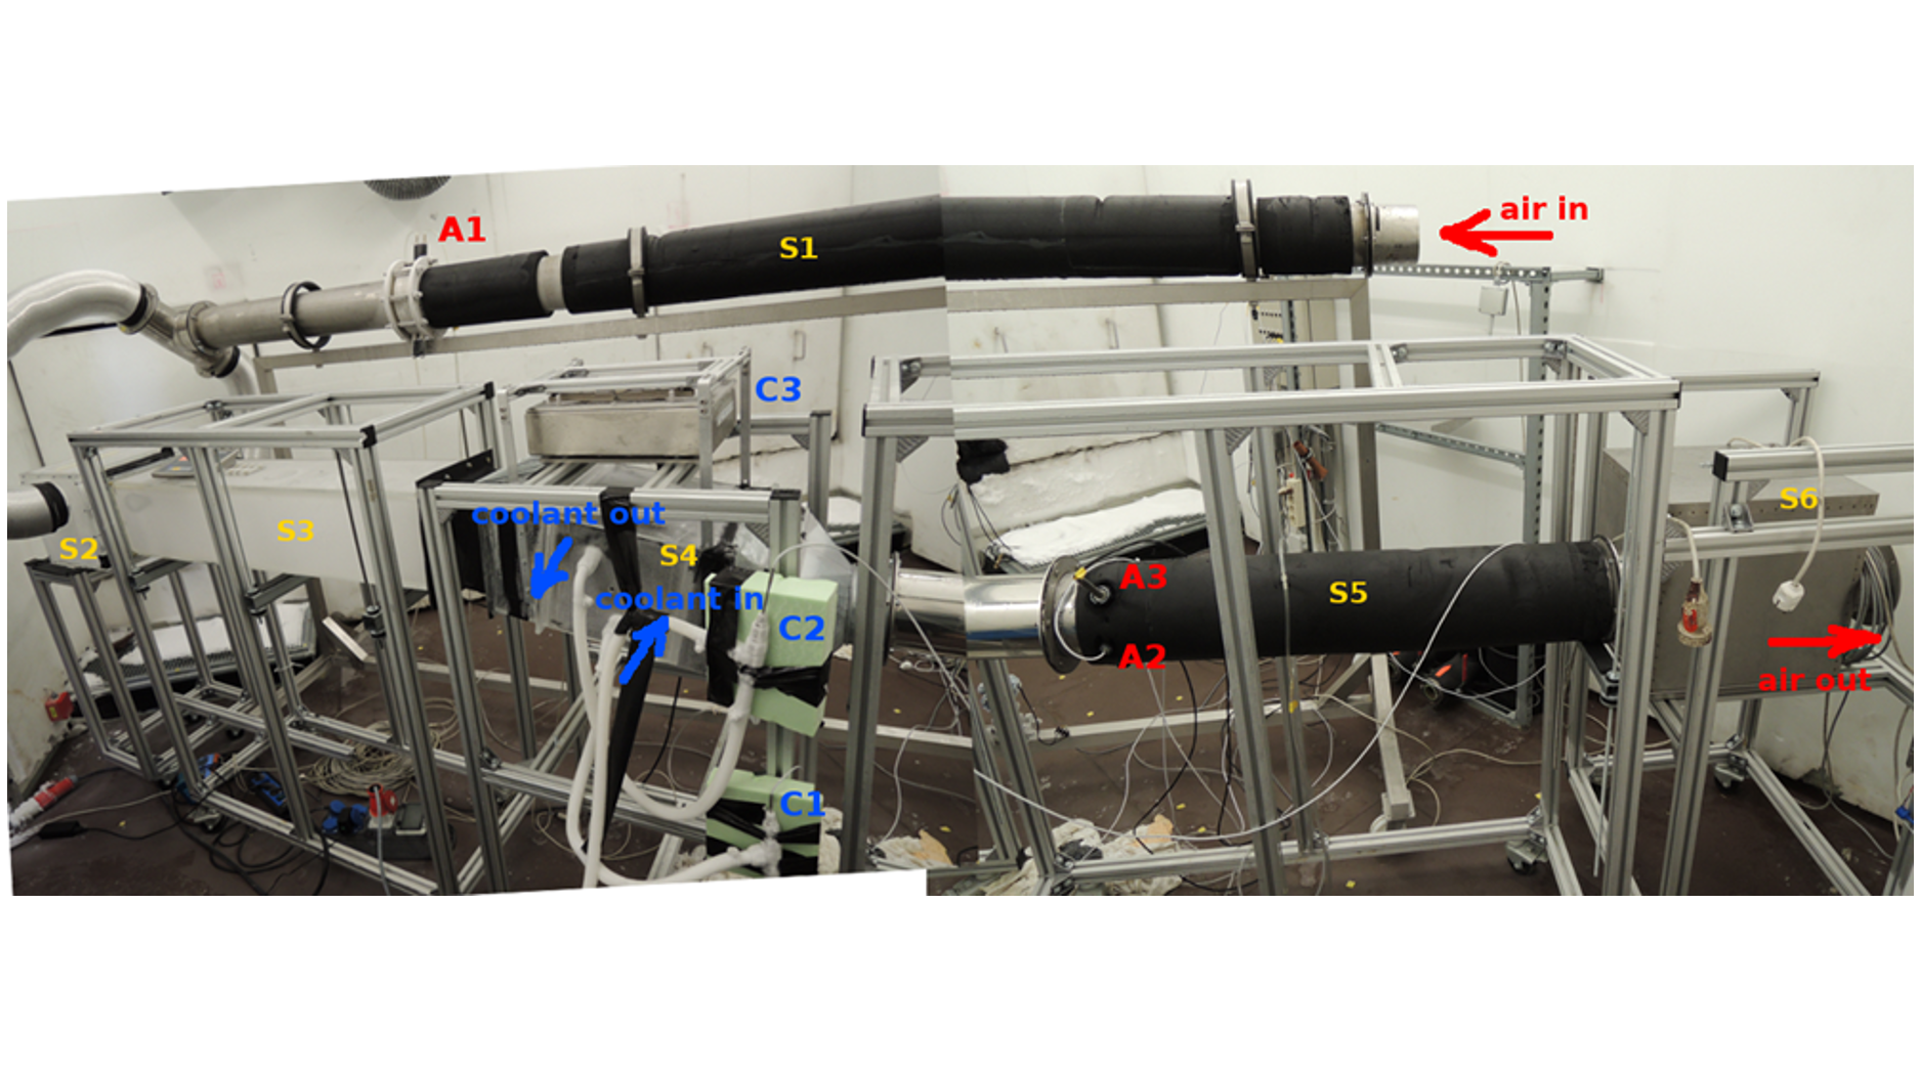
Experimental setup for investigating the frosting performance of heat exchangers at low ambient temperatures
Measurement sequence: in the initial phase the thermal mass of the heat exchanger is accommodated to the tempering conditions (A to B1), and then the main frost growth takes place (B1 to B2). Afterwards, the rapid change of the heat exchanger thermal state (at air flow rate curve steepest gradient) takes place (B2), and frost creation continues until the heat exchanger is fully blocked and the temperatures do not change any more (C).
Copyright: AIT Austrian Institute of Technology, Center for Energy, Sustainable Thermal Energy Systems
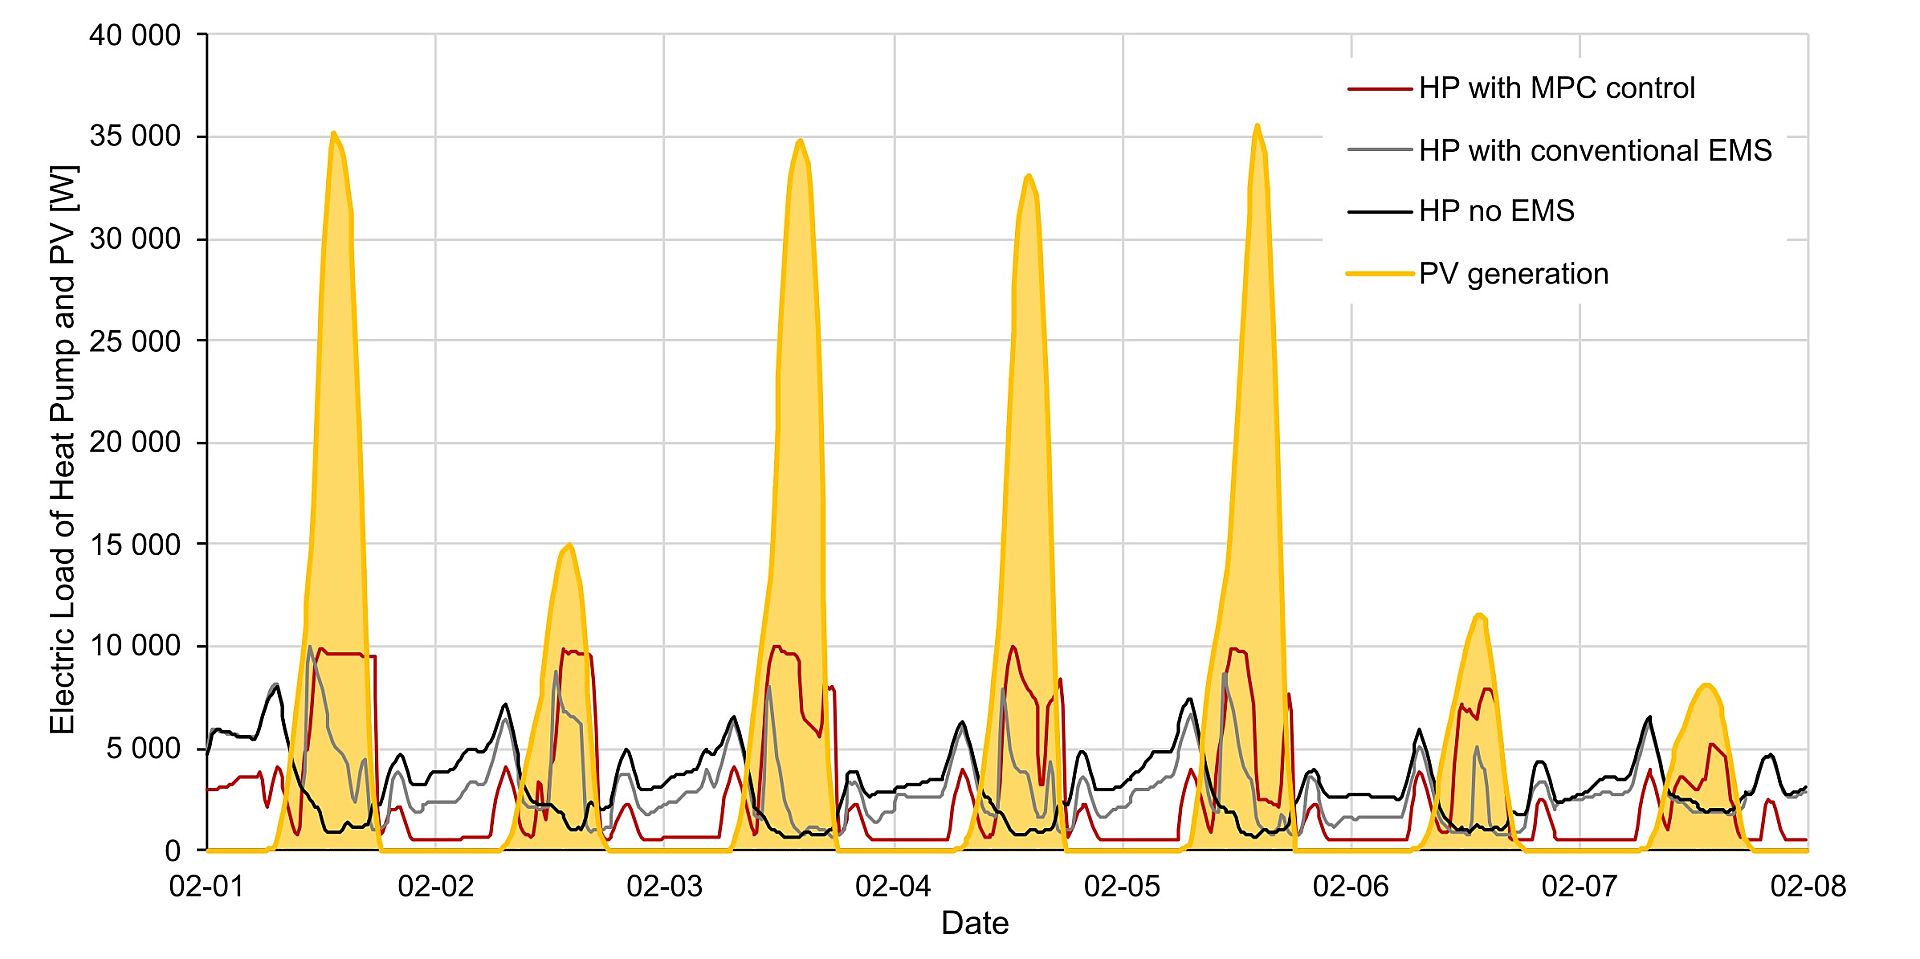
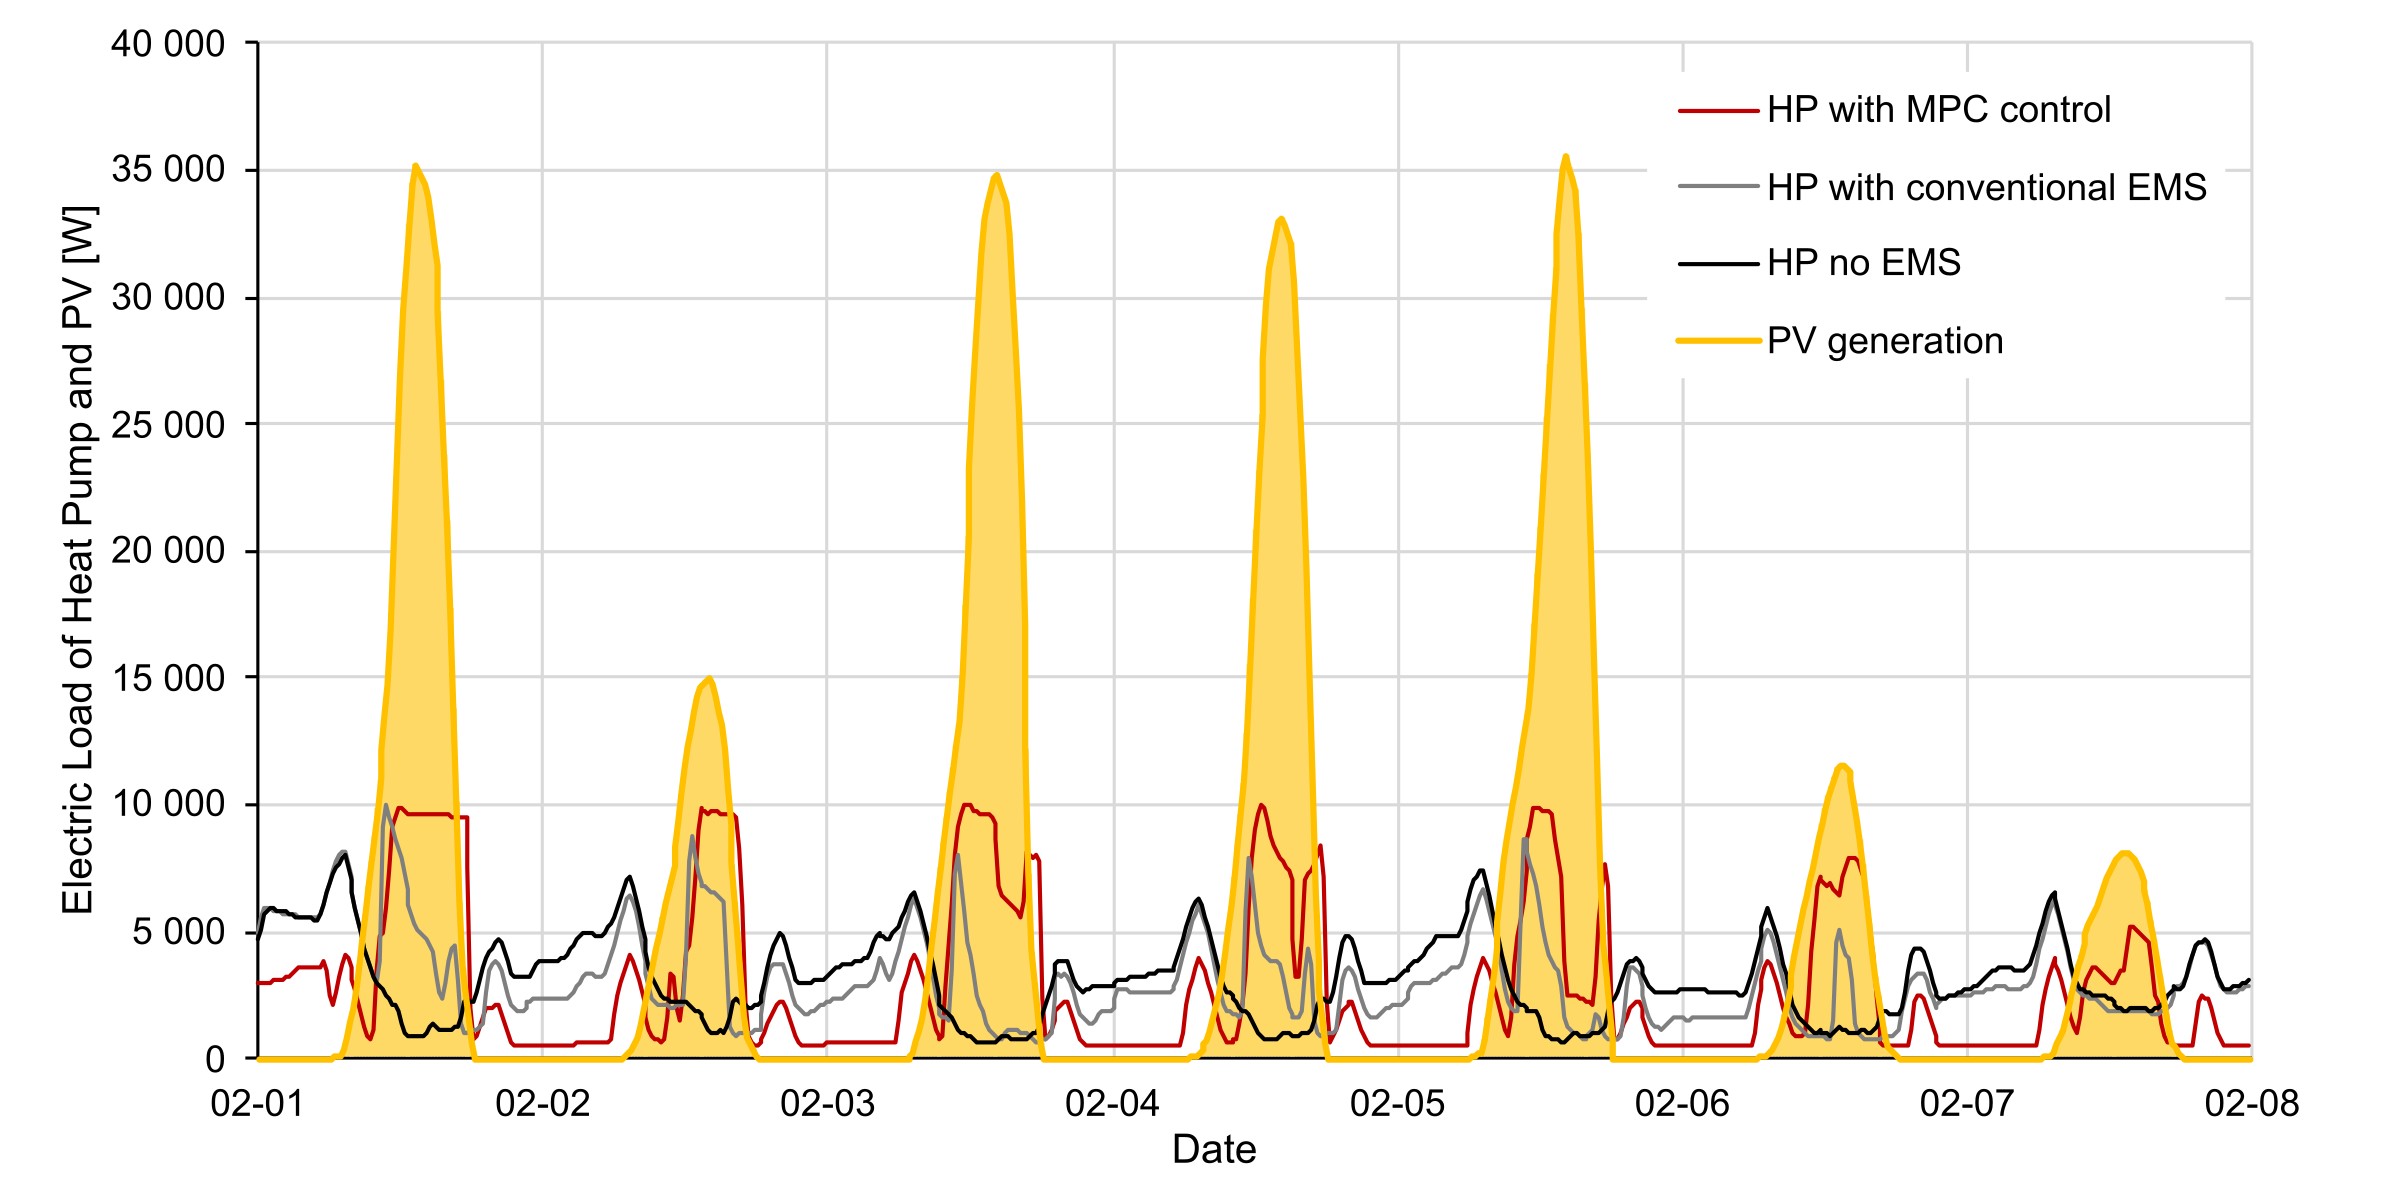
Simultaneity of PV electricity generation and heat pump electricity demand for different control strategies in the PEB use case EXCESS
Comparison of the electricity demand of heat pumps under different control strategies, simulated for the Austrian EXCESS demonstration building, in relation to the available PV generation on the façade for an average winter week in February. The building under investigation represents a use case in the IEA EBC Annex 83 project.
Copyright: AEE INTEC
Innsbruck Campagne
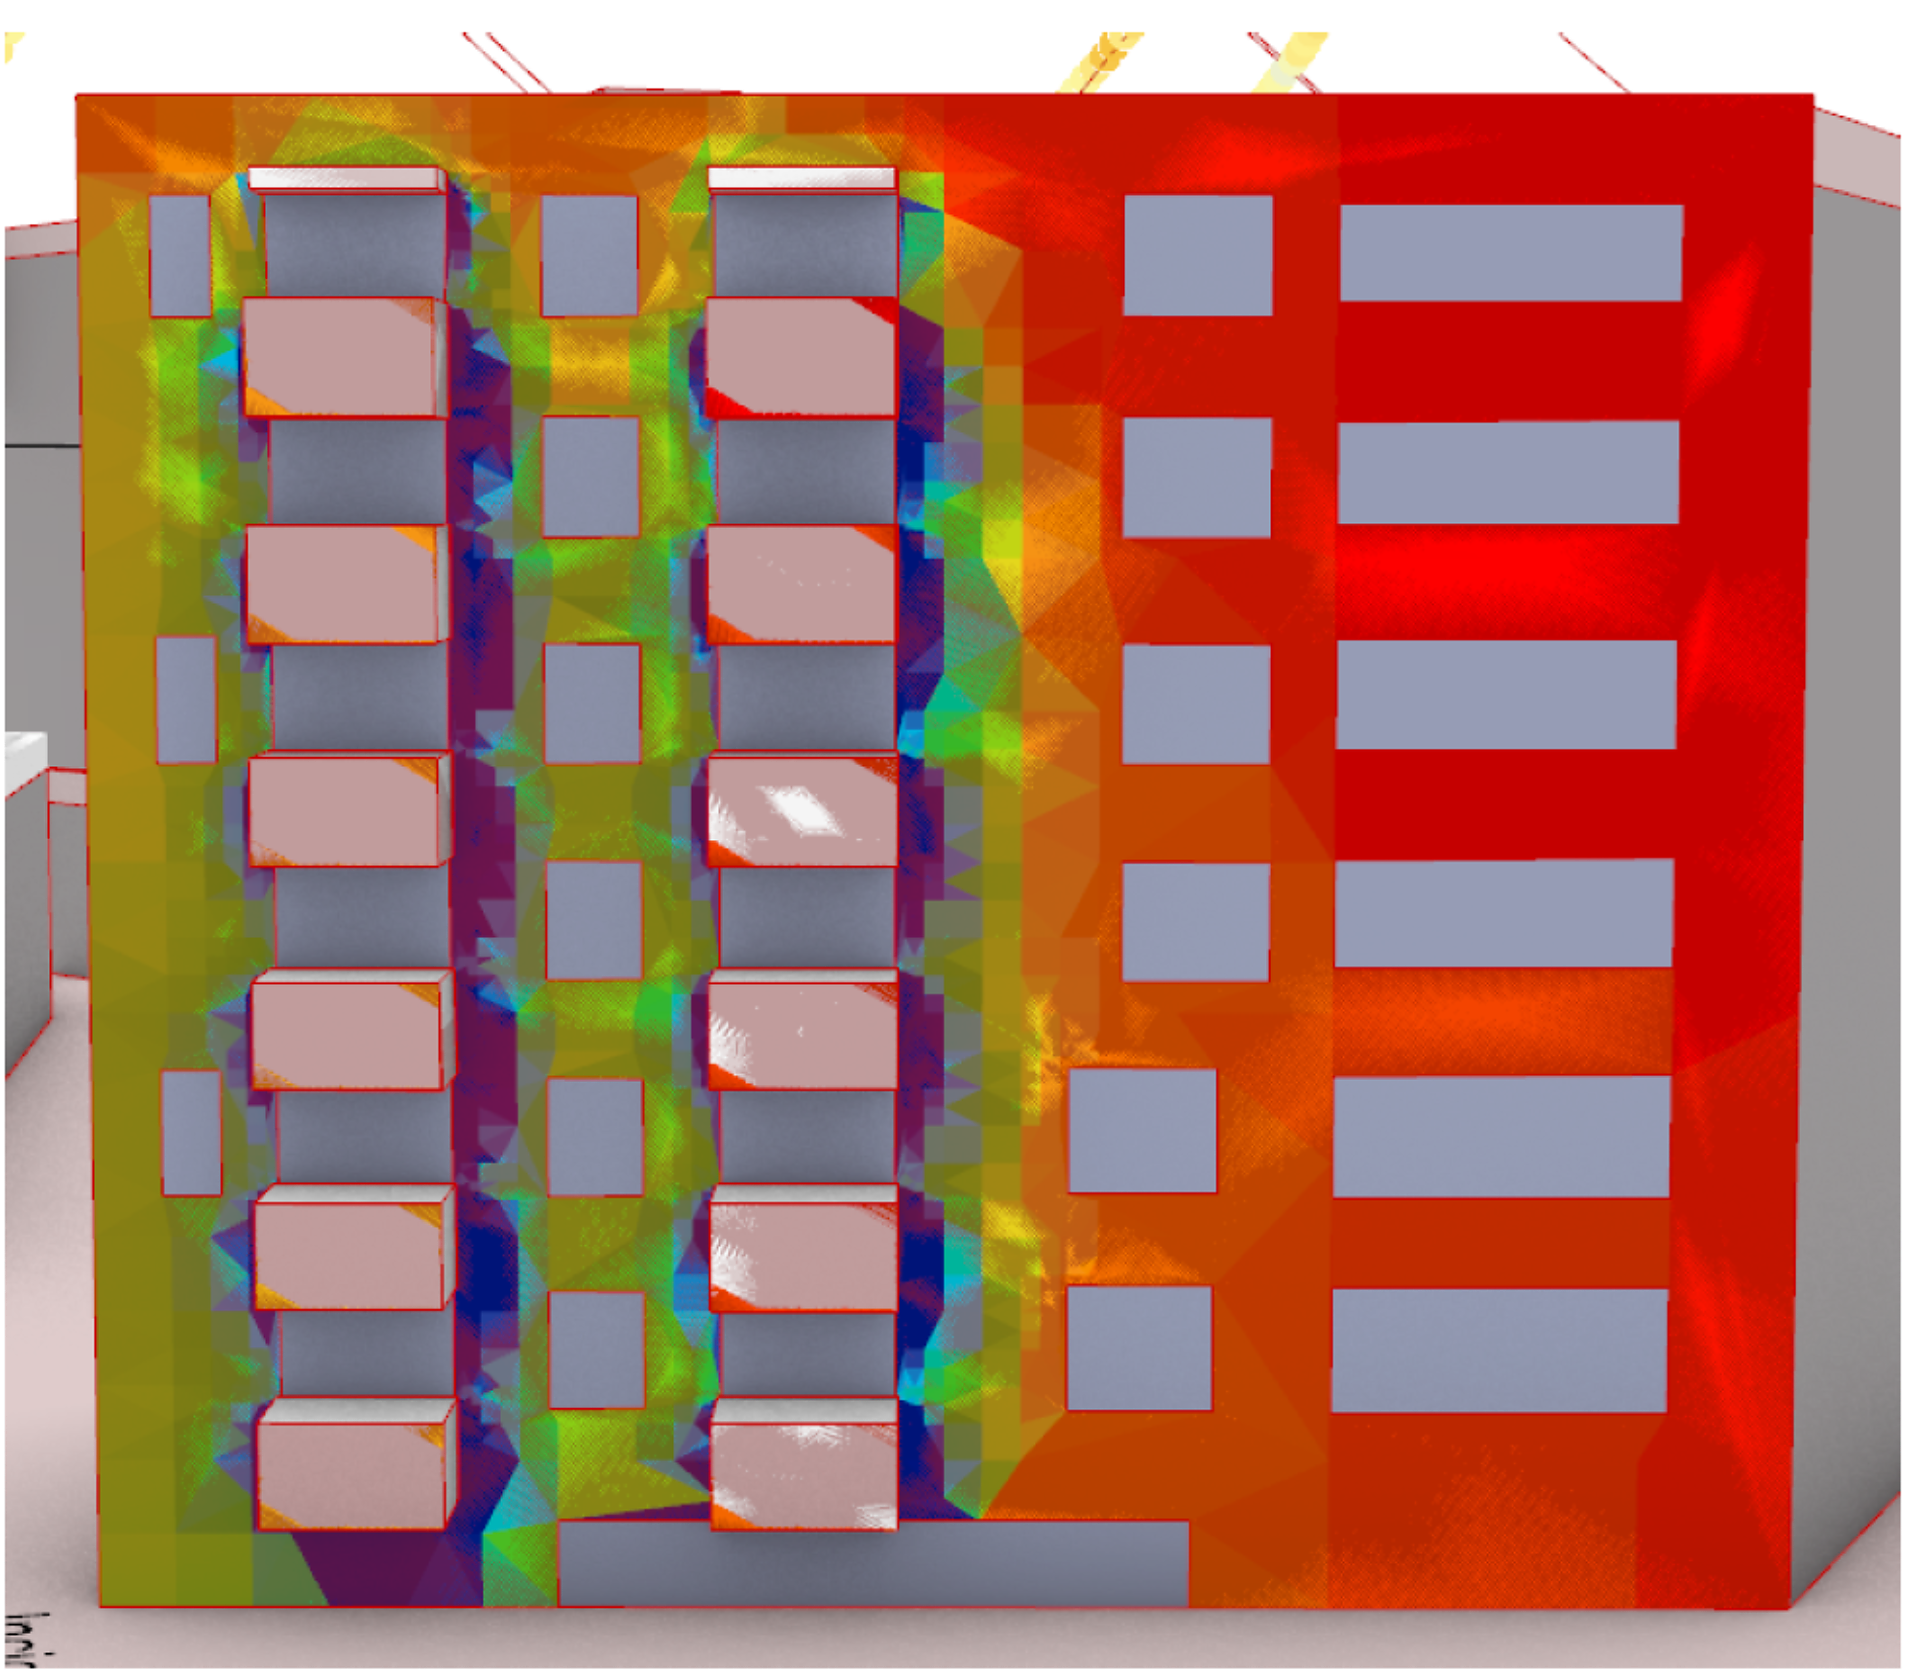
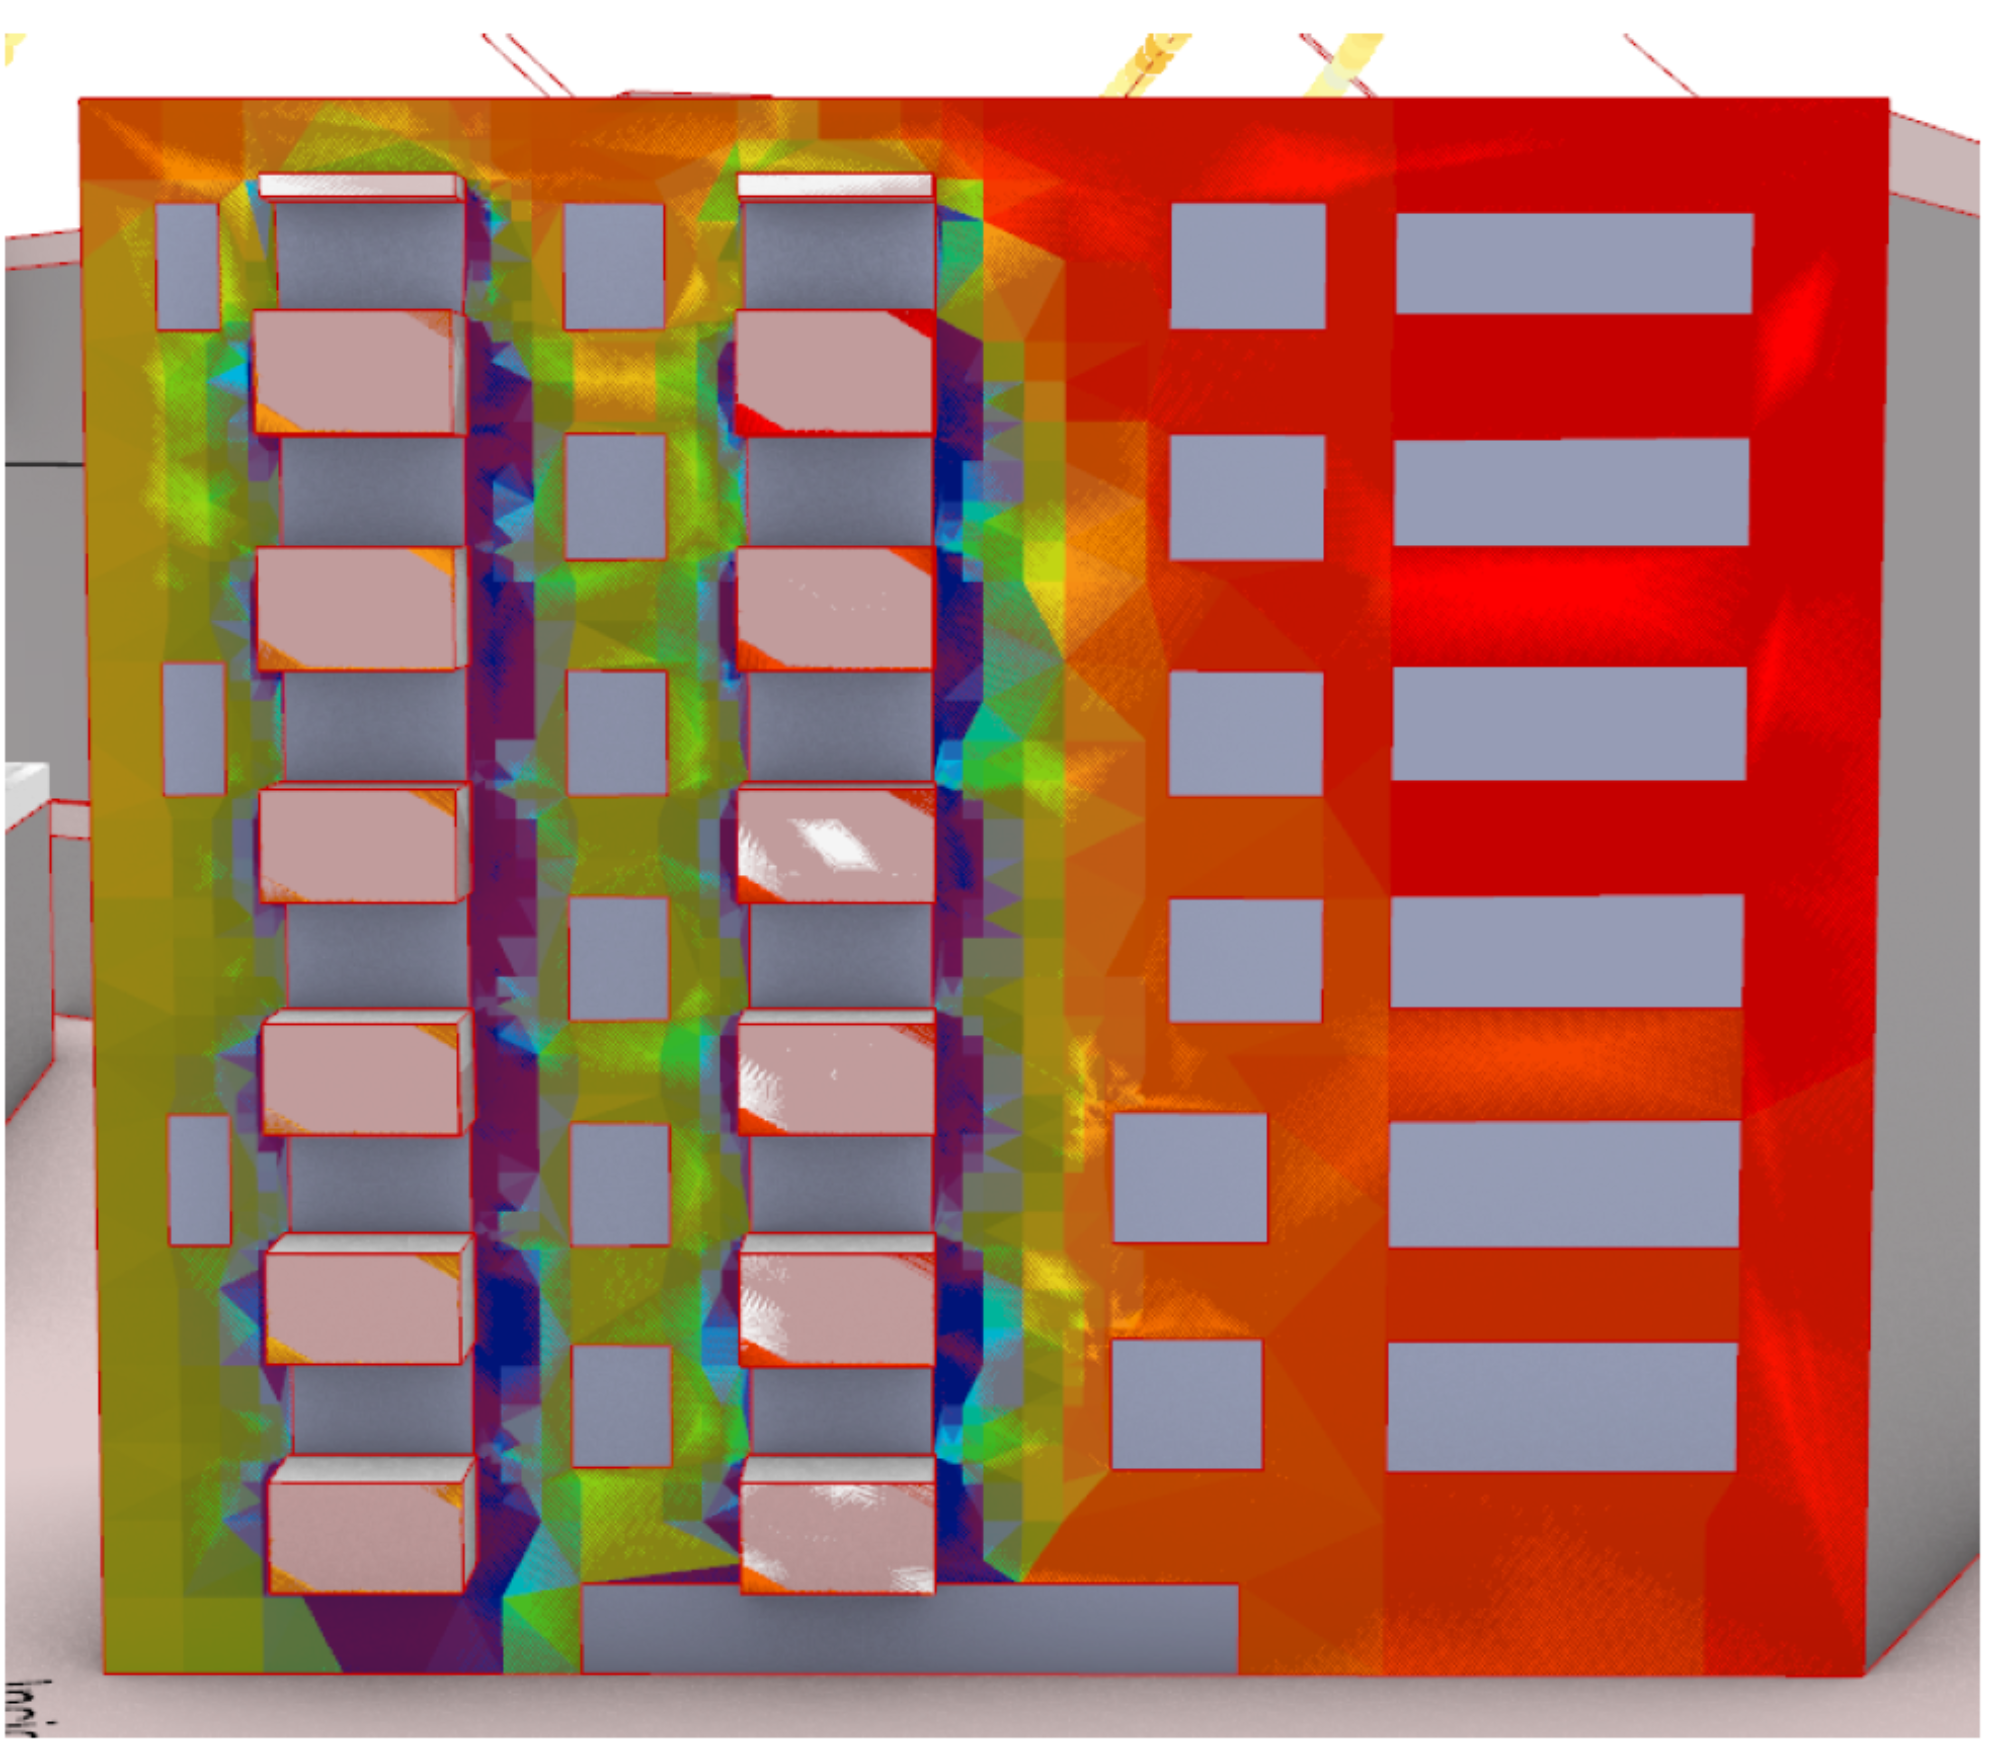
PV Potential of the Facade - Project Innsbruck Campagne
Copyright: UIBK Heiß/Ochs
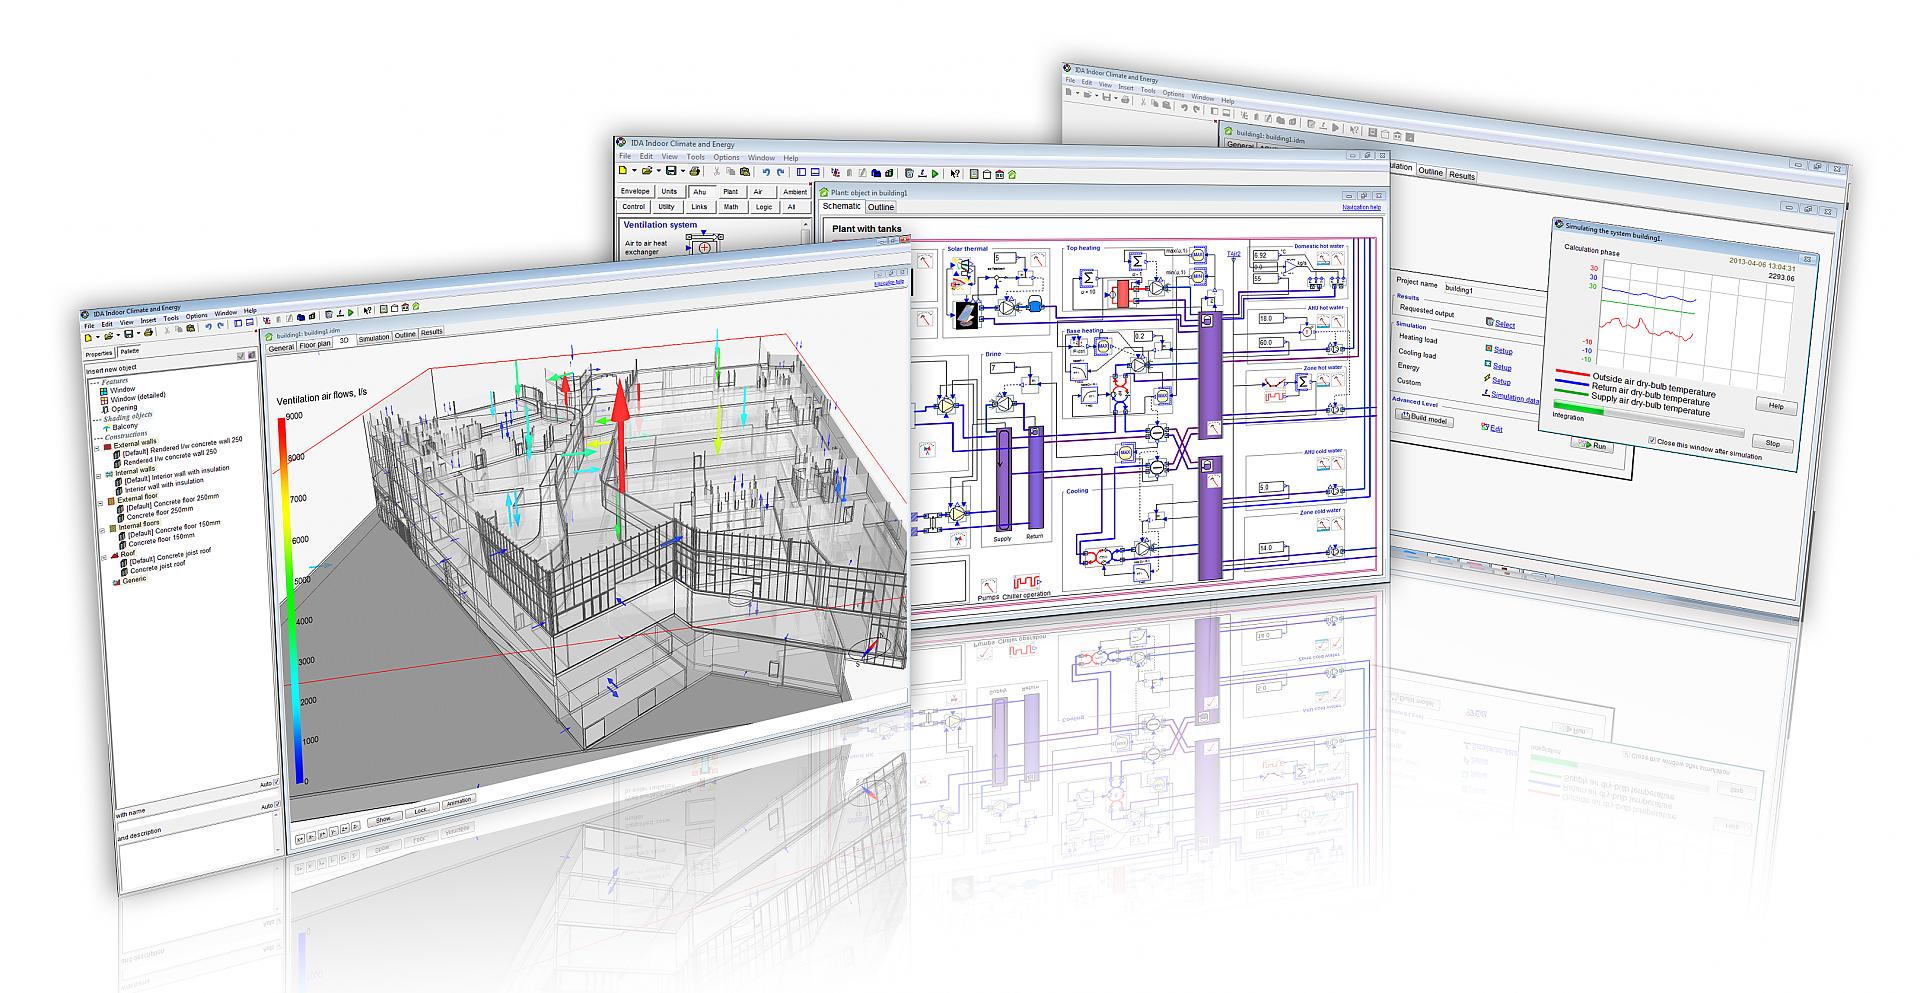
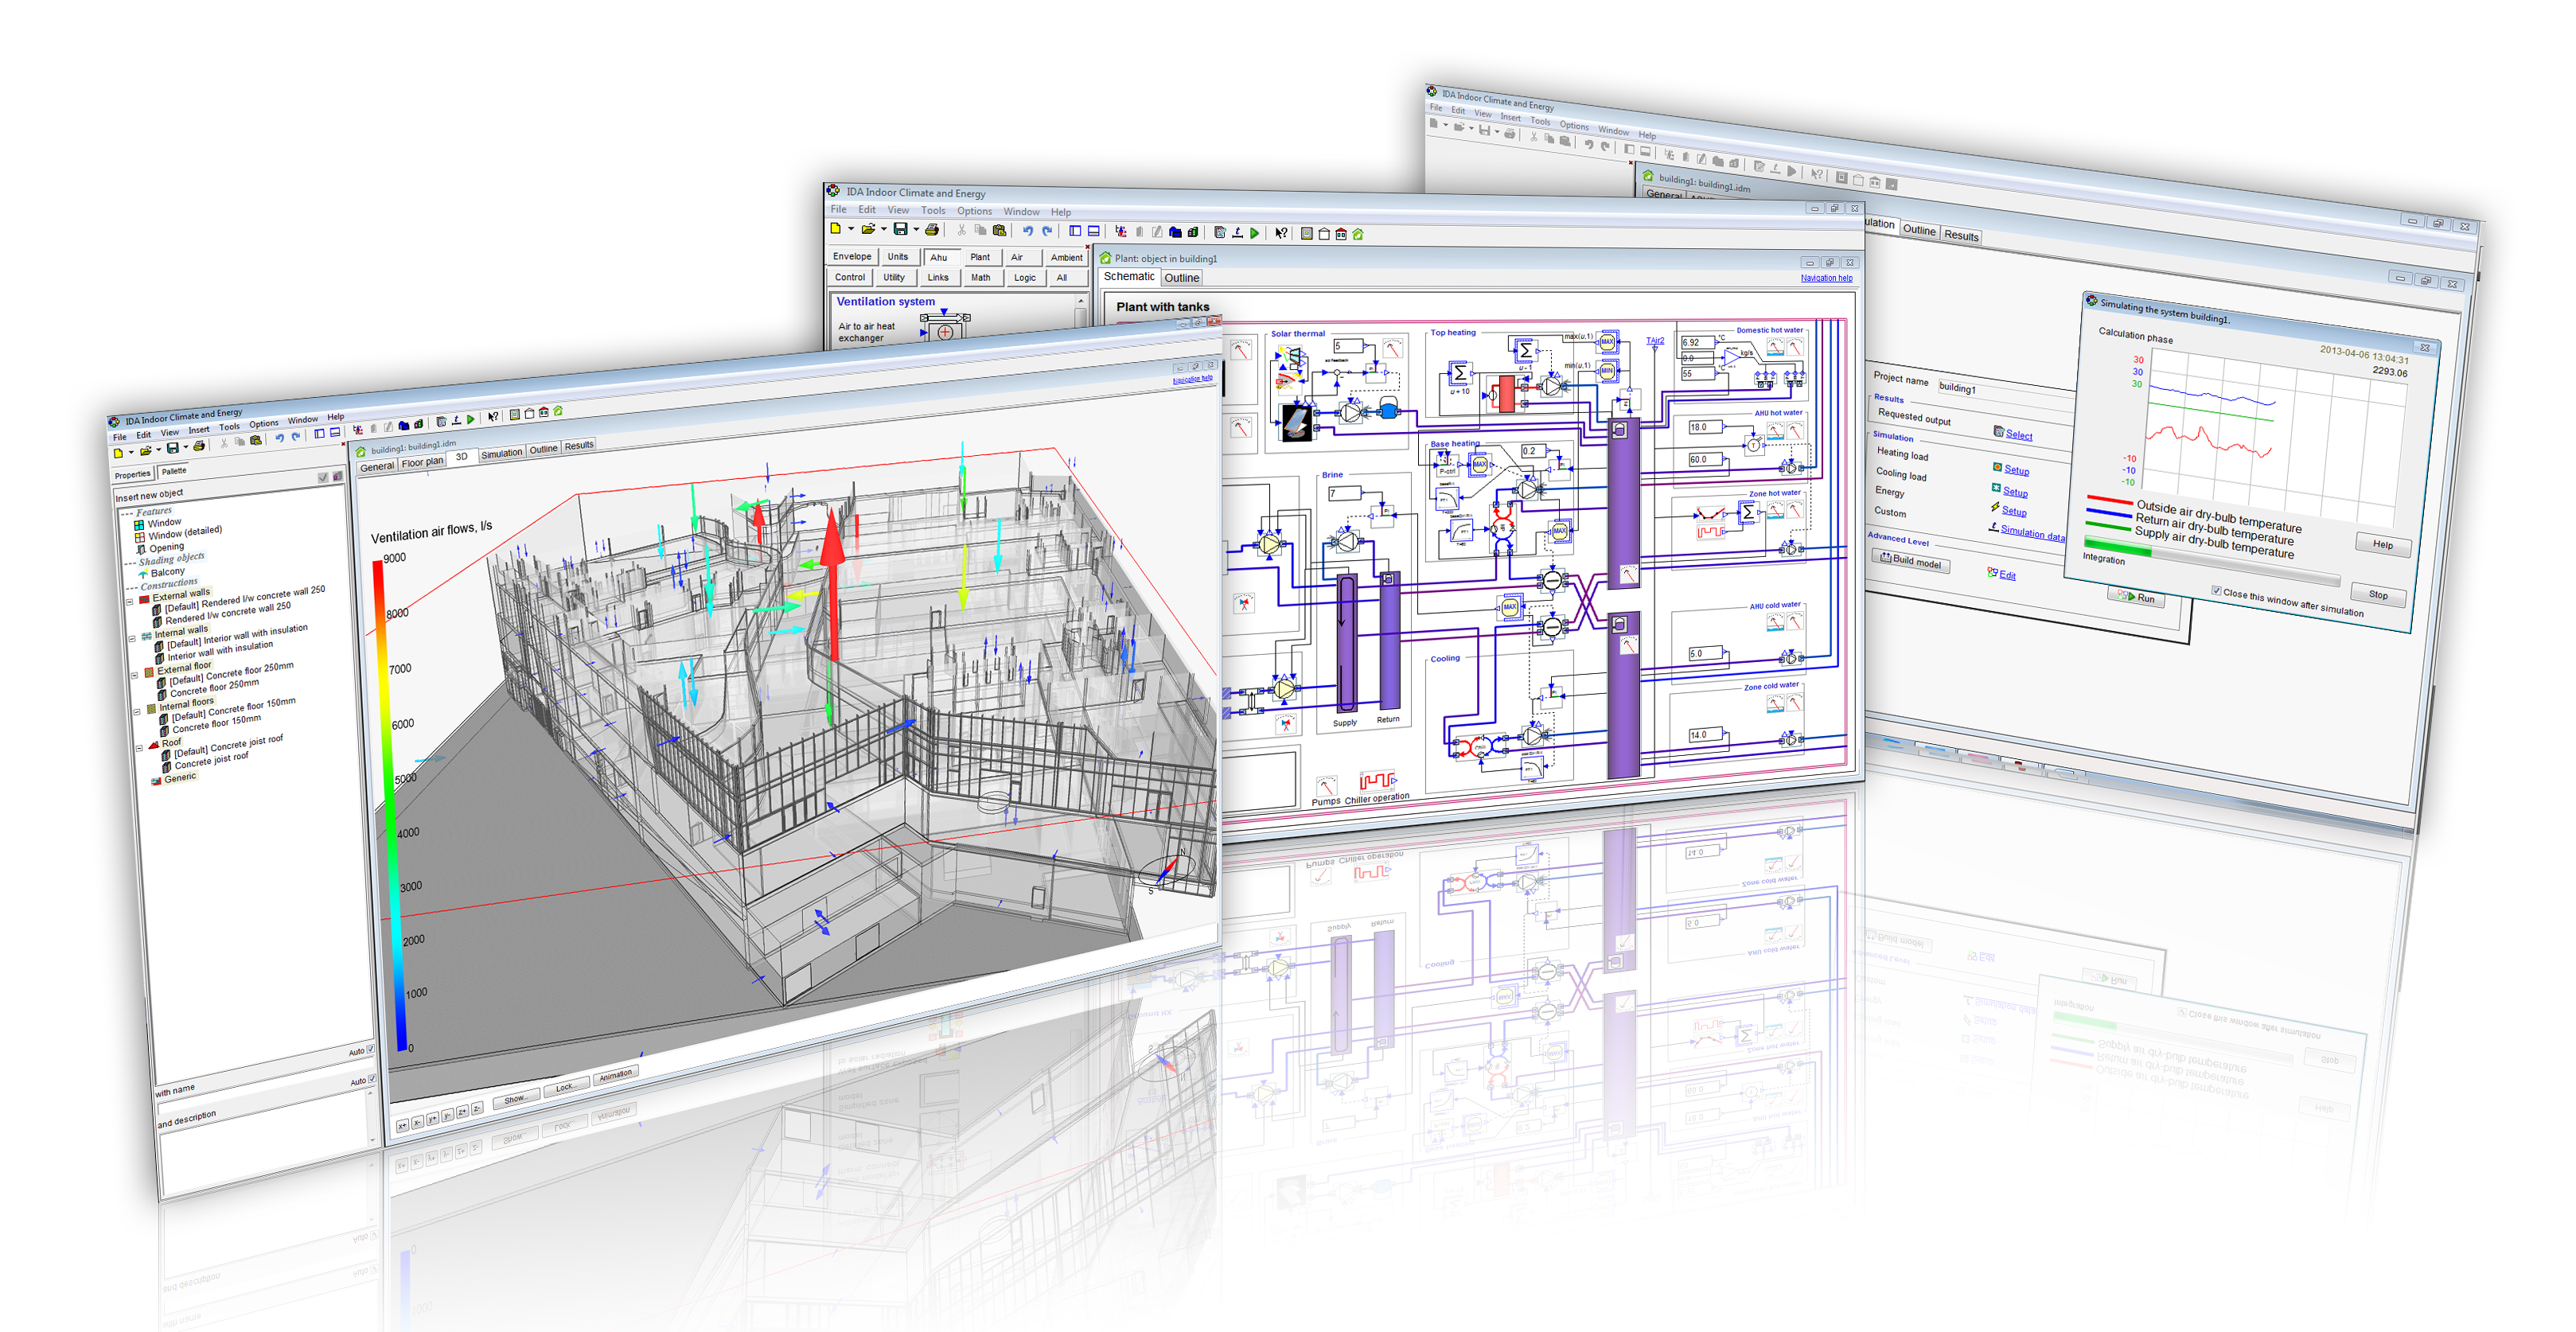
Combined building and plant simulation in real time
In a dynamic building simulation, the zones (rooms) are in contact with their surroundings and with the adjacent building components, the people, equipment and objects located in them. In the combined building and plant simulation, the dynamic interaction between building, plant and control is also taken into account. A building and plant simulation, adapted in real time to the actual weather conditions and current measurement data from the building, can help to optimize the control of the building services and thus reduce energy costs and increase user comfort.
Copyright: EQUA
Annex 81 Policy Package
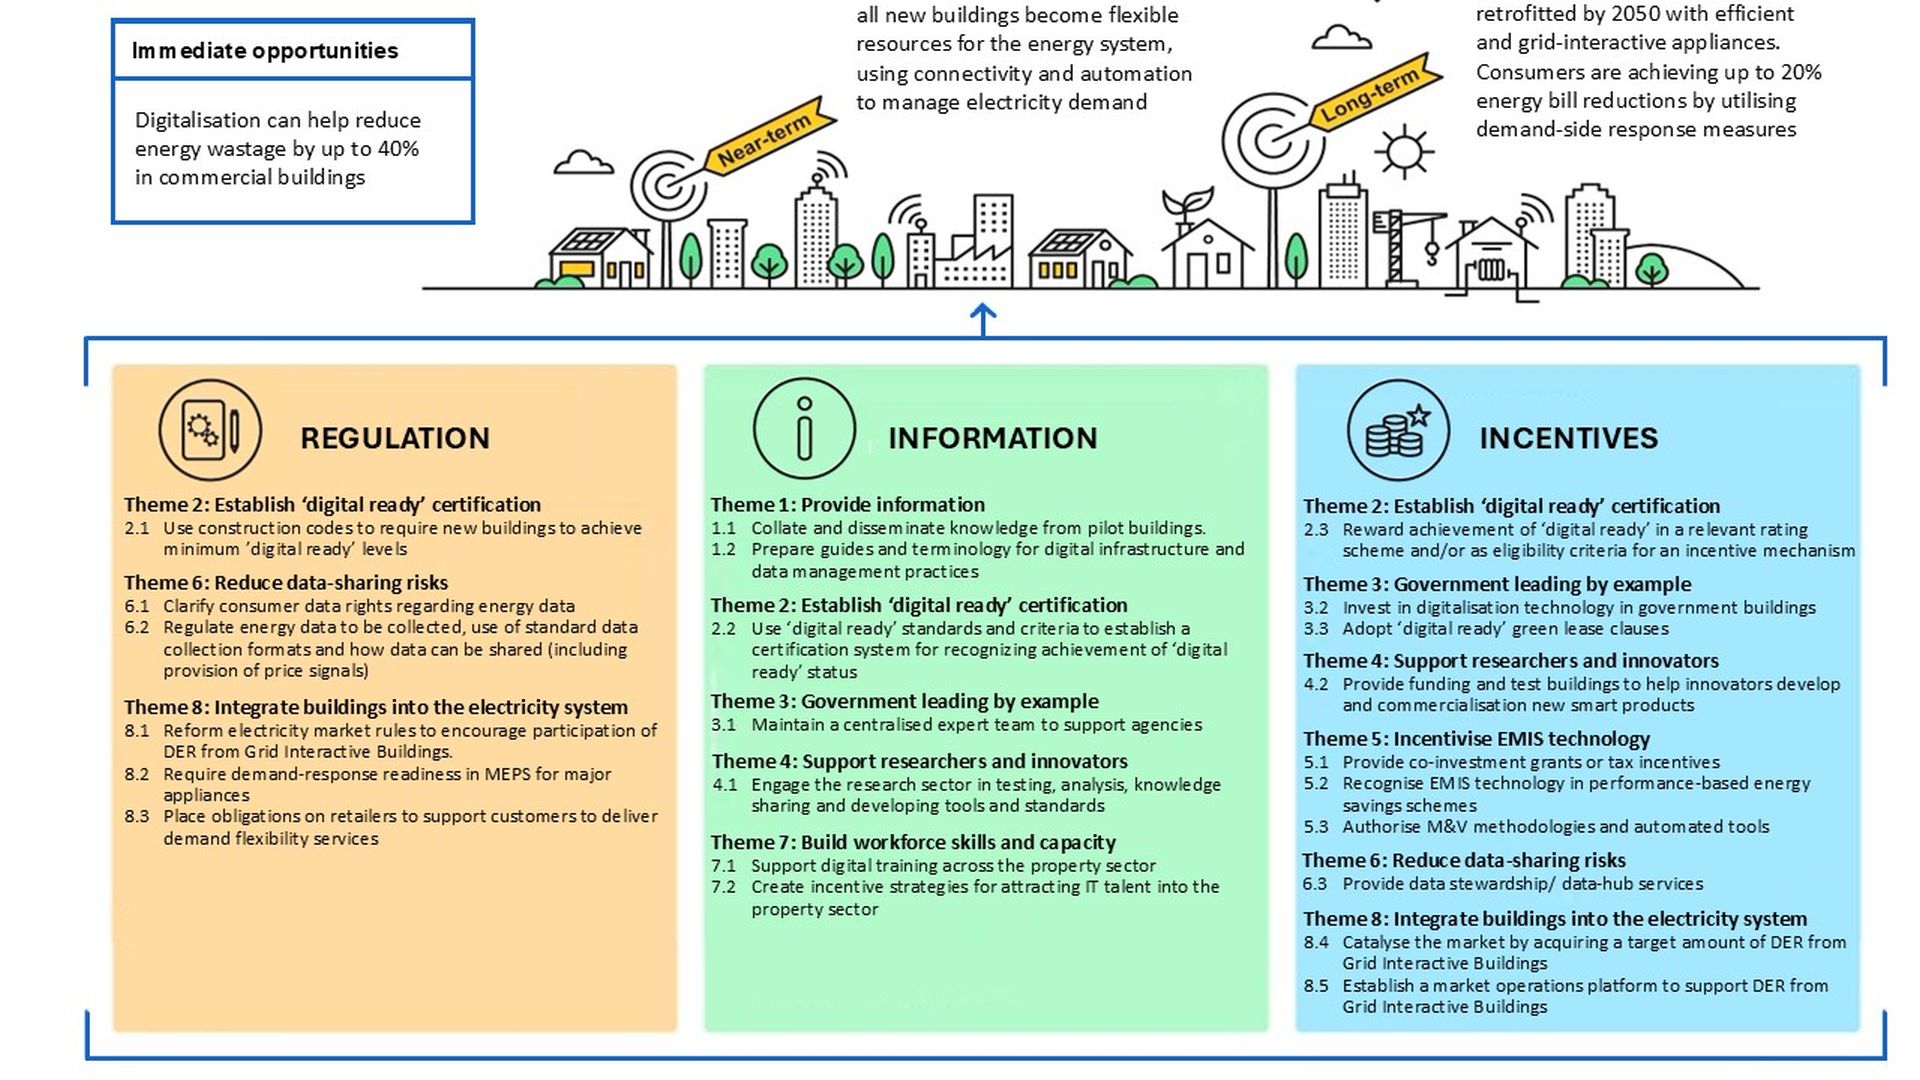
Graphic representation of the policy package of measures developed in Annex 81 to promote Data-Driven Smart Buildings.
Copyright: Stephen White - format adopted from from IEA, 2023 “Energy Efficiency Policy Toolkit 2023”,
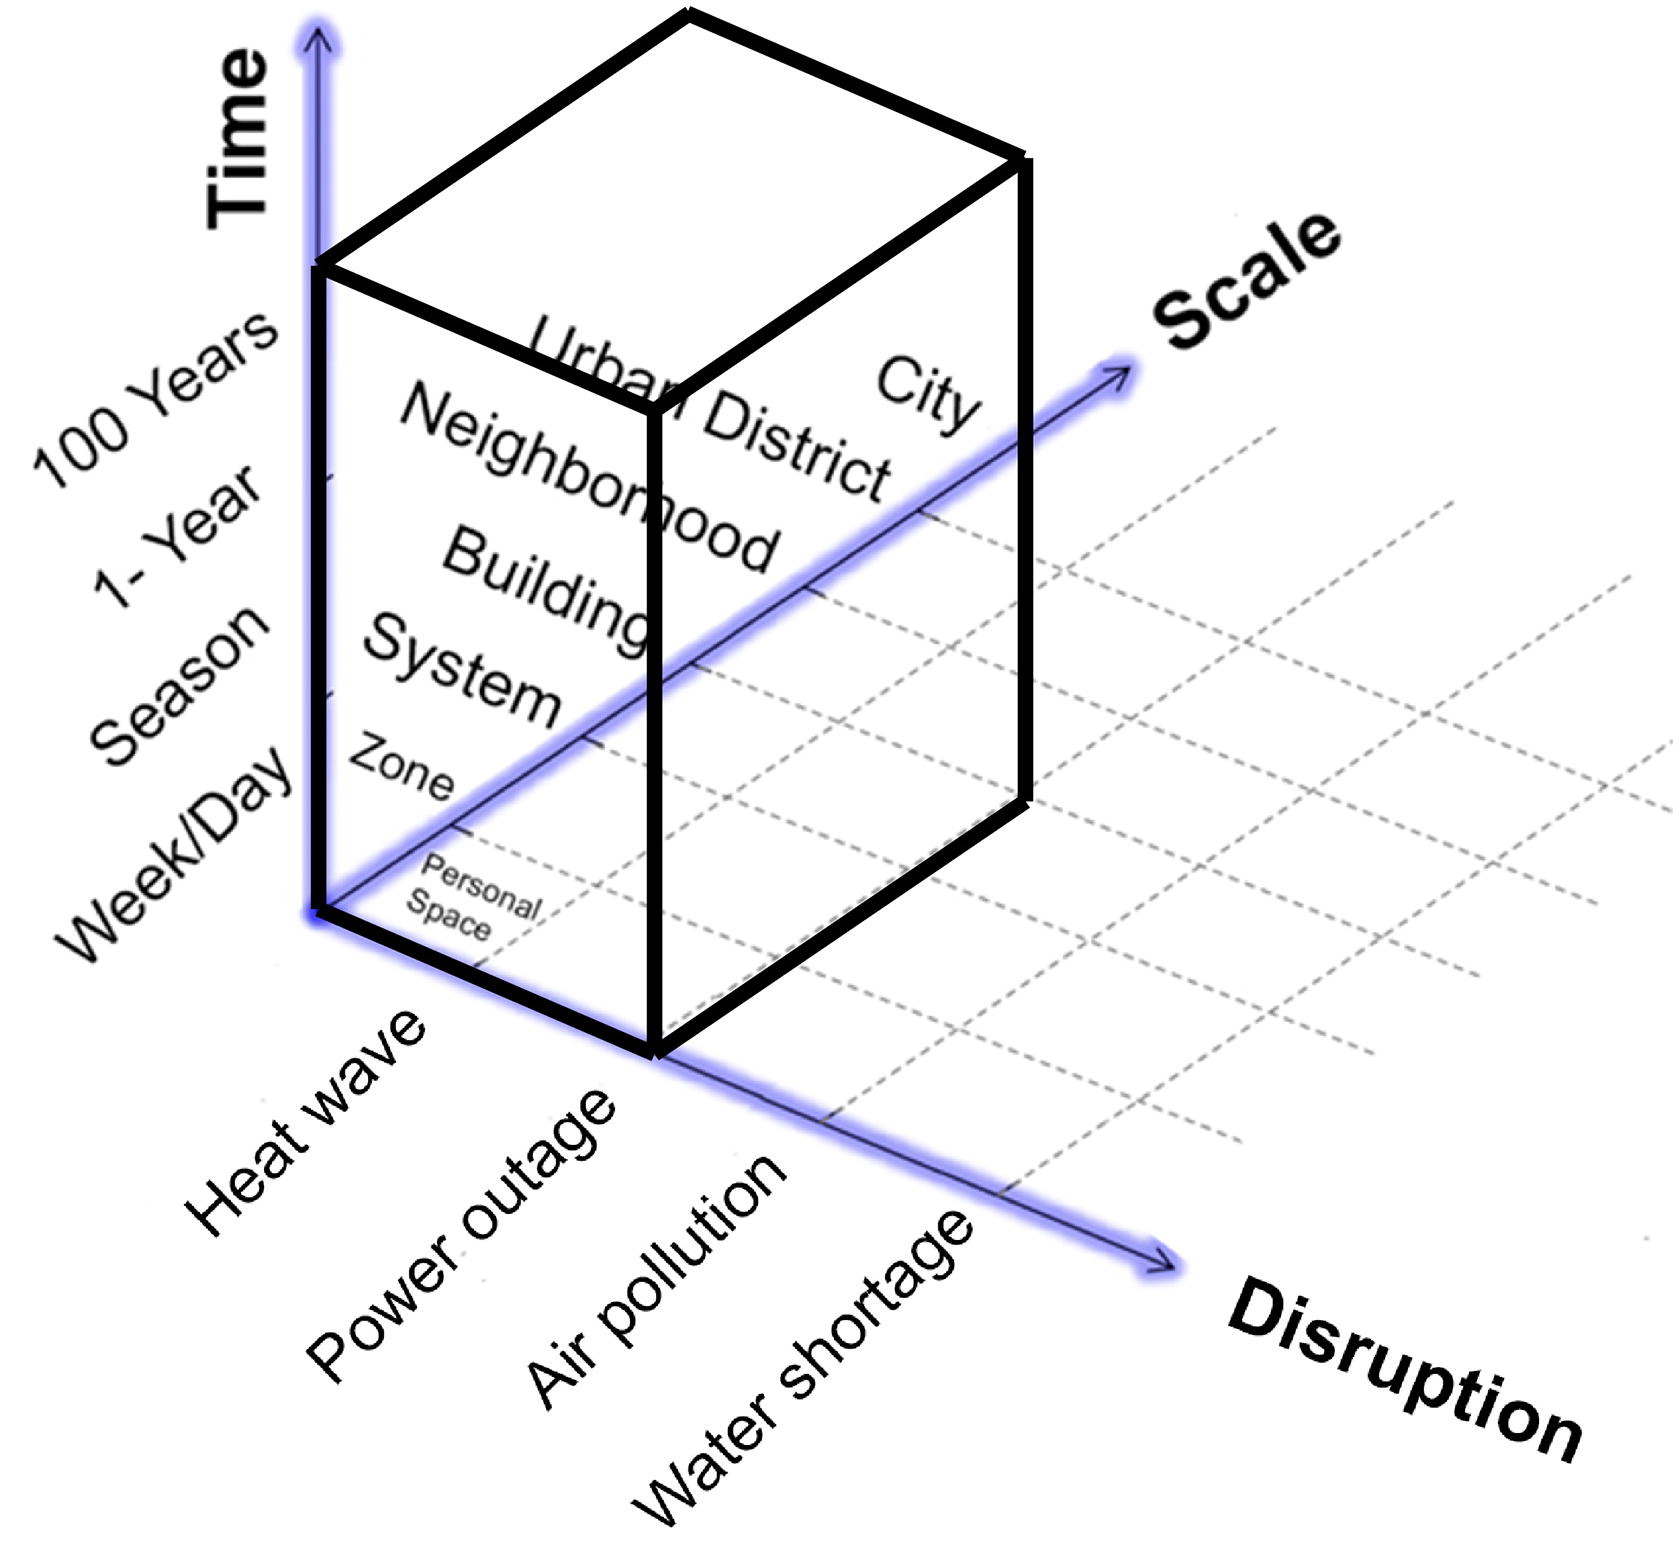
Scope of Resilience Definition
This figure illustrates the chosen framework for assessing the resilience of buildings. The definition focuses on building scale, with consideration of heat waves and power outages for a period of the next 100 years.
Copyright: Shady Attia, Ronnen Levinson, Eileen Ndongo, Peter Holzer, Ongun Berk Kazanci, Shabnam Homaei, Chen Zhang, Bjarne W. Olesen, Dahai Qi, Mohamed Hamdy, Per Heiselberg; Resilient cooling of buildings to protect against heat waves and power outages: Key concepts and definition; Energy and Buildings, Volume 239; 2021; 110869, ISSN 0378-7788, https://doi.org/10.1016/j.enbuild.2021.110869.
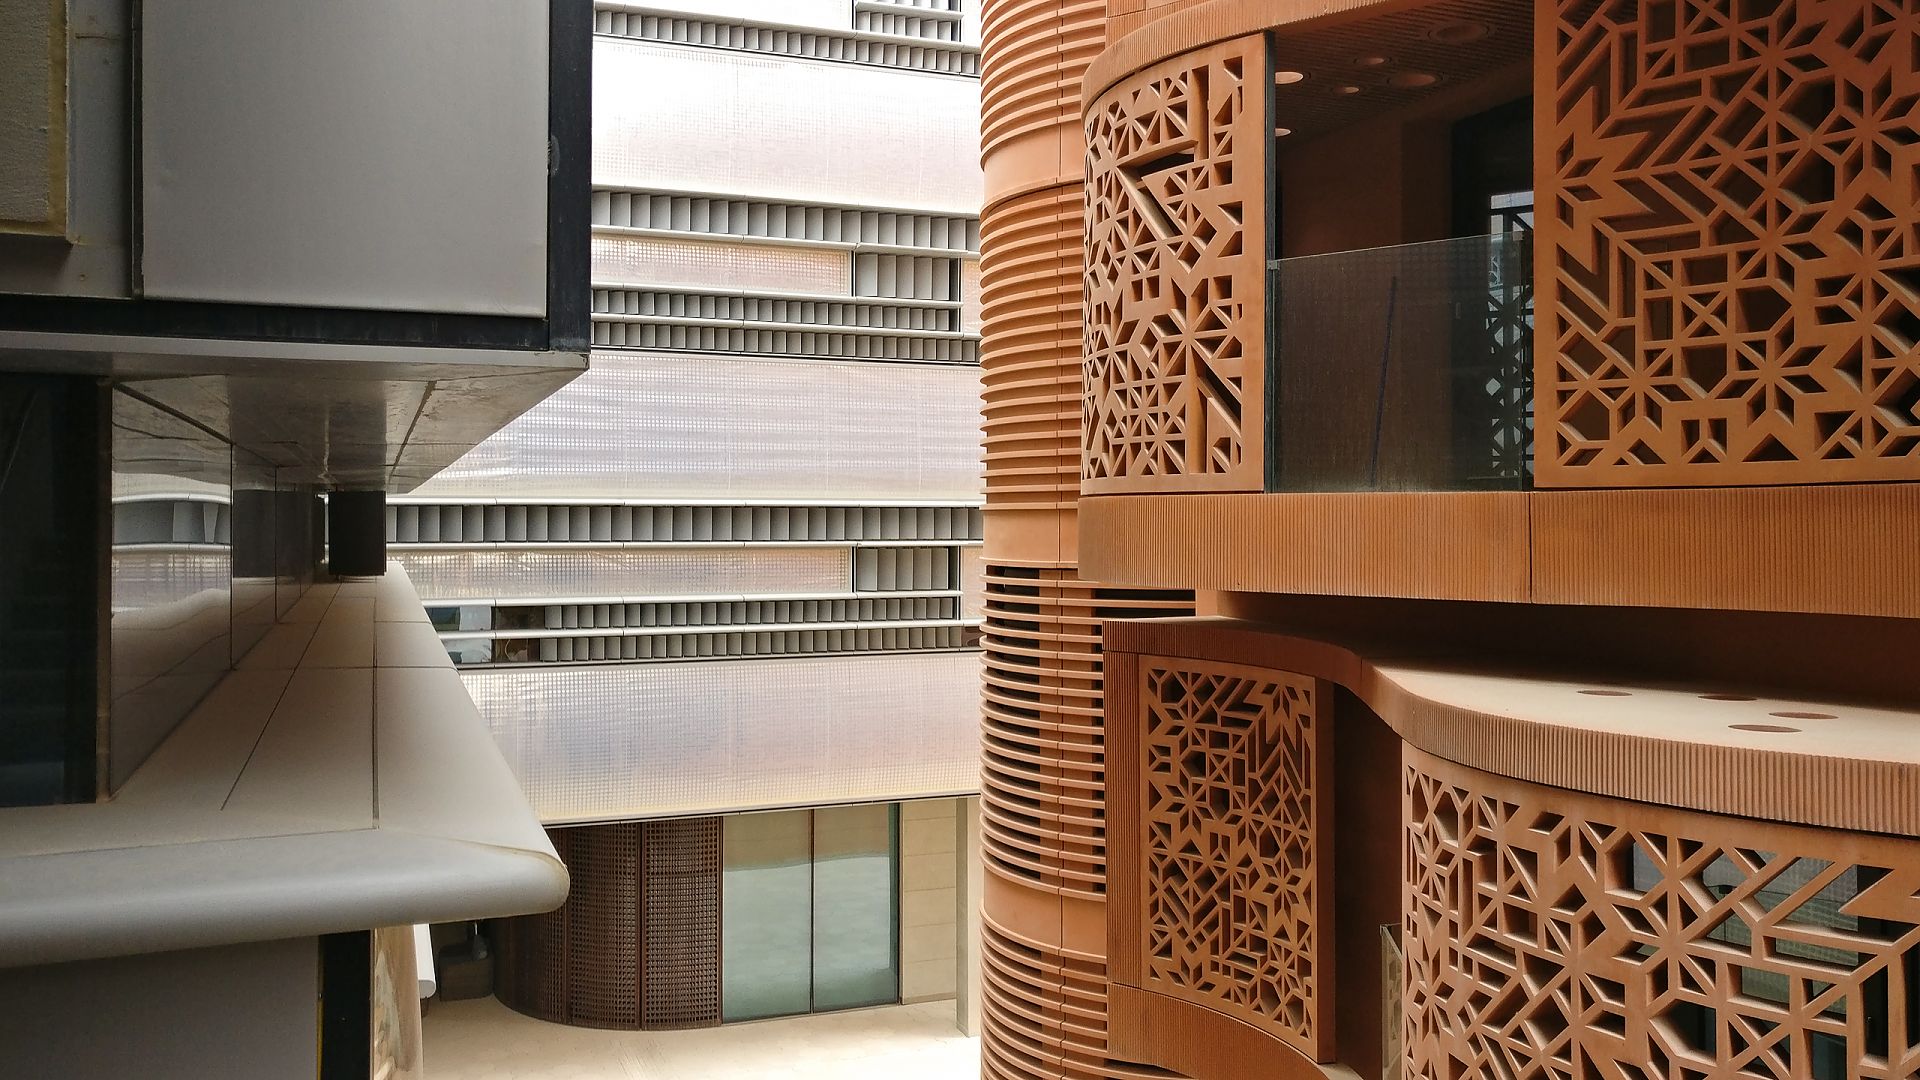
Example of Façade-integrated Shading - Masdar City, United Arab Emirates
This illustration shows solar shading. The image was taken in the experimental " ecological city" of Masdar City, United Arab Emirates.
Copyright: Institute of Building Research & Innovation ZT GmbH
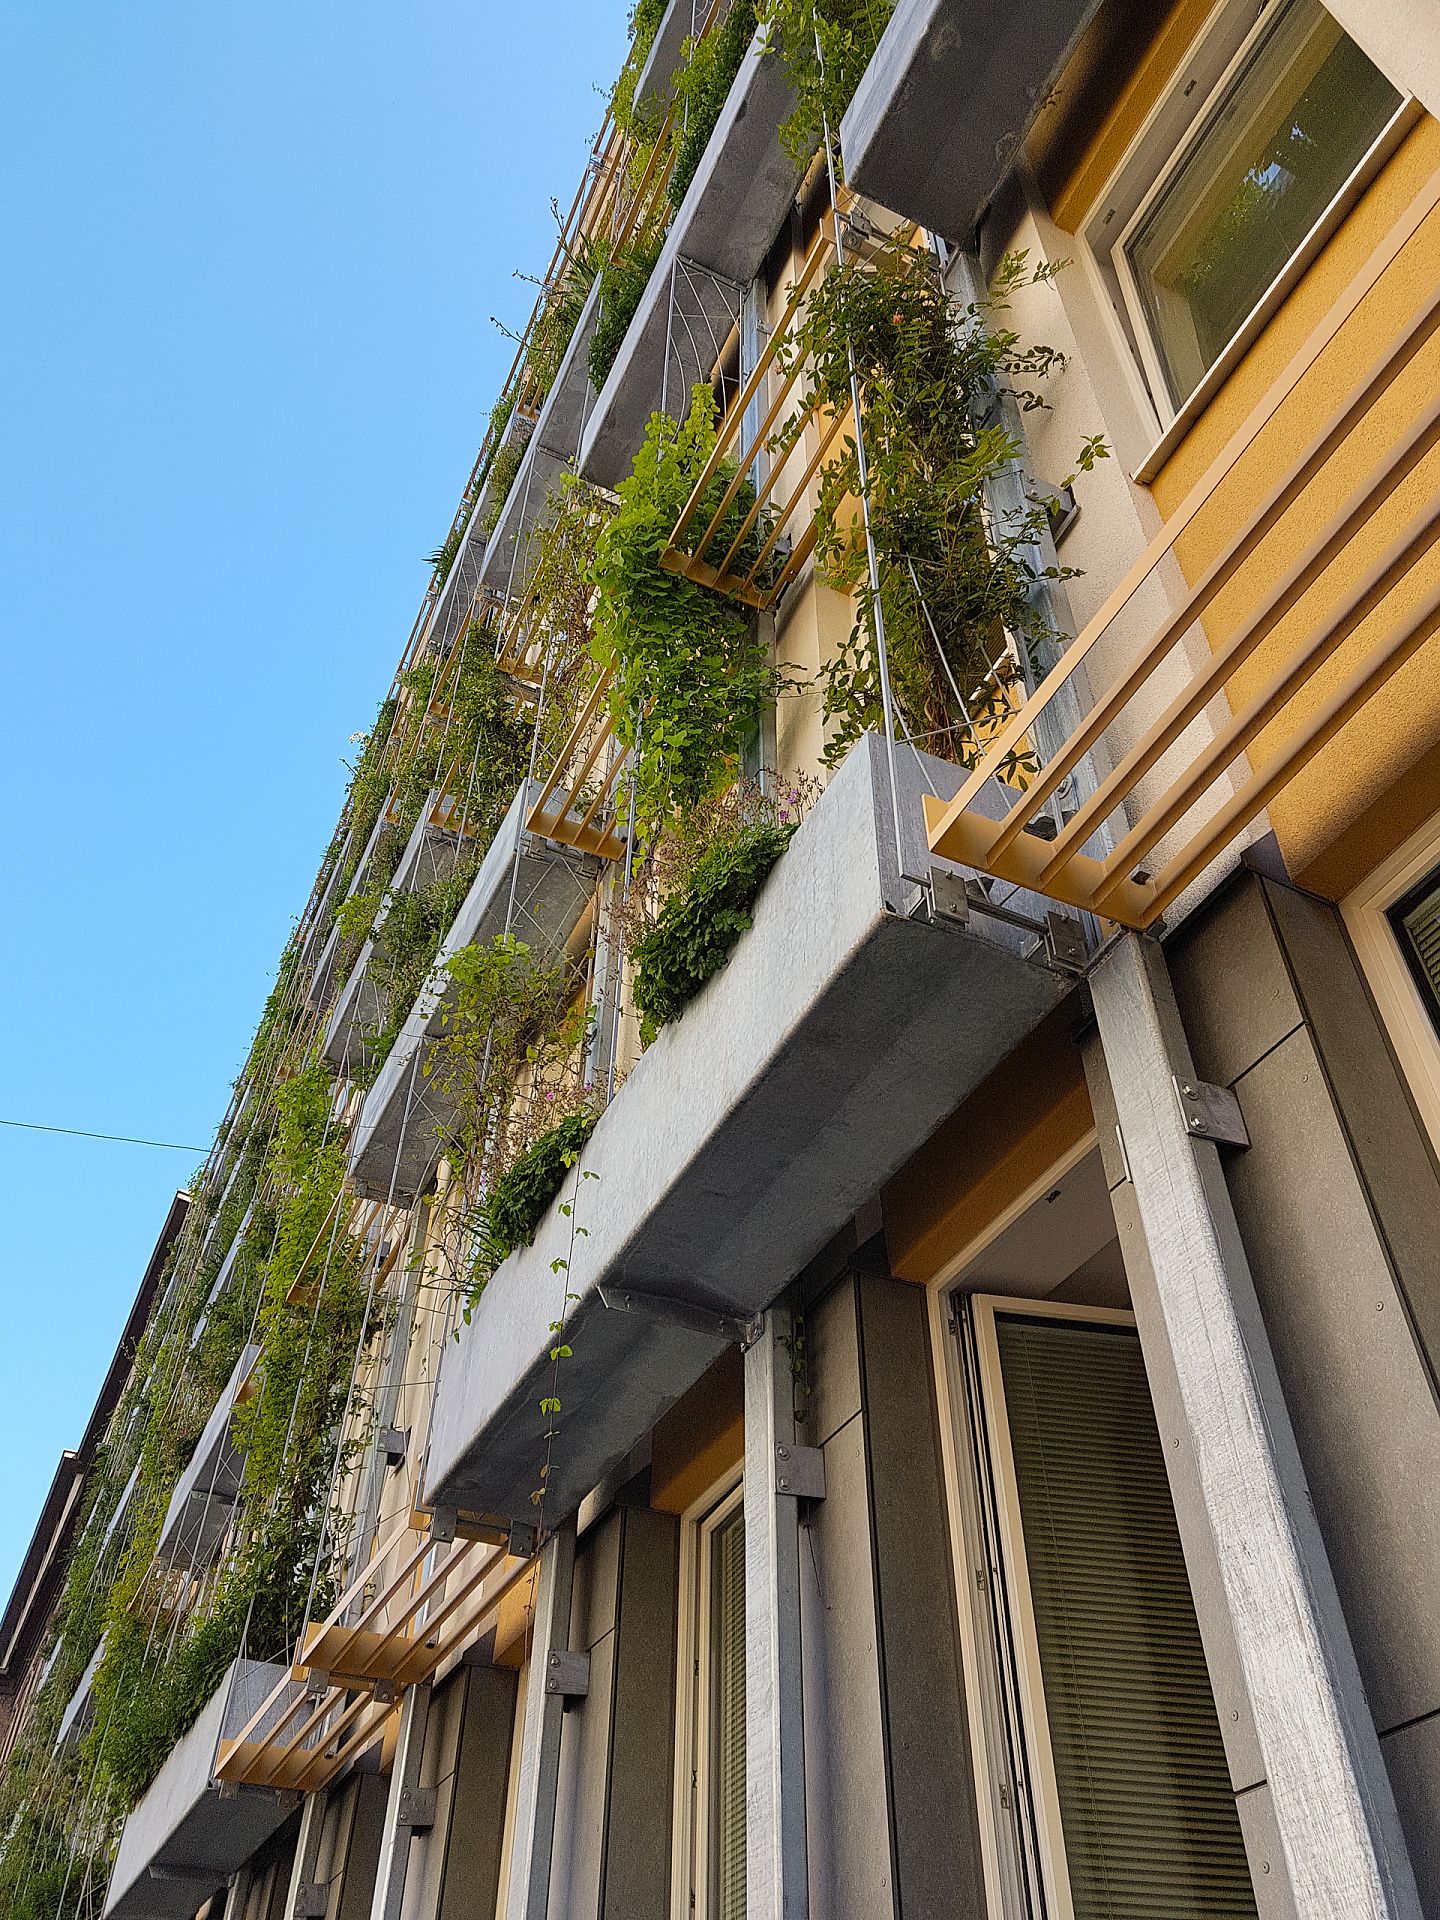
Example of a green façade on a Viennese Apartment Building
This illustration shows an example of a green façade on a Viennese Apartment Building
Copyright: Institute of Building Research & Innovation ZT GmbH
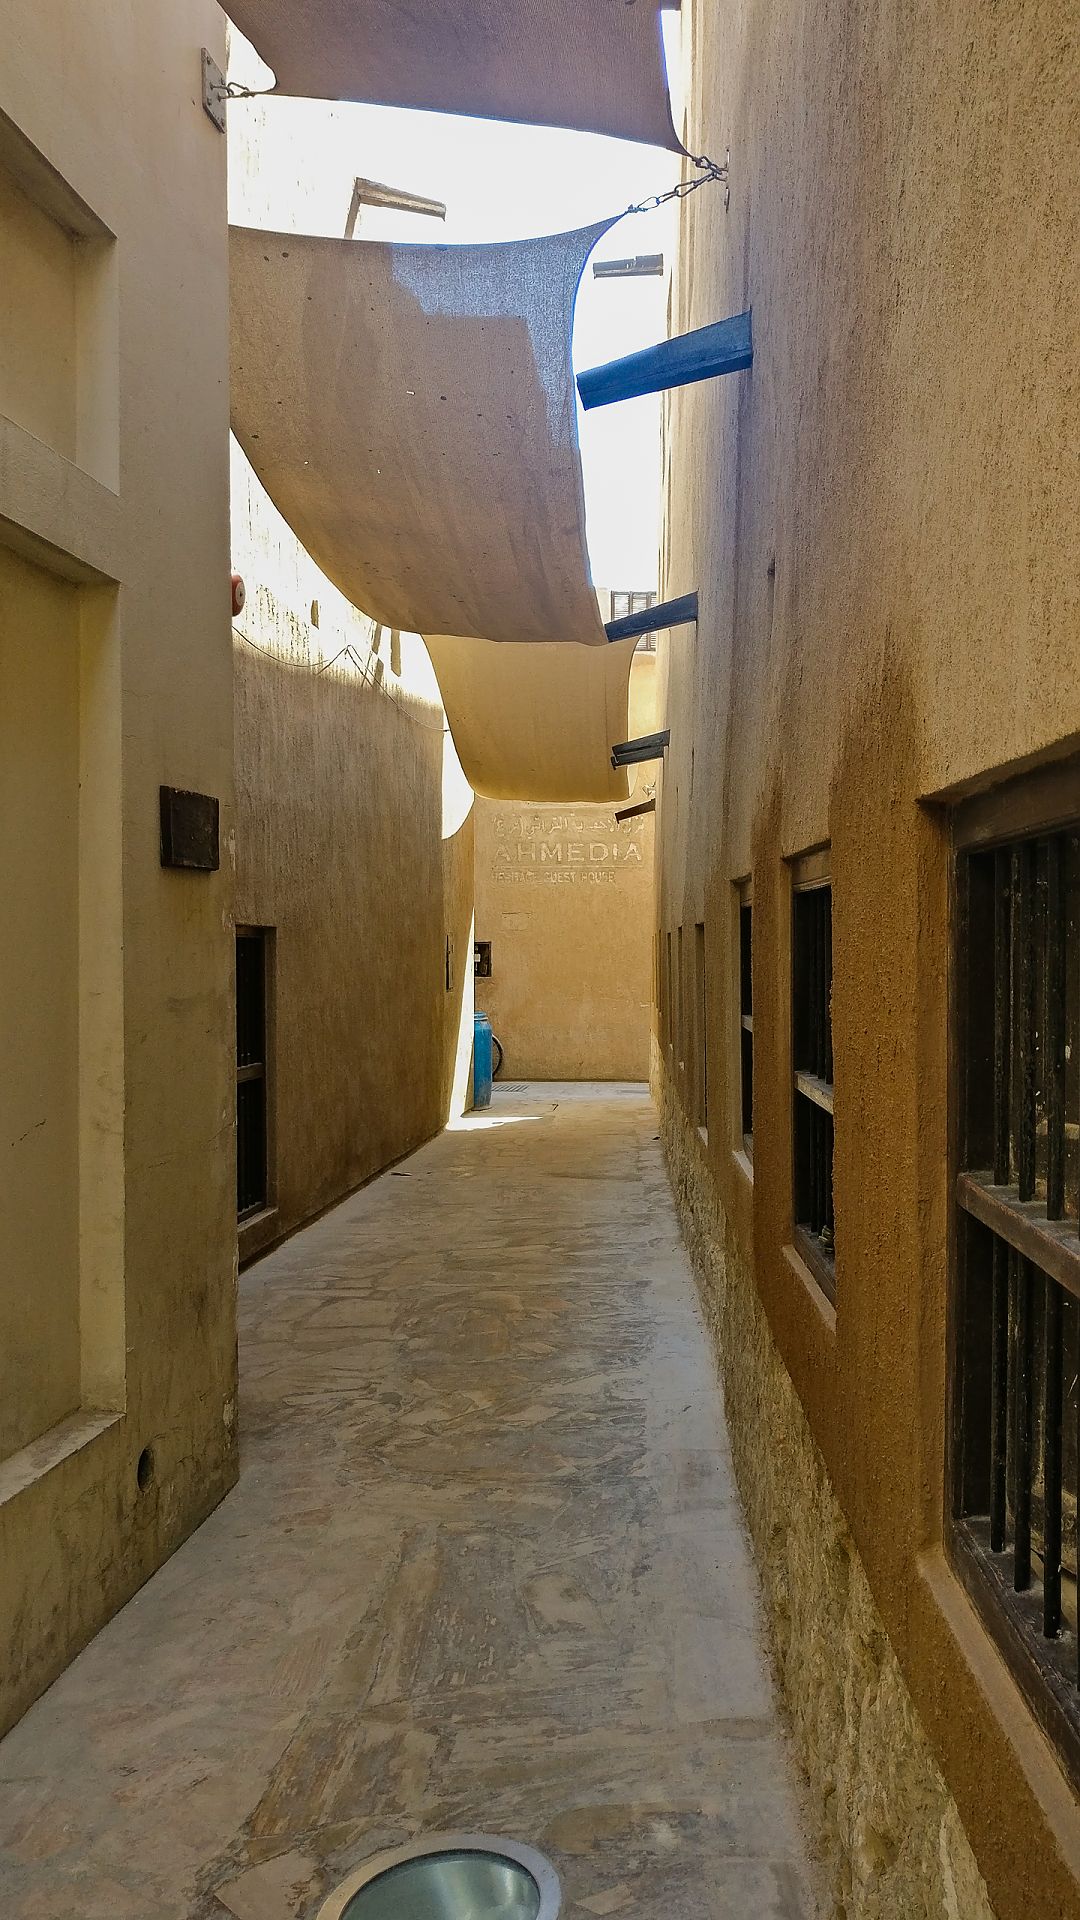
Example of solar shading of a public walkway in Dubai, United Arab Emirates
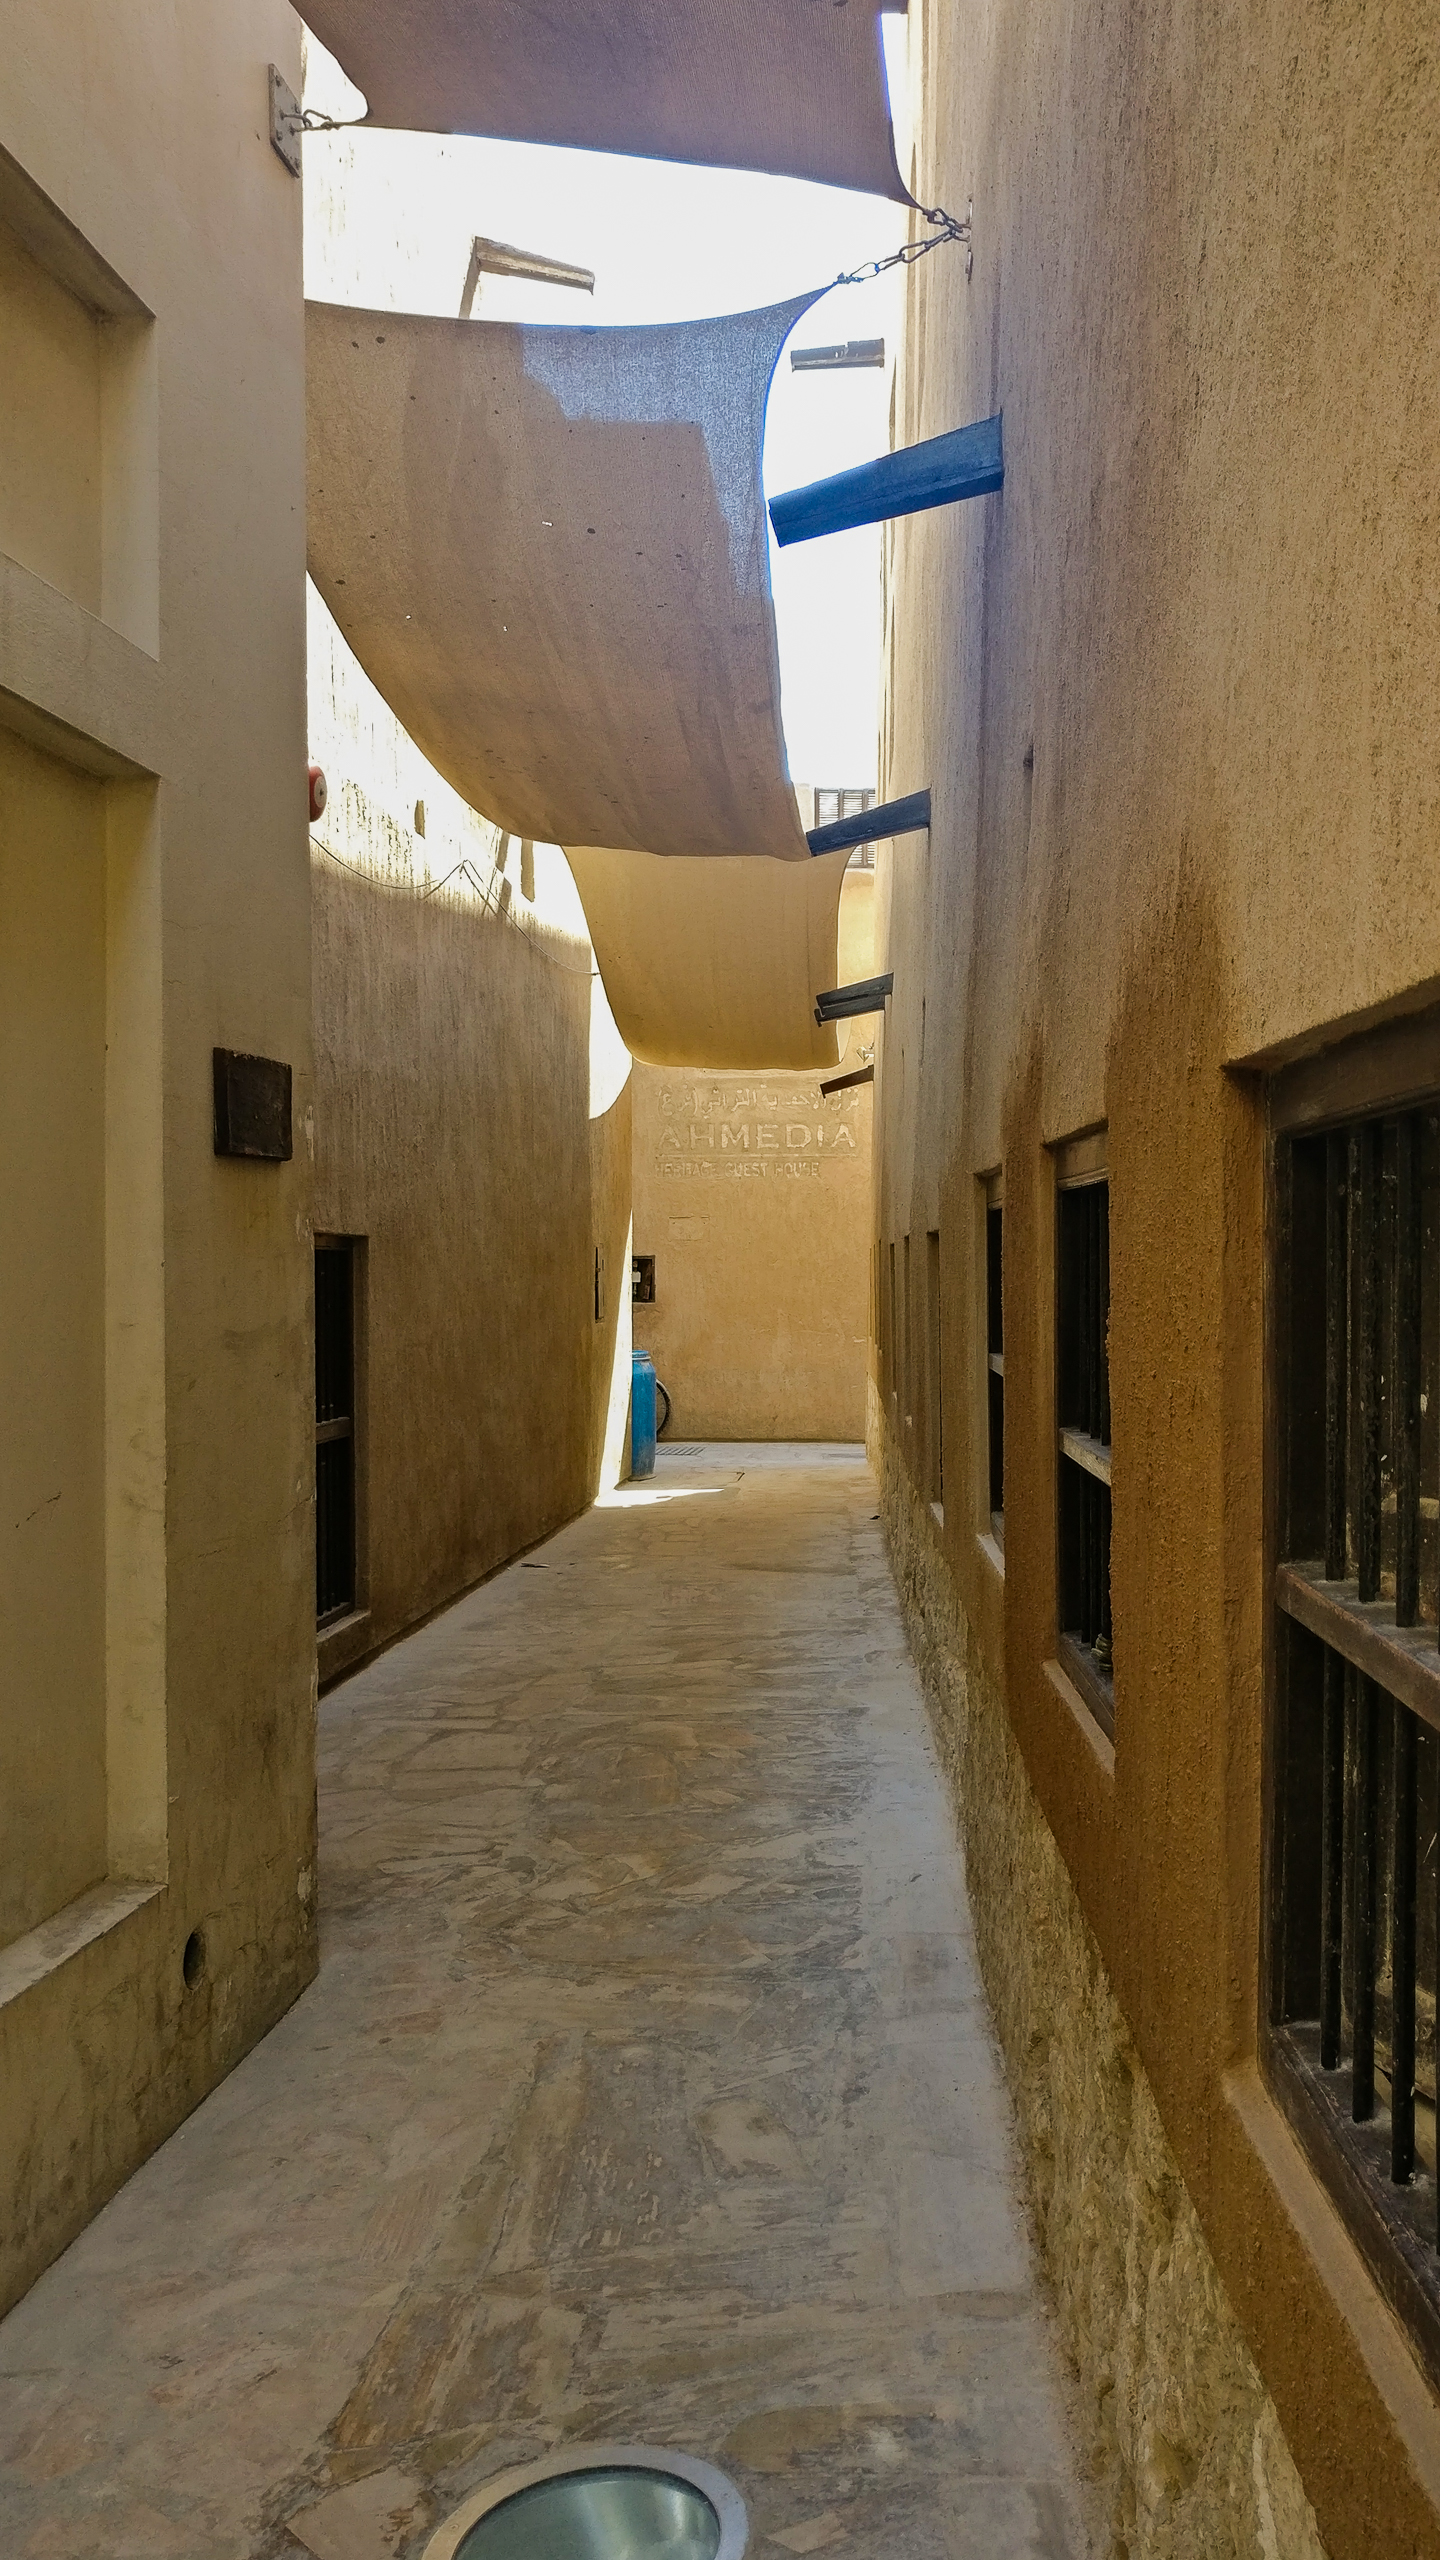
This illustration shows solar shading of an open public space in Dubai, United Arab Emirates.
Copyright: Institute of Building Research & Innovation ZT GmbH
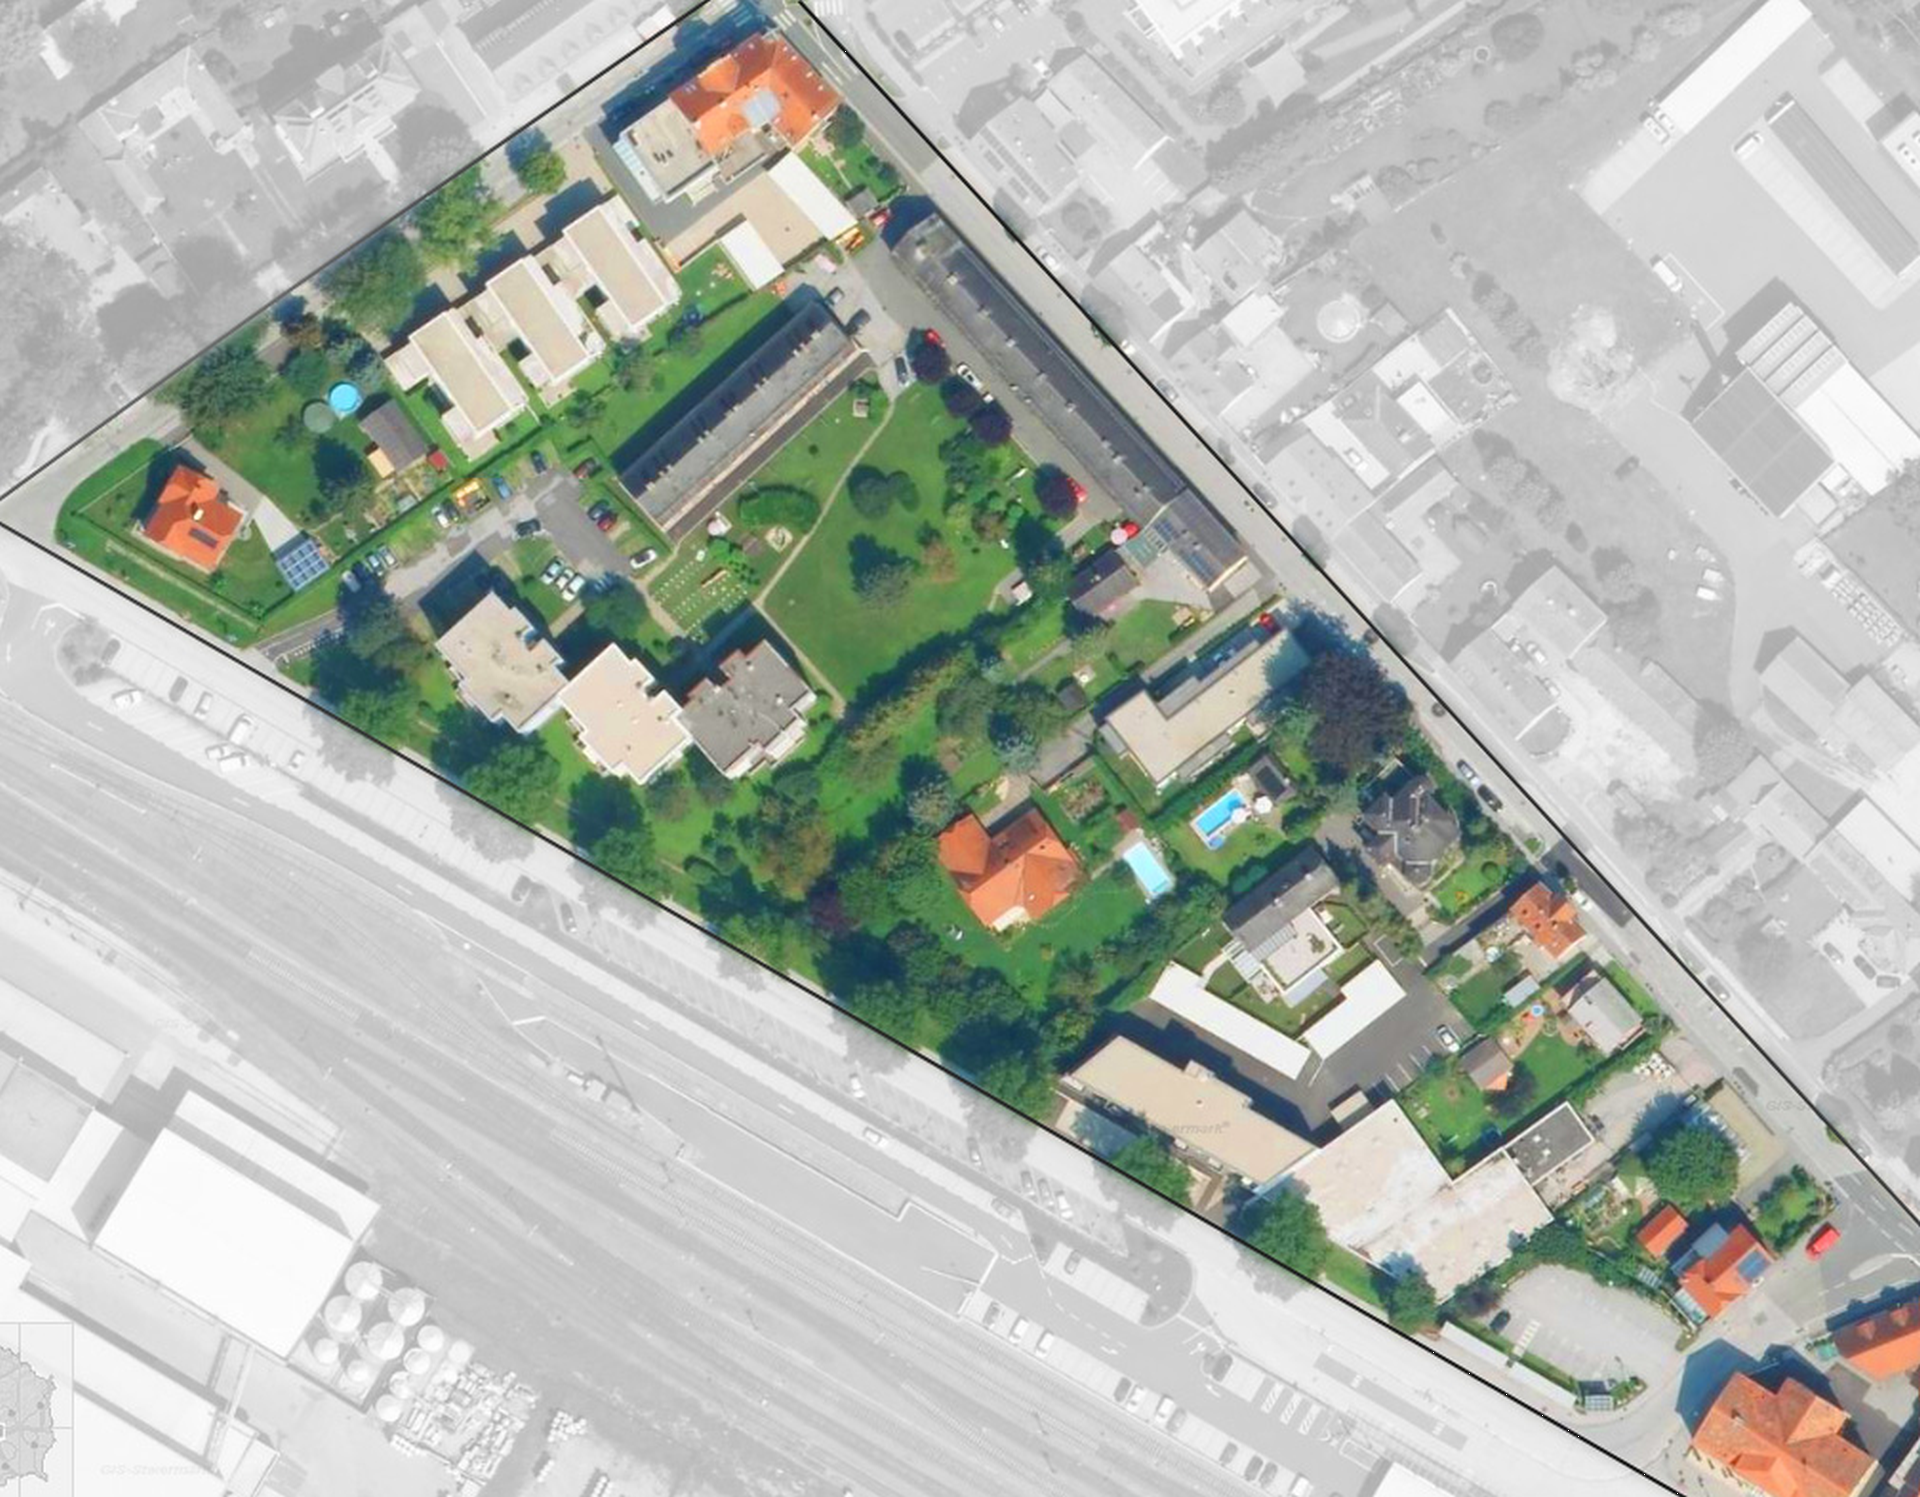
Aerial view case study Gleisdorf
Aerial view case study Gleisdorf
Copyright: AEE INTEC
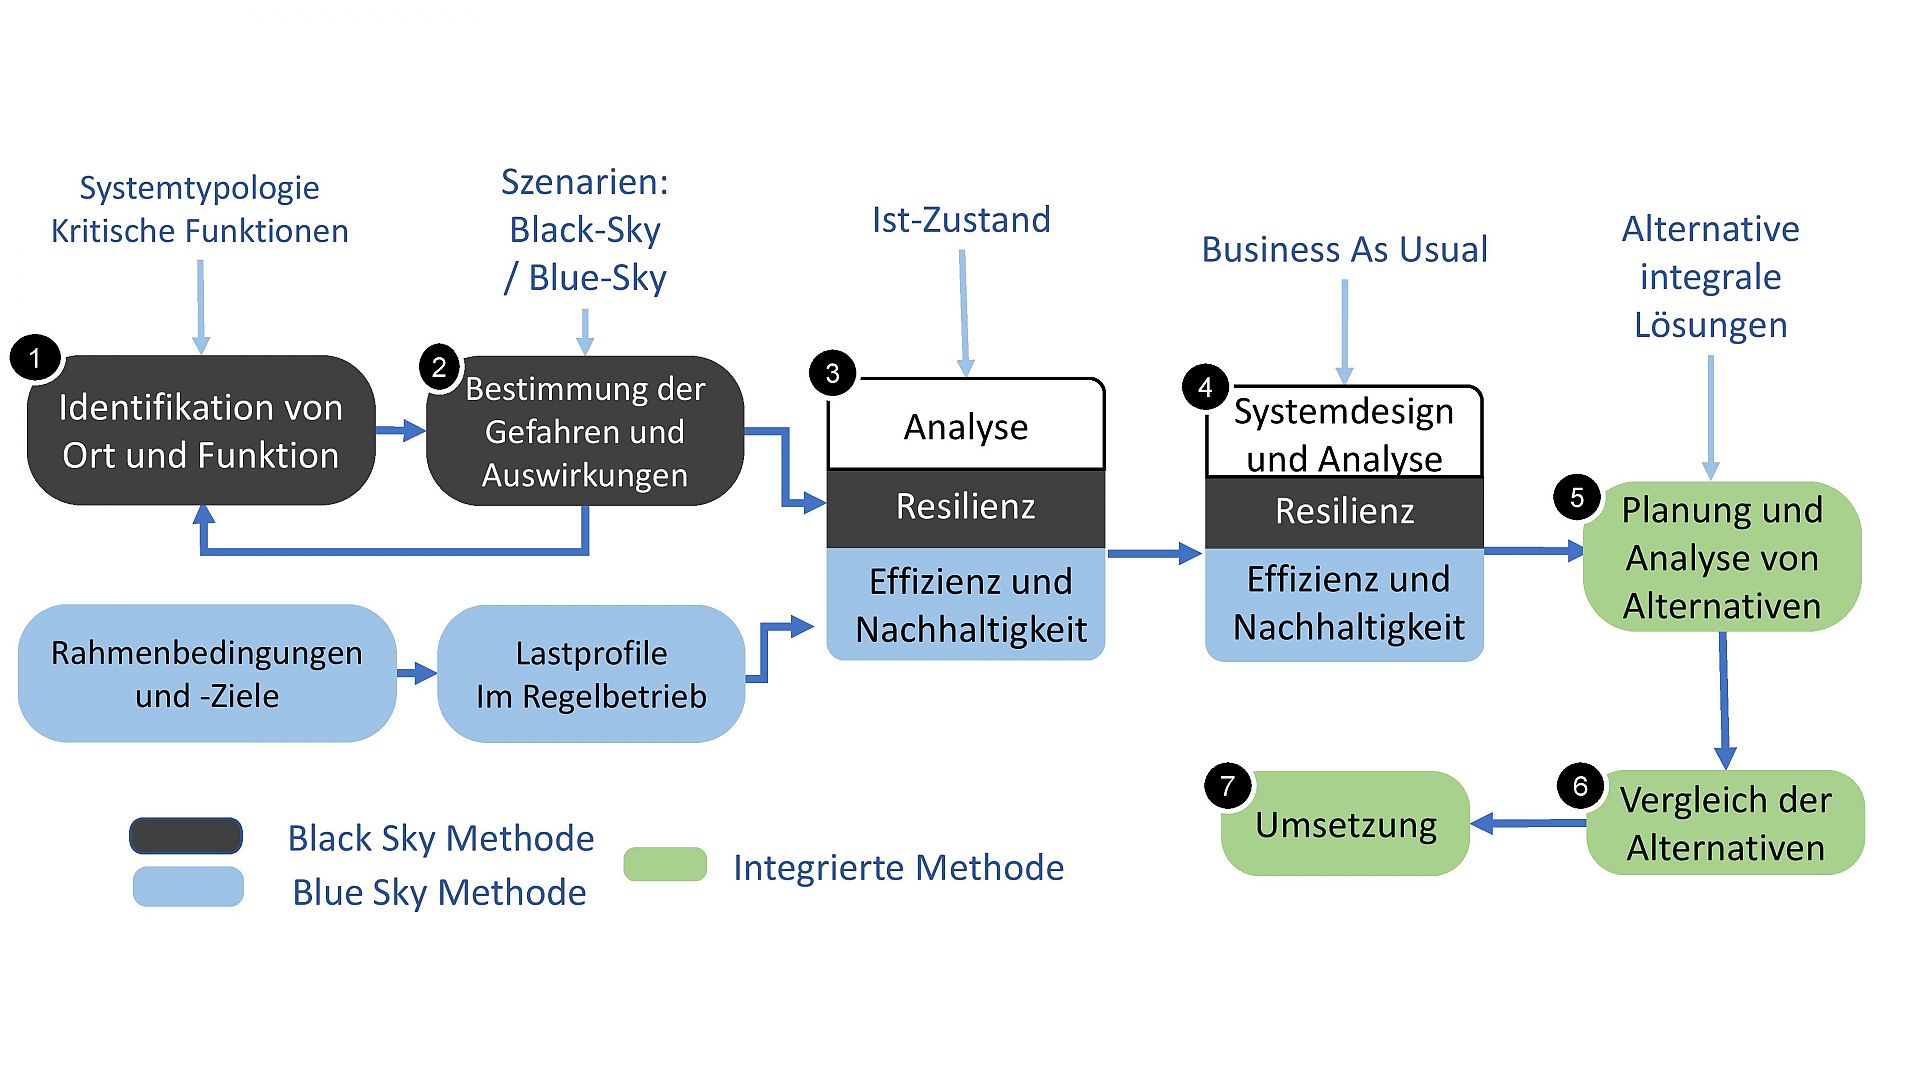
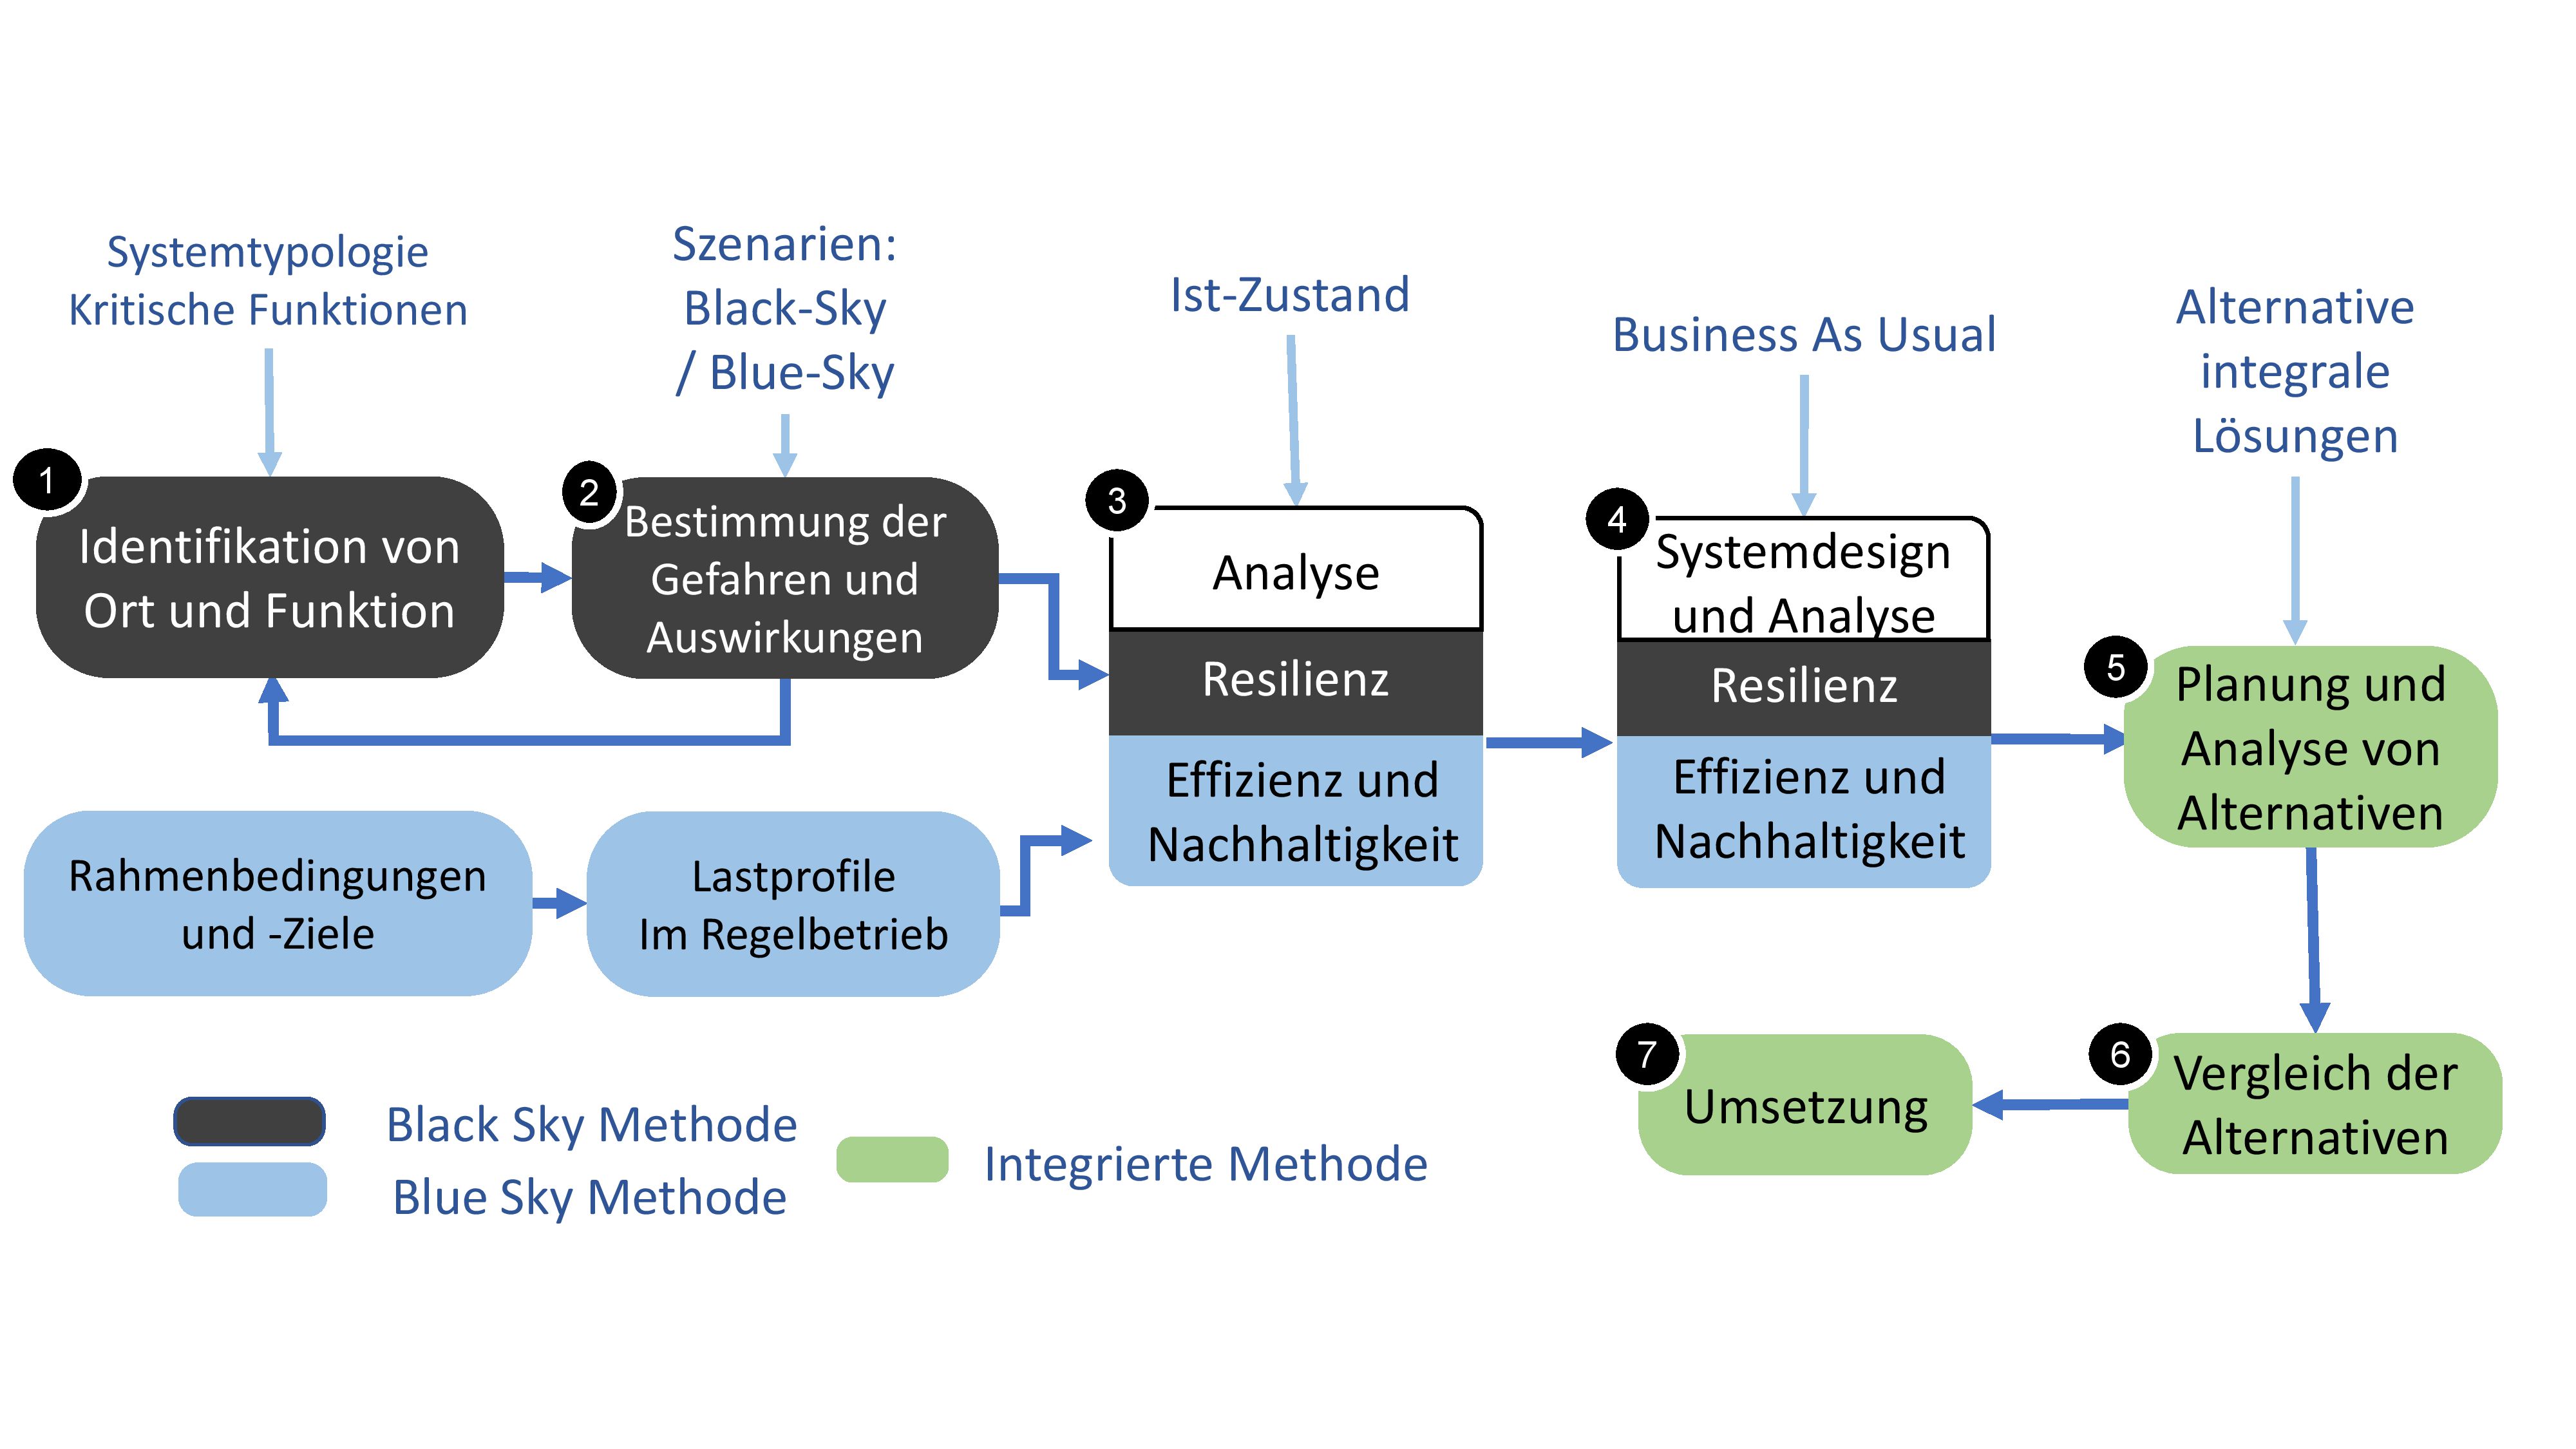
Process scheme for integrated Energy Master Planning that leads to a Resilient Energy System
How can we achieve resilient energy supply for buildings with critical infrastructure, based on renewable sources? Let us start with analysing the critical functions, assess the resilience, efficiency and sustainability of existing systems and add innovative and validated renewable energy sources as well as storage elements. This diagram shows you how to proceed.
Copyright: AEE INTEC
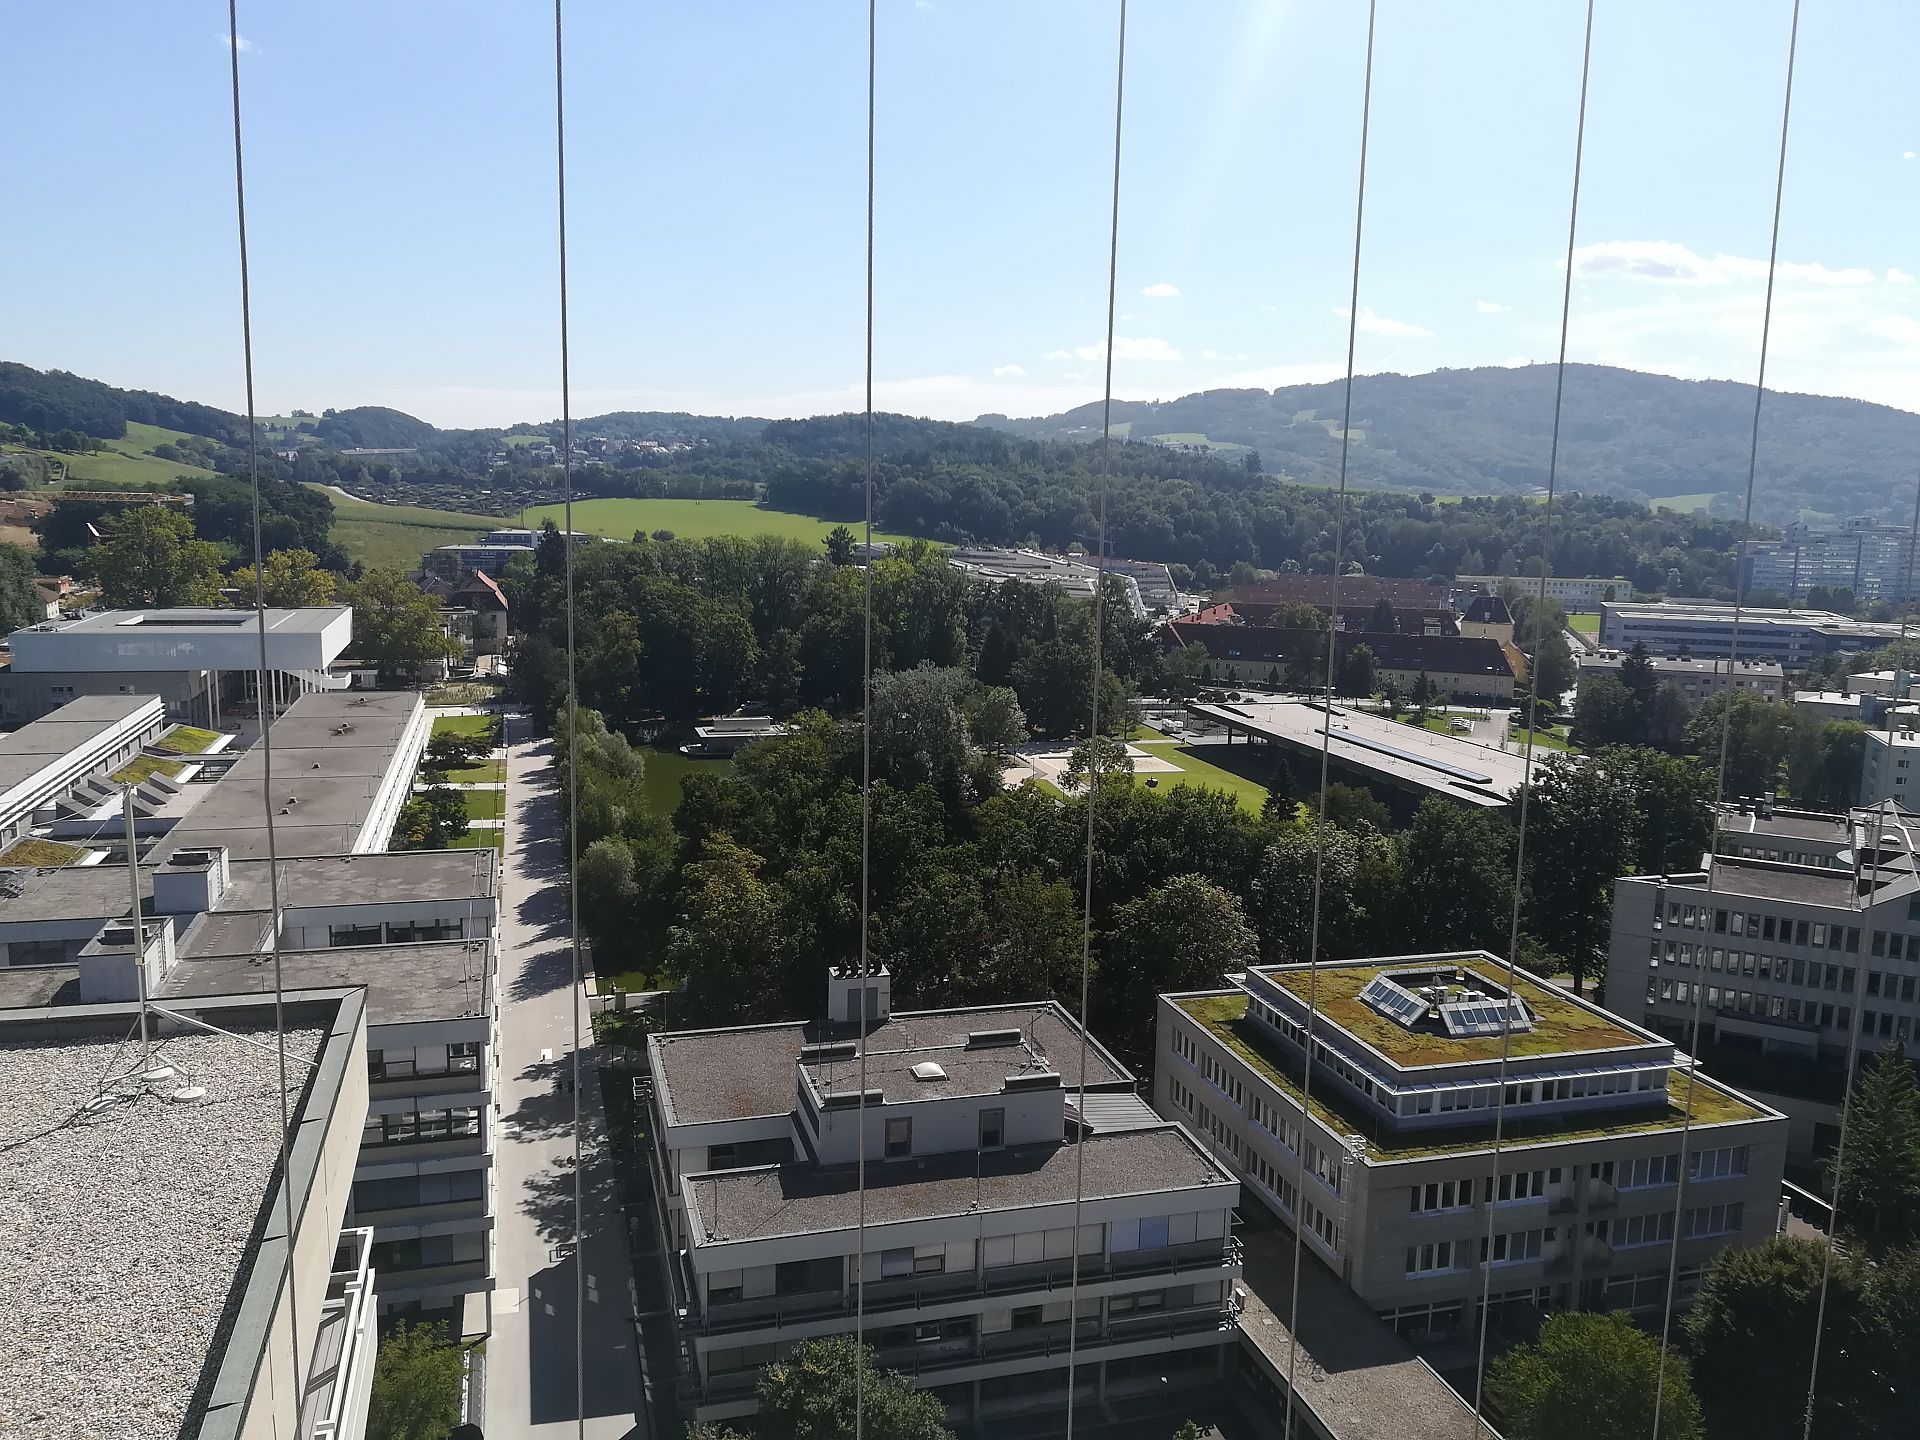
Campus of the Johannes-Kepler university in Linz
A bird's eye view shows the potential of the university campus JKU. Many buildings from different construction ages can become much more efficient through thermal and electrical renovation. This also makes it easier to supply them with a local energy system based on renewable and combined heating and cooling, and to maintain critical functions even in difficult situations.
Copyright: AEE INTEC
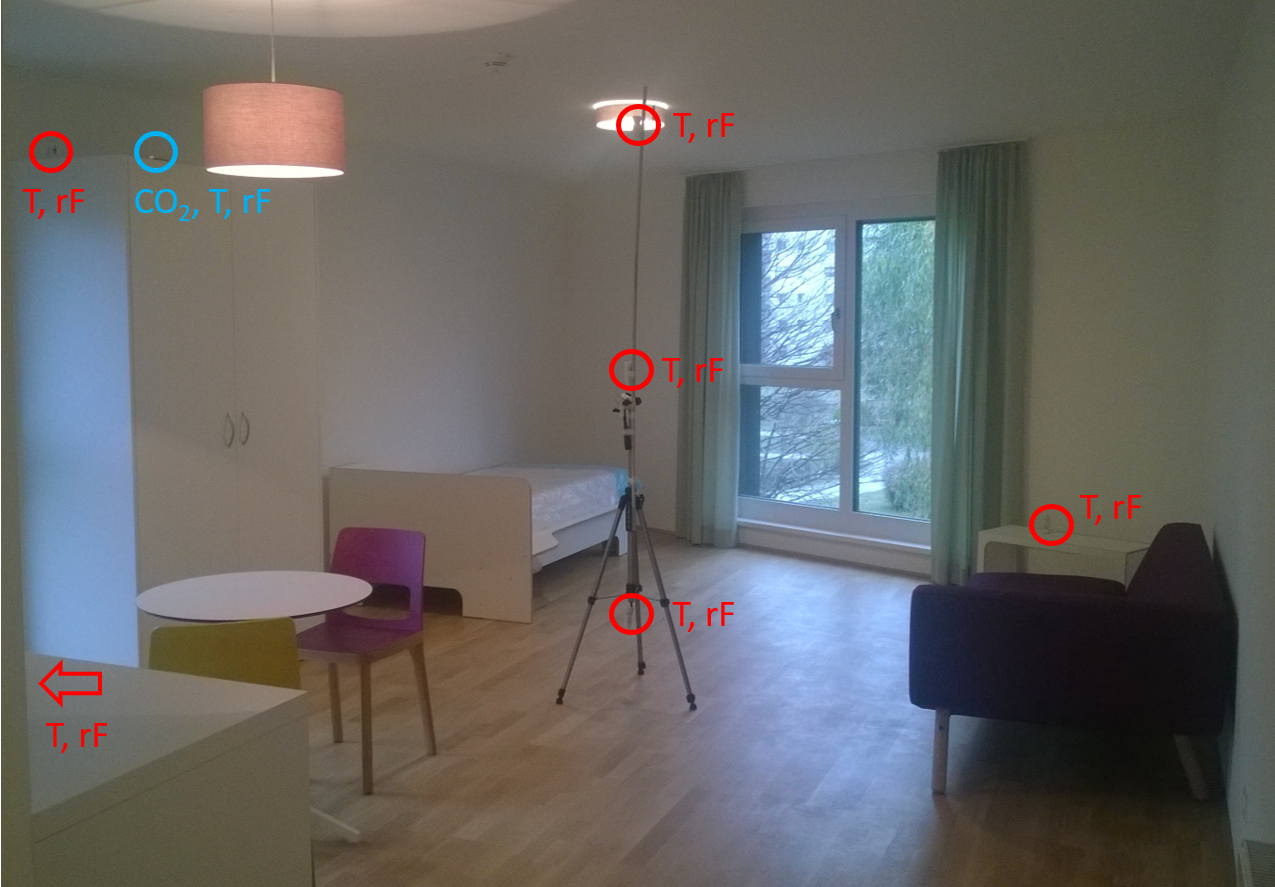
Measurements setup in test dwelling
The pictures shows the measurement setup in an unoccupied dwelling in the fieldstudy object "An der Lan" from the Innsbrucker Immobilien Gesellschaft.
Copyright: Gabriel Rojas, Universität Innsbruck
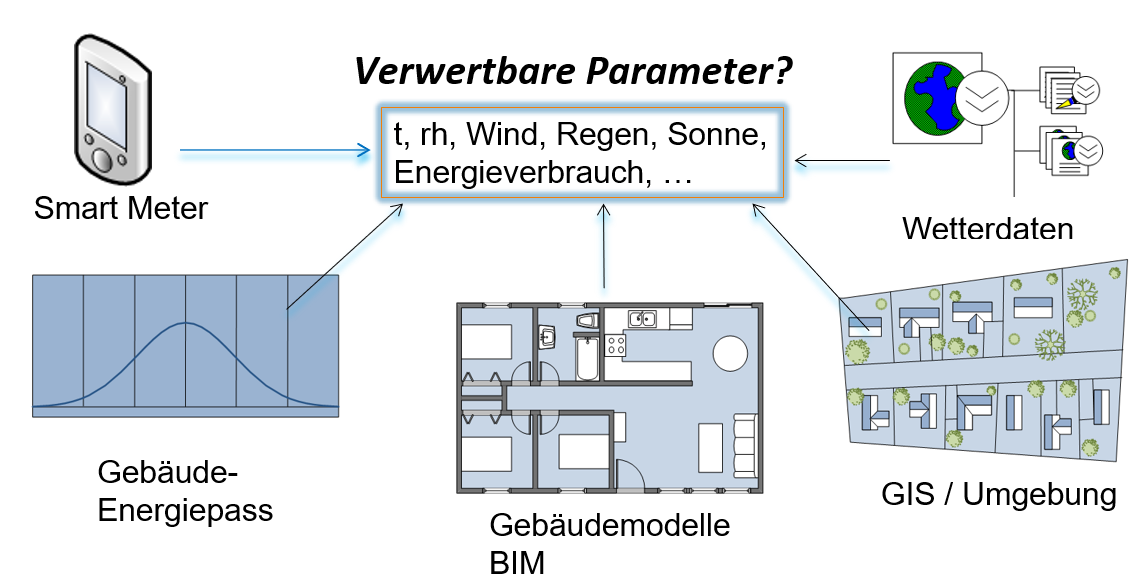
Data soures
Schematic drawing of the usable parameters from different possible data sources.