Project Image Pool
There are 125 results.
Terms of use: The pictures on this site originate from the projects in the frame of the programmes City of Tomorrow, Building of Tomorrow and the IEA Research Cooperation. They may be used credited for non-commercial purposes under the Creative Commons License Attribution-NonCommercial (CC BY-NC).

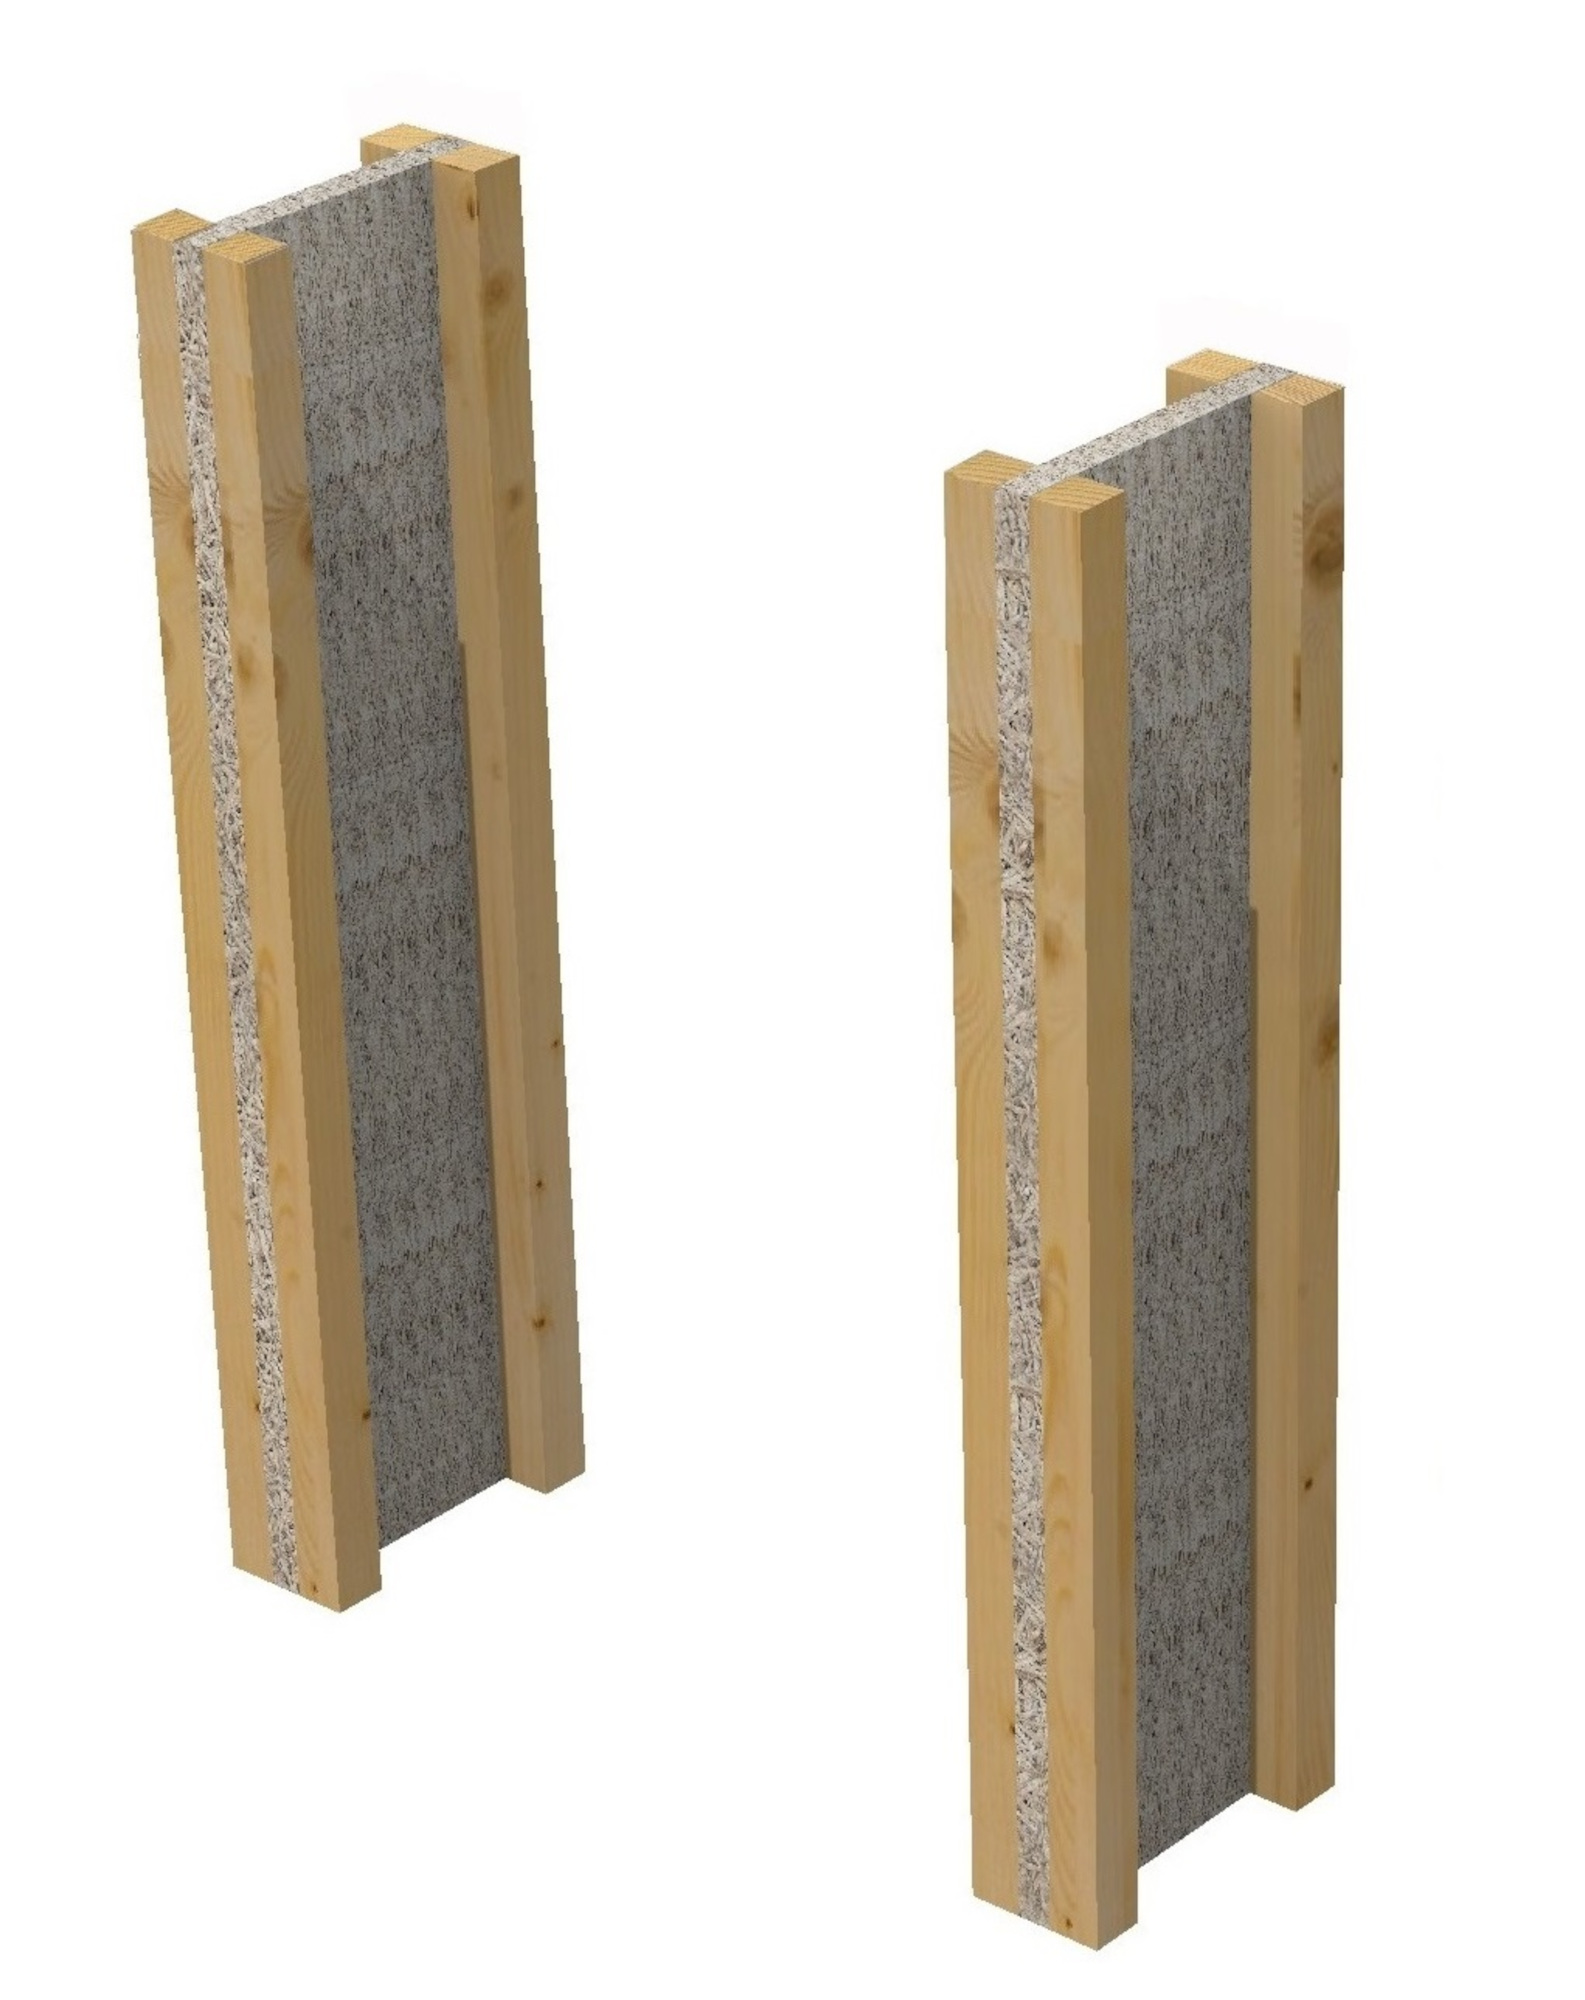
B-Joist wood wool joist
Urban Straw system compartment separator made of cement-bonded wool boards and wooden slats.
Copyright: capital [ A ] architects
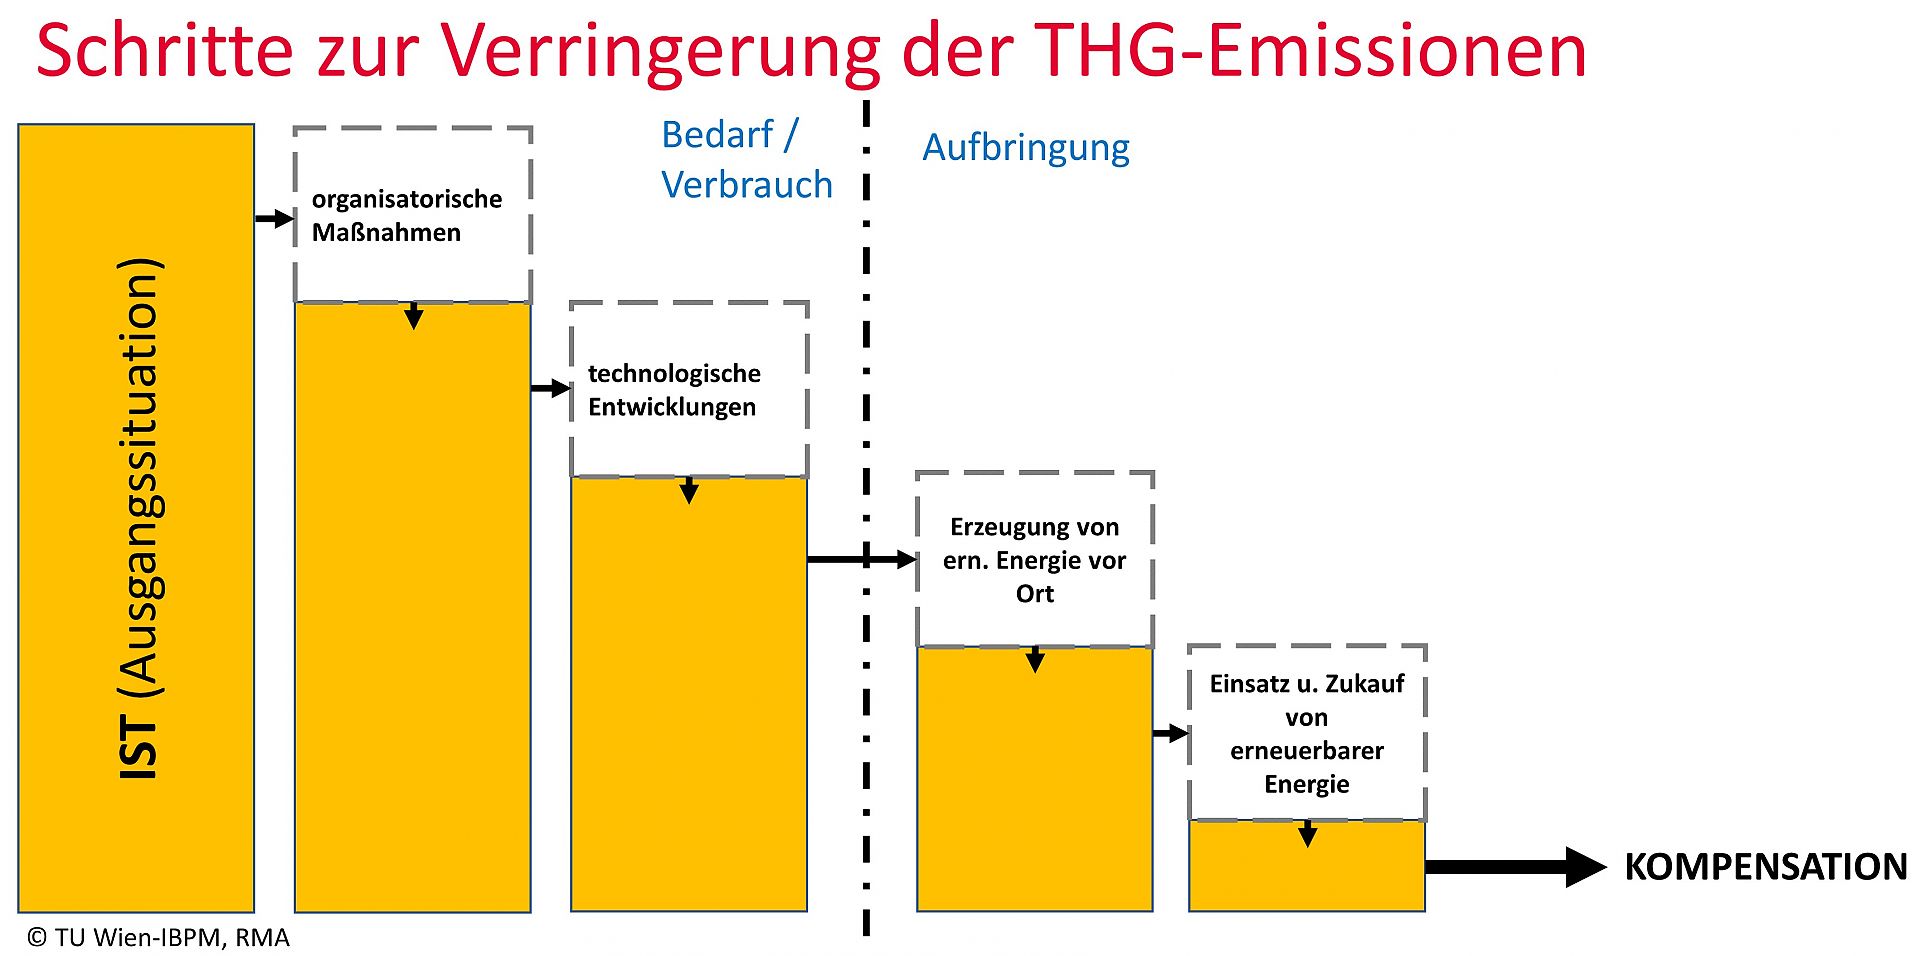
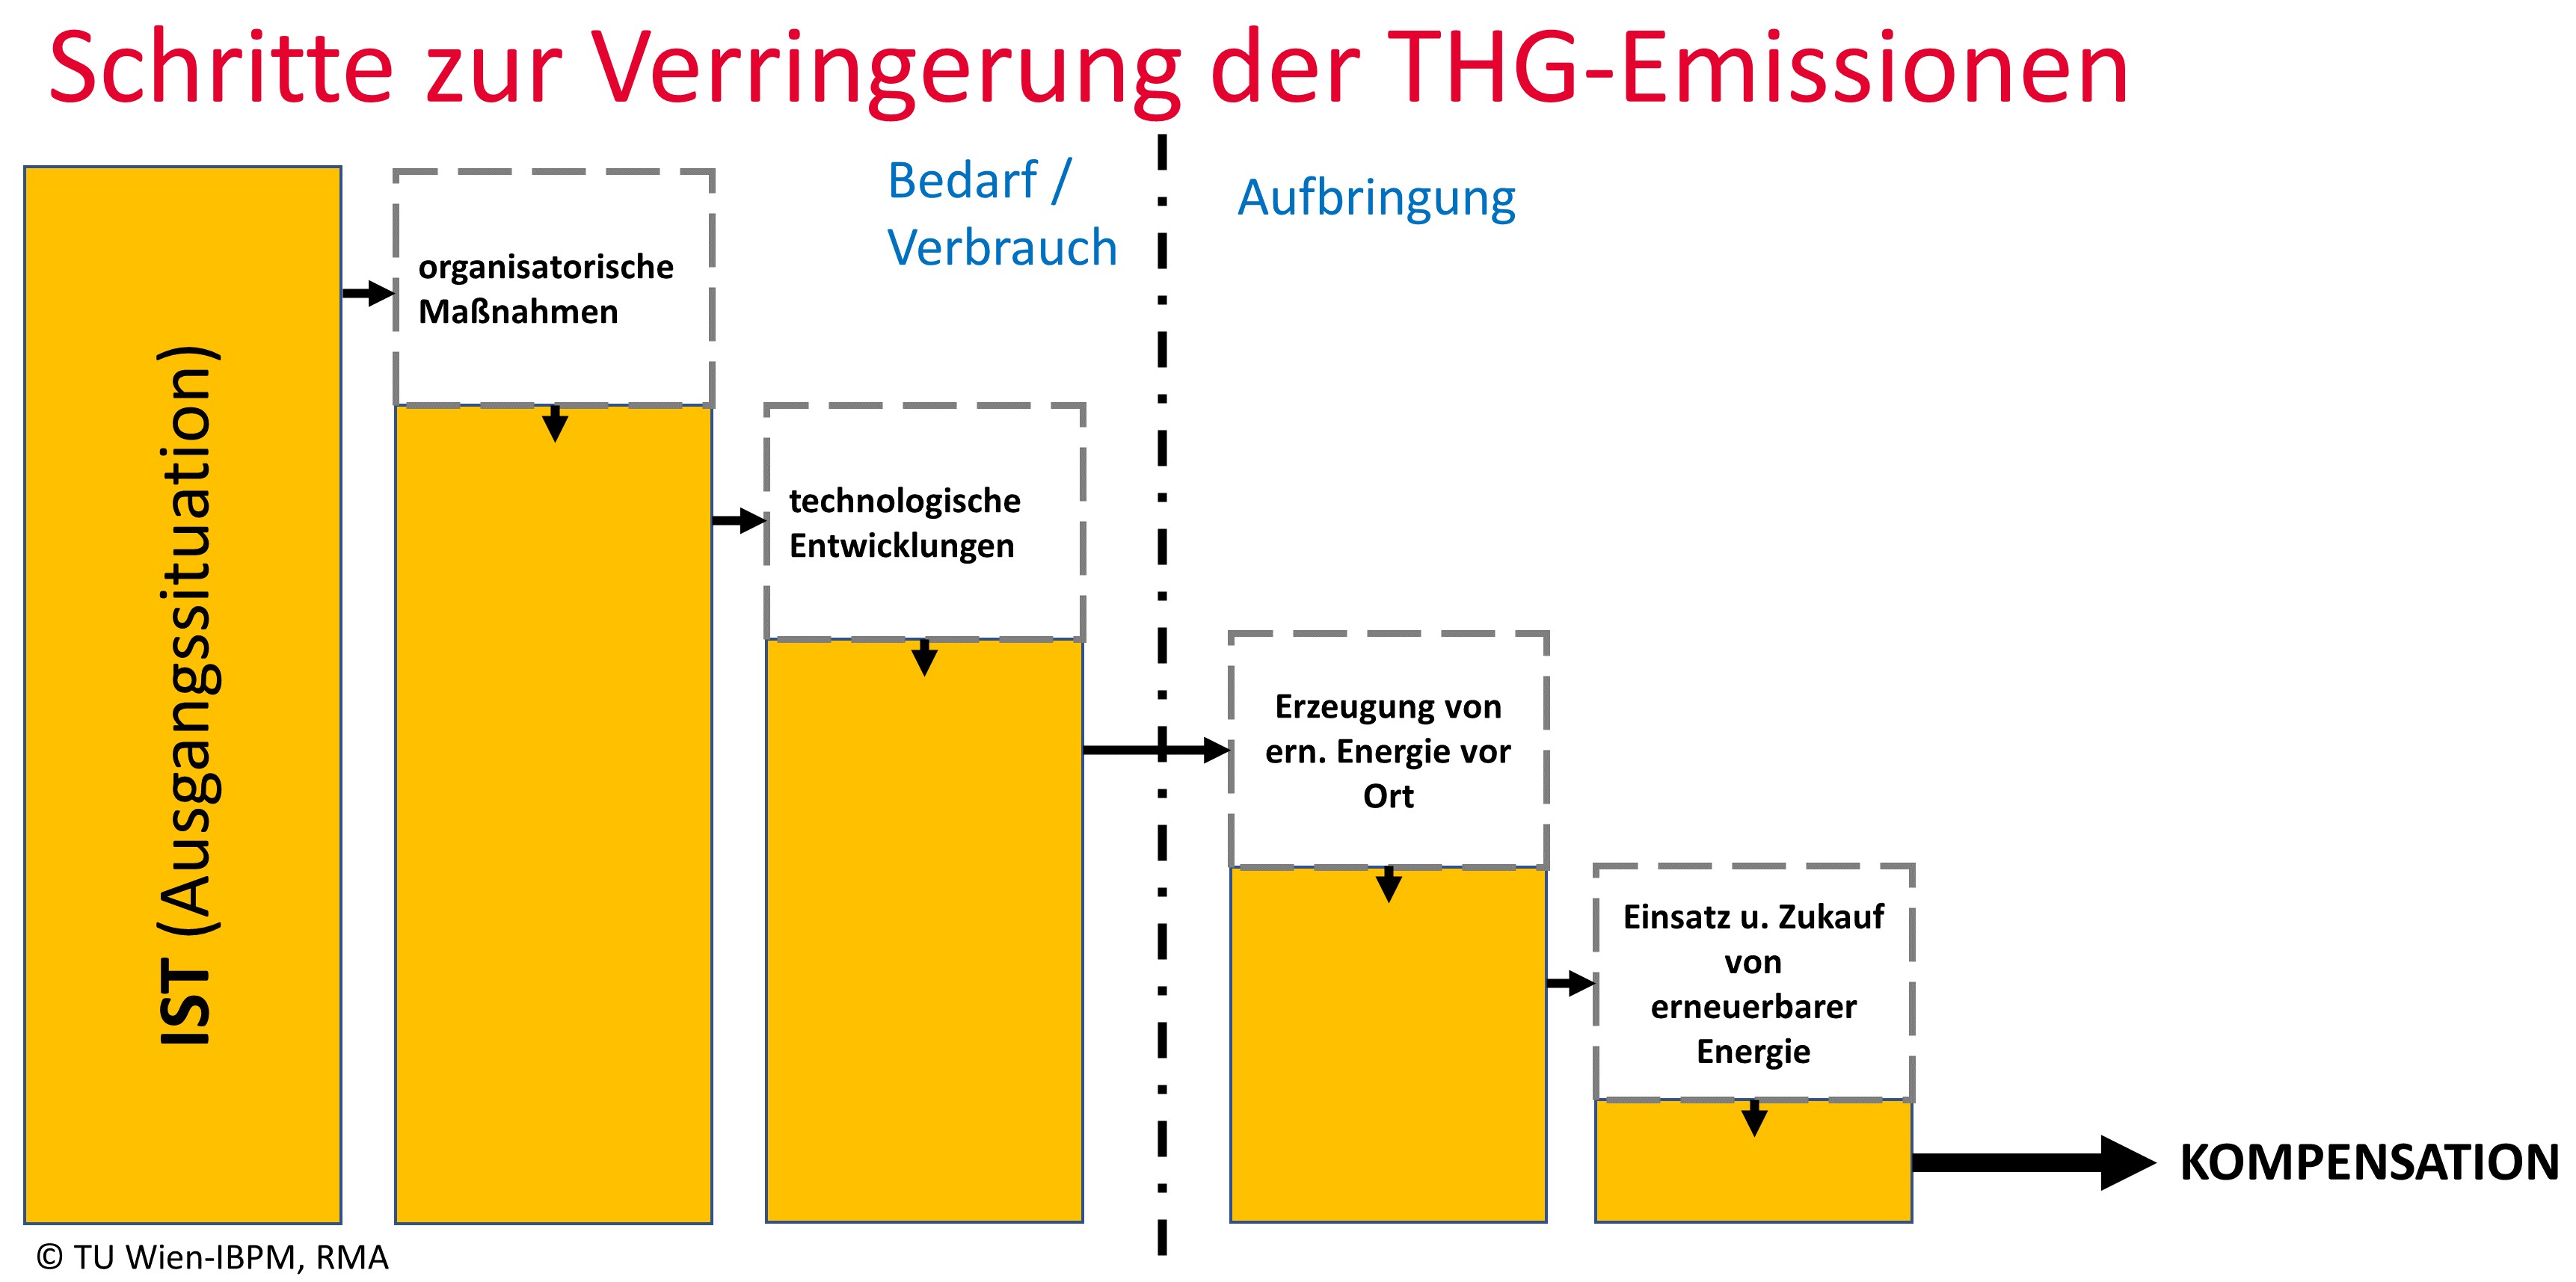
Steps to reduce GHG emissions on construction sites
A number of steps are needed to achieve substantial GHG emission reductions on construction sites. The term "reduction" is used when GHG emissions are reduced by avoiding (energy) demand and consumption on the one hand and by shifting (energy) input from non-renewable energy to renewable energy on the other. The steps to reduce GHG emissions on construction sites are defined in a step-by-step plan. Energy consumption is reduced in the first steps through organisational measures and technological developments. The shift in energy generation can be achieved by generating renewable energy directly on the construction site or by purchasing it. The final step to achieve the goal CO2 neutral construction sites is the CO2-Compenstion. Translated with www.DeepL.com/Translator (free version)
Copyright: TU Wien-IBPM, RMA
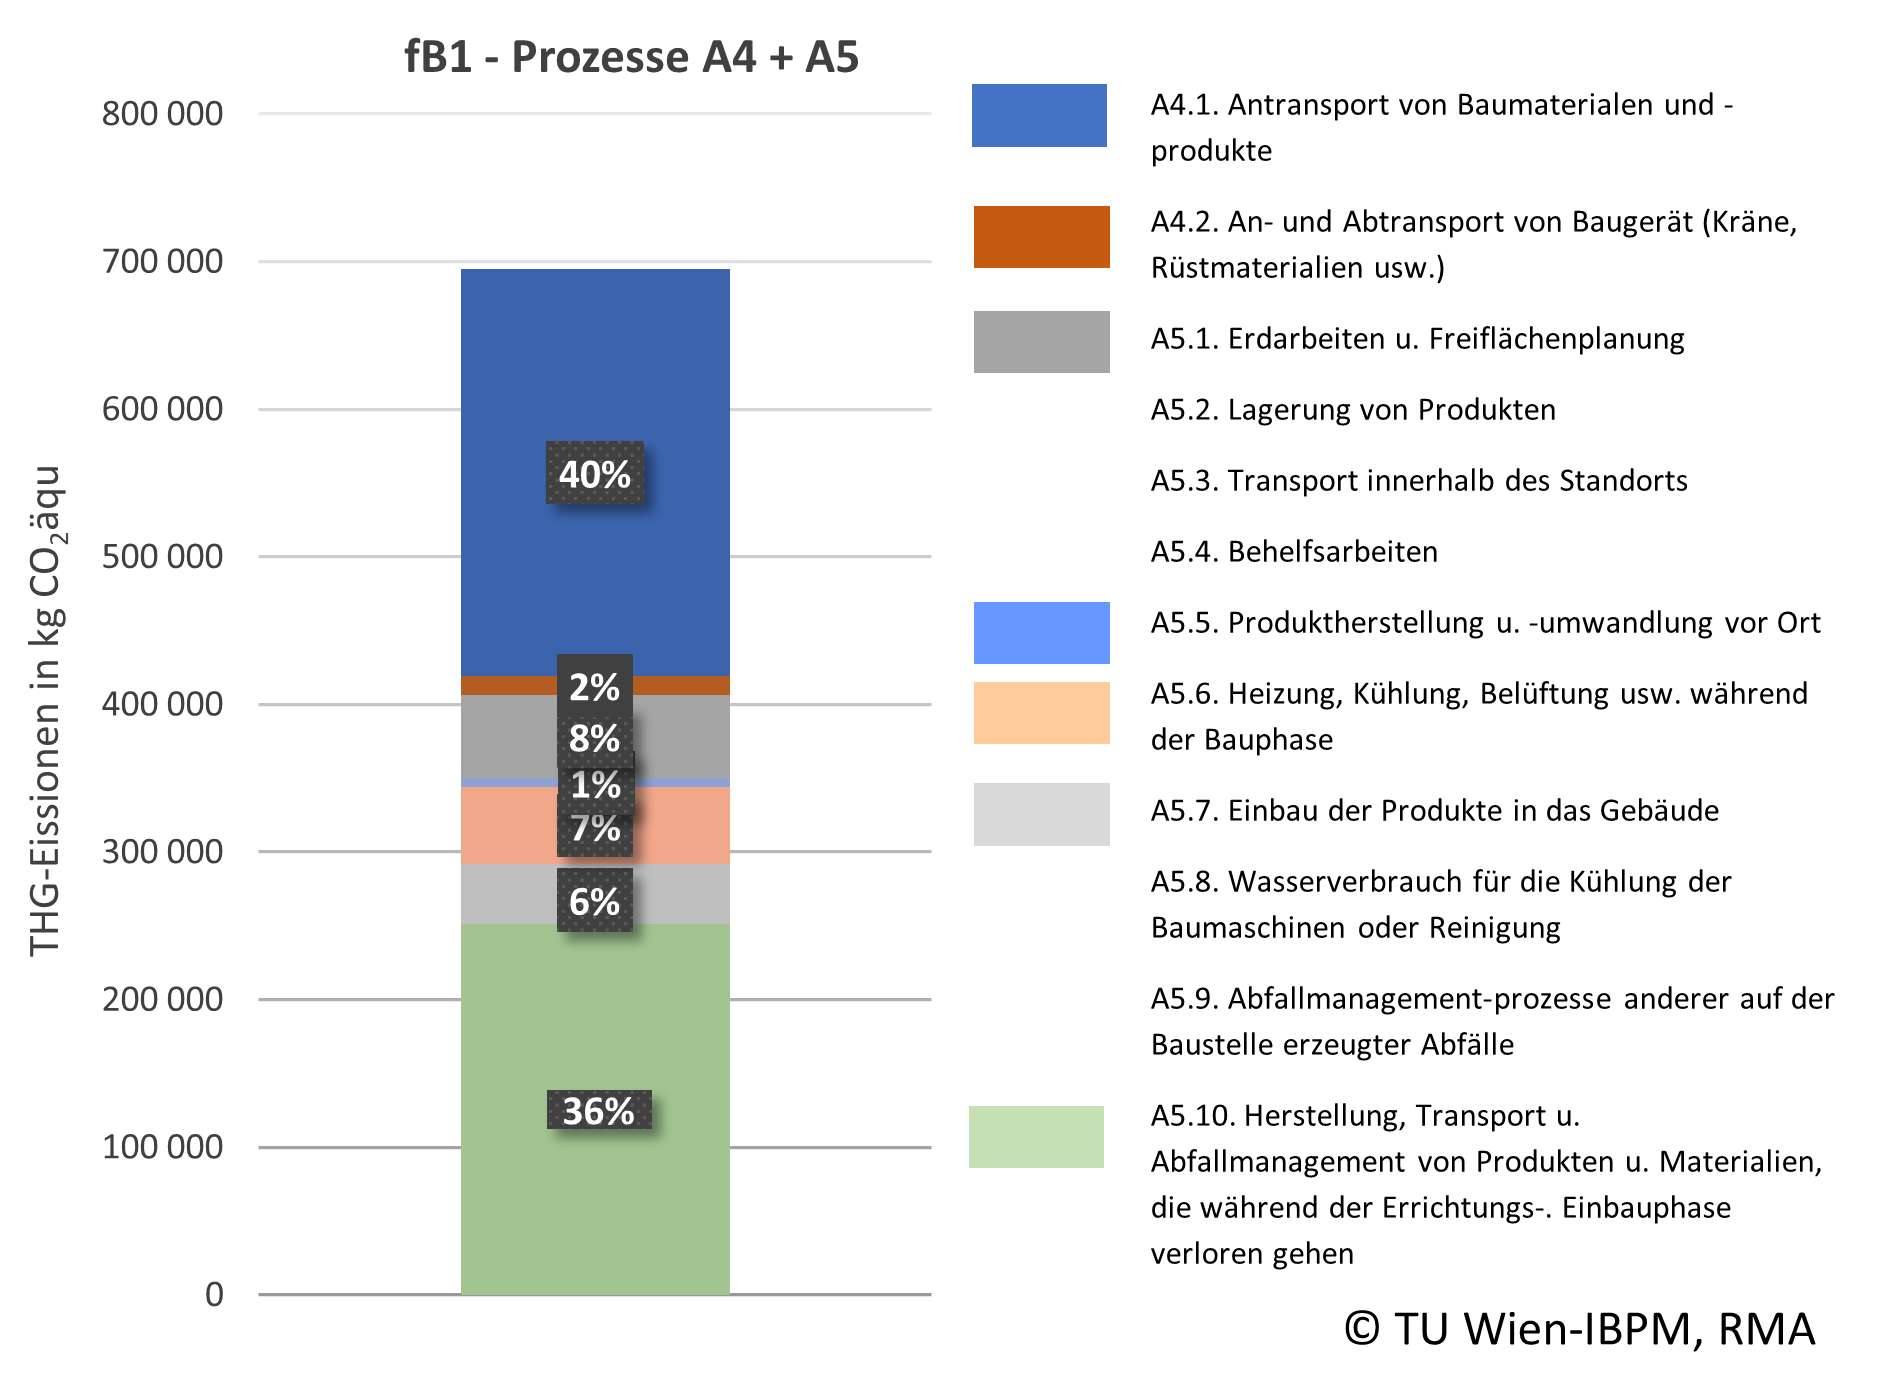
GHG emissions of a Viennese residential building broken down by processes
The GHG emissions of a construction site are illustrated using a fictitious construction site of a Viennese residential building with almost 200 apartments and a gross floor area of 17,000 m². These amount to almost 700,000 kg CO2-eq, of which about 300,000 kg CO2-eq (42 %) are attributable to module A4 "Transportation" and around 400,000 kg CO2-eq (58 %) to module A5 "On-site processes". The allocation of GHG emissions to the individual processes can be seen in the figure. In total, around 77 % of the GHG emissions are transport activities. The calculation values are to be understood as project-specific potentials and have no general validity. Translated with www.DeepL.com/Translator (free version)
Copyright: TU Wien-IBPM, RMA
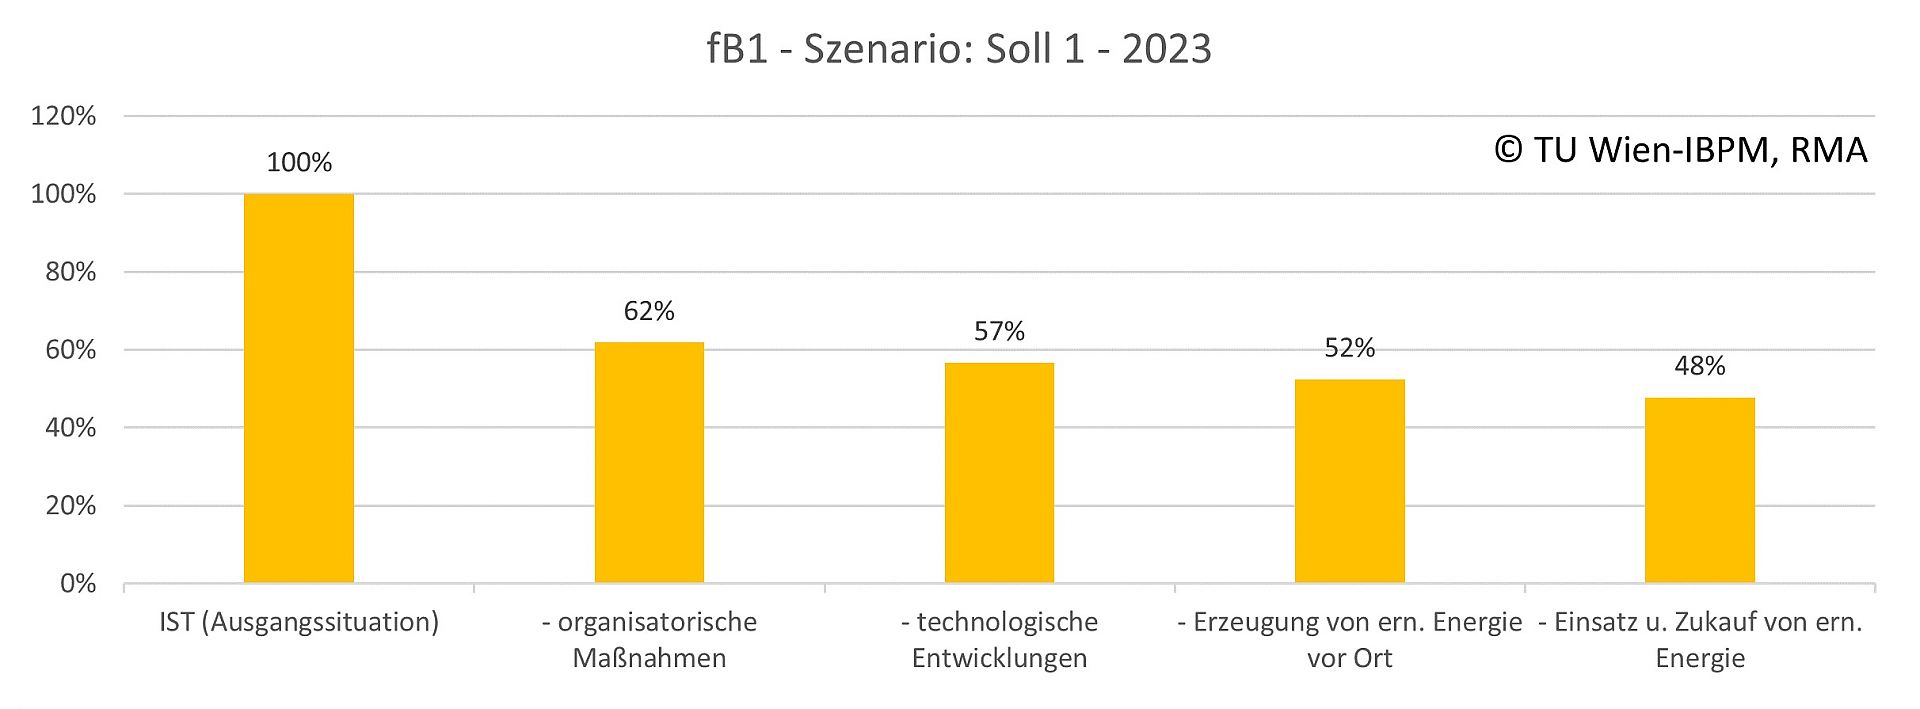
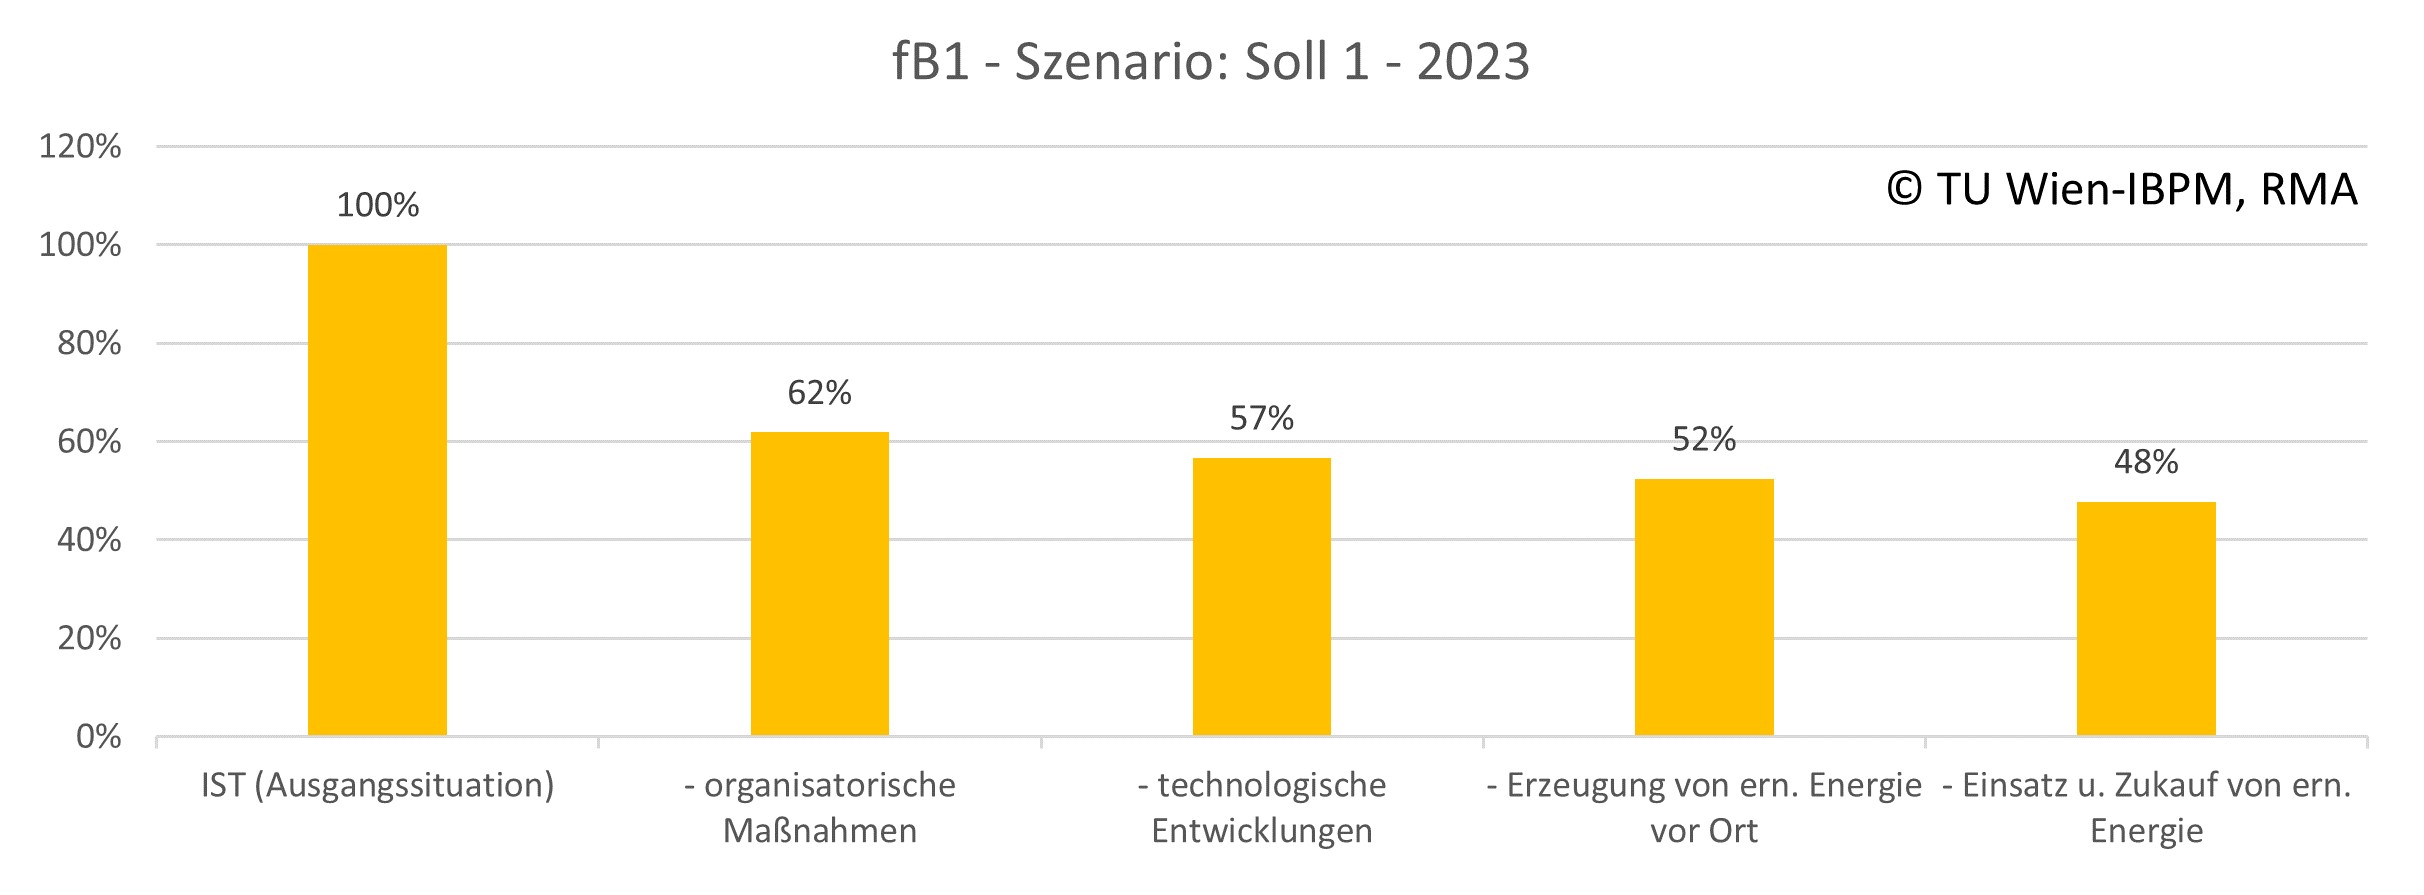
Scenario 2023 for the reduction of GHG emissions for the sample housing construction site in Vienna.
The figure shows the evaluation of a realistic scenario 2023 of the fictitious residential construction site according to the steps to reduce GHG emissions. GHG emissions are reduced by 38 % in the first step "organizational measures". These consist of 36 % points reduction in transport distances and 2 % points savings in processes on the construction site. A further around 5% is saved in the "technological developments" step. GHG emissions are reduced by an additional 5% through "on-site renewable energy (electricity) generation." The remaining electricity demand is covered by UZ46 "Green" electricity. In total, these action steps add up to 48% of the original (ACTUAL) emissions. For these remaining approximately 333 t CO2-eq, at a price of 25 EUR / t CO2-eq, approximately 8,325 EUR would have to be paid in compensation in order to achieve the goal of the "CO2 neutral construction site". The calculation values are to be understood as project-specific potentials and have no general validity. Translated with www.DeepL.com/Translator (free version)
Copyright: TU Wien-IBPM, RMA
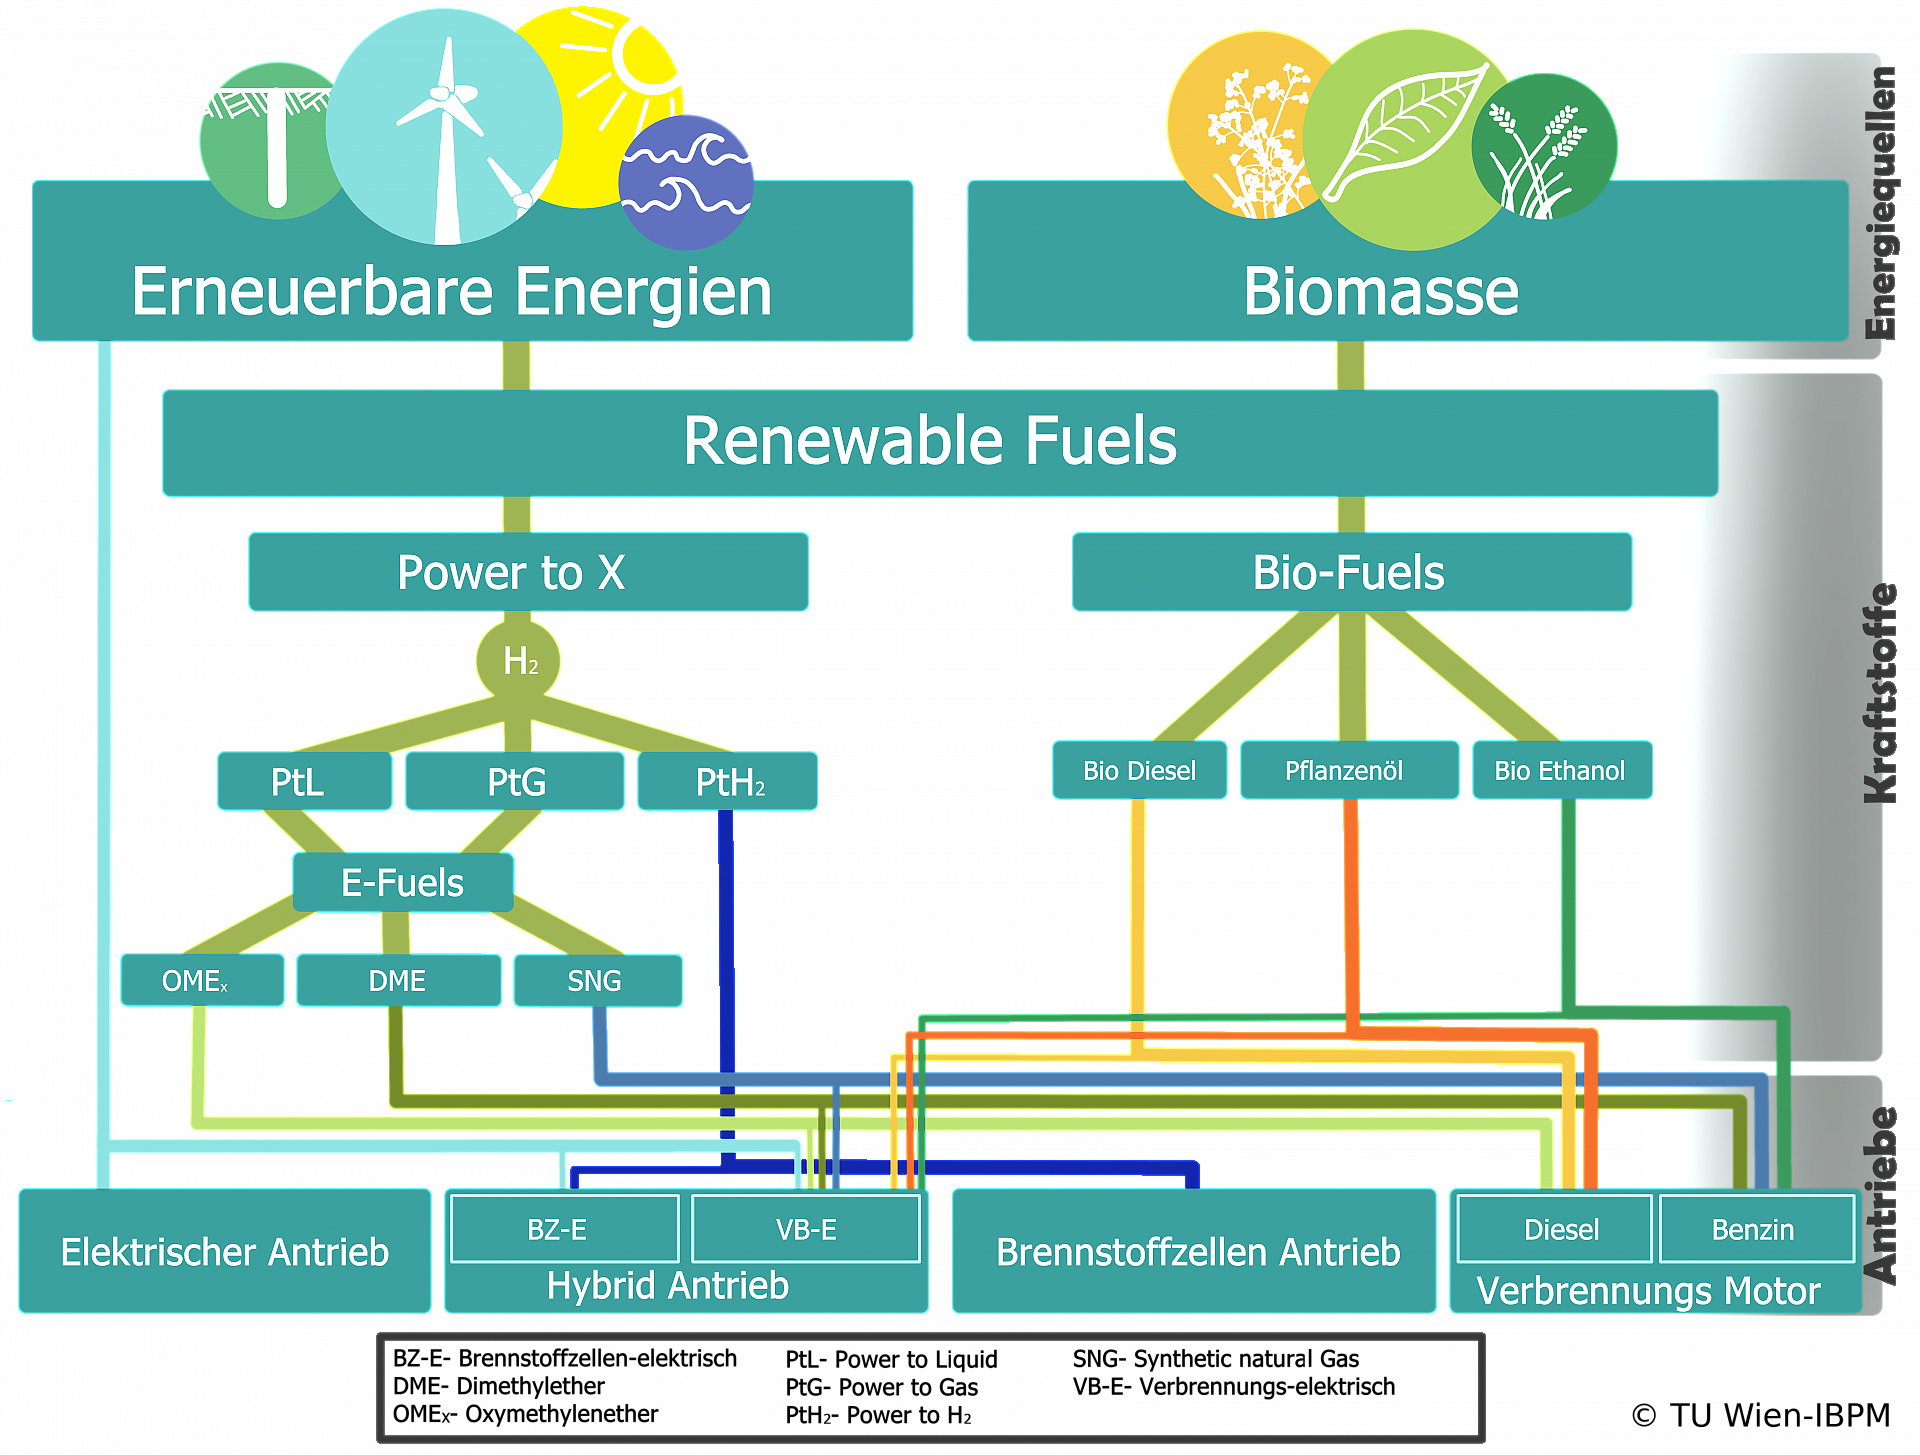
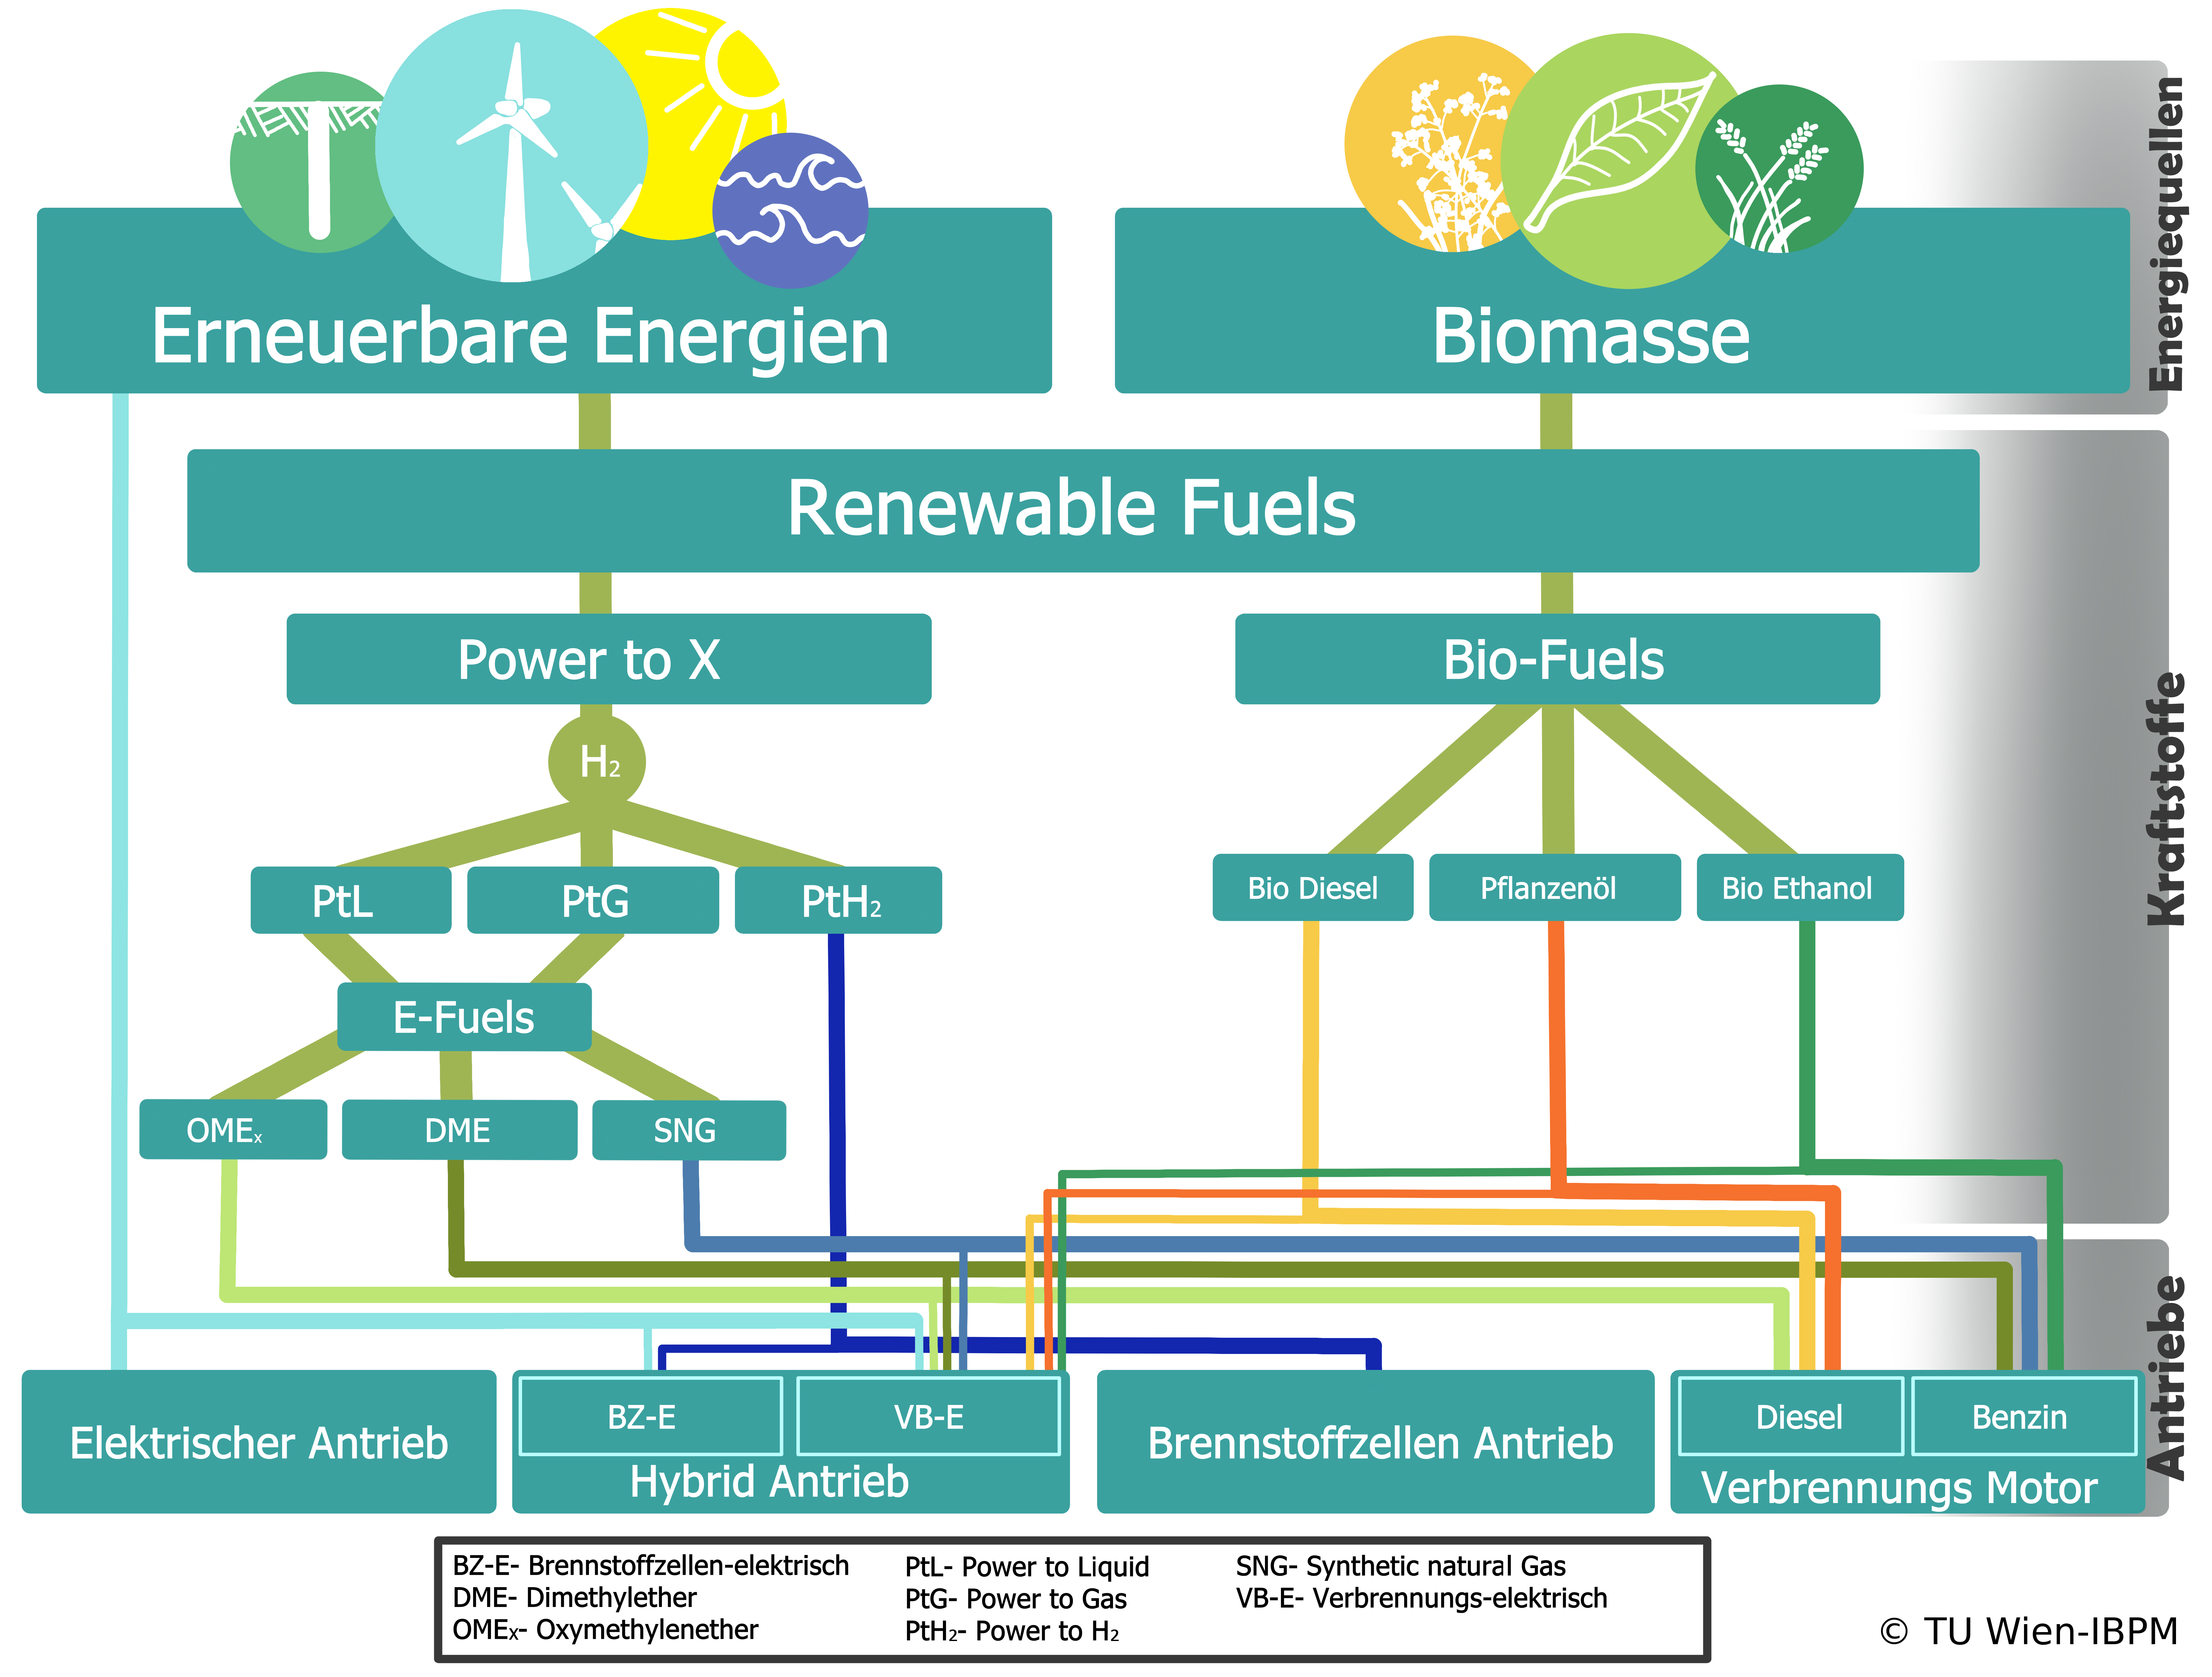
Overview of drive forms for light equipment
Overview of drive forms for light equipment Emissions caused by building machines can be reduced by CO2-neutral drive systems or renewable fuels. The energy source for obtaining or producing renewable fuels can come from (natural) renewable energy sources, for example by generating electricity from wind, solar radiation or hydropower, or can be obtained directly from biomass. These biomass-derived bio-fuels power internal combustion engines. Some of them can be used directly in conventional combustion engines - in this case, diesel engines. Others, for example ethanol, require a dedicated or modified engine. The CO2 savings for bio-fuels range from 80 to 90% in the literature. Sustainably generated electricity can be used to power vehicles or machines with electric drives, either directly via cables or with rechargeable batteries. The other renewable fuel option is hydrocarbons or hydrogen (H2) produced with electrical energy. These processes are grouped under "Power to X". Translated with www.DeepL.com/Translator (free version)
Copyright: TU Wien-IBPM, RMA
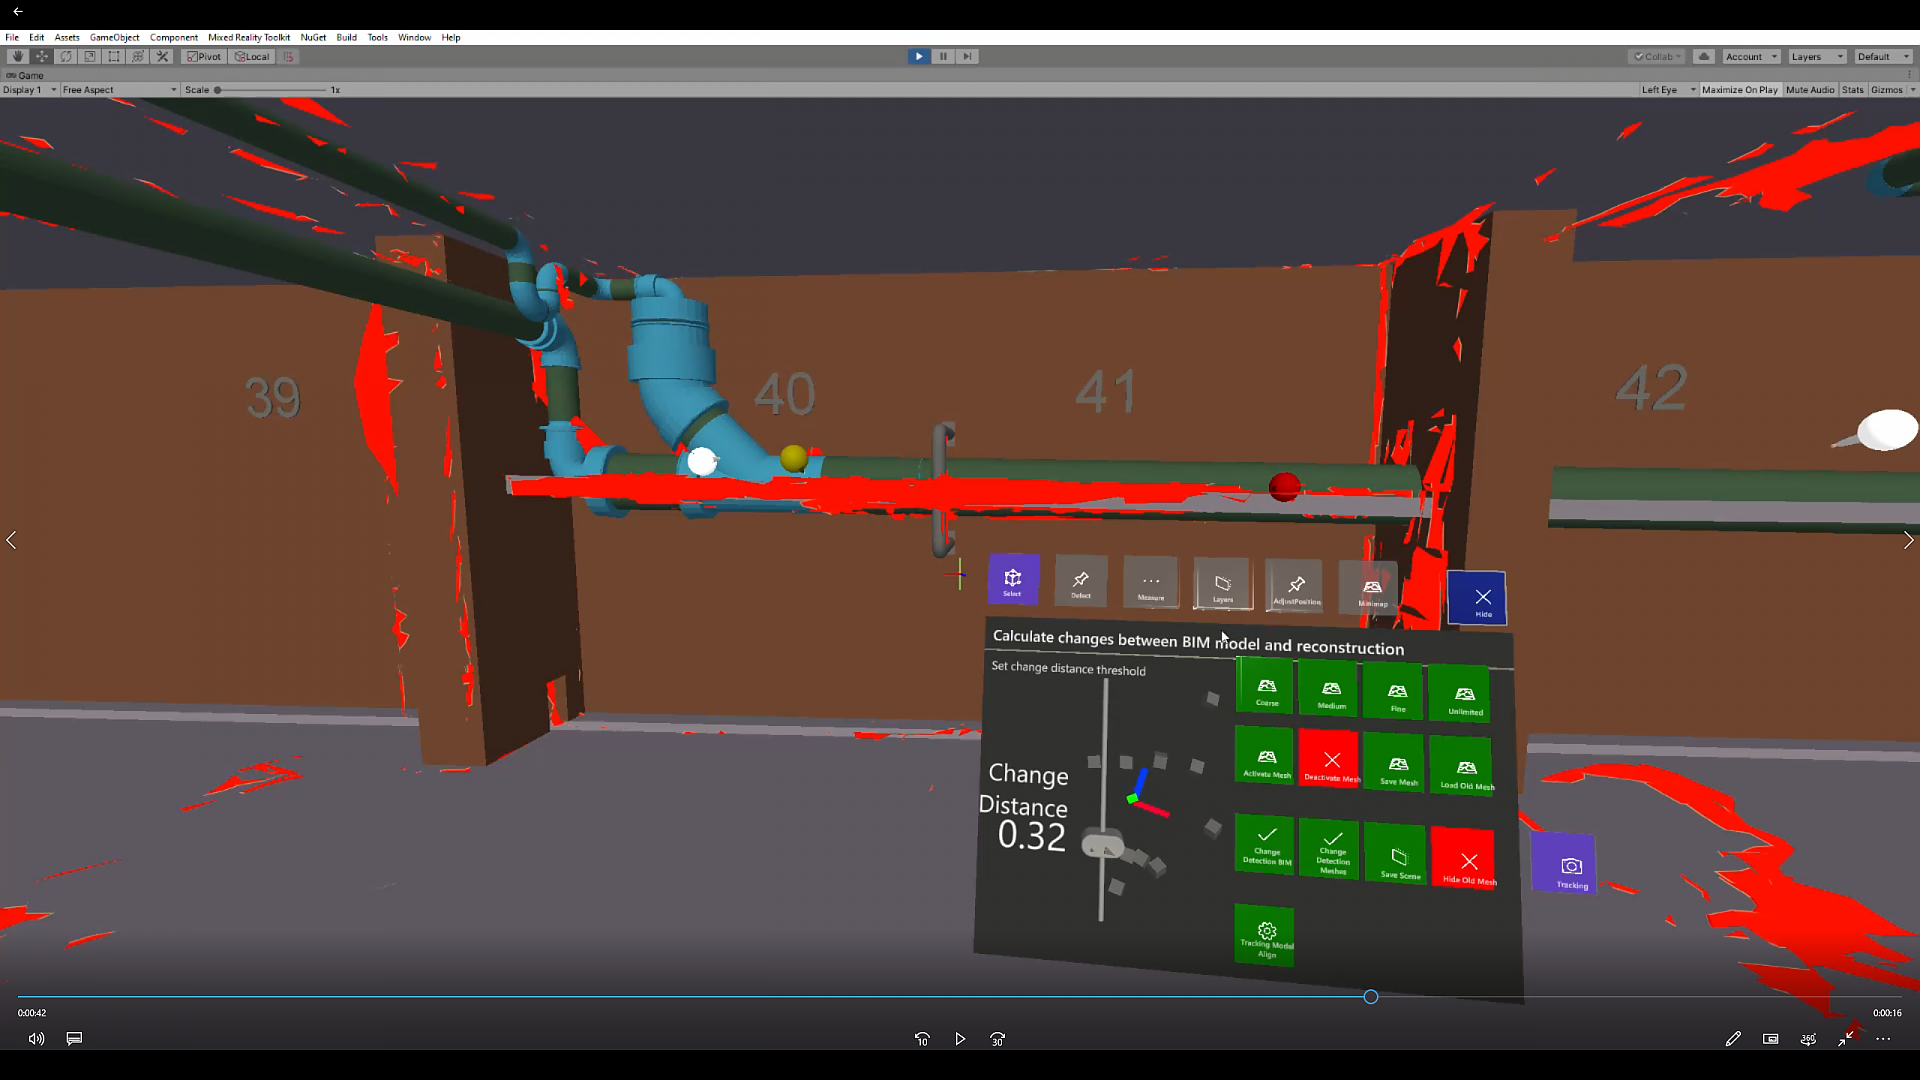
Change Detection
The images graphically show the deviations between the BIM model and reality.
Copyright: Schönauer
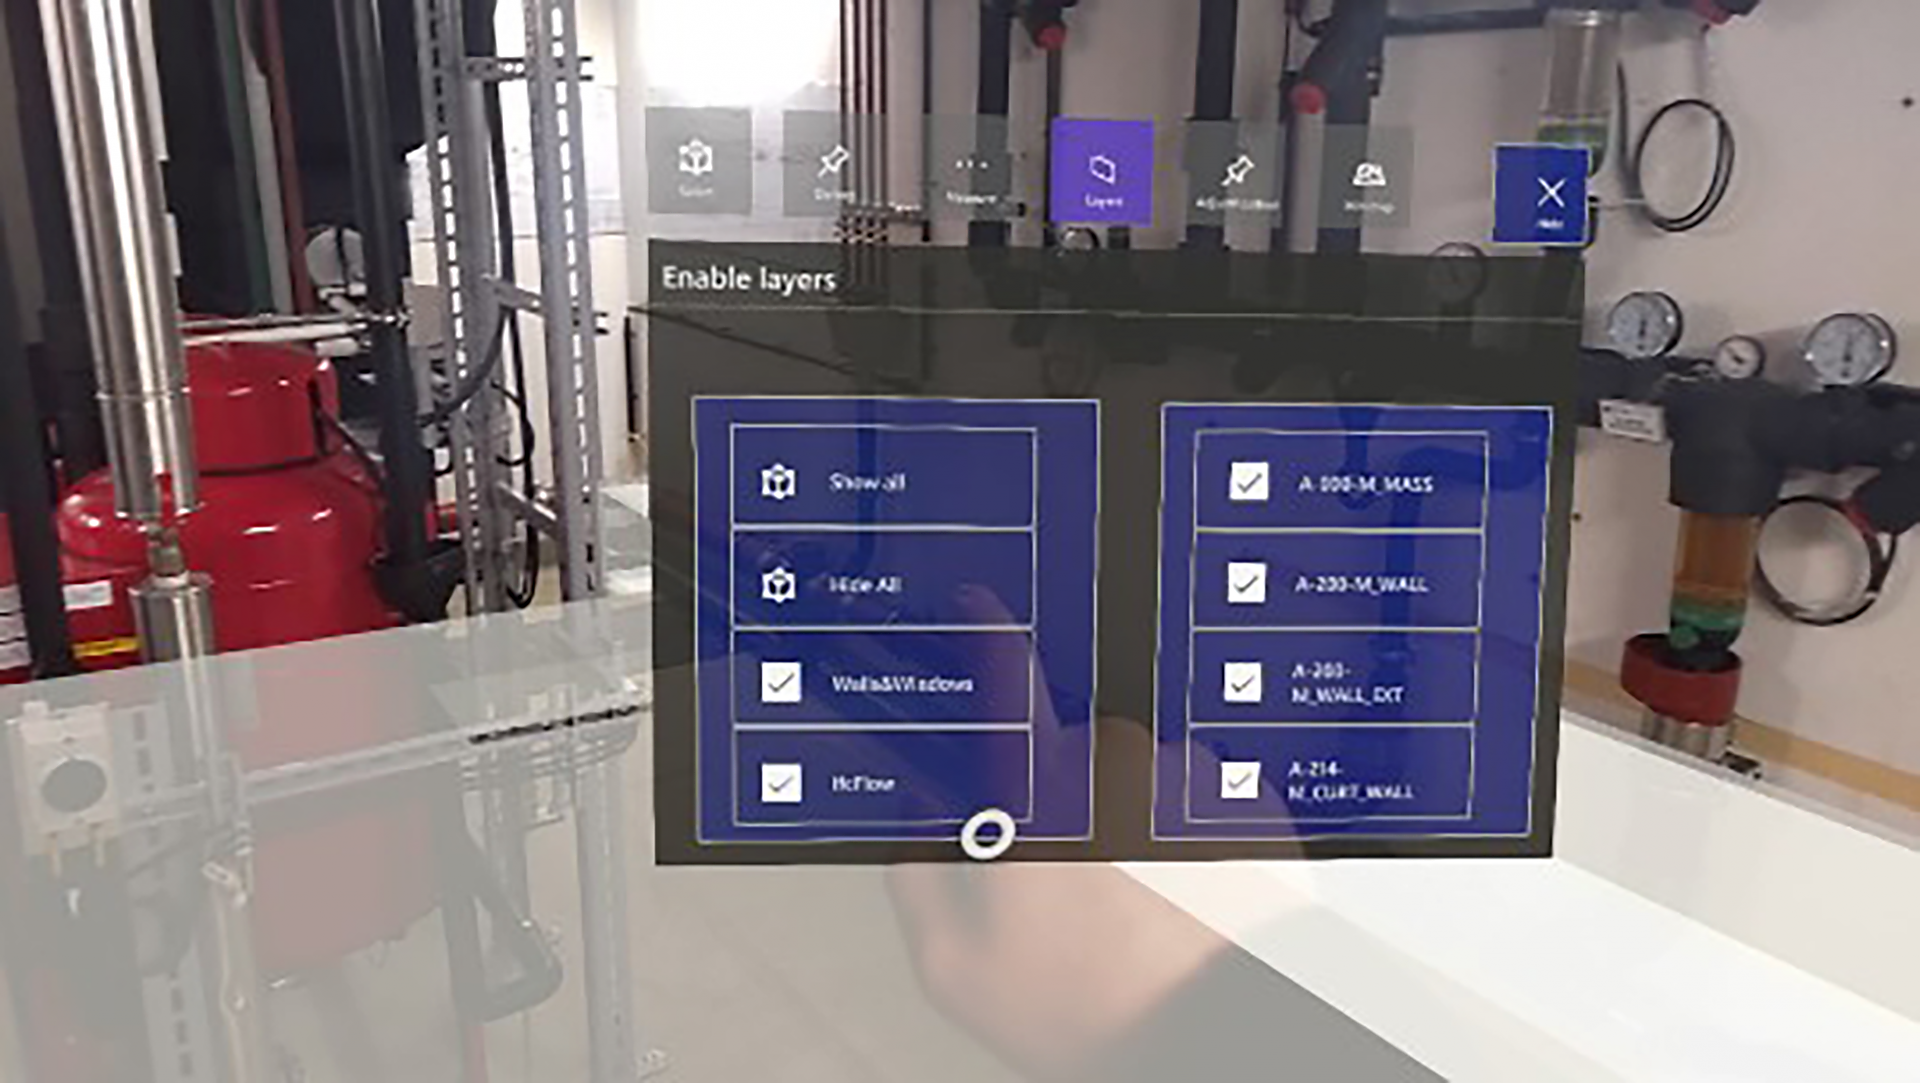
Interaction menu
The figure shows the interaction menu of the AR inspection tool.
Copyright: Urban
Remote-Expert-System
The figure shows the user interface of the remote expert system.
Copyright: Urban
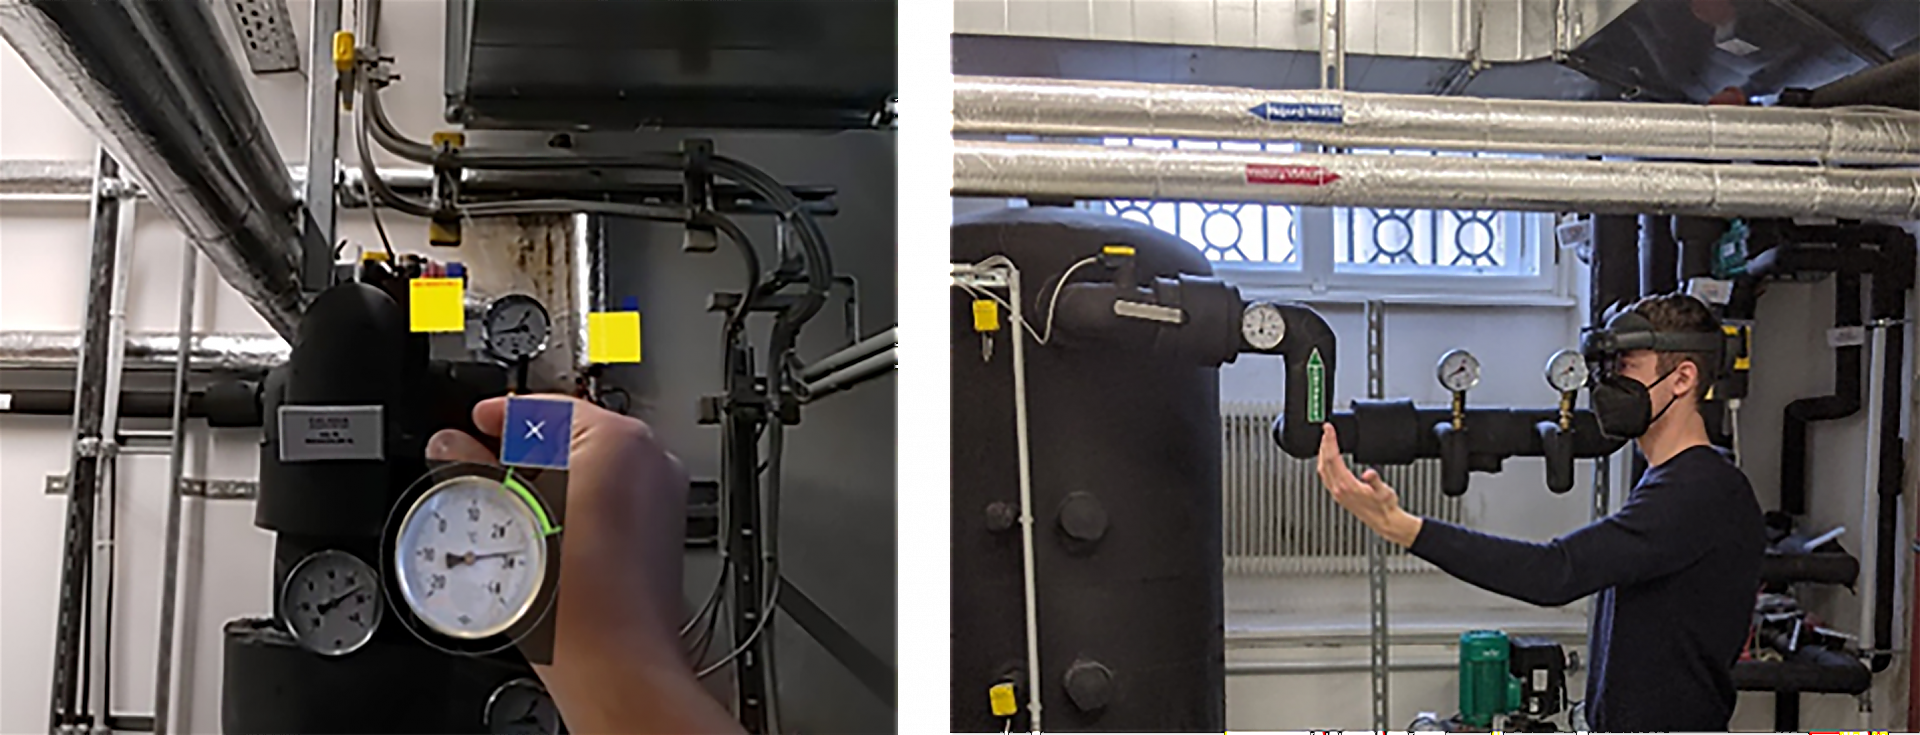
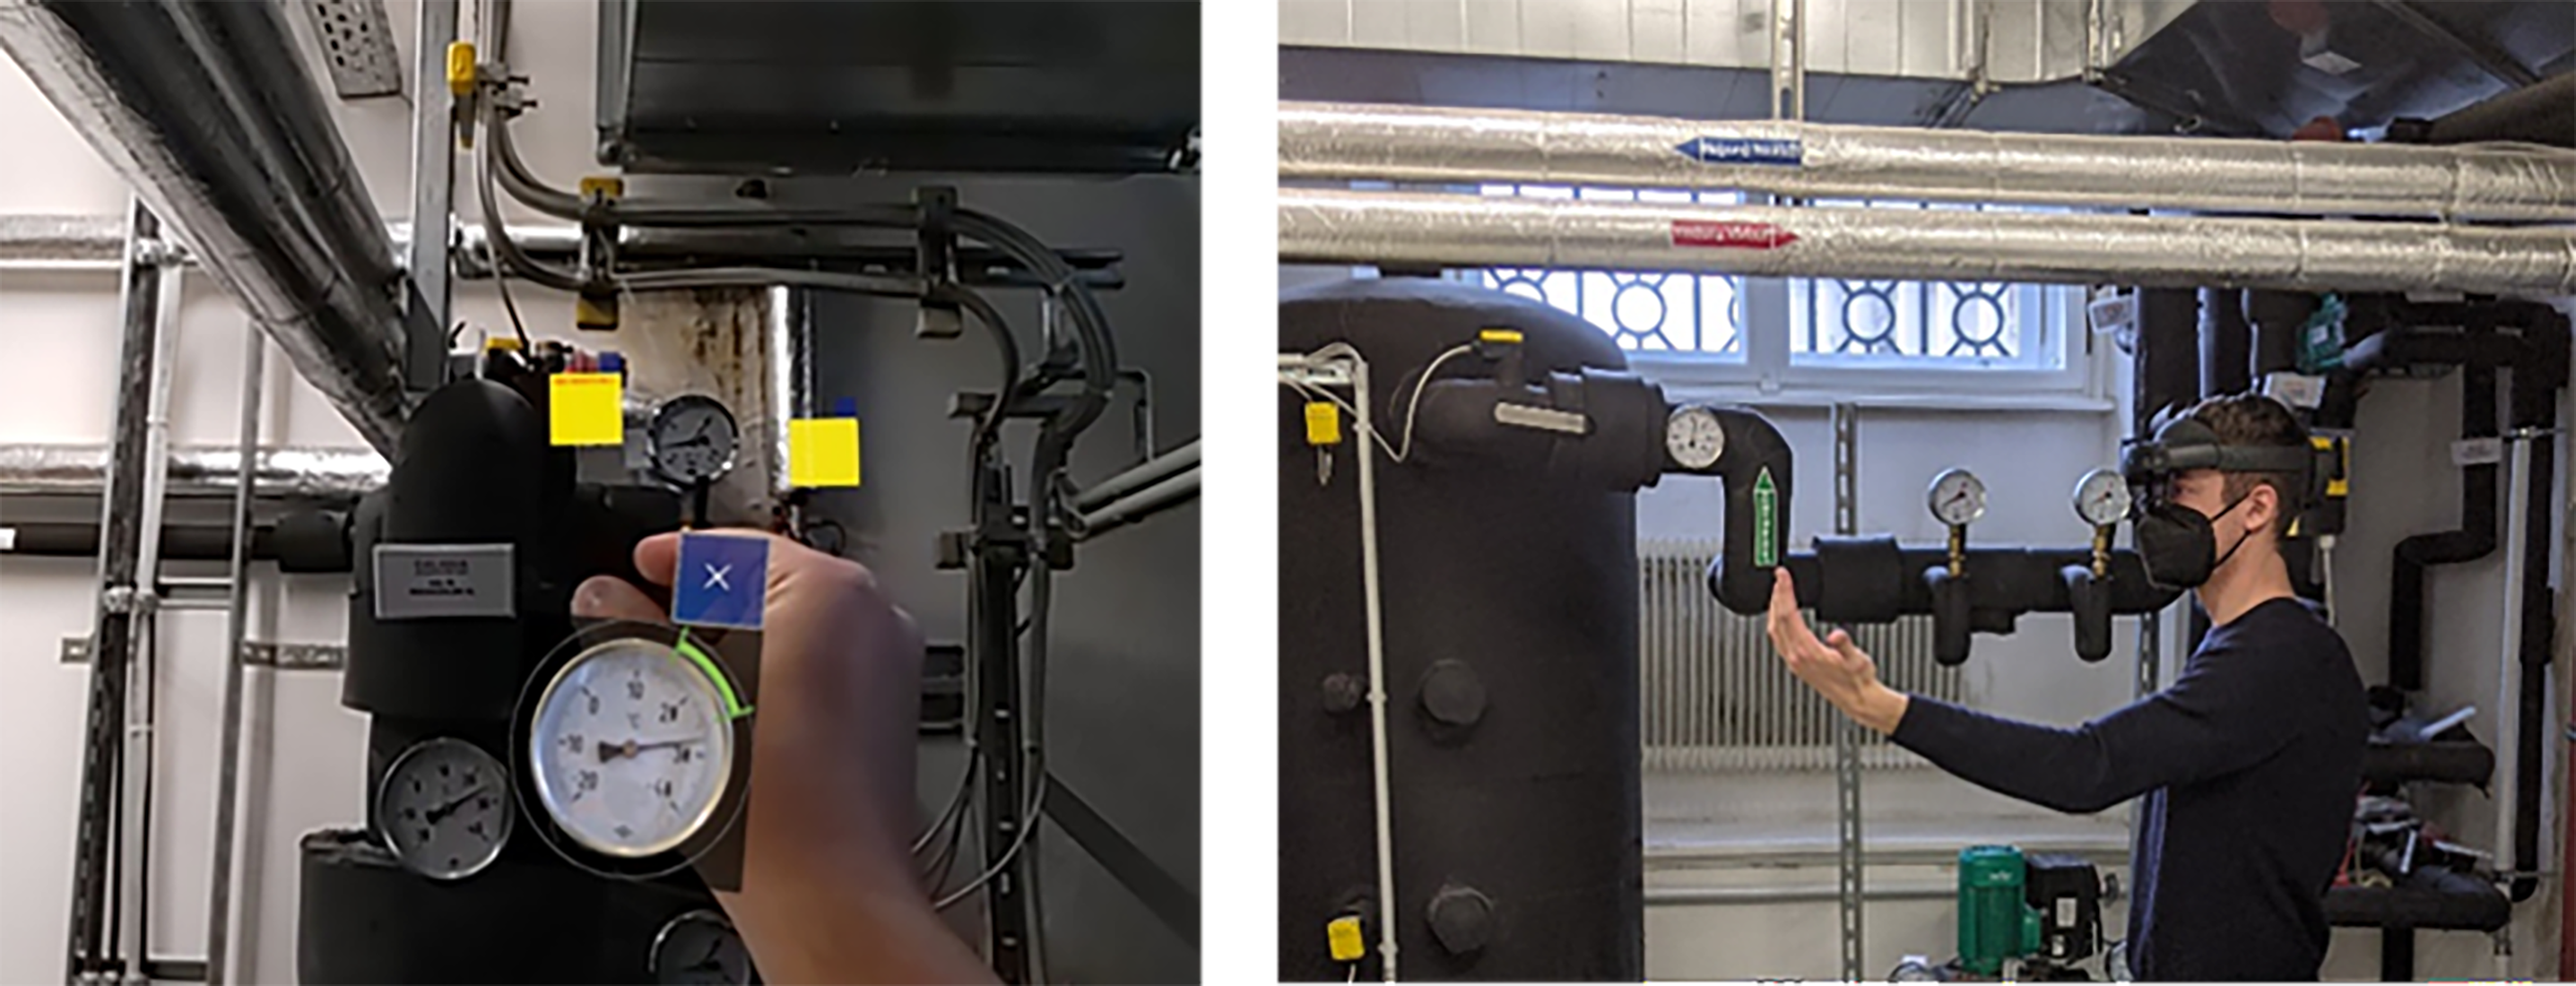
Overlay of the TGA model
The figure shows the superimposition of the AR model with reality from the perspective of the AR user.
Copyright: Urban
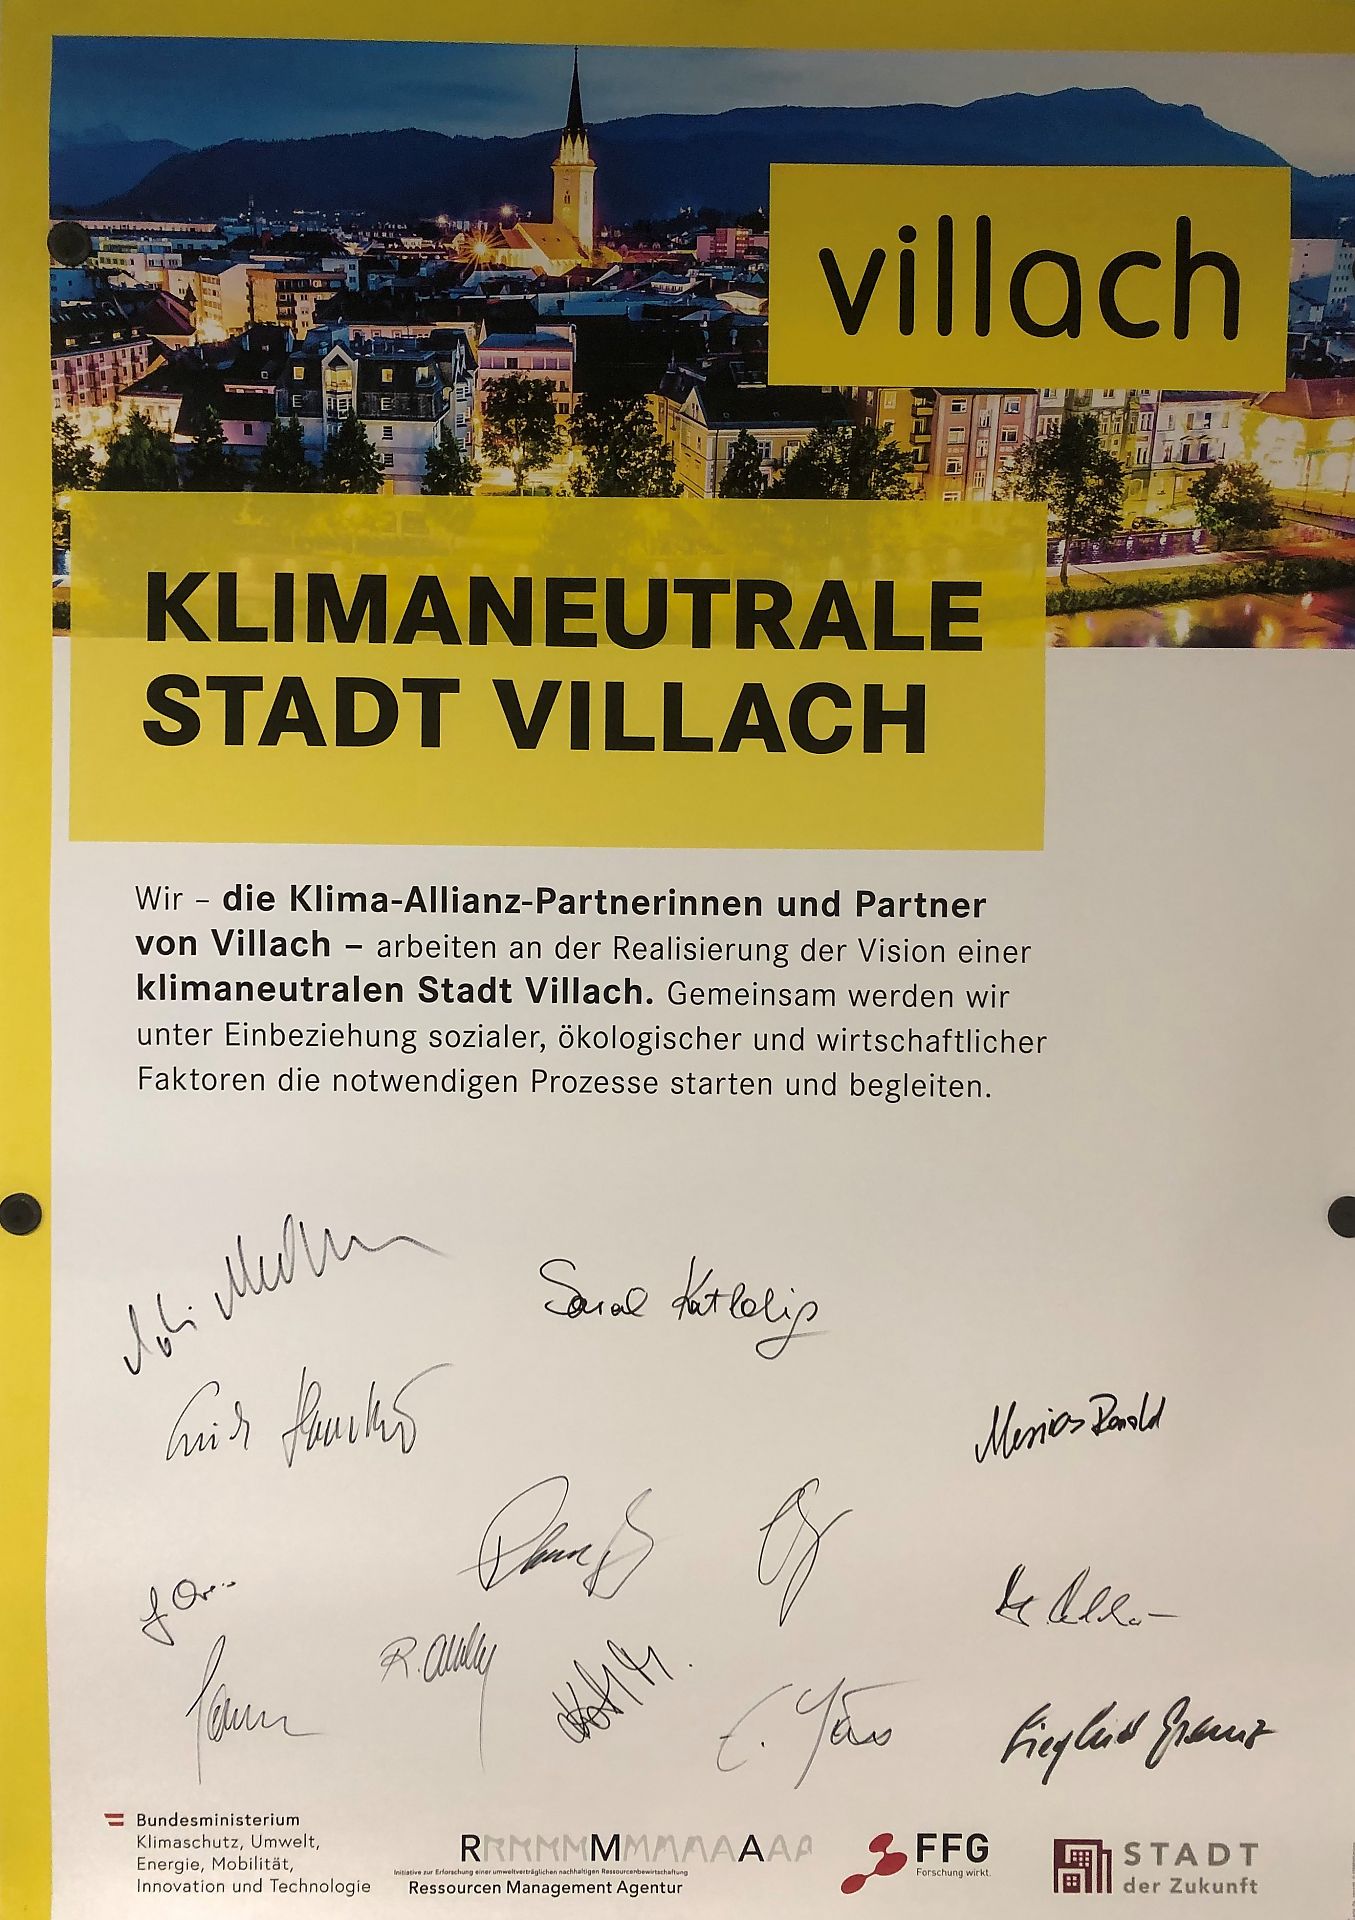
The Villach Climate Alliance
Climate-neutral city of Villach: "We - the Climate Alliance partners - are working on realizing the vision of a climate-neutral city of Villach. Together we will start and accompany the necessary processes, taking into account social, ecological and economic factors." This was signed by 14 partners during the vilFIT closing event.
Copyright: Stadt Villach, RMA
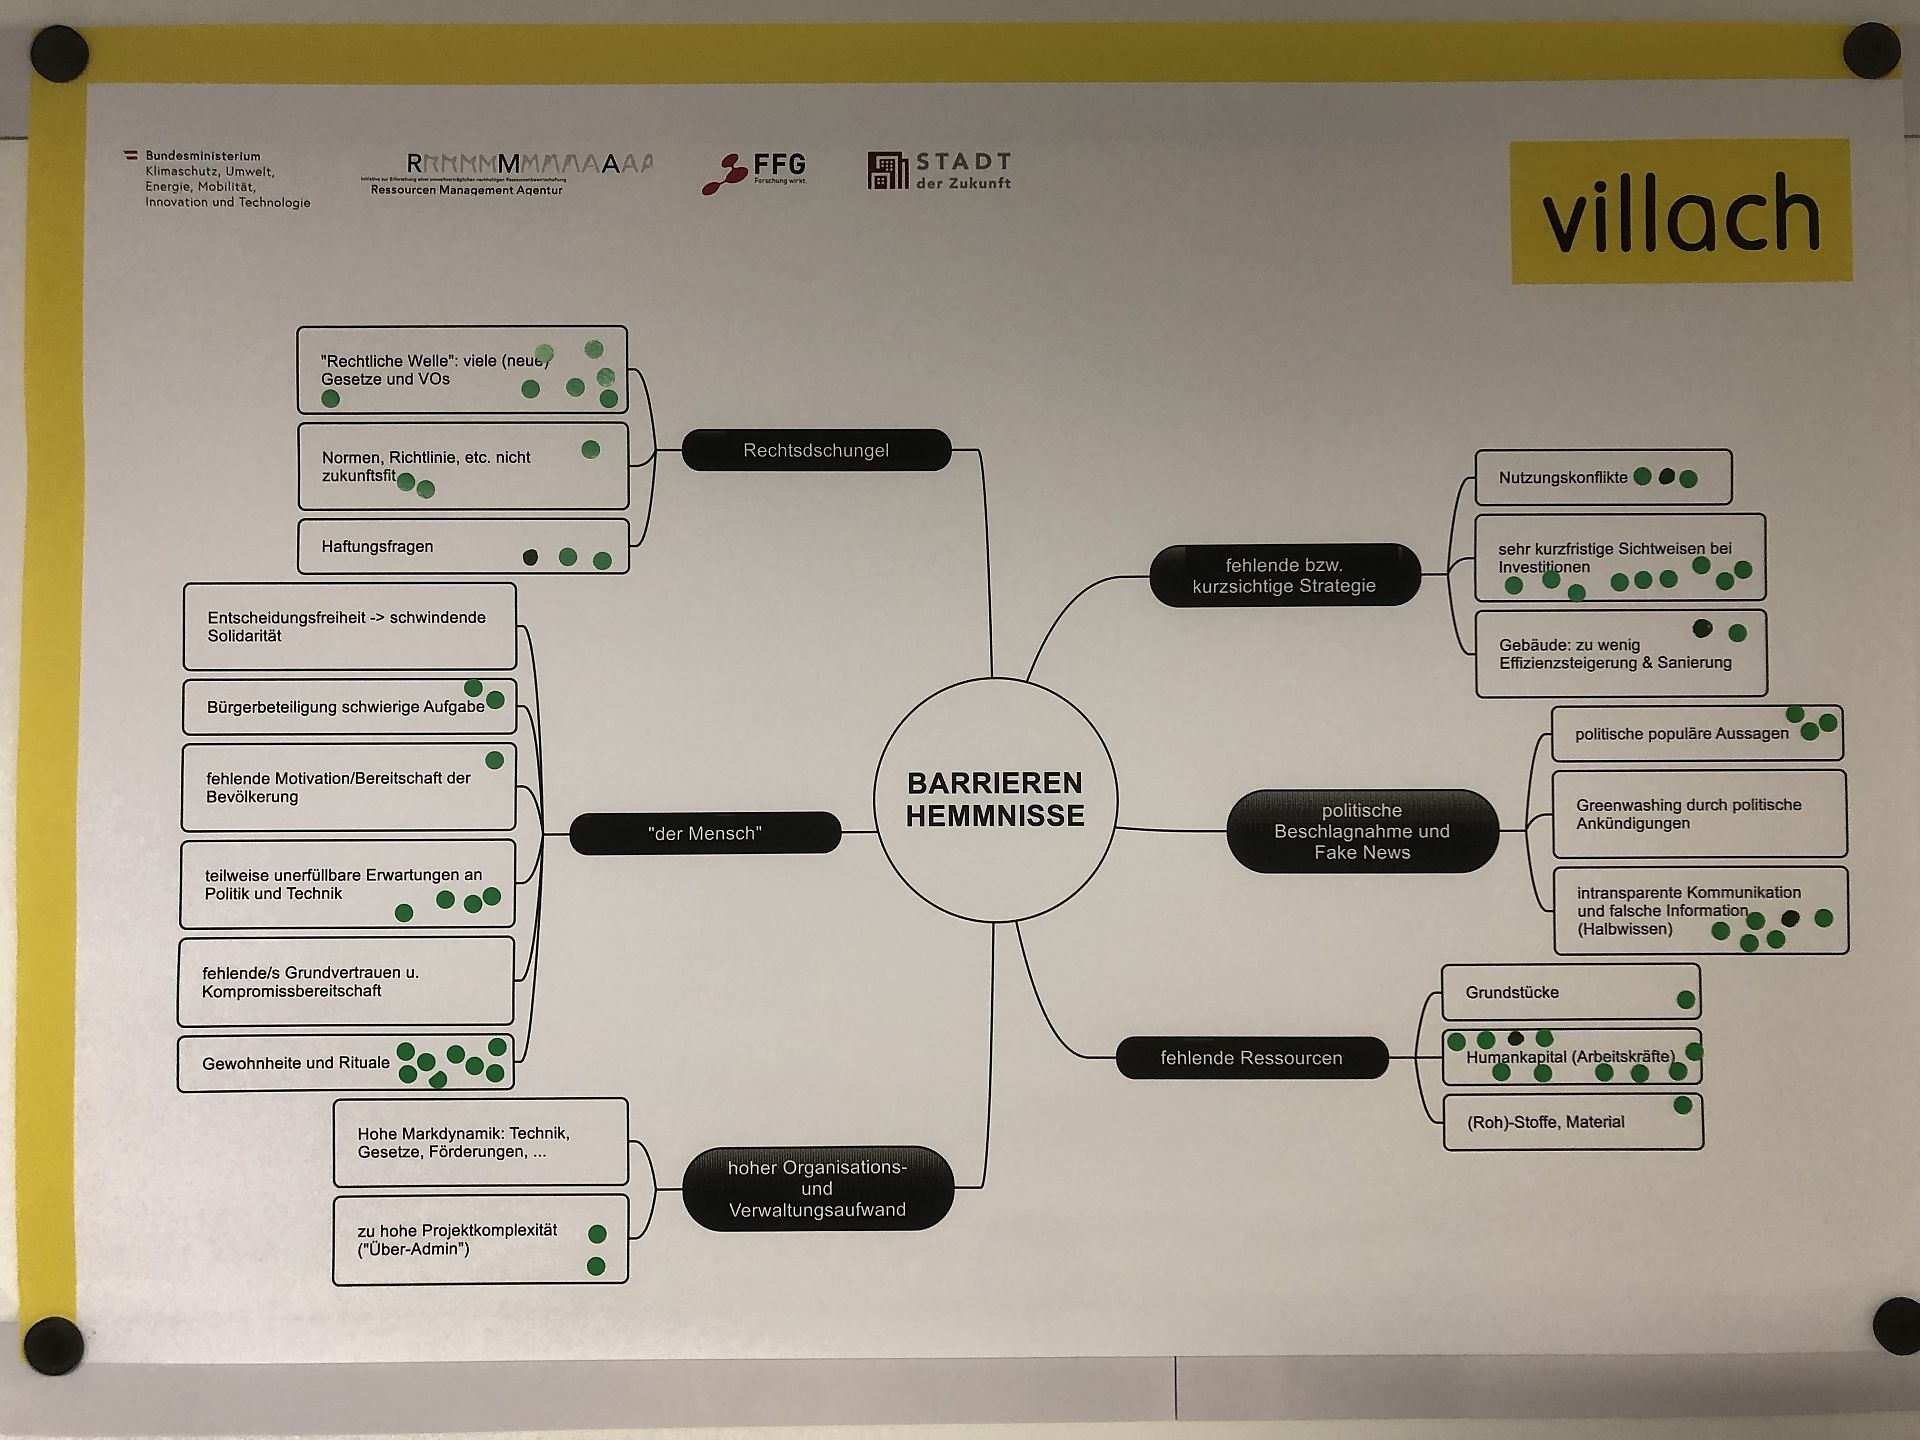
mindmap barriers/obstacles
The contributions of the participants on the topics "framework conditions", "barriers/obstacles", "opportunities" and "measures" collected in the kick-off meetings were clustered by the project team and processed in mindmaps. These mindmaps were finally used by the Climate Alliance partners at the final event to prioritize the individual contributions.
Copyright: Stadt Villach, RMA

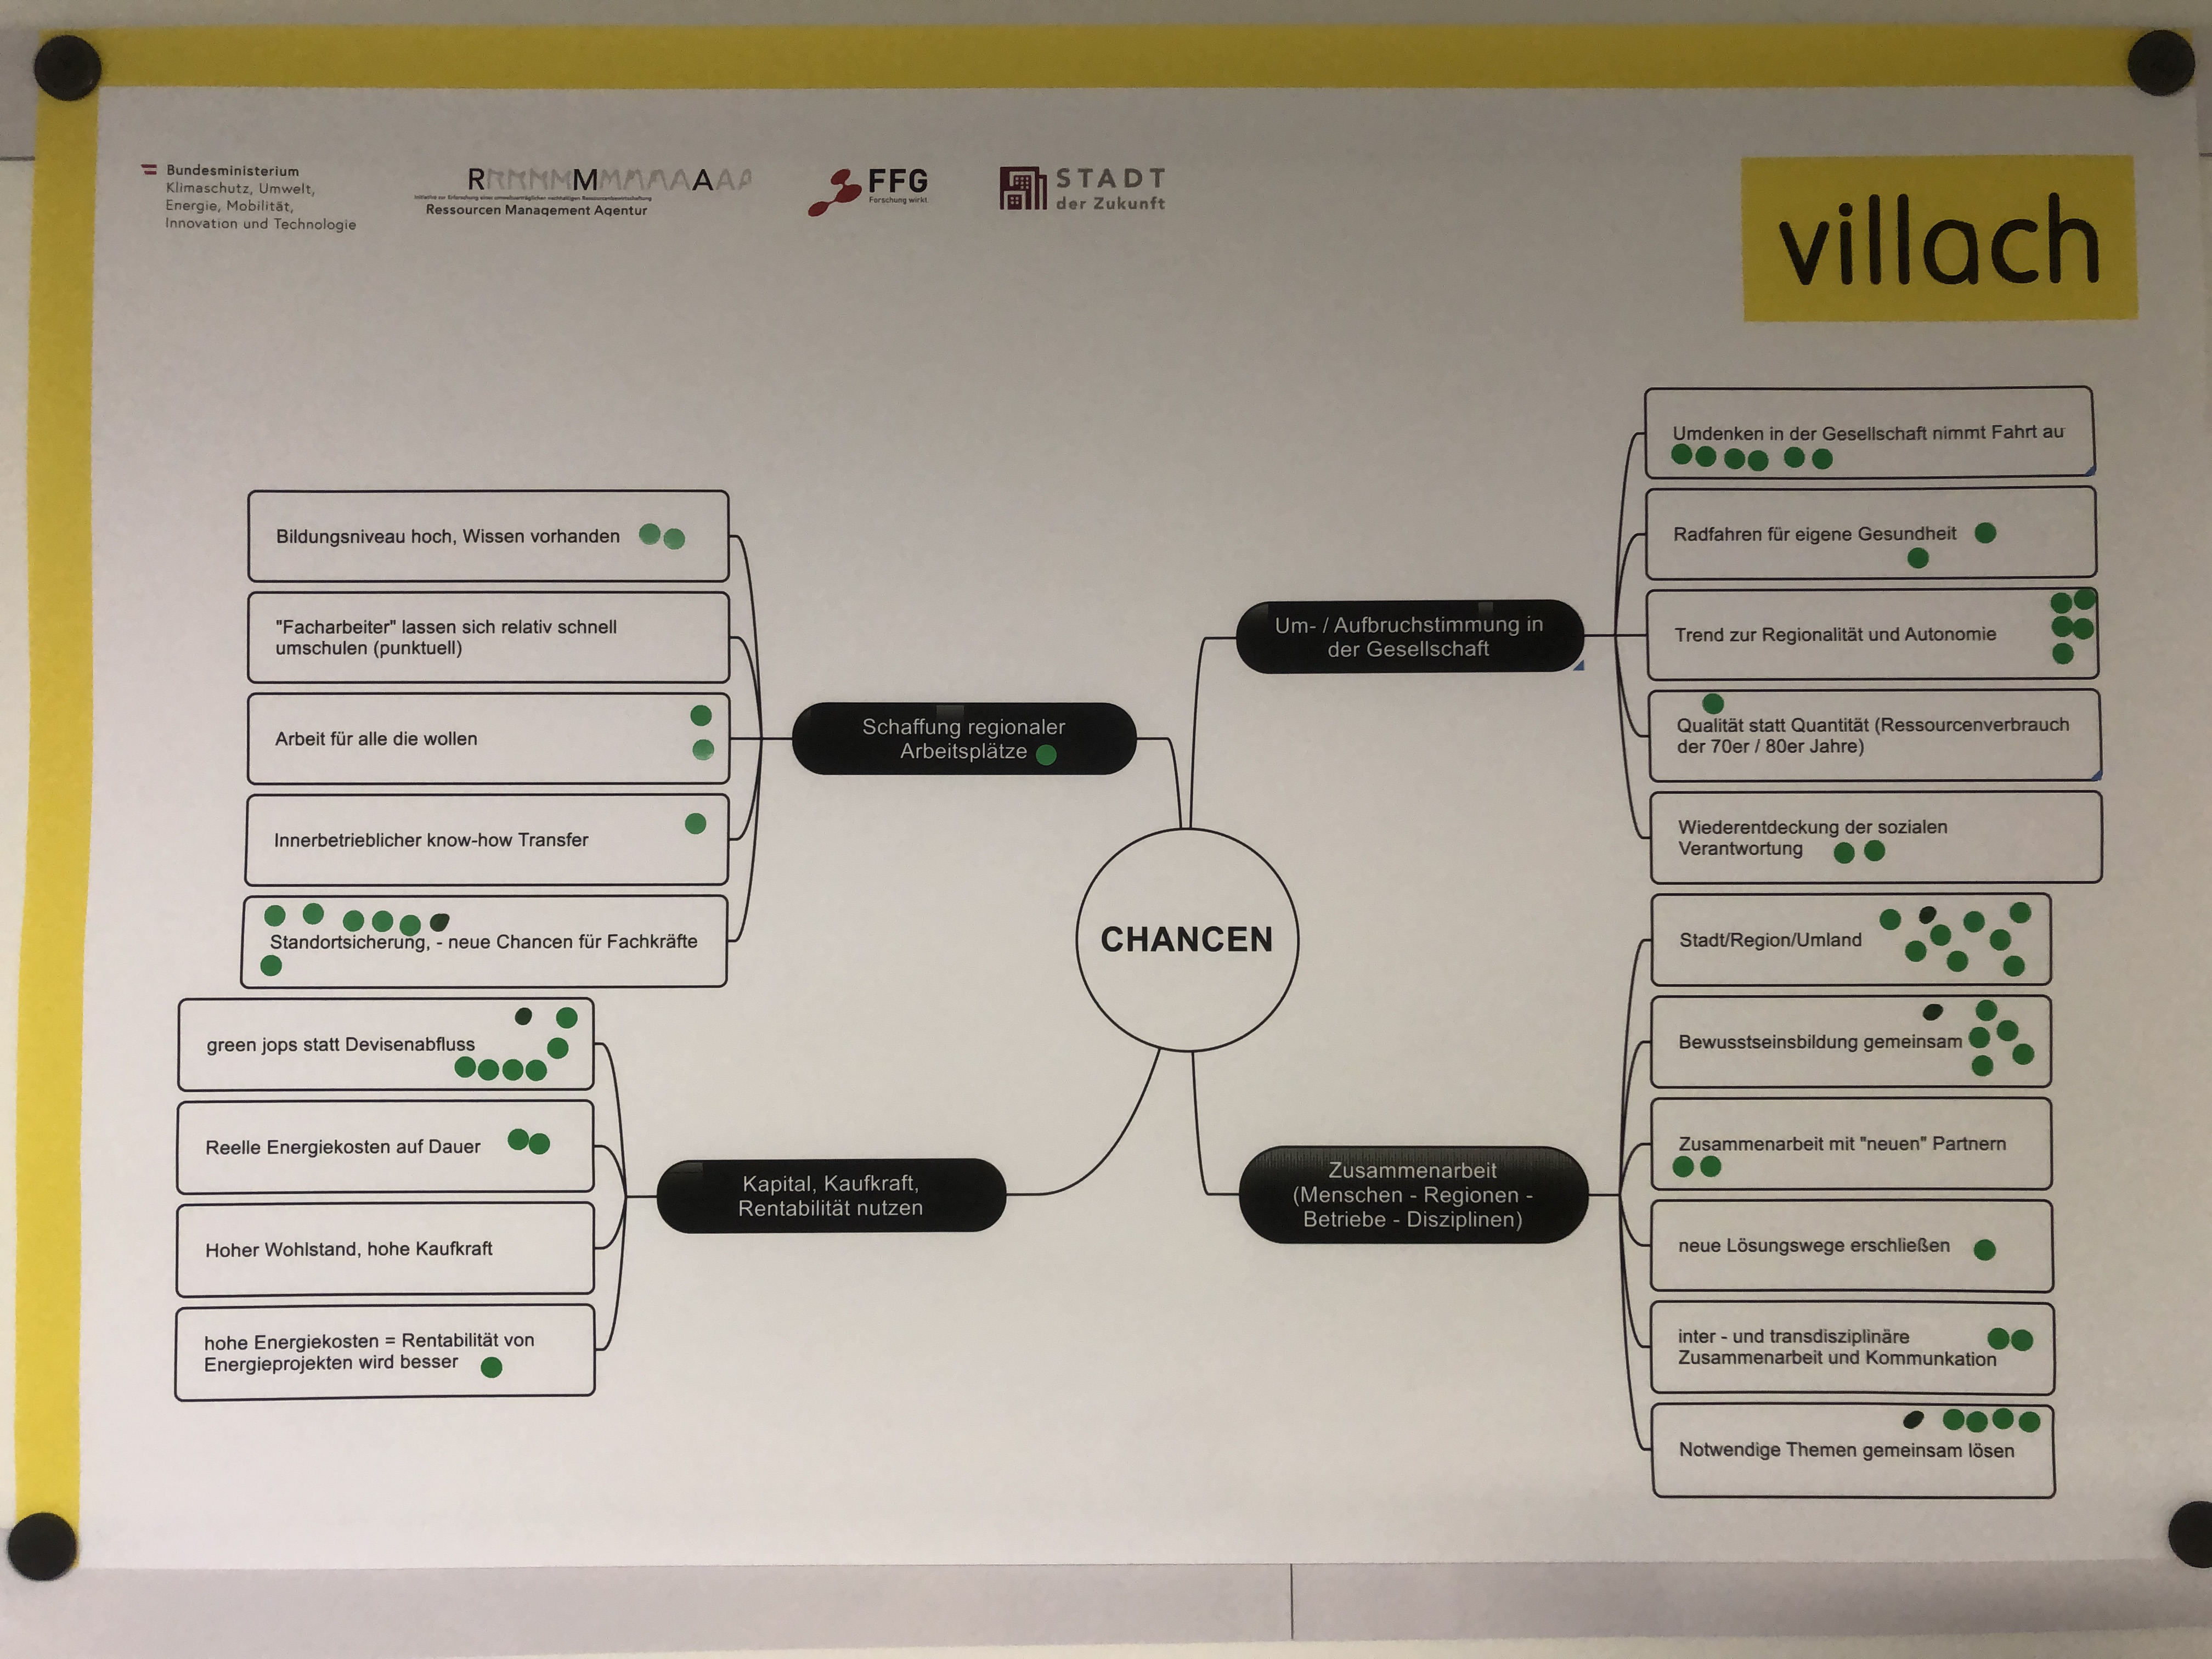
mindmap opportunities
The contributions of the participants on the topics "framework conditions", "barriers/obstacles", "opportunities" and "measures" collected in the kick-off meetings were clustered by the project team and processed in mindmaps. These mindmaps were finally used by the Climate Alliance partners at the final event to prioritize the individual contributions.
Copyright: Stadt Villach, RMA

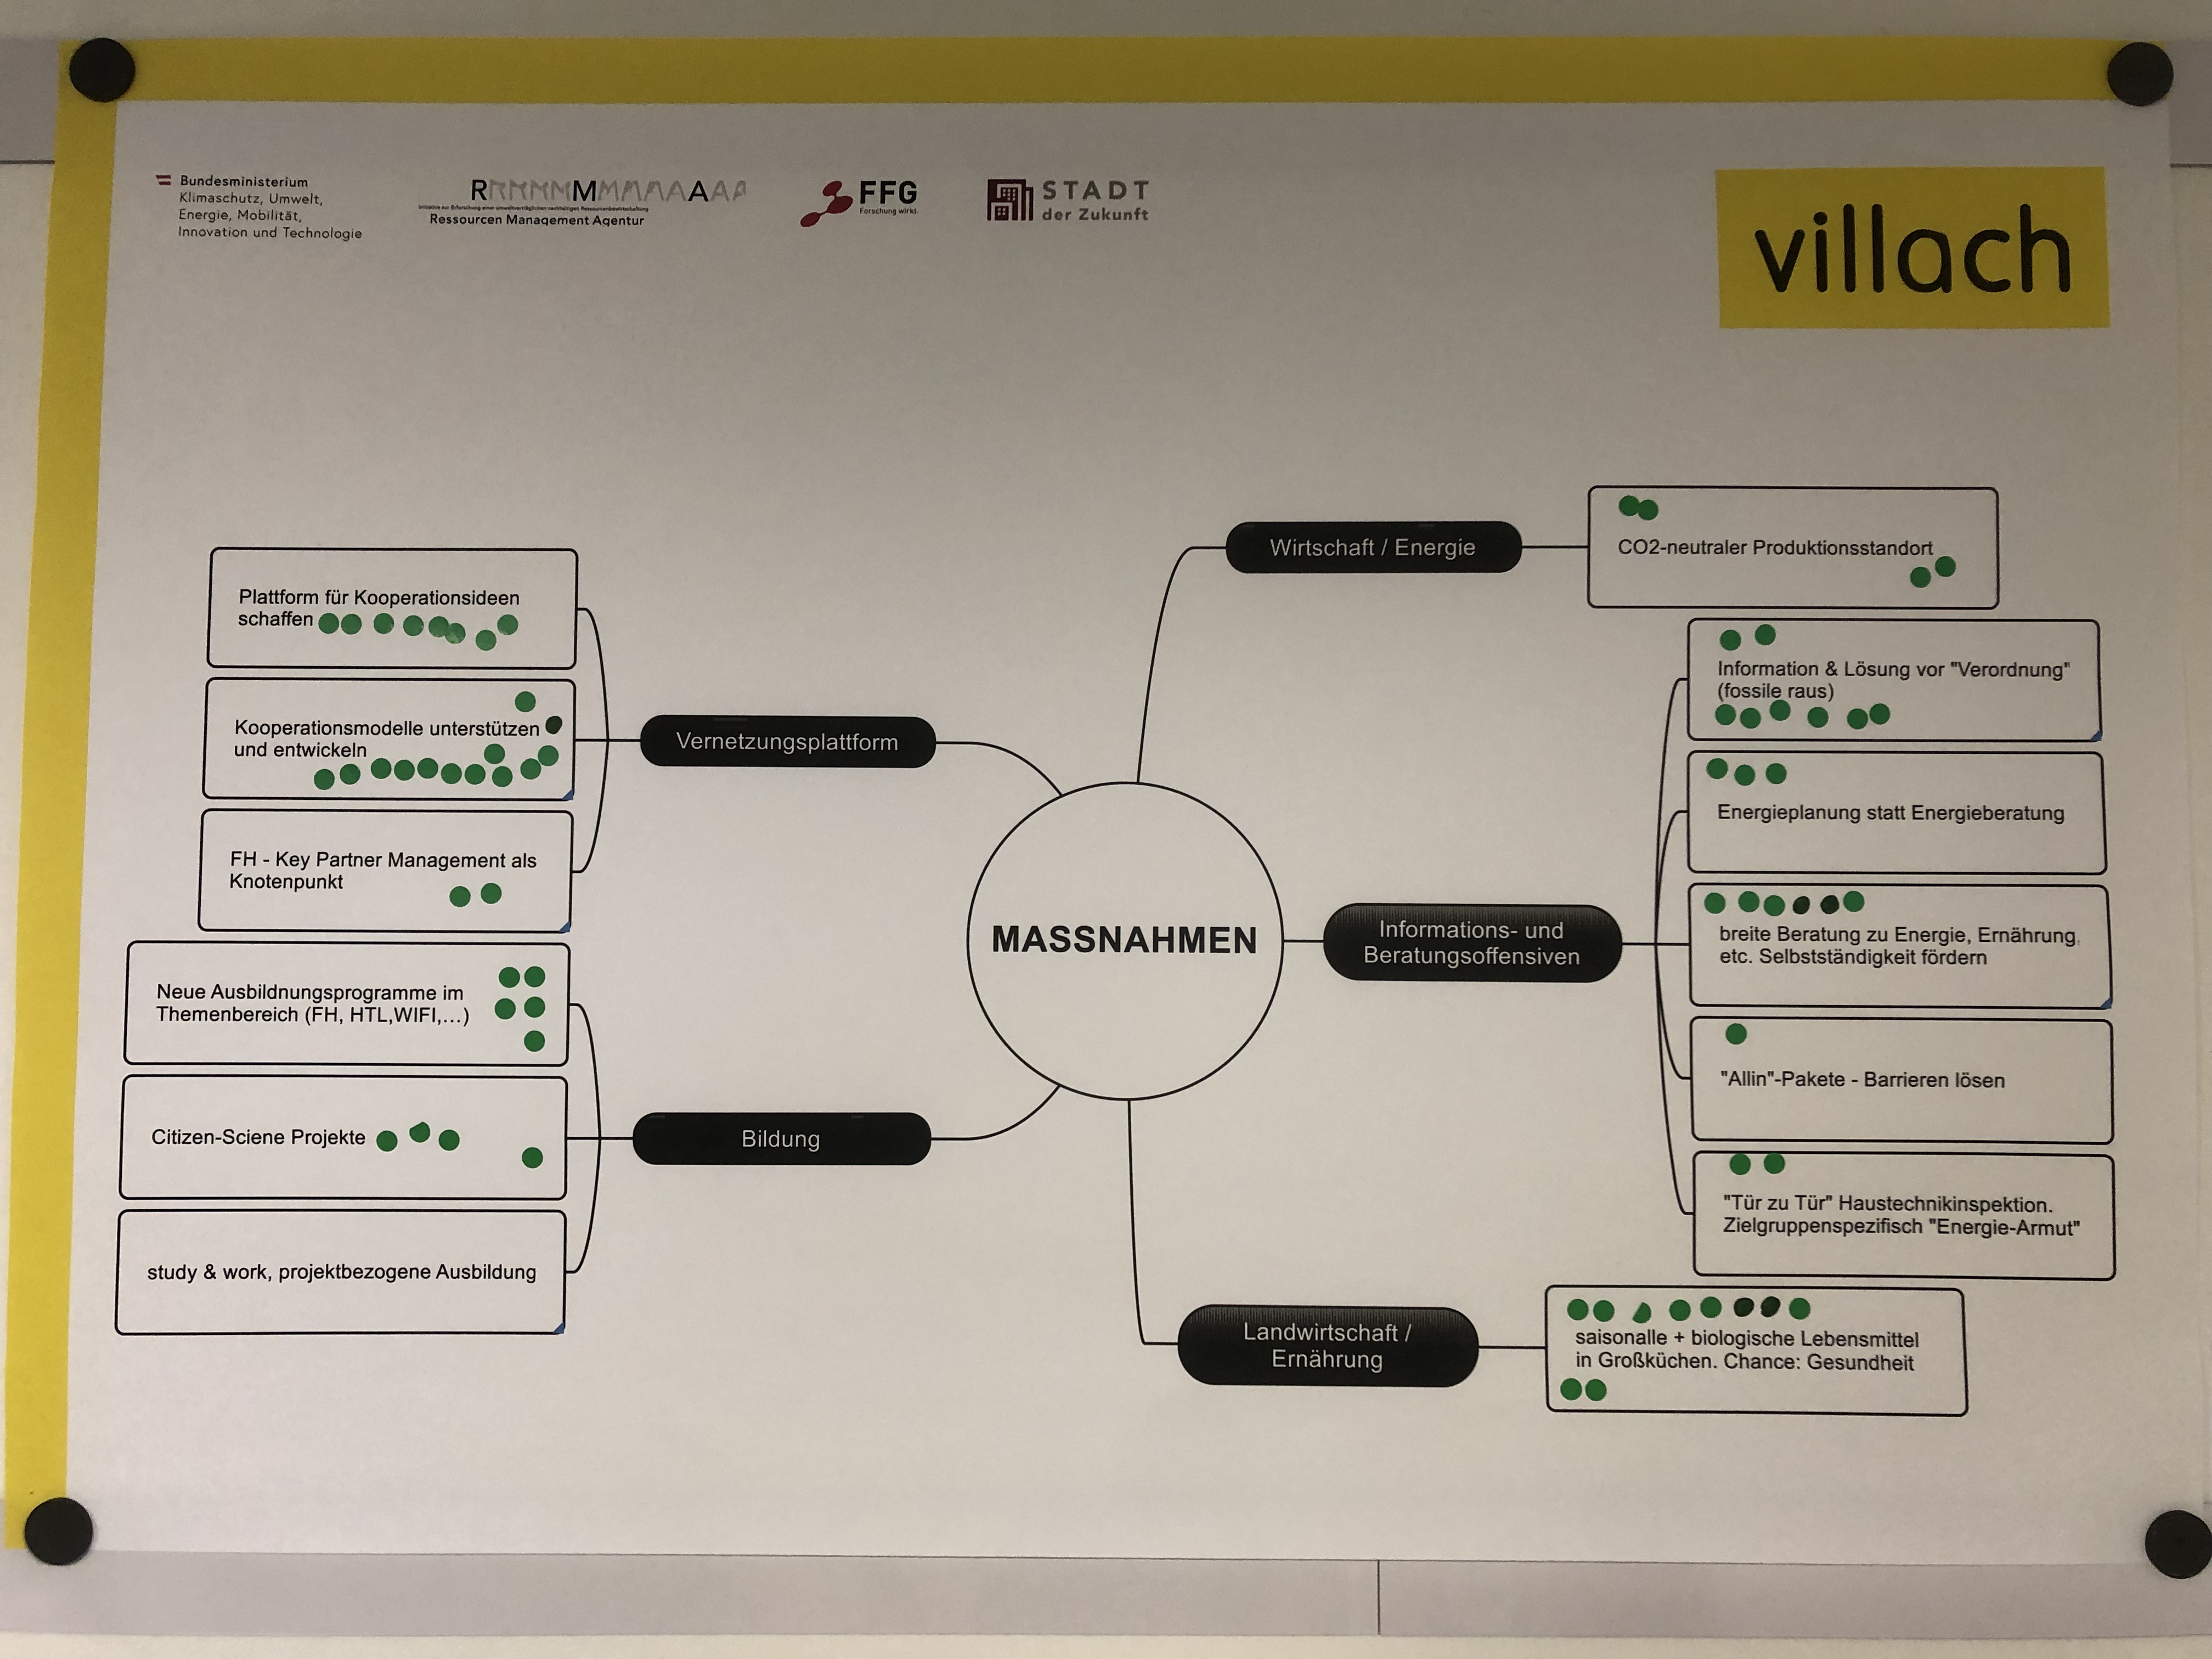
mindmap measures
The contributions of the participants on the topics "framework conditions", "barriers/obstacles", "opportunities" and "measures" collected in the kick-off meetings were clustered by the project team and processed in mindmaps. These mindmaps were finally used by the Climate Alliance partners at the final event to prioritize the individual contributions.
Copyright: Stadt Villach, RMA

Different Urban Densification Scenarios #1 - Use Case Area Triesterstraße/Graz
Different urban densification scenarios - based on natural lighting, view facotrs, and height limitations.
Copyright: Team EPIKUR (Abt. Bauphysik und Bauökologie, TU Wien | Pirstinger, Majcen, Raudaschl)
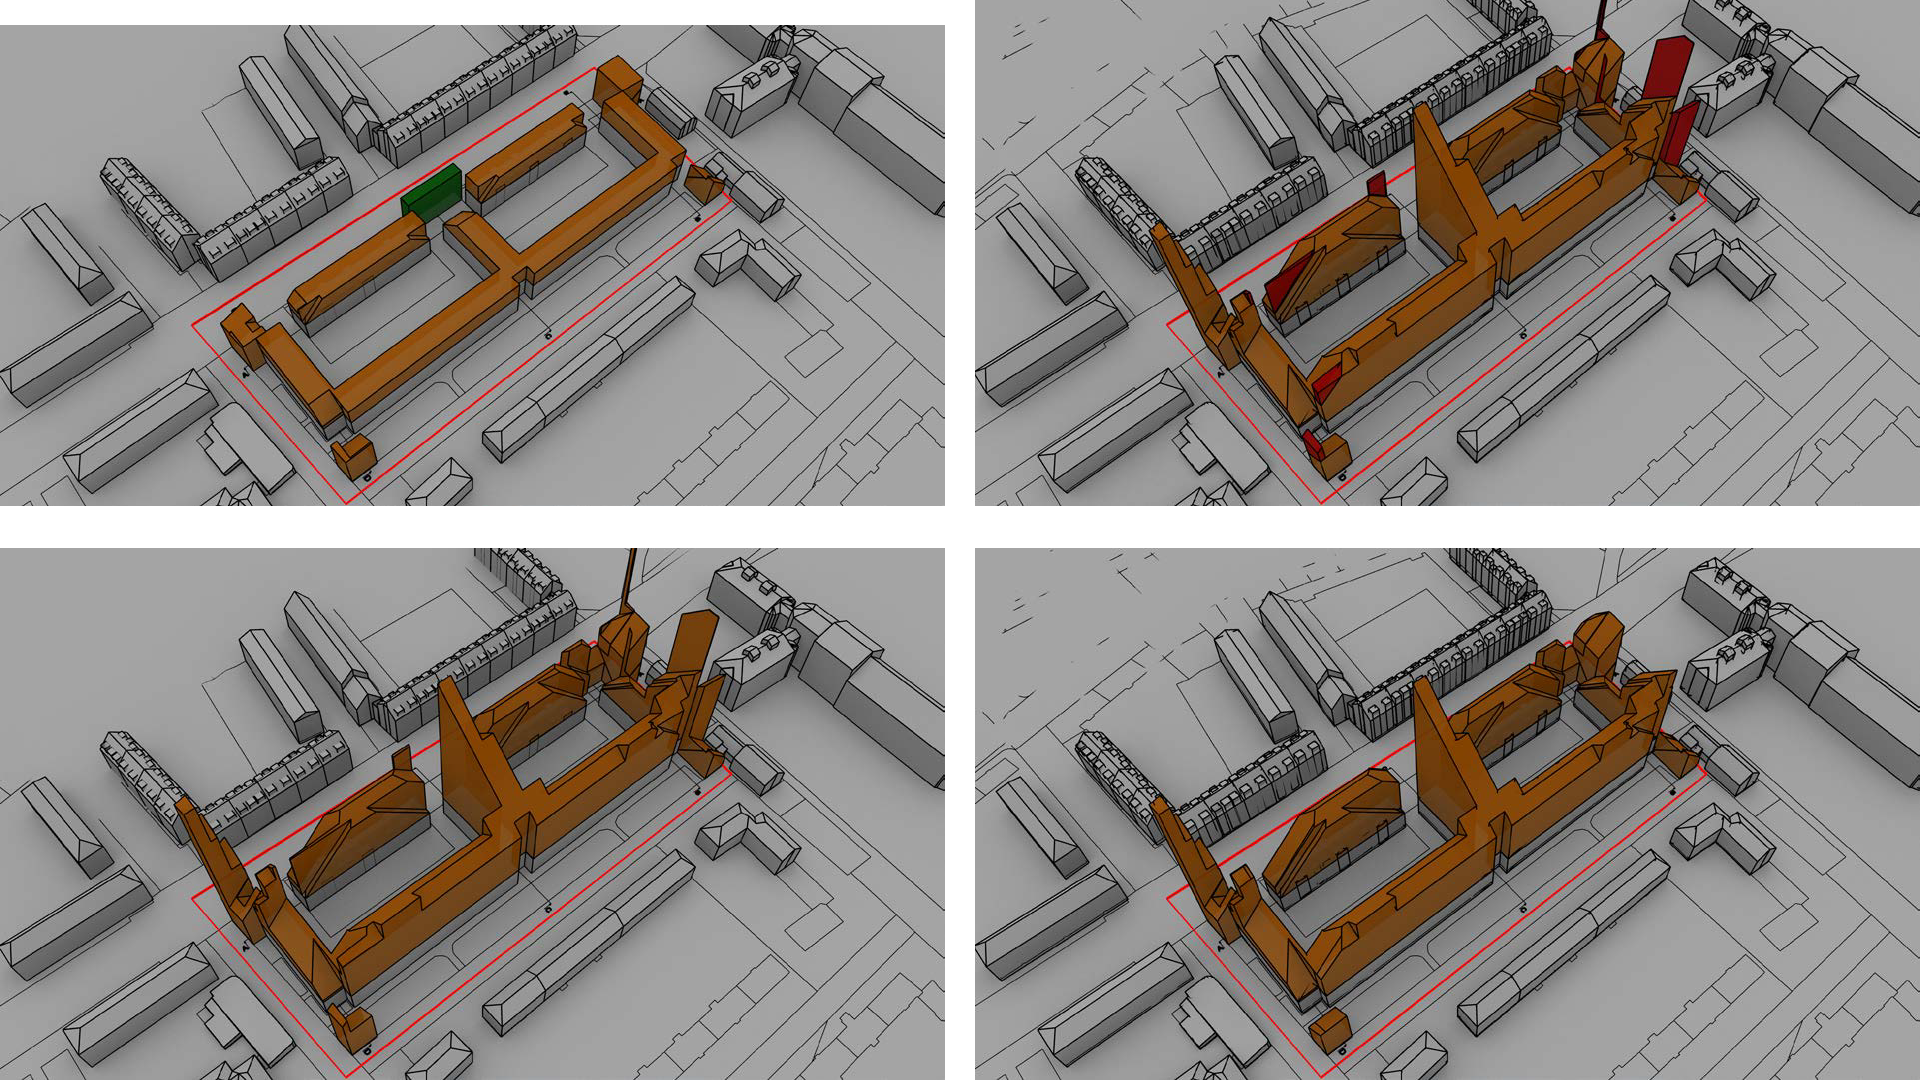
Different Urban Densification Scenarios #2 - Use Case Area Triesterstraße/Graz
Different urban densification scenarios - based on natural lighting, view facotrs, and height limitations.
Copyright: Team EPIKUR (Abt. Bauphysik und Bauökologie, TU Wien | Pirstinger, Majcen, Raudaschl)
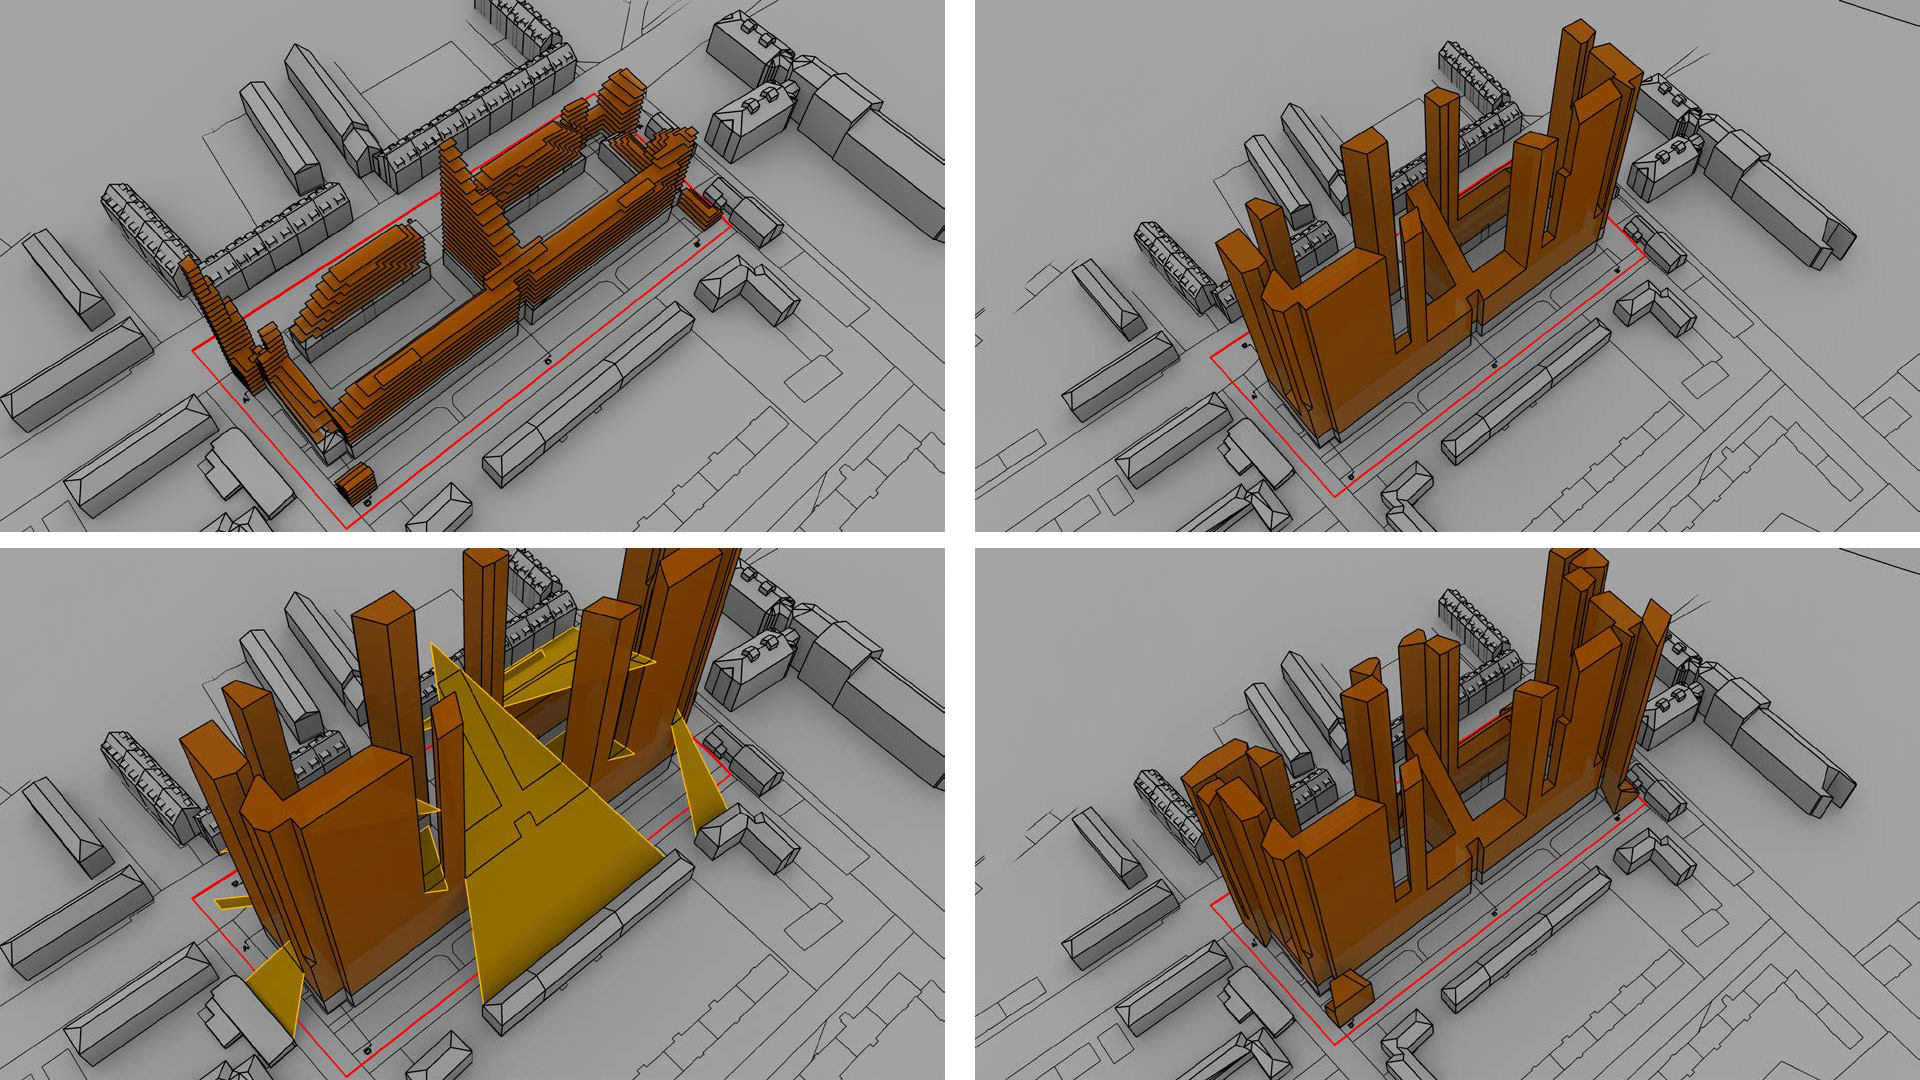
Different Urban Densification Scenarios #2 - Use Case Area Triesterstraße/Graz
Different urban densification scenarios - based on natural lighting, view facotrs, and height limitations.
Copyright: Team EPIKUR (Abt. Bauphysik und Bauökologie, TU Wien | Pirstinger, Majcen, Raudaschl)
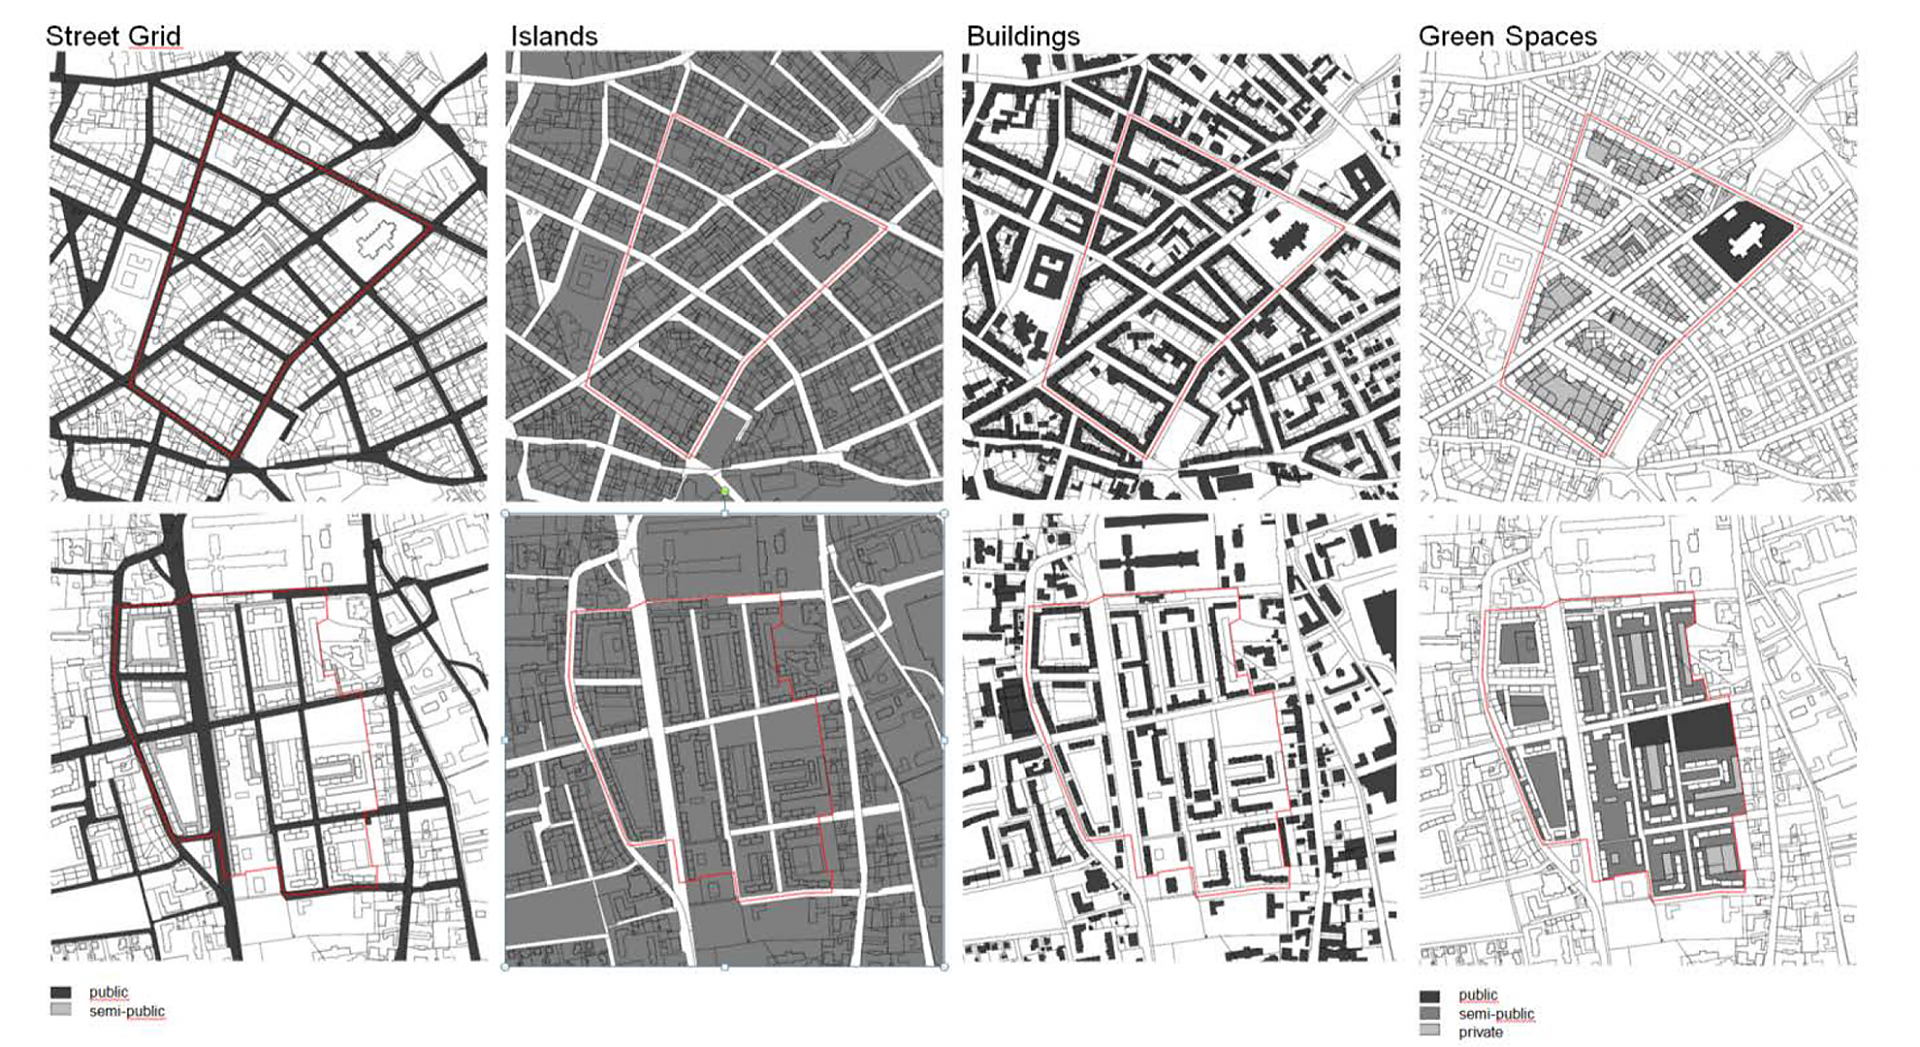
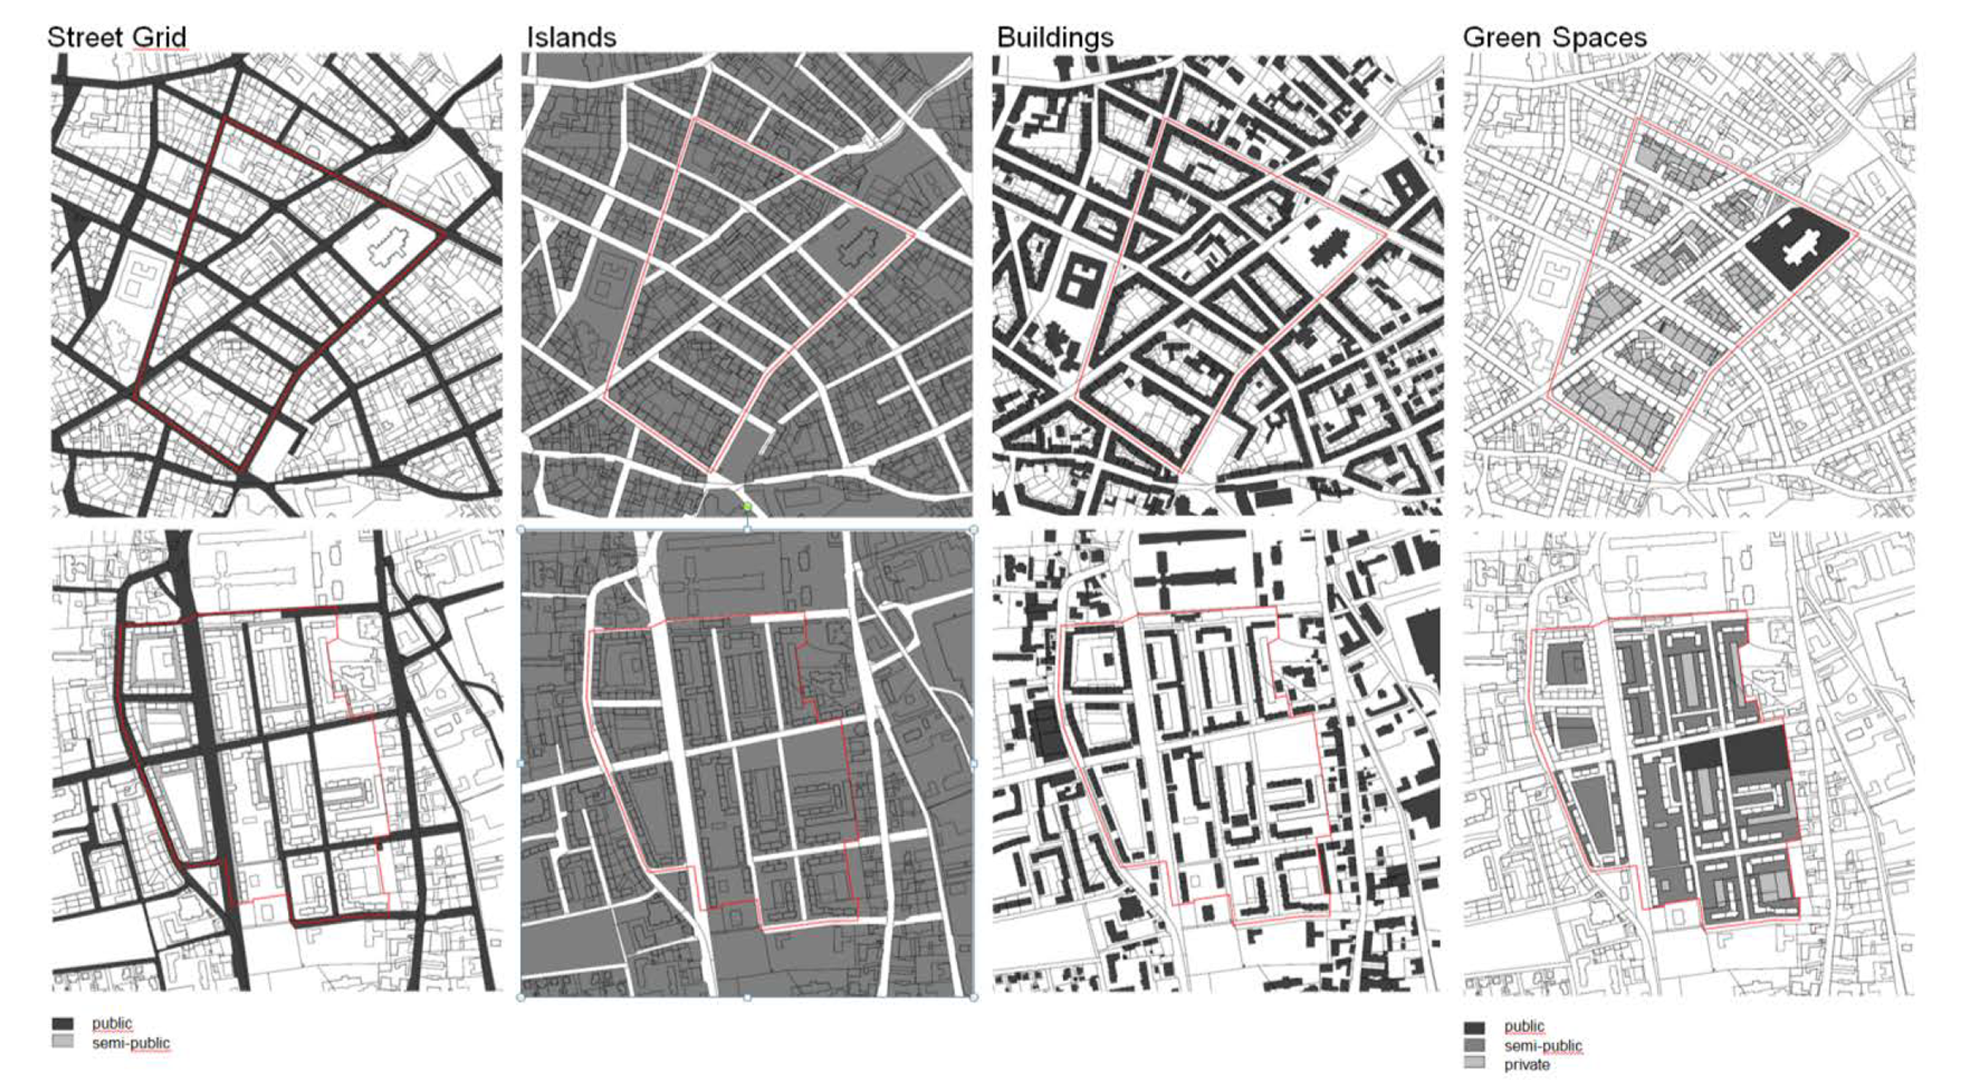
Urban morphology
Different appearance of the same urban morphology based on the chosen emphasis (Street grid, Islands, Buildings, Green Spaces)
Copyright: Team EPIKUR (Abt. Bauphysik und Bauökologie, TU Wien | Pirstinger, Raudaschl)
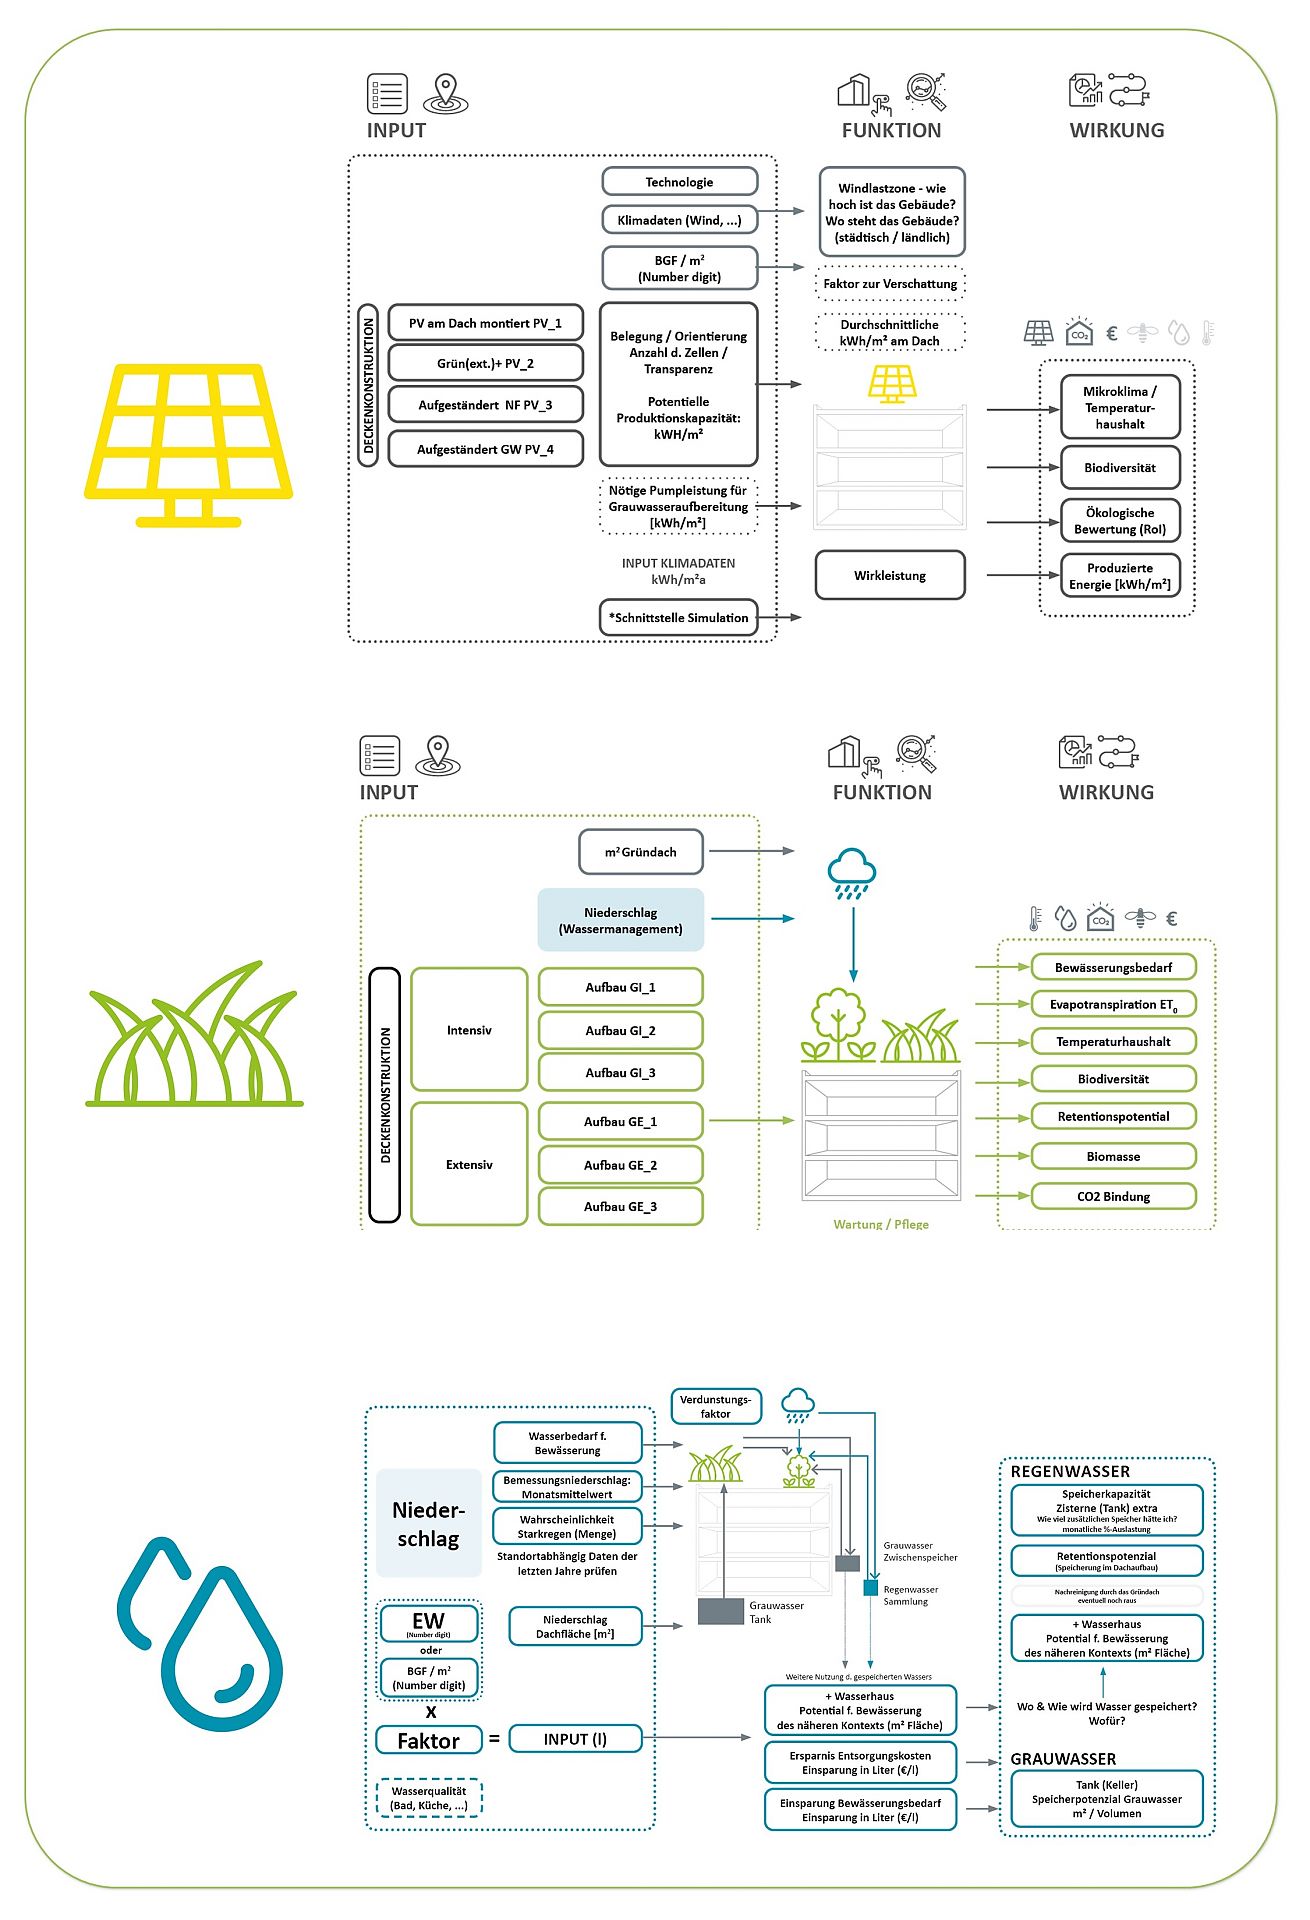
Presentation of the 3 main elements of the project photovoltaic, green roof and water management.
The diagram lists the 3 main components of the NaNu3 project photovoltaics, green roofs and water management. For each component, the input parameters, function and effect are shown schematically.
Copyright: AIT
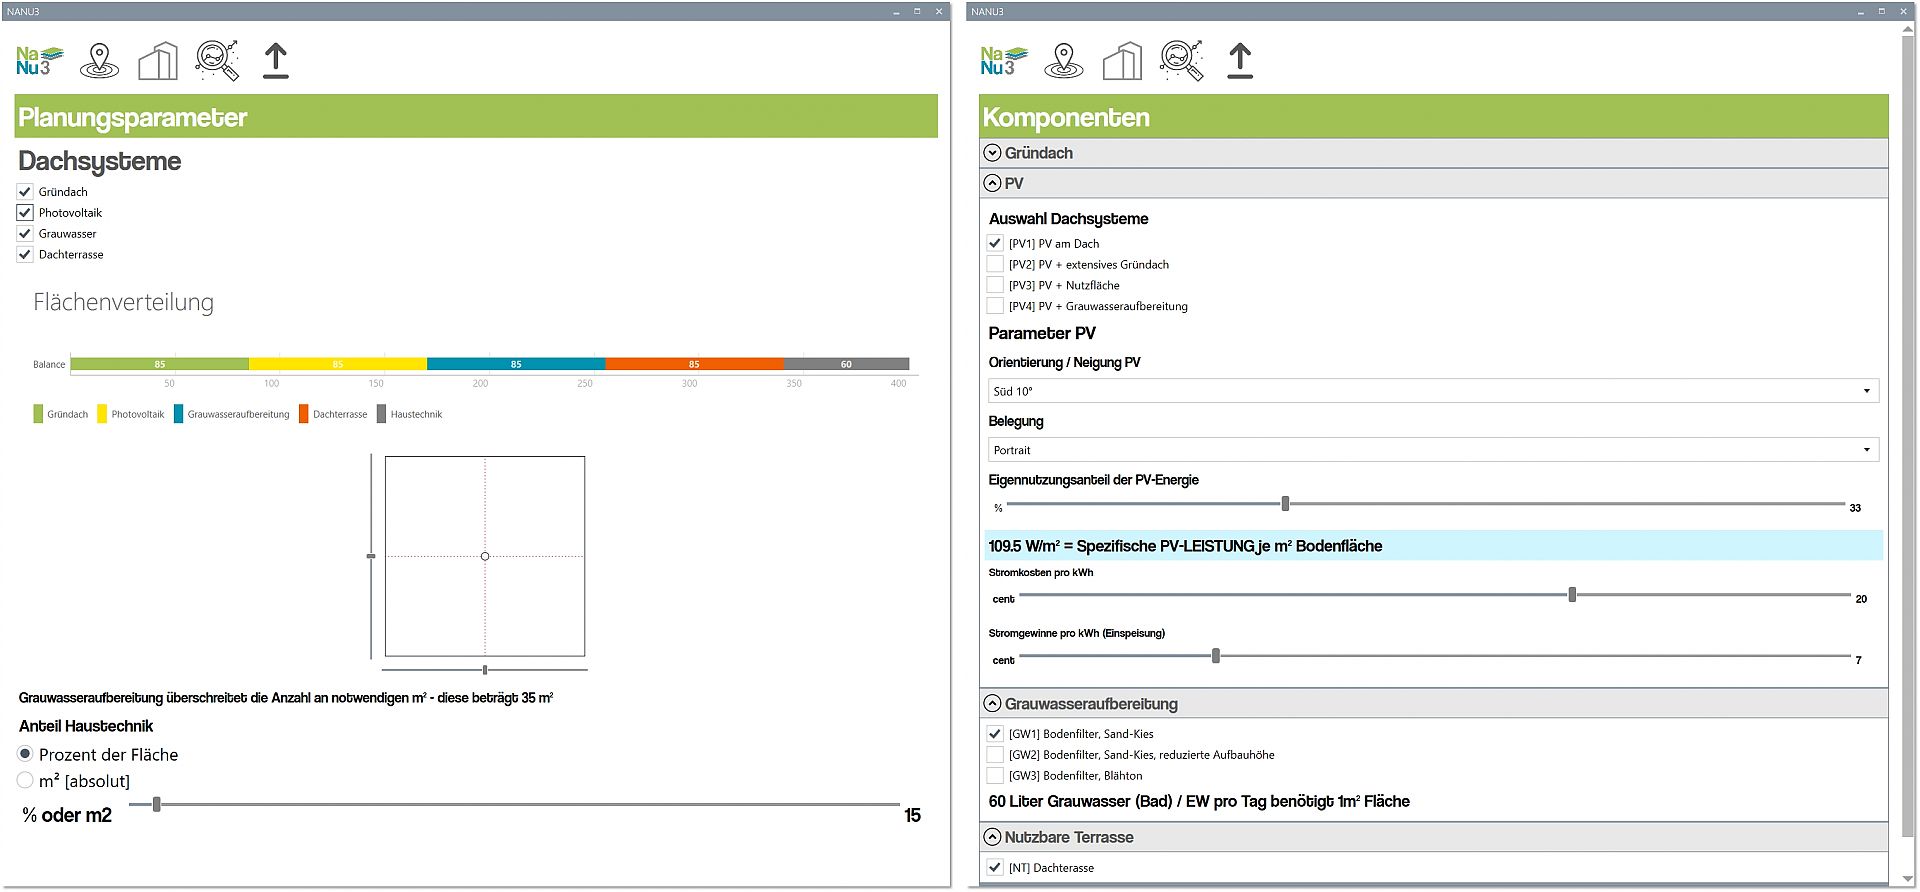
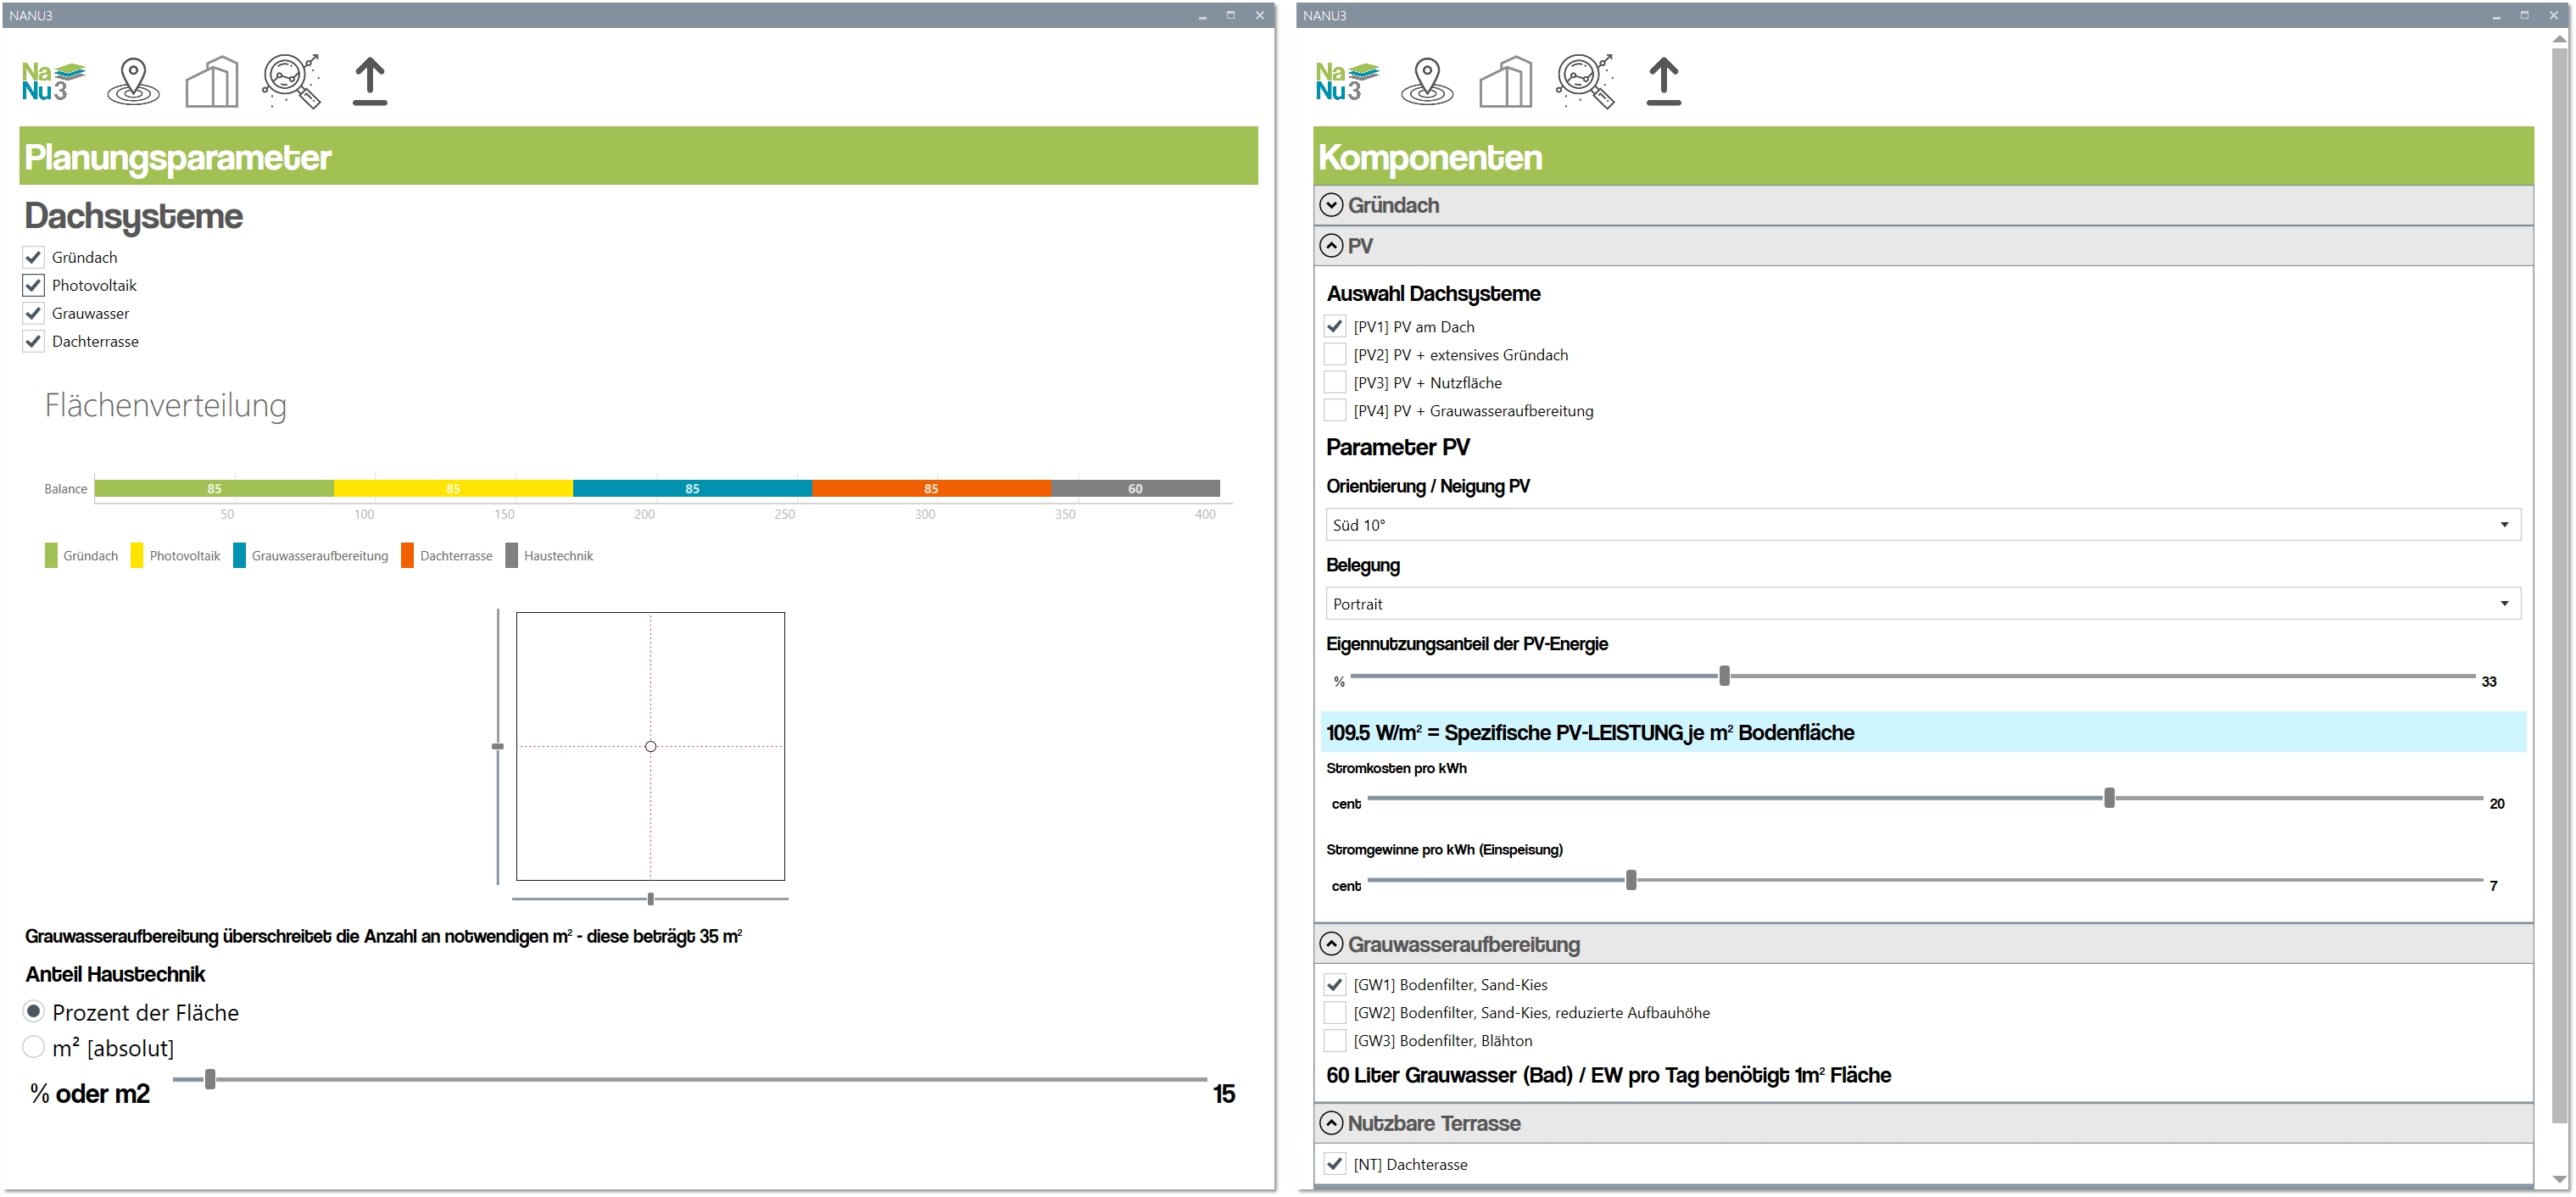
Visualization of the planning parameters as well as their components in the NaNu3 model.
The figure shows the choices for various roof systems and combinations and the associated component options.
Copyright: AIT
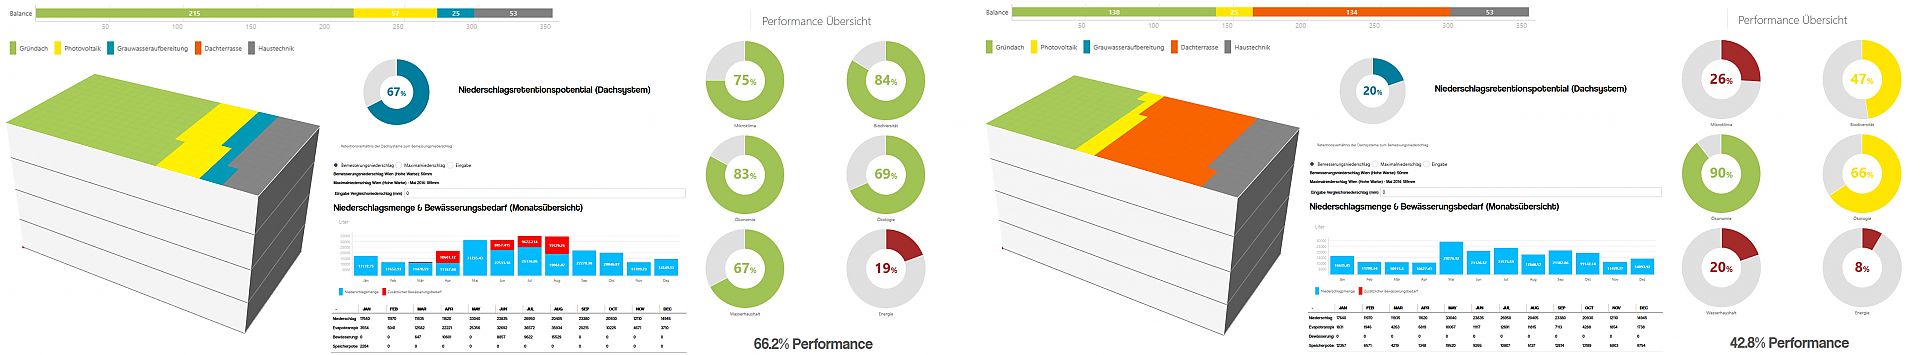
Graphical comparison of two different flat roof use cases.
The graphic shows two different use scenarios, their performance and the precipitation potential as well as the monthly precipitation amounts and irrigation requirements. They differ in graywater treatment (left) and walkable roof terrace (right). The left scenario shows a significantly better performance in most KPI categories.