Project Image Pool
There are 36 results.
Terms of use: The pictures on this site originate from the projects in the frame of the programmes City of Tomorrow, Building of Tomorrow and the IEA Research Cooperation. They may be used credited for non-commercial purposes under the Creative Commons License Attribution-NonCommercial (CC BY-NC).
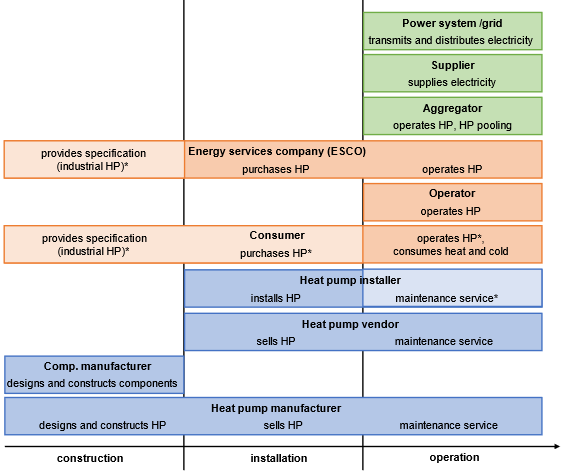
Stakeholders in the life cycle of IoT enabled heat pumps
Various examples of business models for IoT heat pumps were collected in IEA HPT Annex 56. The diagram shows the stakeholders involved in the life cycle of an IoT heat pump (blue = heat pump value chain, orange = operators and users, green = energy system). All reports are available at https://heatpumpingtechnologies.org/annex56/.
Copyright: AIT Austrian Institute of Technology GmbH
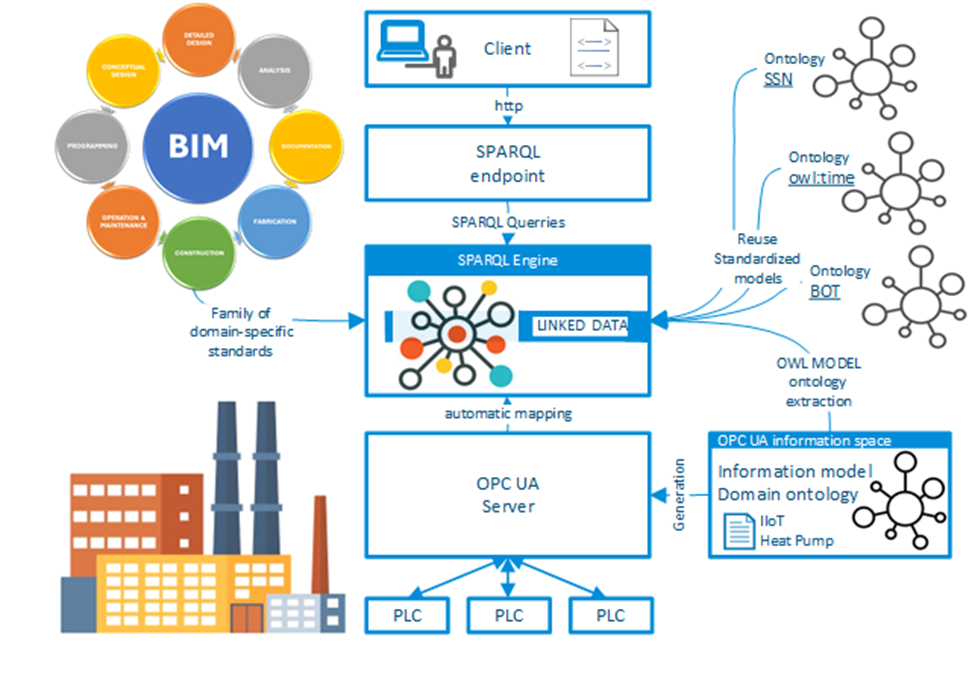
Use of runtime data in a knowledge base
The graphic shows how real-time data from the field level and building data are linked to the knowledge base.
Copyright: TU Wien
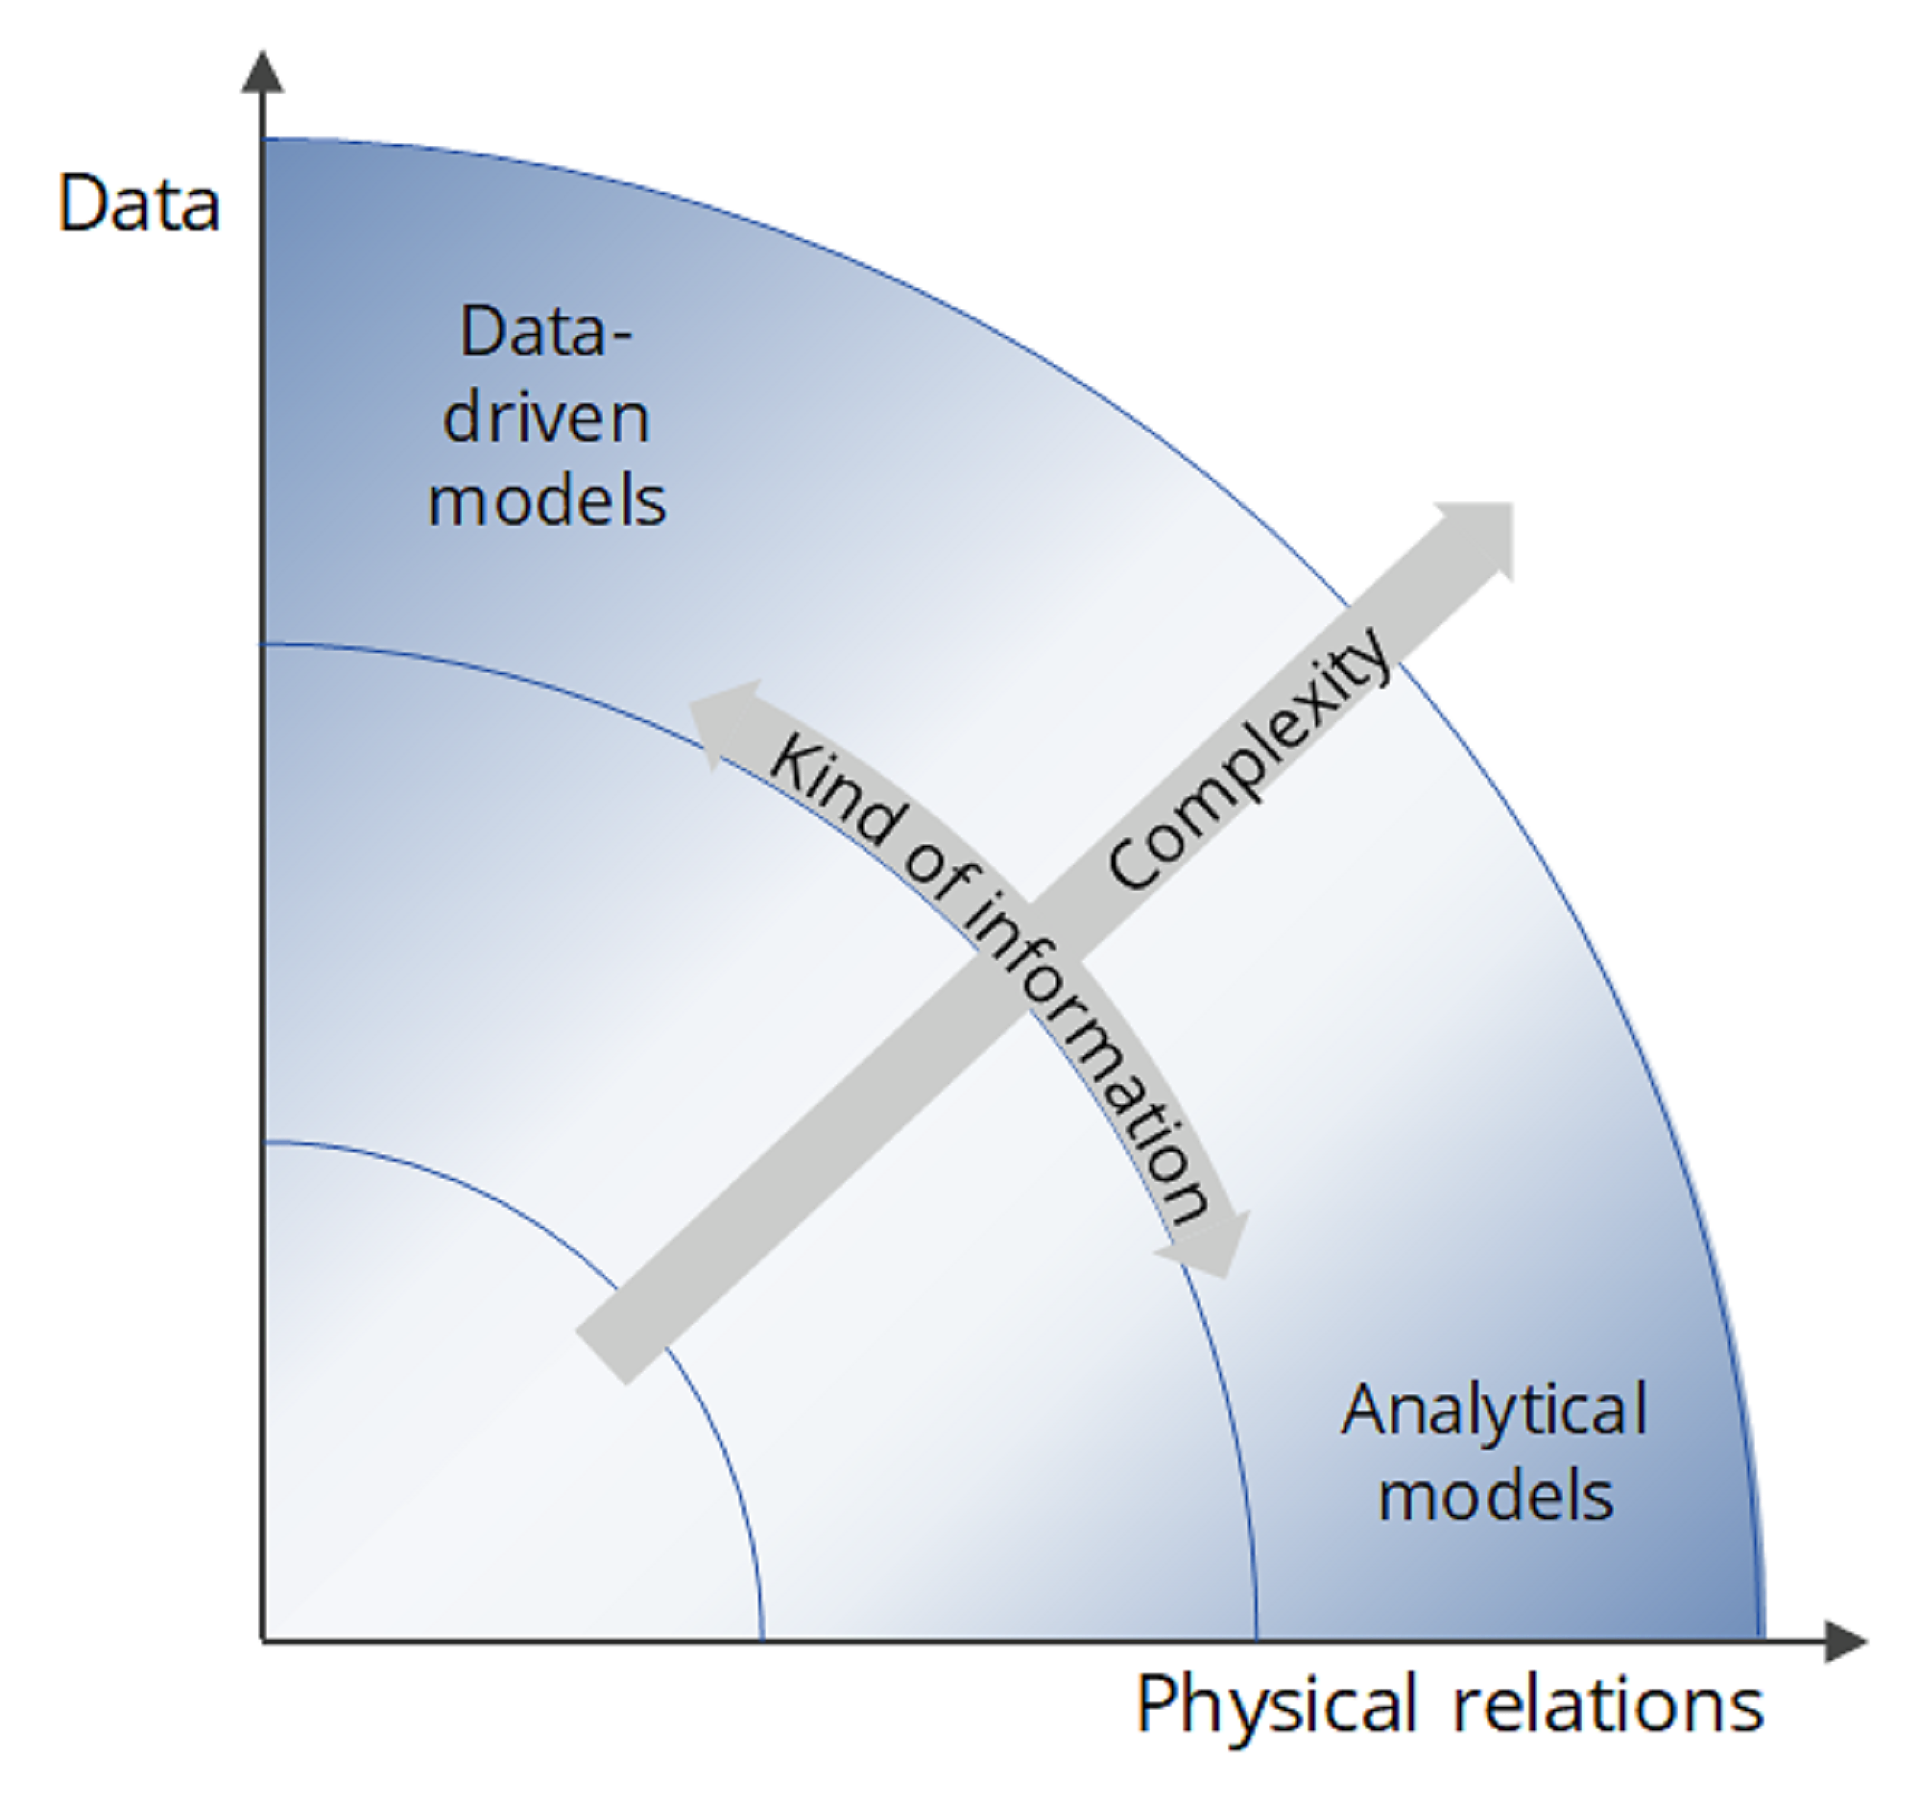
Models for IoT heat pumps
The graphic shows different types of models that are relevant for IoT heat pumps. Physical models are based on physical relationships, data-driven models are created using only data. Hybrid models are based on both data and physical relationships.
Copyright: Danish Technological Institute
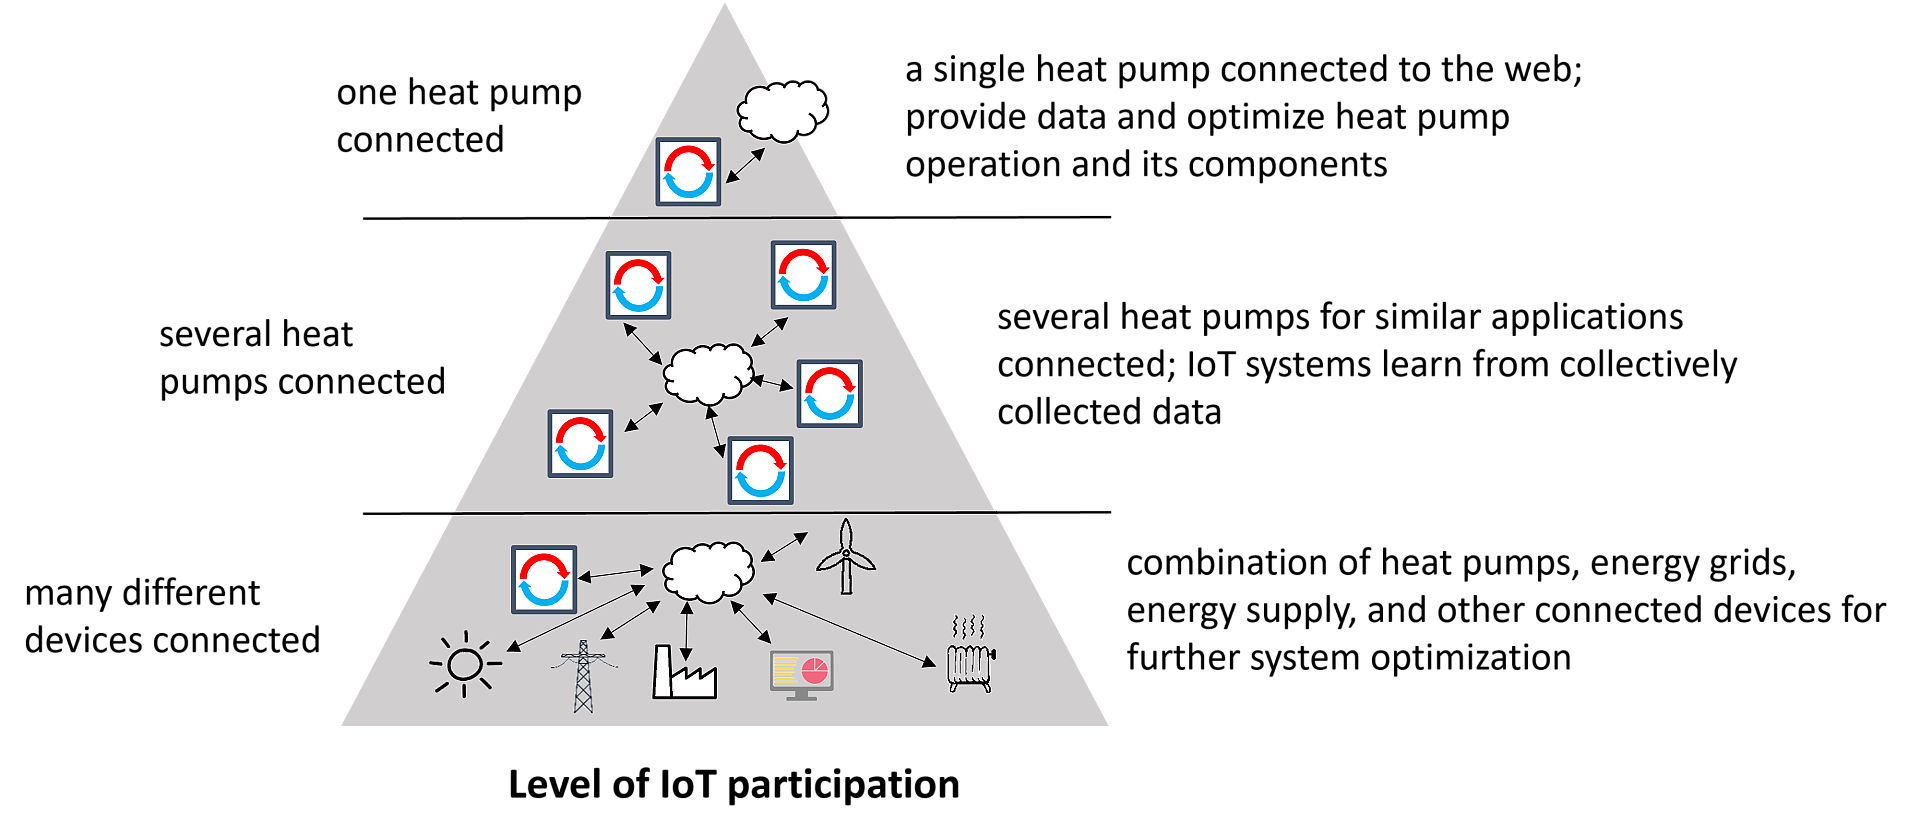
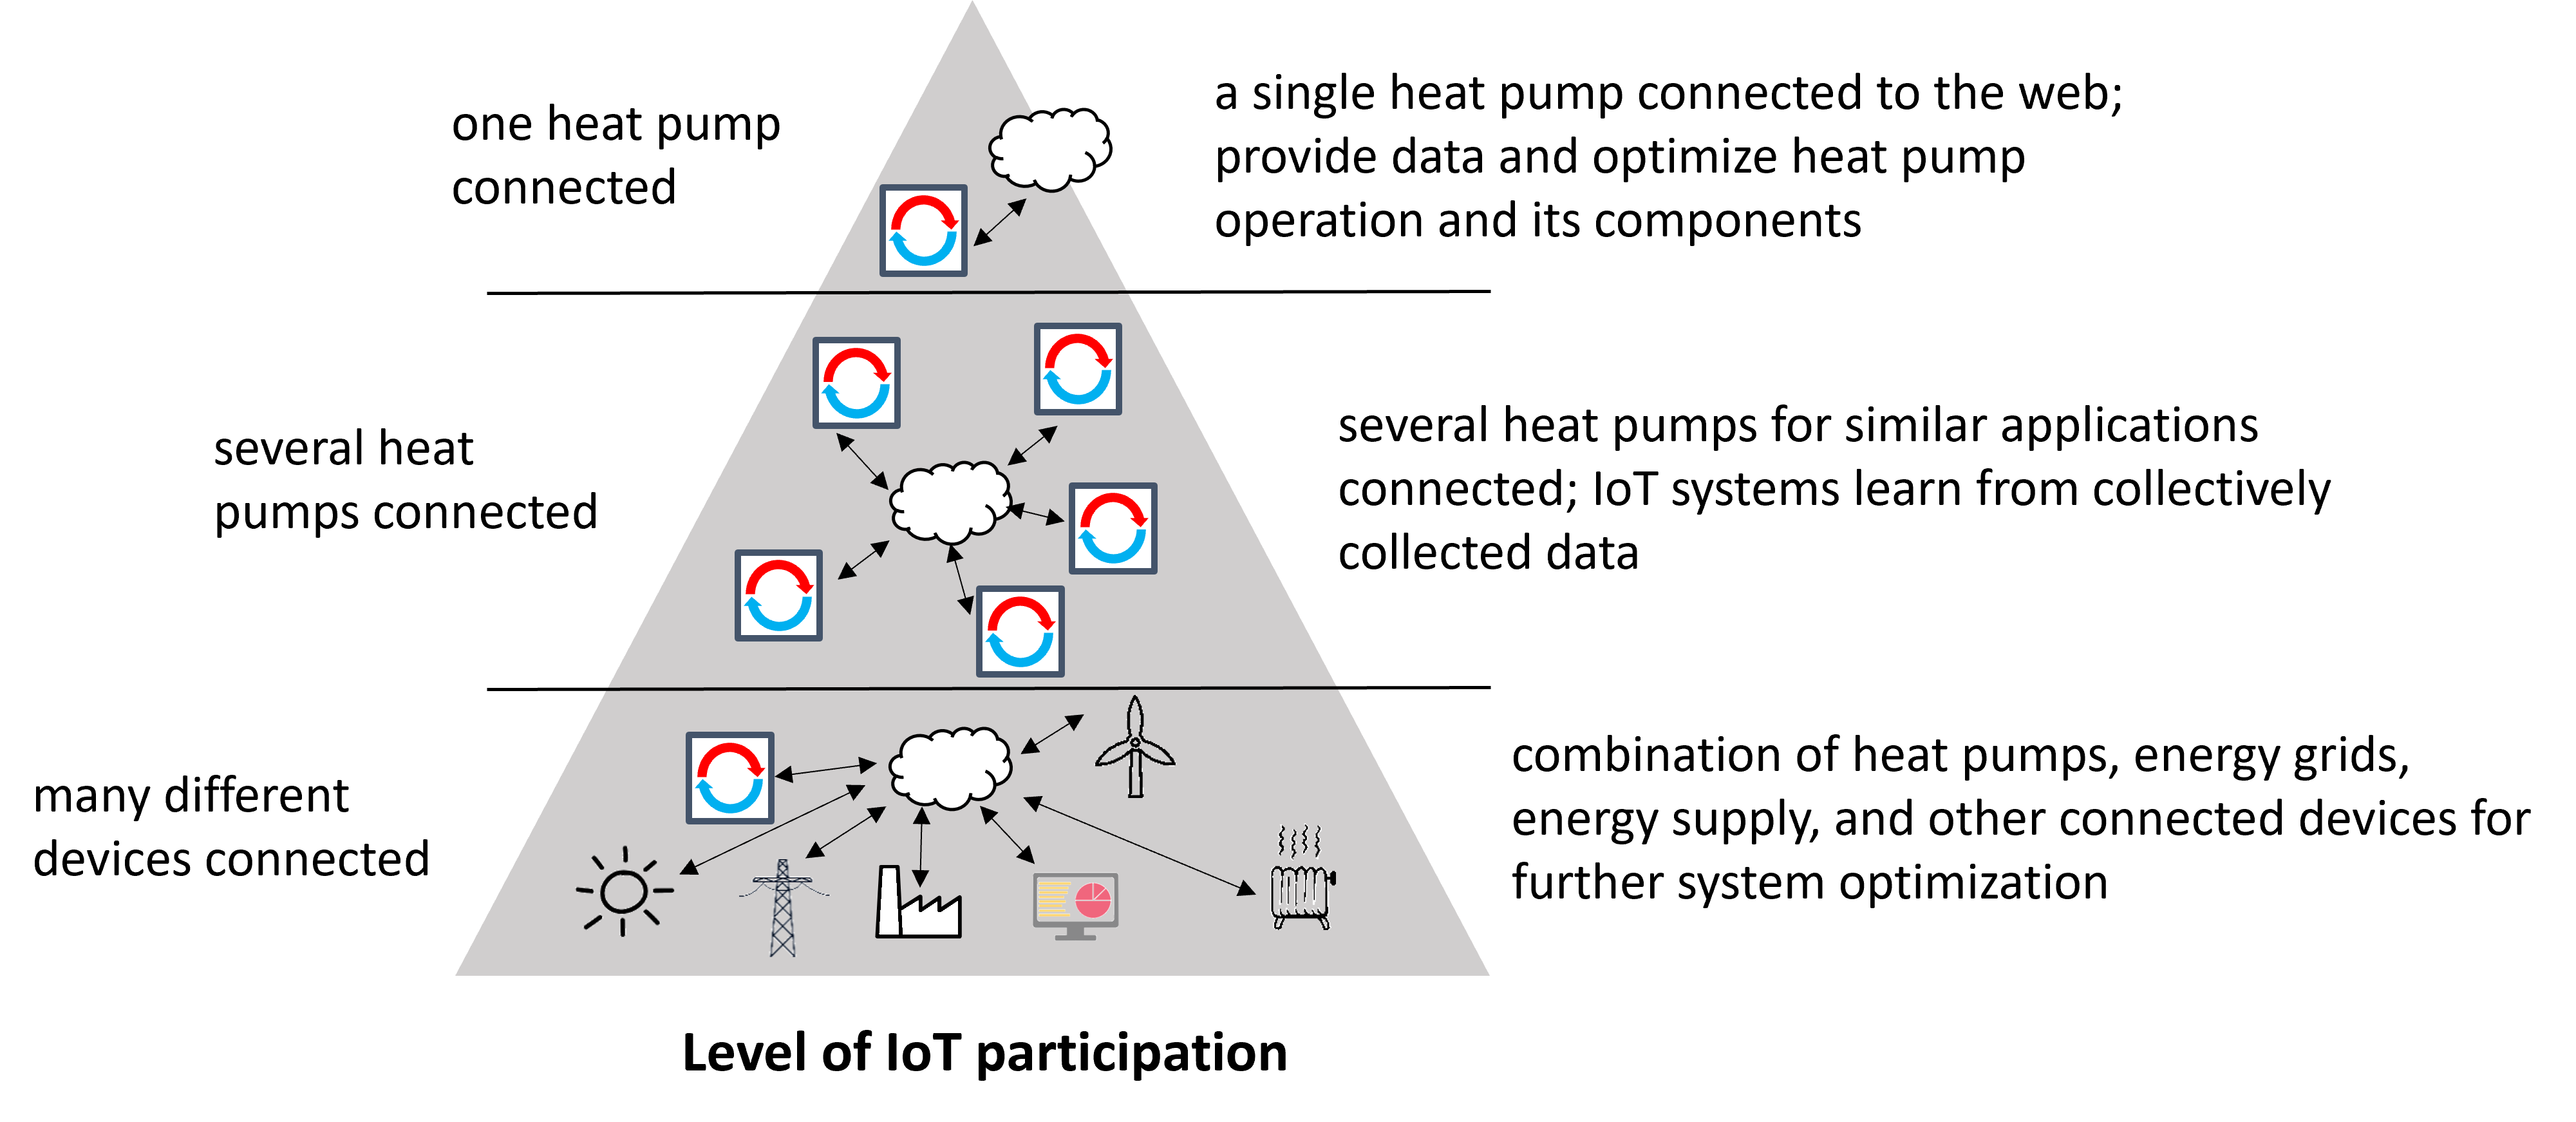
IoT participation of heat pumps
This graphic describes different types of interaction between connected heat pumps. They range from the cloud connection of an individual heat pump to a networked energy system. The IEA HPT Annex 56 reports provide a detailed overview of the state of the art, interfaces, data analysis and business models and are available at https://heatpumpingtechnologies.org/annex56/
Copyright: AIT Austrian Institute of Technology GmbH
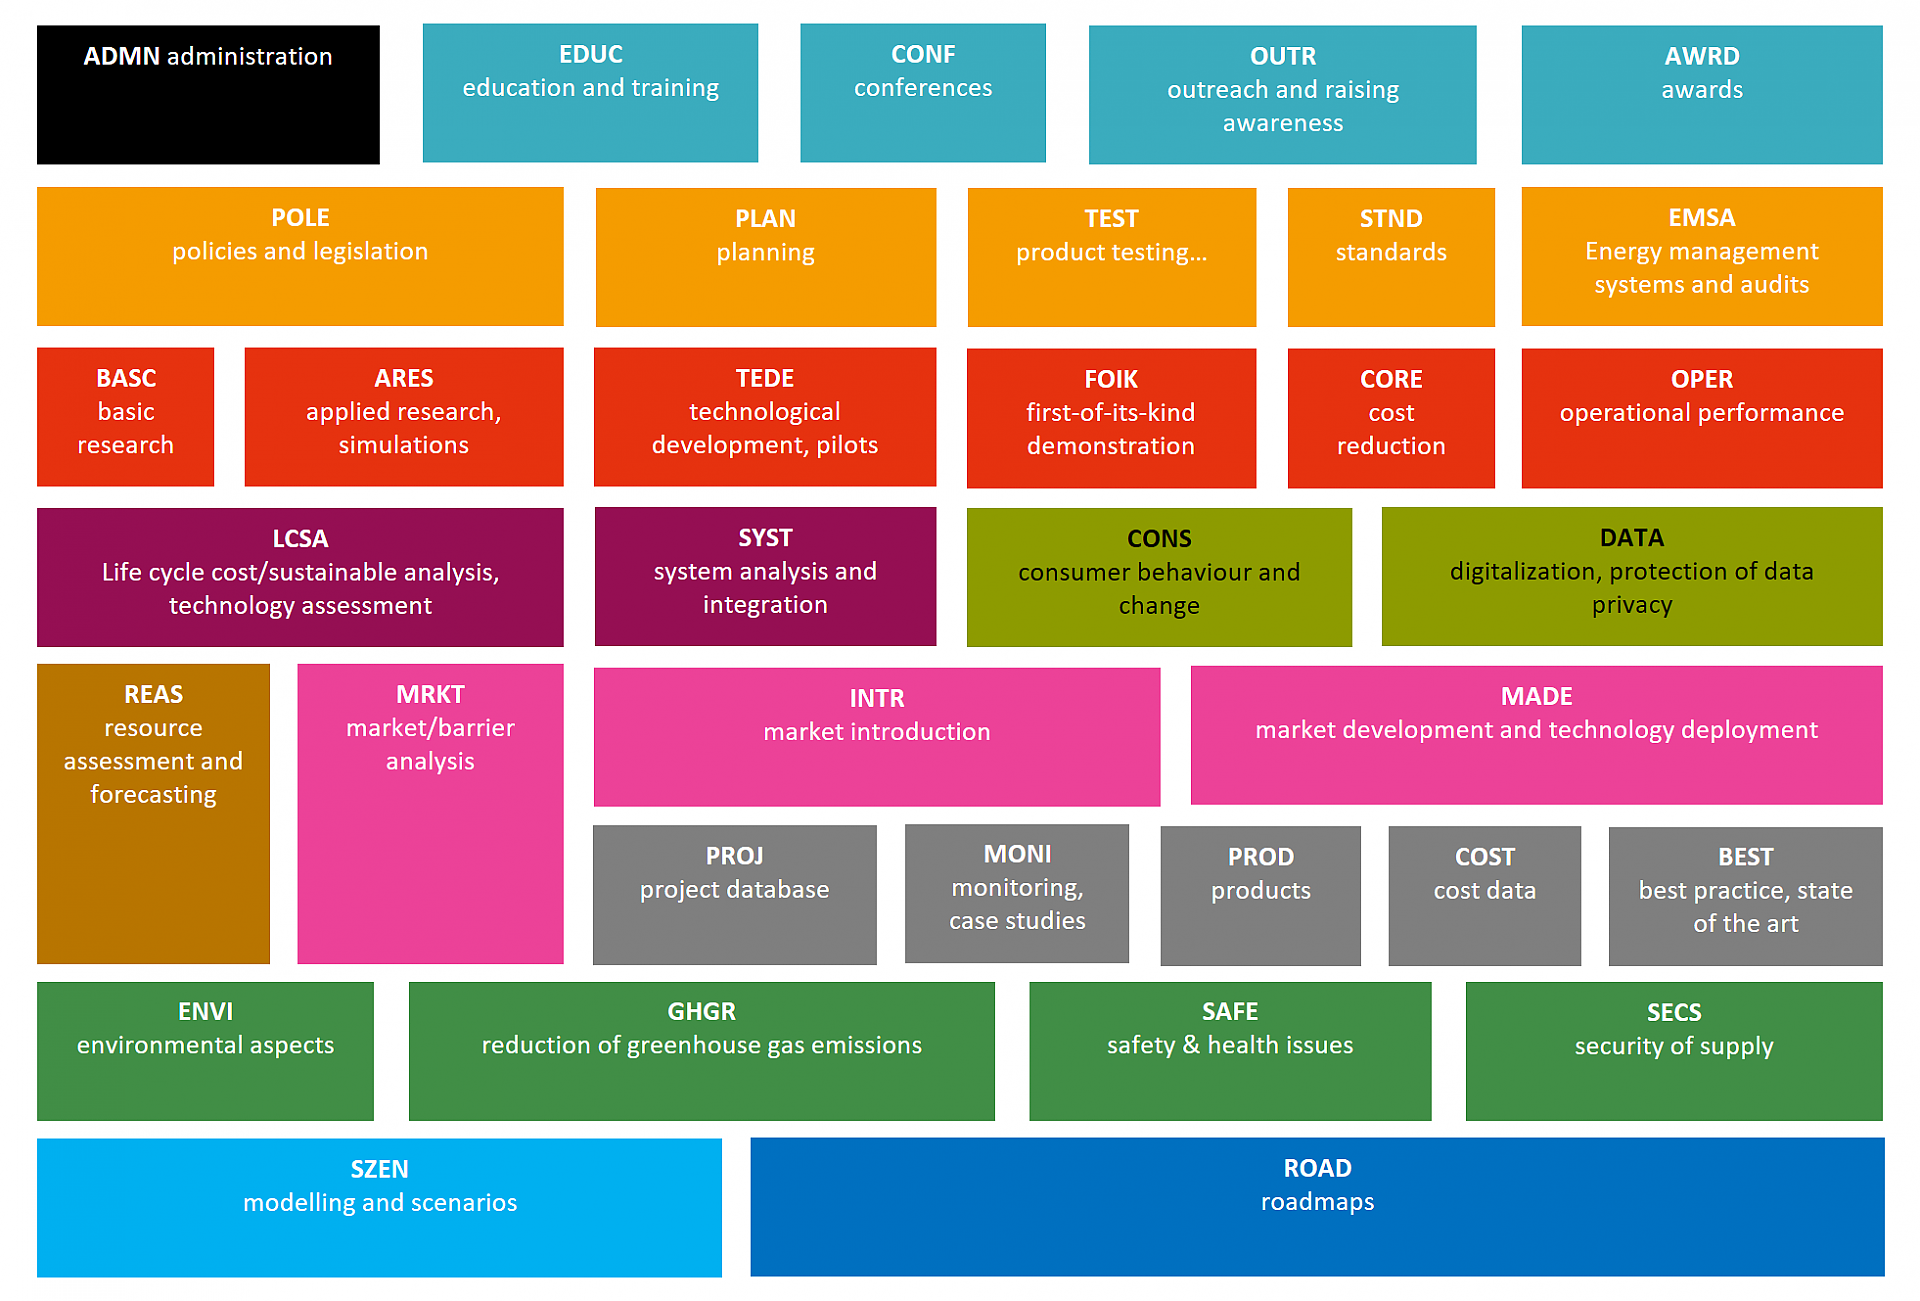
Methods
Set of methods to classify the type of activity of TCP Tasks and Annexes.
Copyright: Austrian Energy Agency
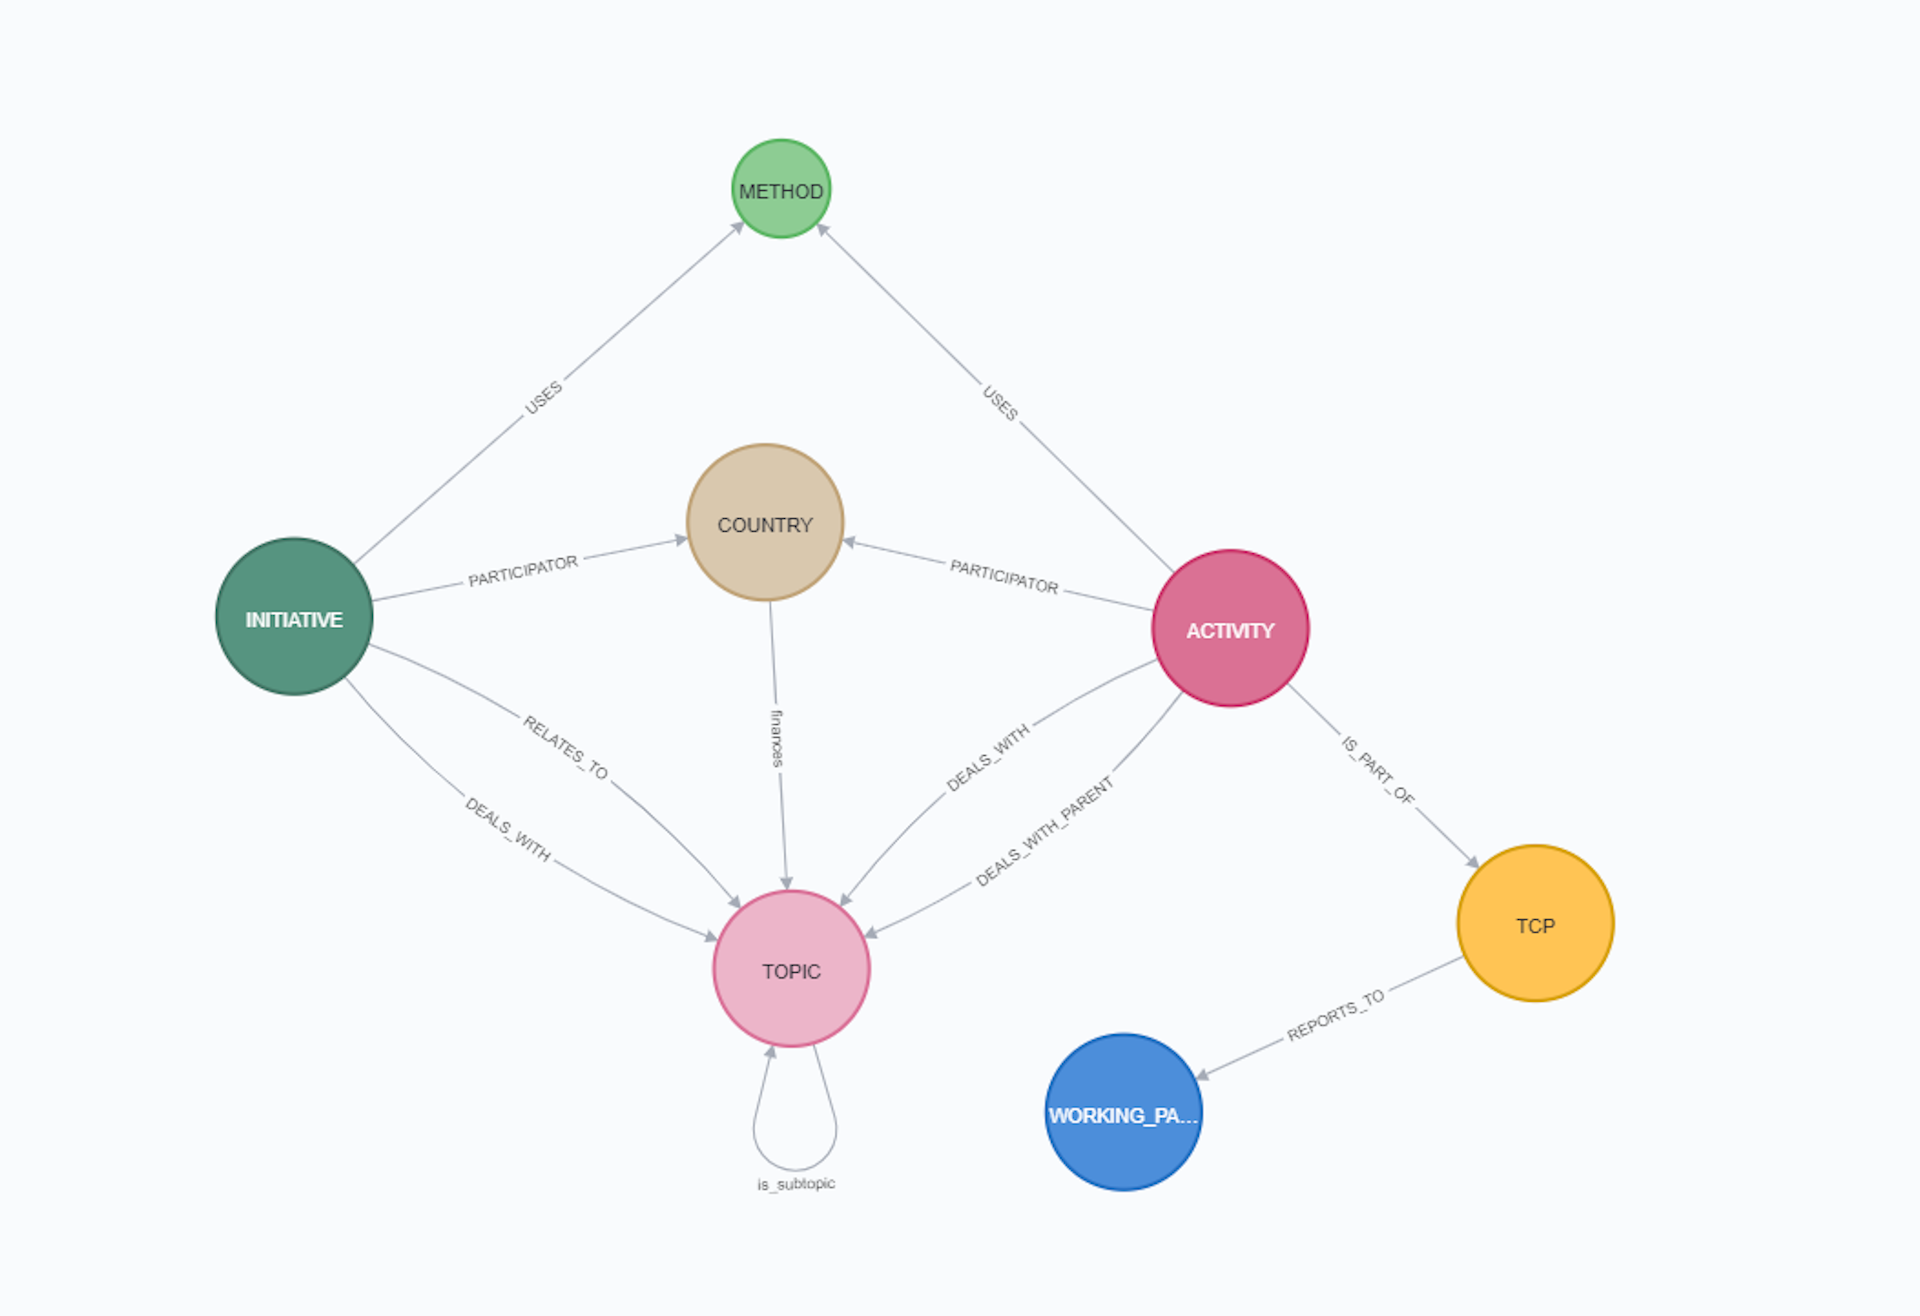
Graph Datastructure
Graphbased datastructure of the open access IEA-TCP dataset.
Copyright: Austrian Energy Agency
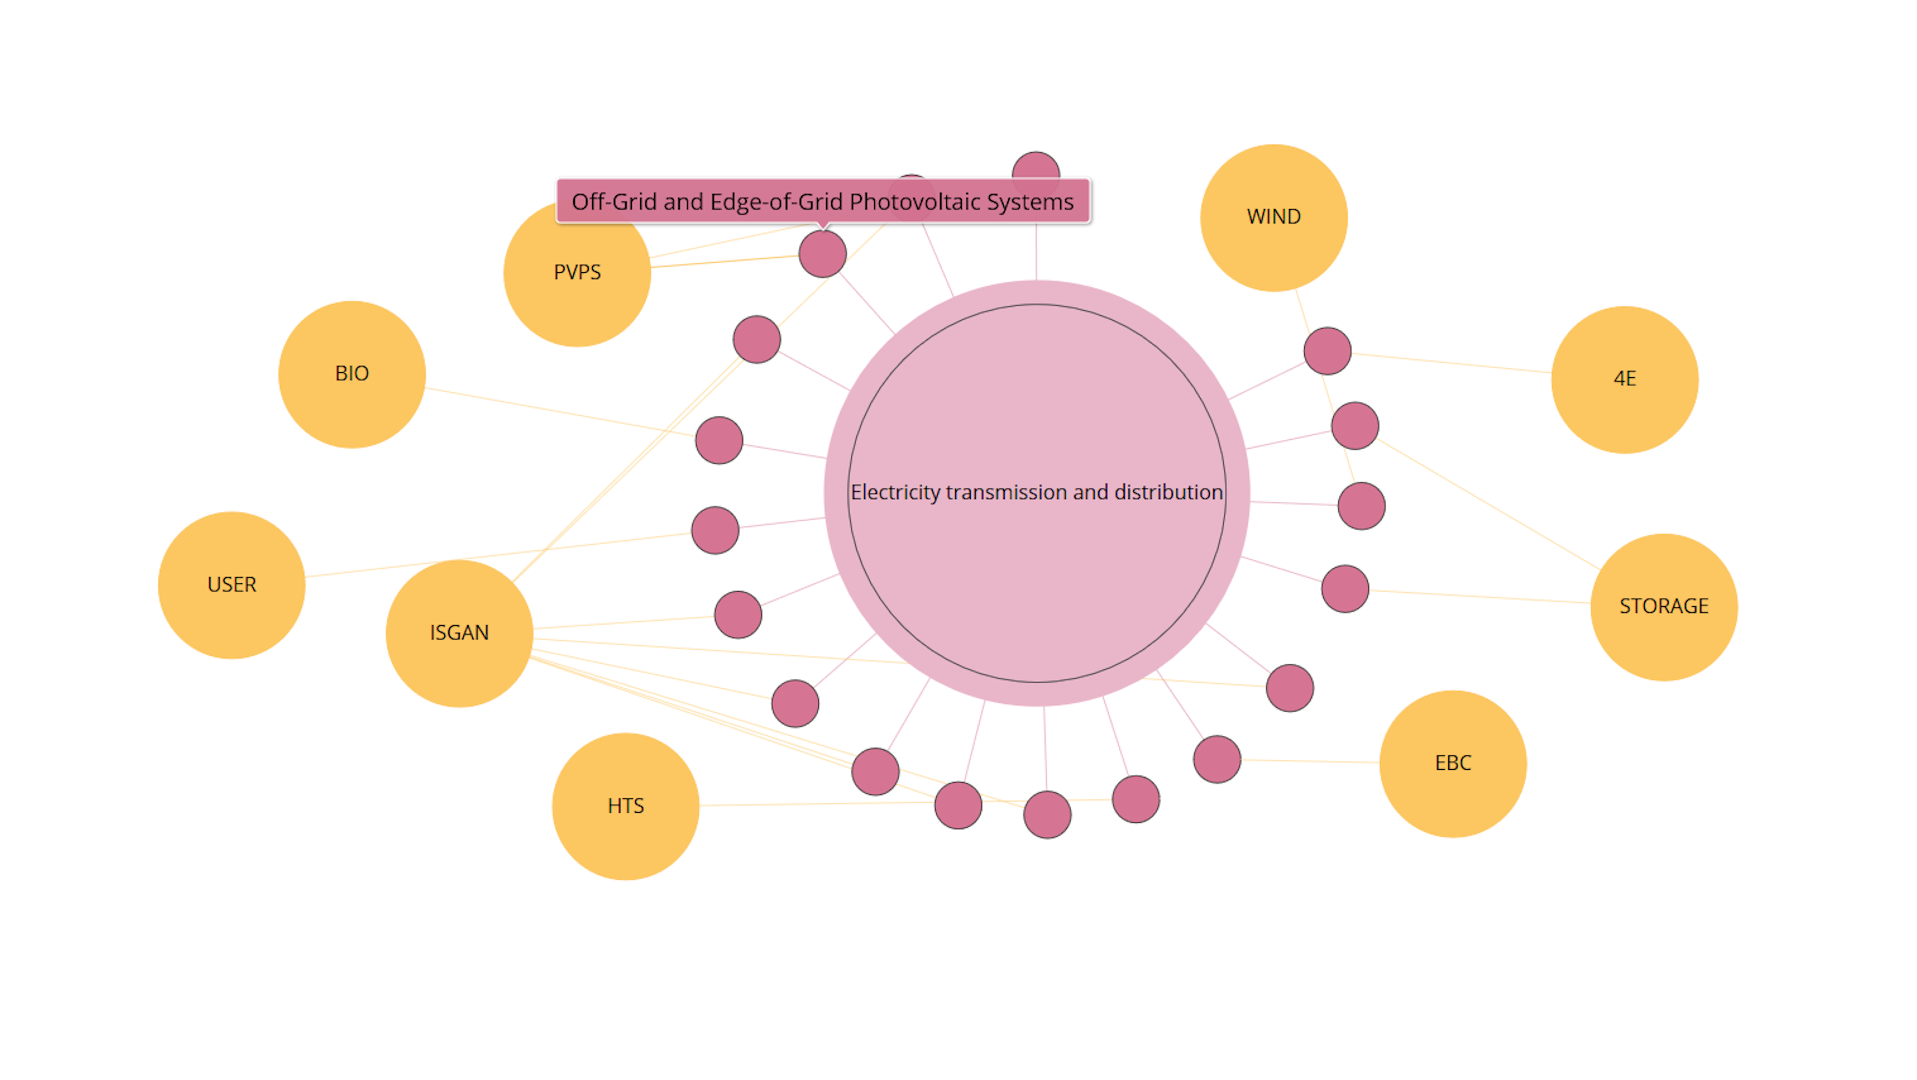
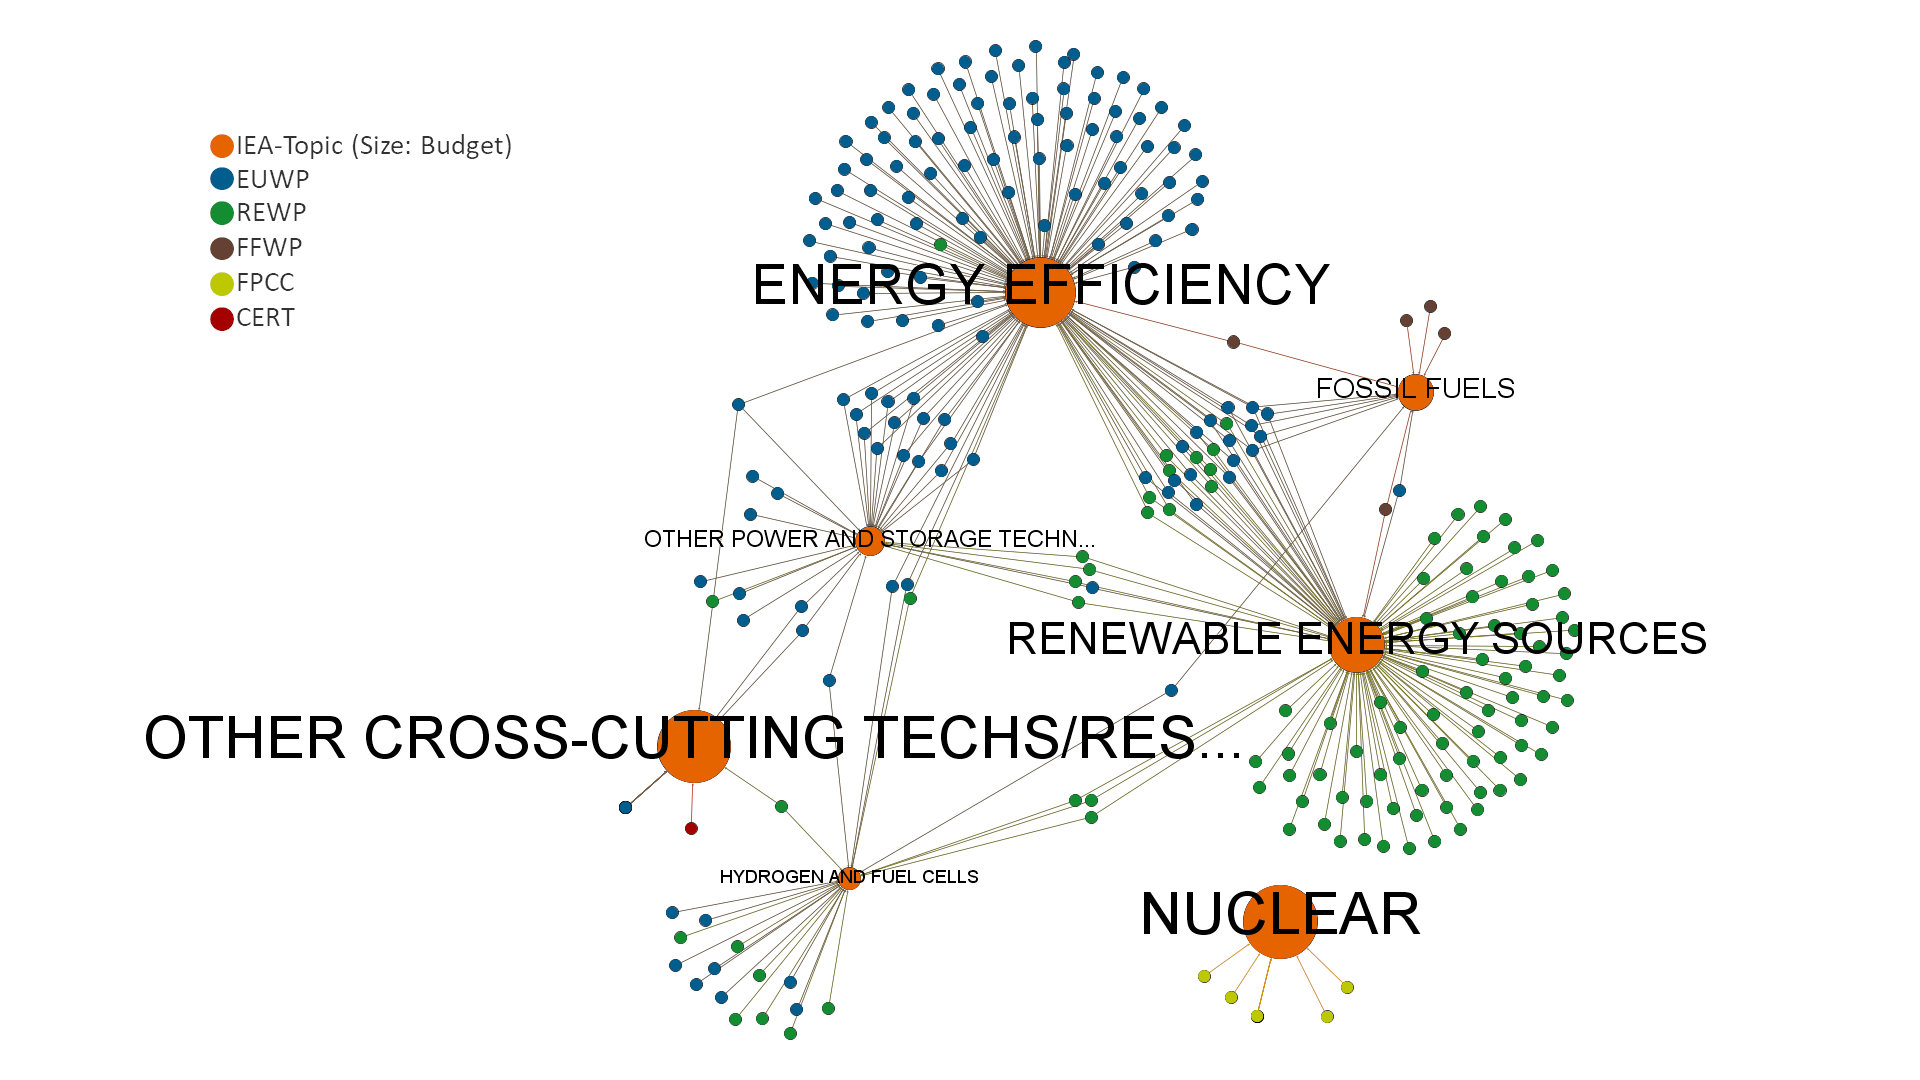
Visualisation of TCPs
After selecting a topic (in this example "Electricity transmission and distribution" was selected), this graph shows all tasks (activities) focussing on the selected topic. The topics are structured according to the IEA energy RD&D budget/expenditure statistics. Additionally, you can see the related Technology Collaboration Programmes (TCPs). Activities which had been ongoing in Summer 2020 from all IEA-TCPs are covered in this analysis. You can re-arrange the different bubbles to better meet the needs of your analysis. If a TCP consists of more than one task (activity), it also contains one entry in the database labelled “ExCo-Activities”. Available at https://nachhaltigwirtschaften.at/en/iea/visualisations/tcps-focussing-on-a-topic.php
Copyright: Austrian Energy Agency
R&D Map
Visualisation of all ongoing Tasks and Annexes ("Activities") and their respective research topics.
Copyright: Austrian Energy Agency
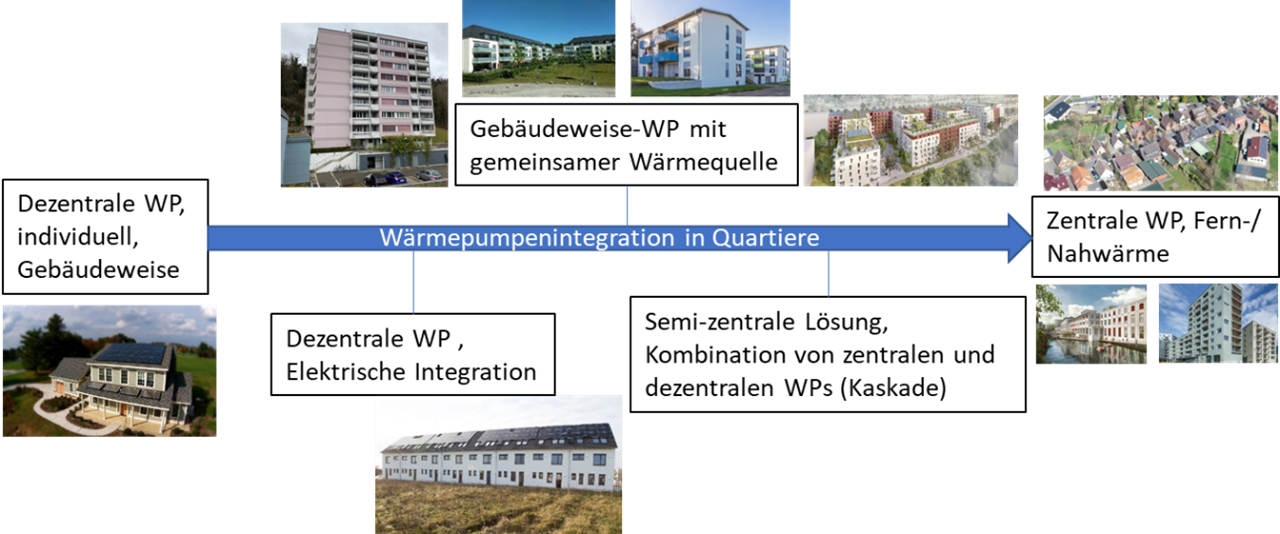
HP Inegration
Integration options of heat pumps in districts
Copyright: OST Wemhoener
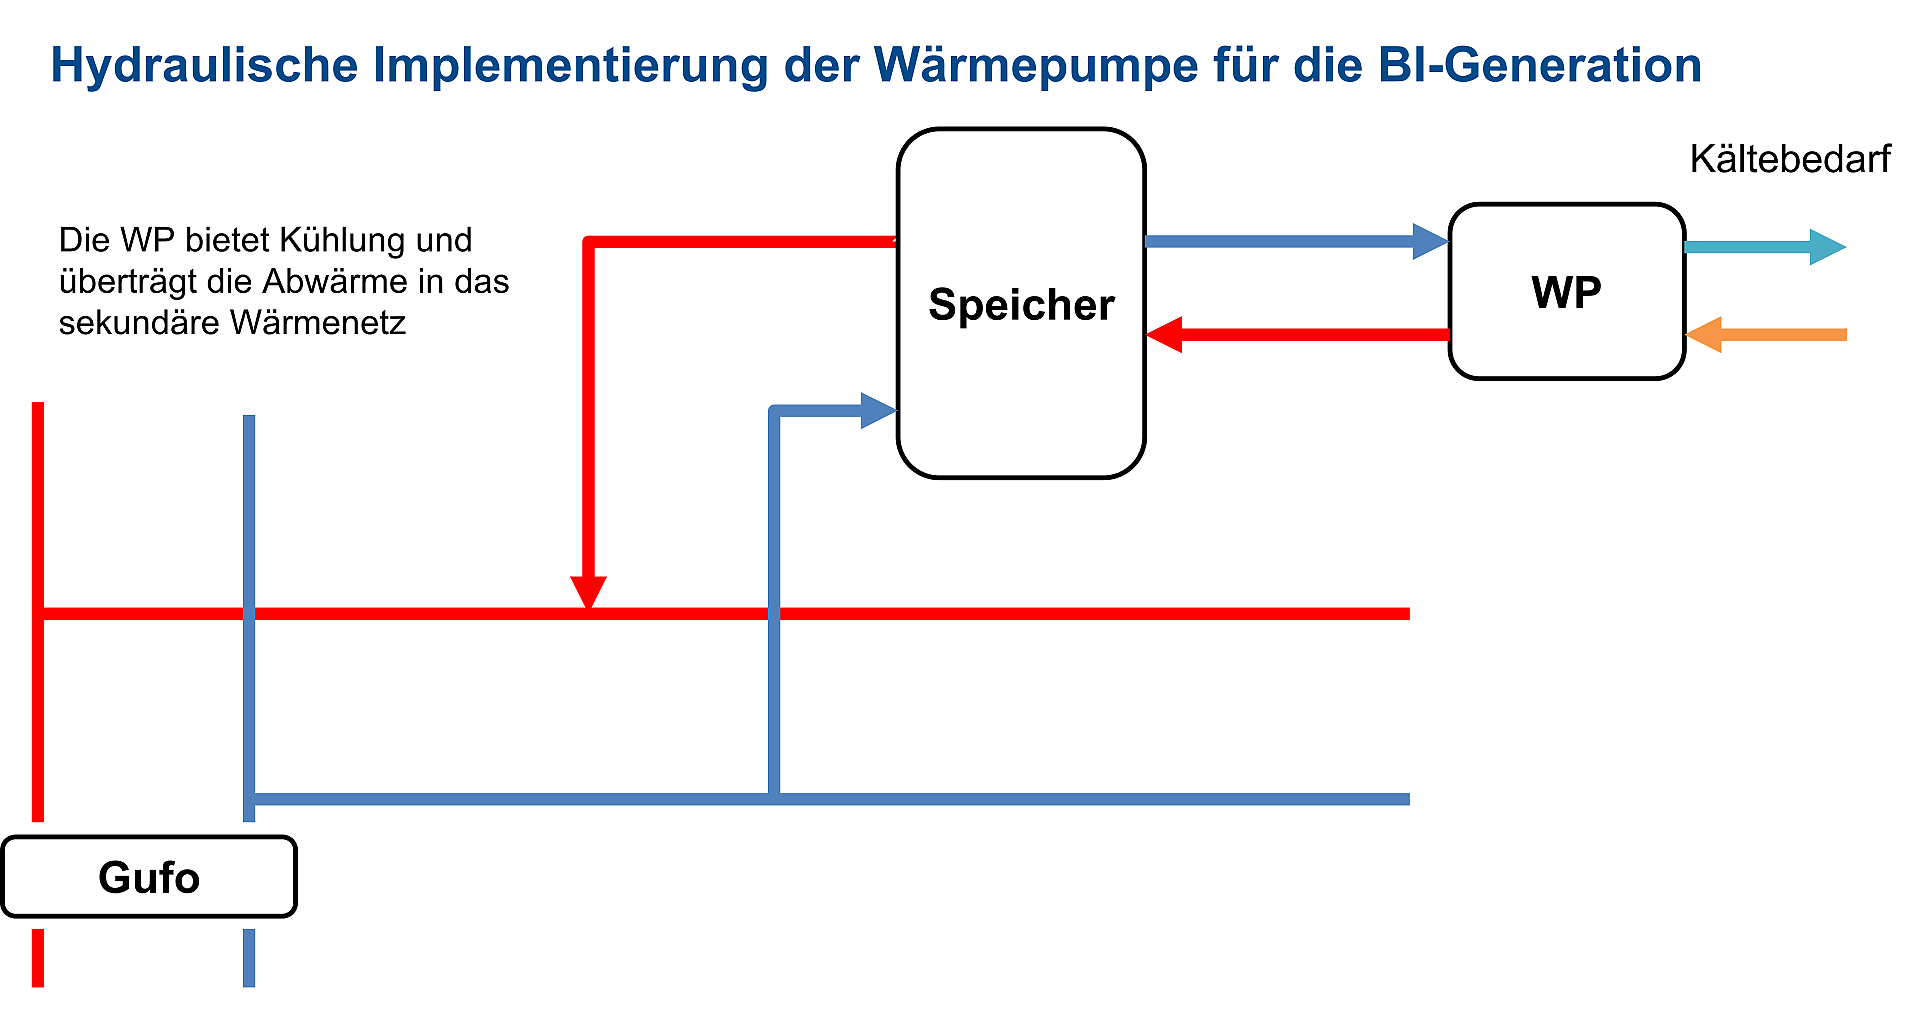
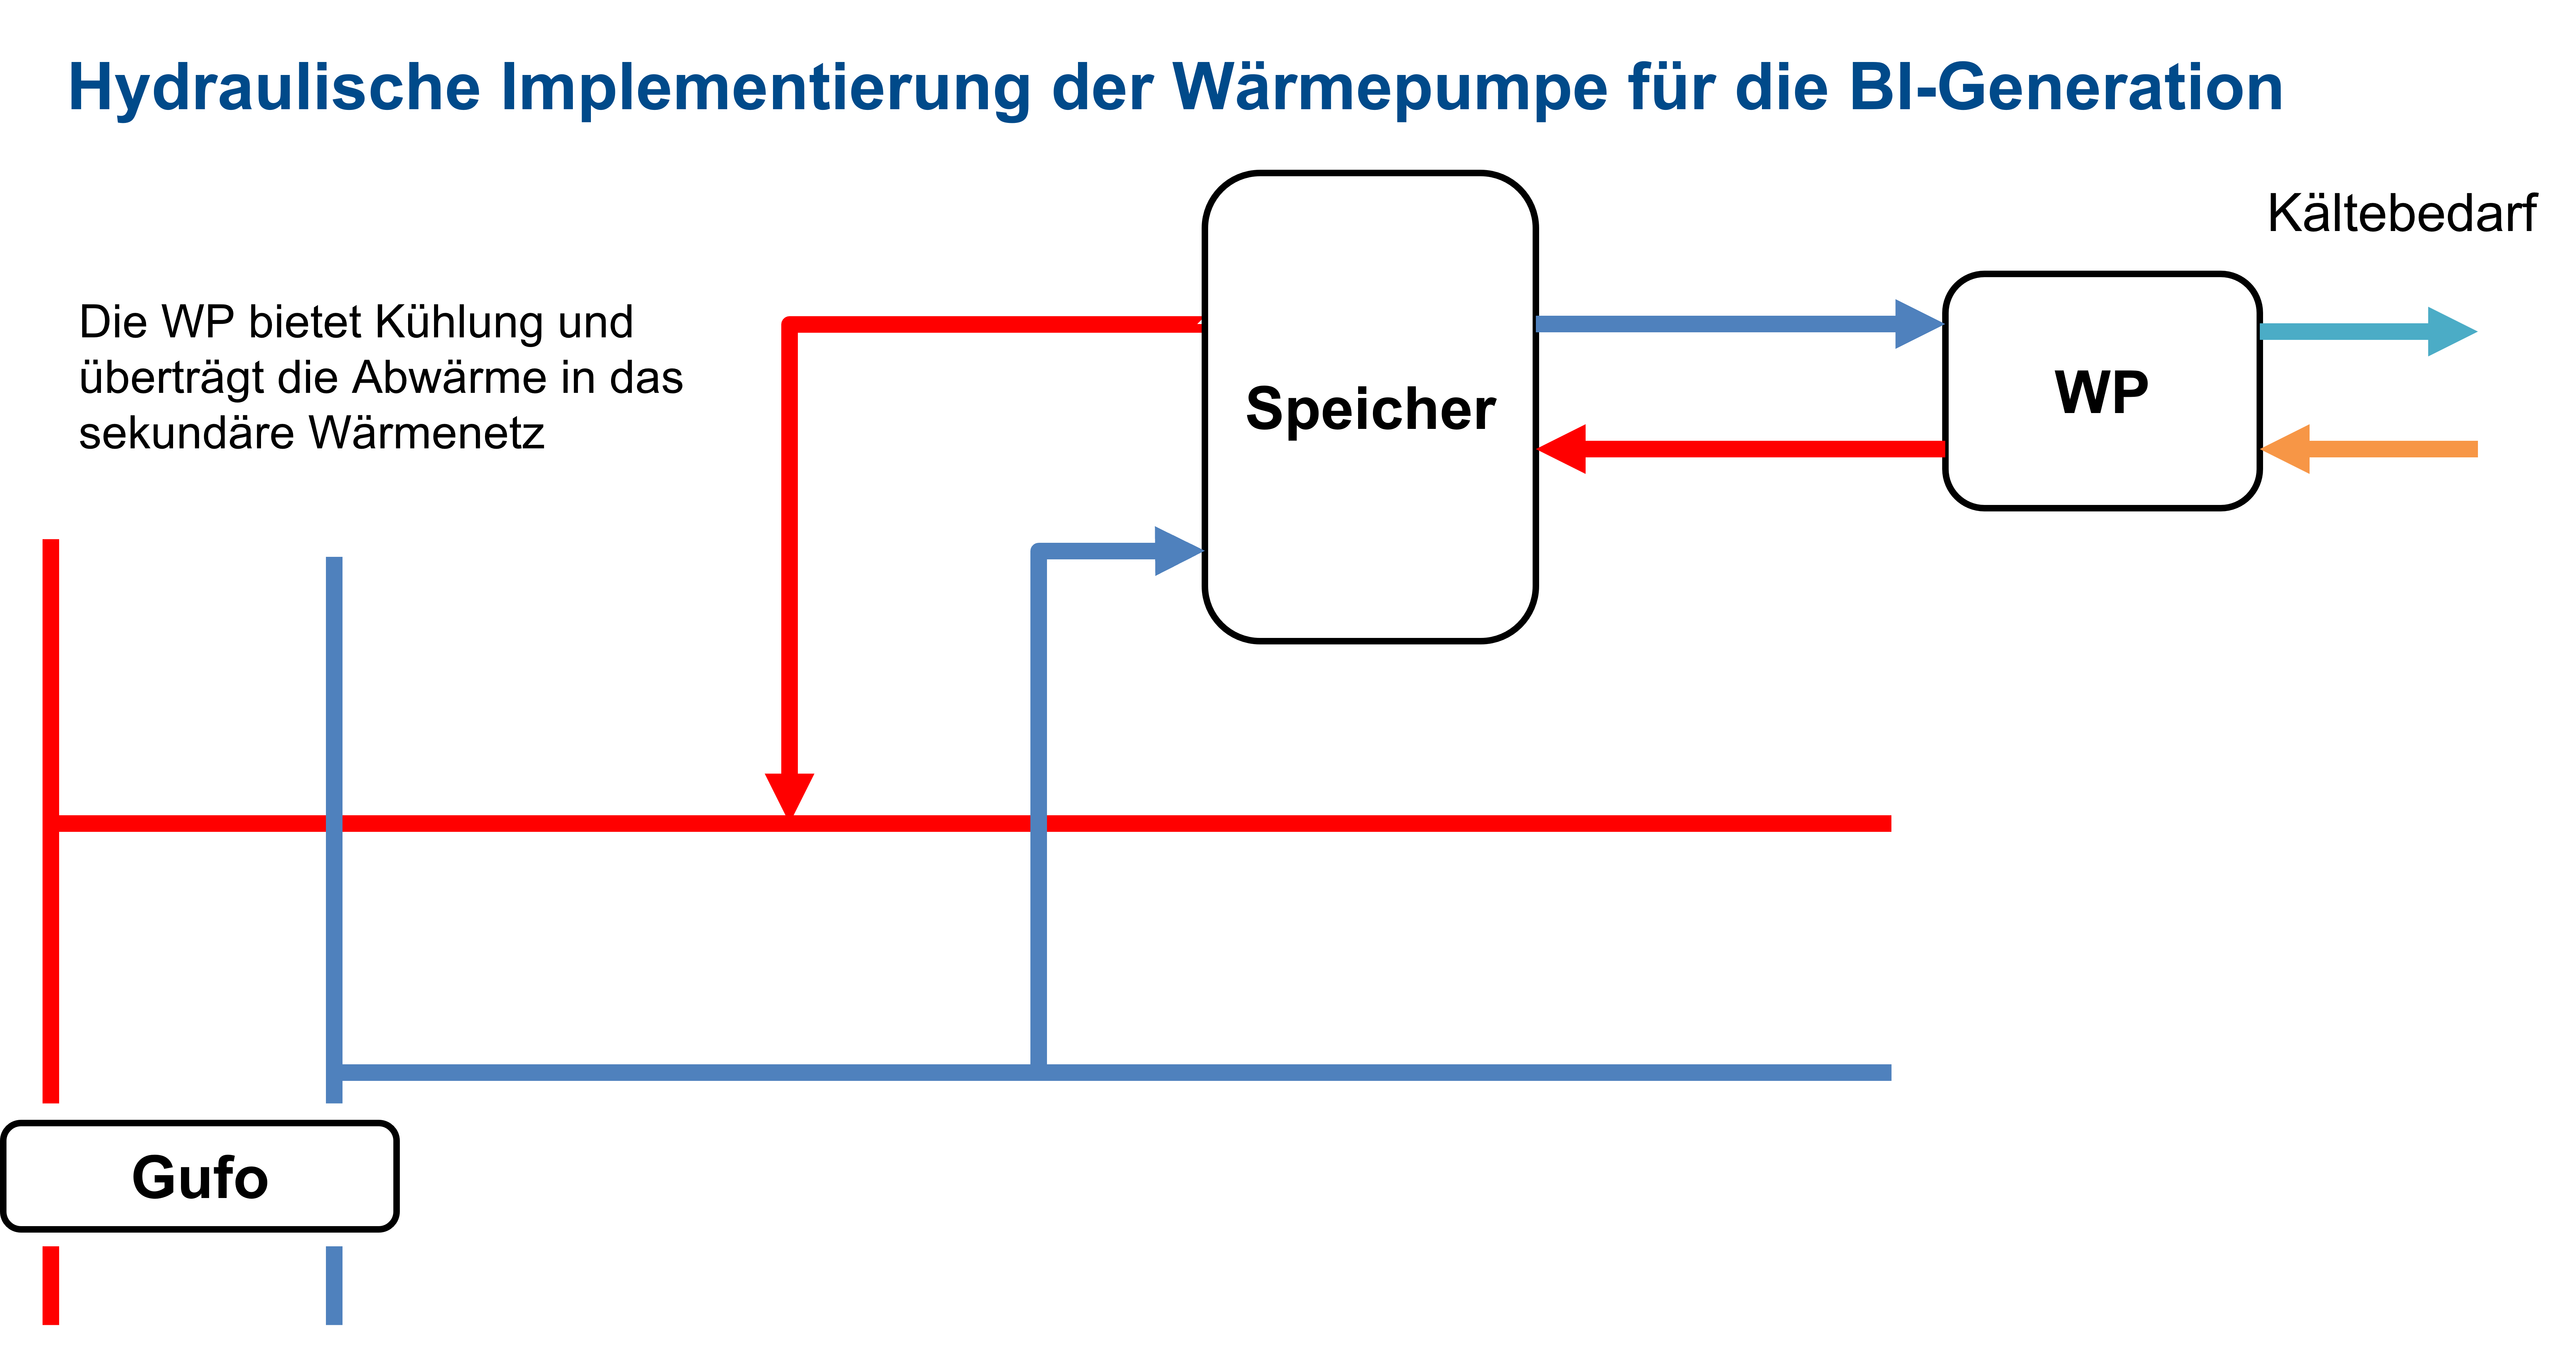
BI-Generation
Hydraulic integration of the heat pump for BI-Generation
Copyright: AEE INTEC Gradl
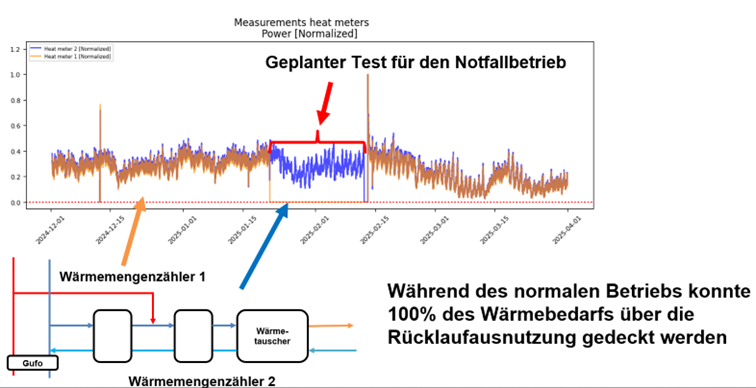
BI-Generation Monitoring Results
Monitoring Data of the Operation of the heat pump
Copyright: AEE INTEC Gradl
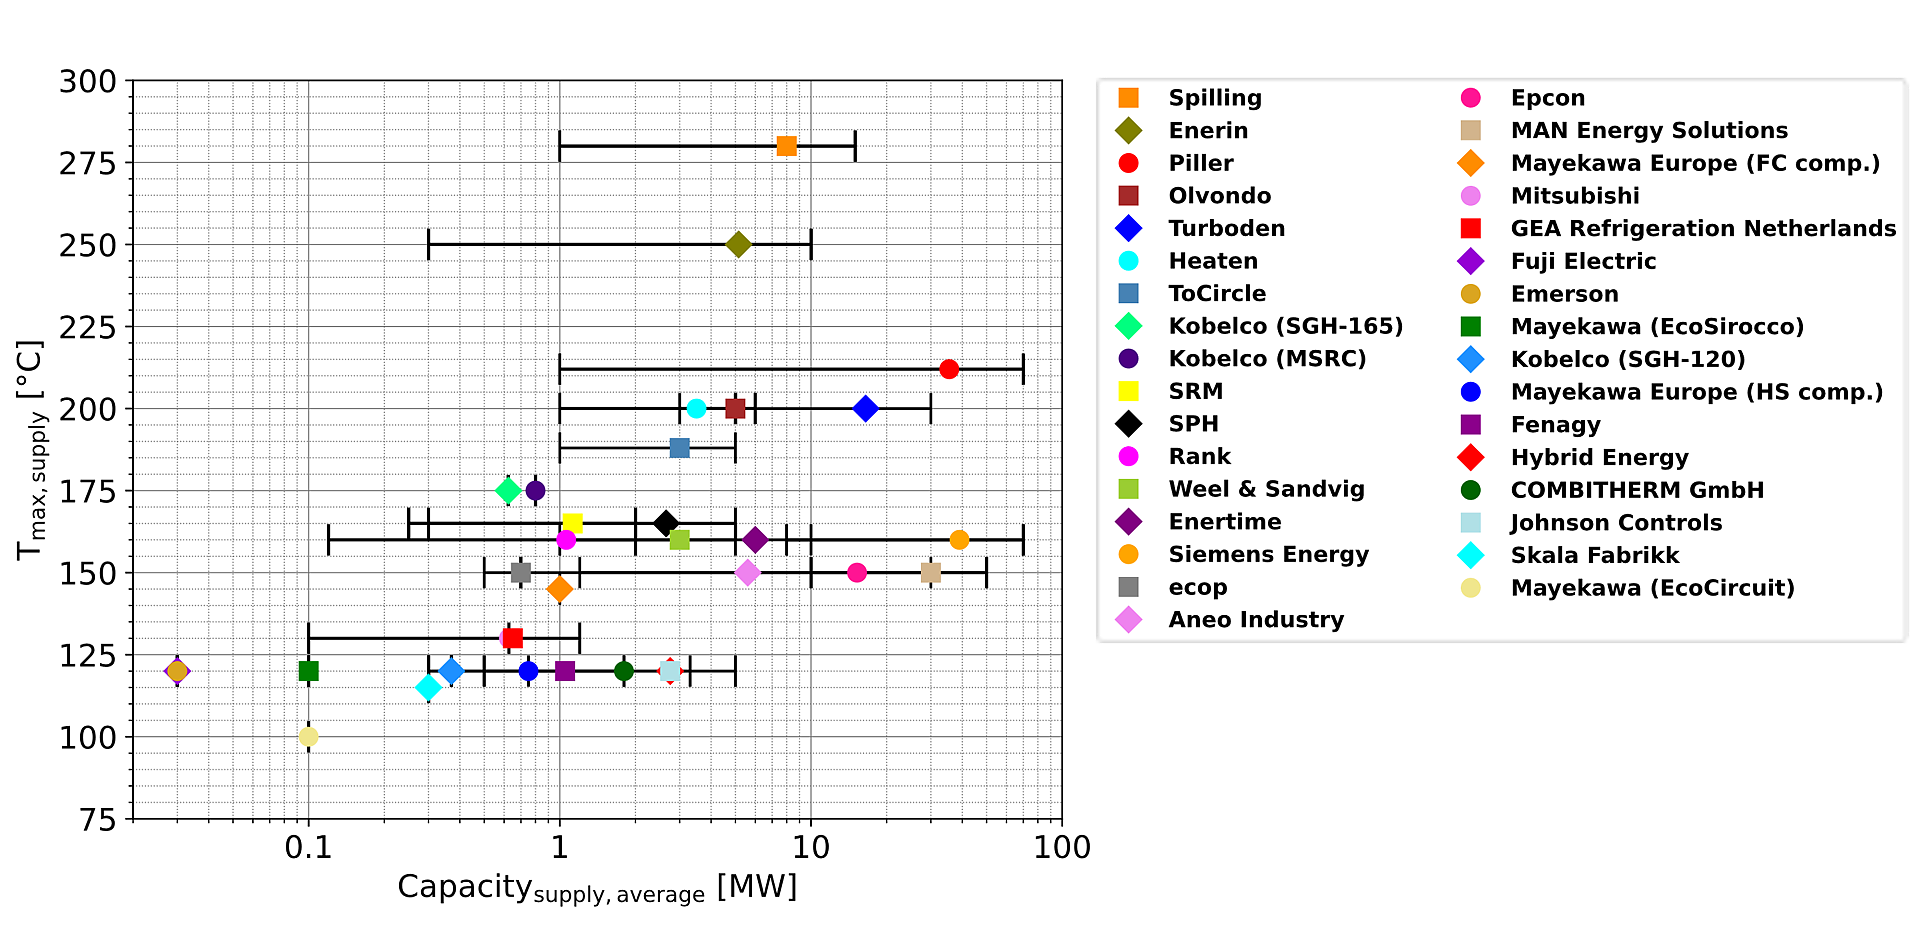
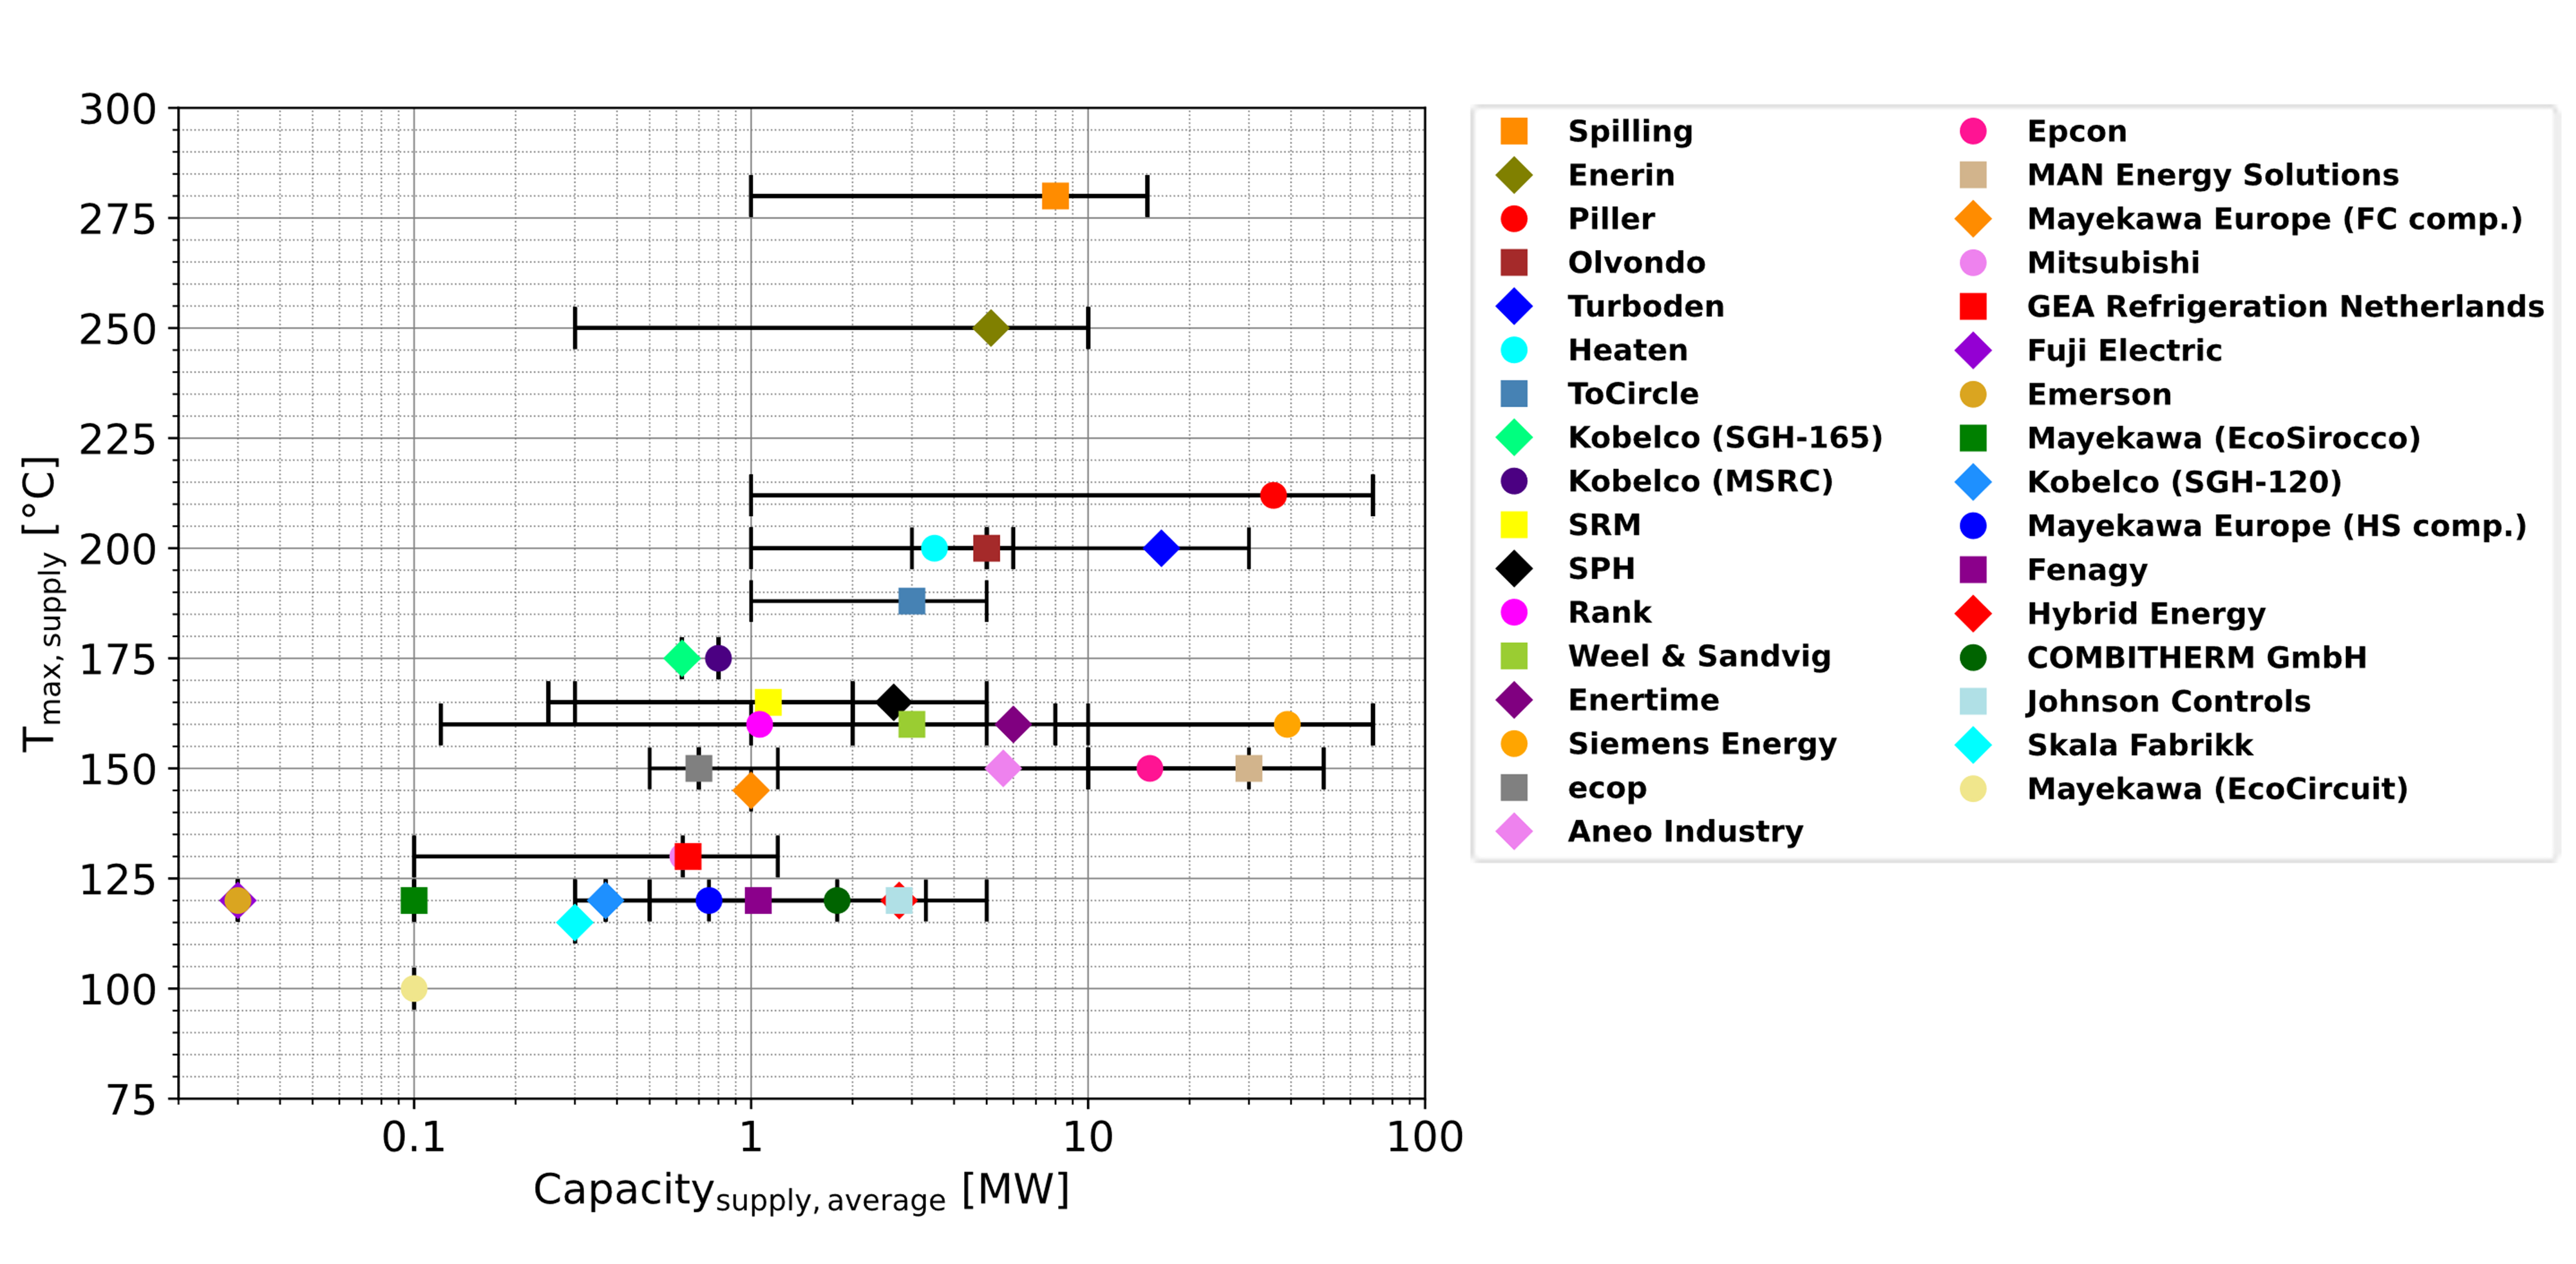
Maximum supply temperature as a function of heat capacity
The graphic shows the maximum supply temperature of high-temperature heat pump technologies from different manufacturers as a function of the heat capacity. More information on the individual technologies is published on the IEA HPT Annex 58 website (https://heatpumpingtechnologies.org/annex58/task1/).
Copyright: Danish Technological Institute
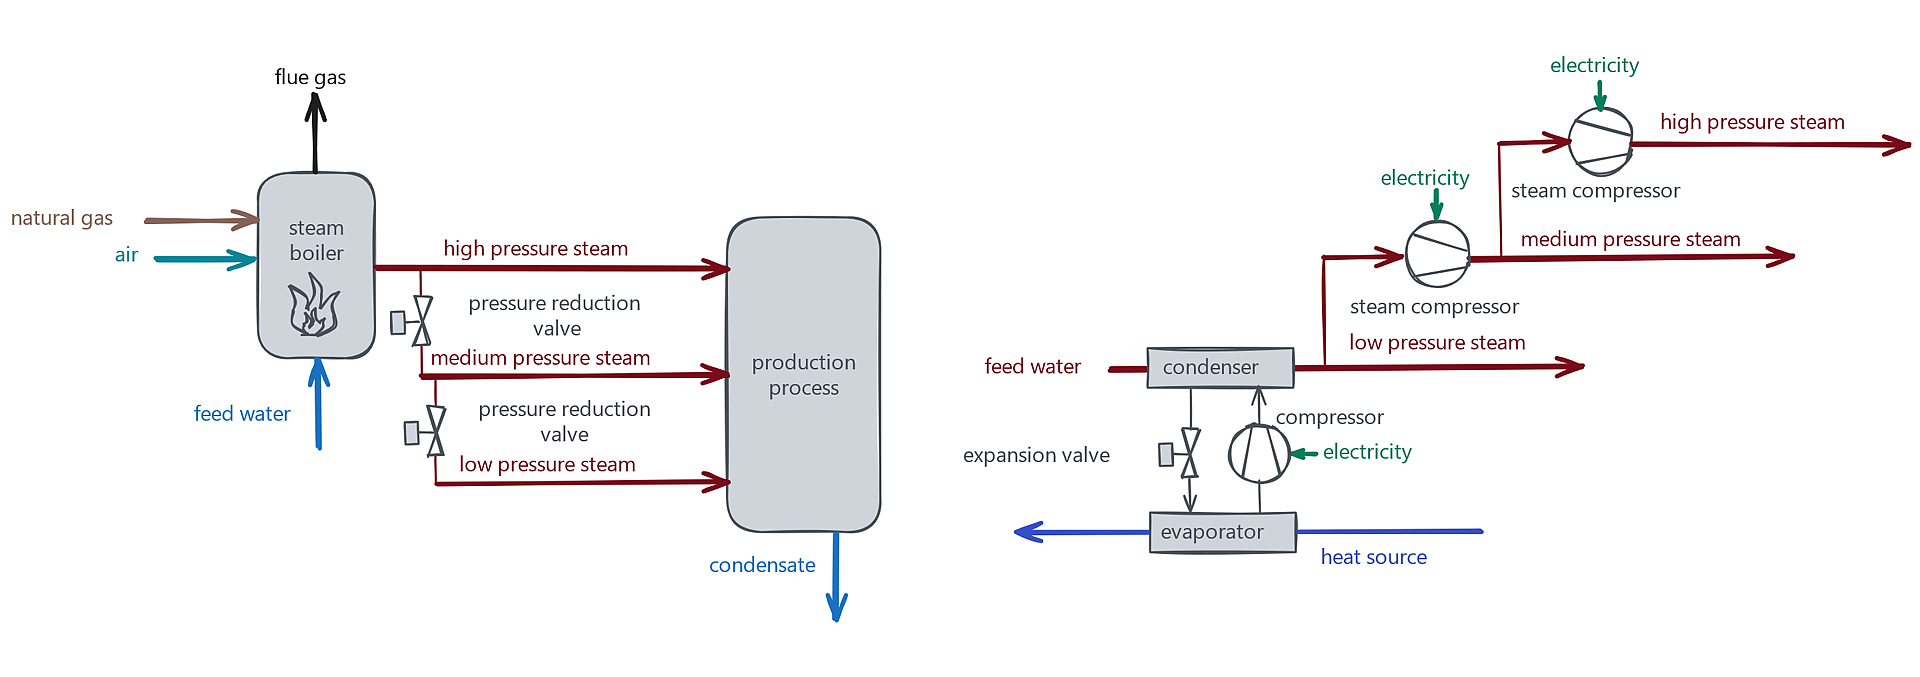
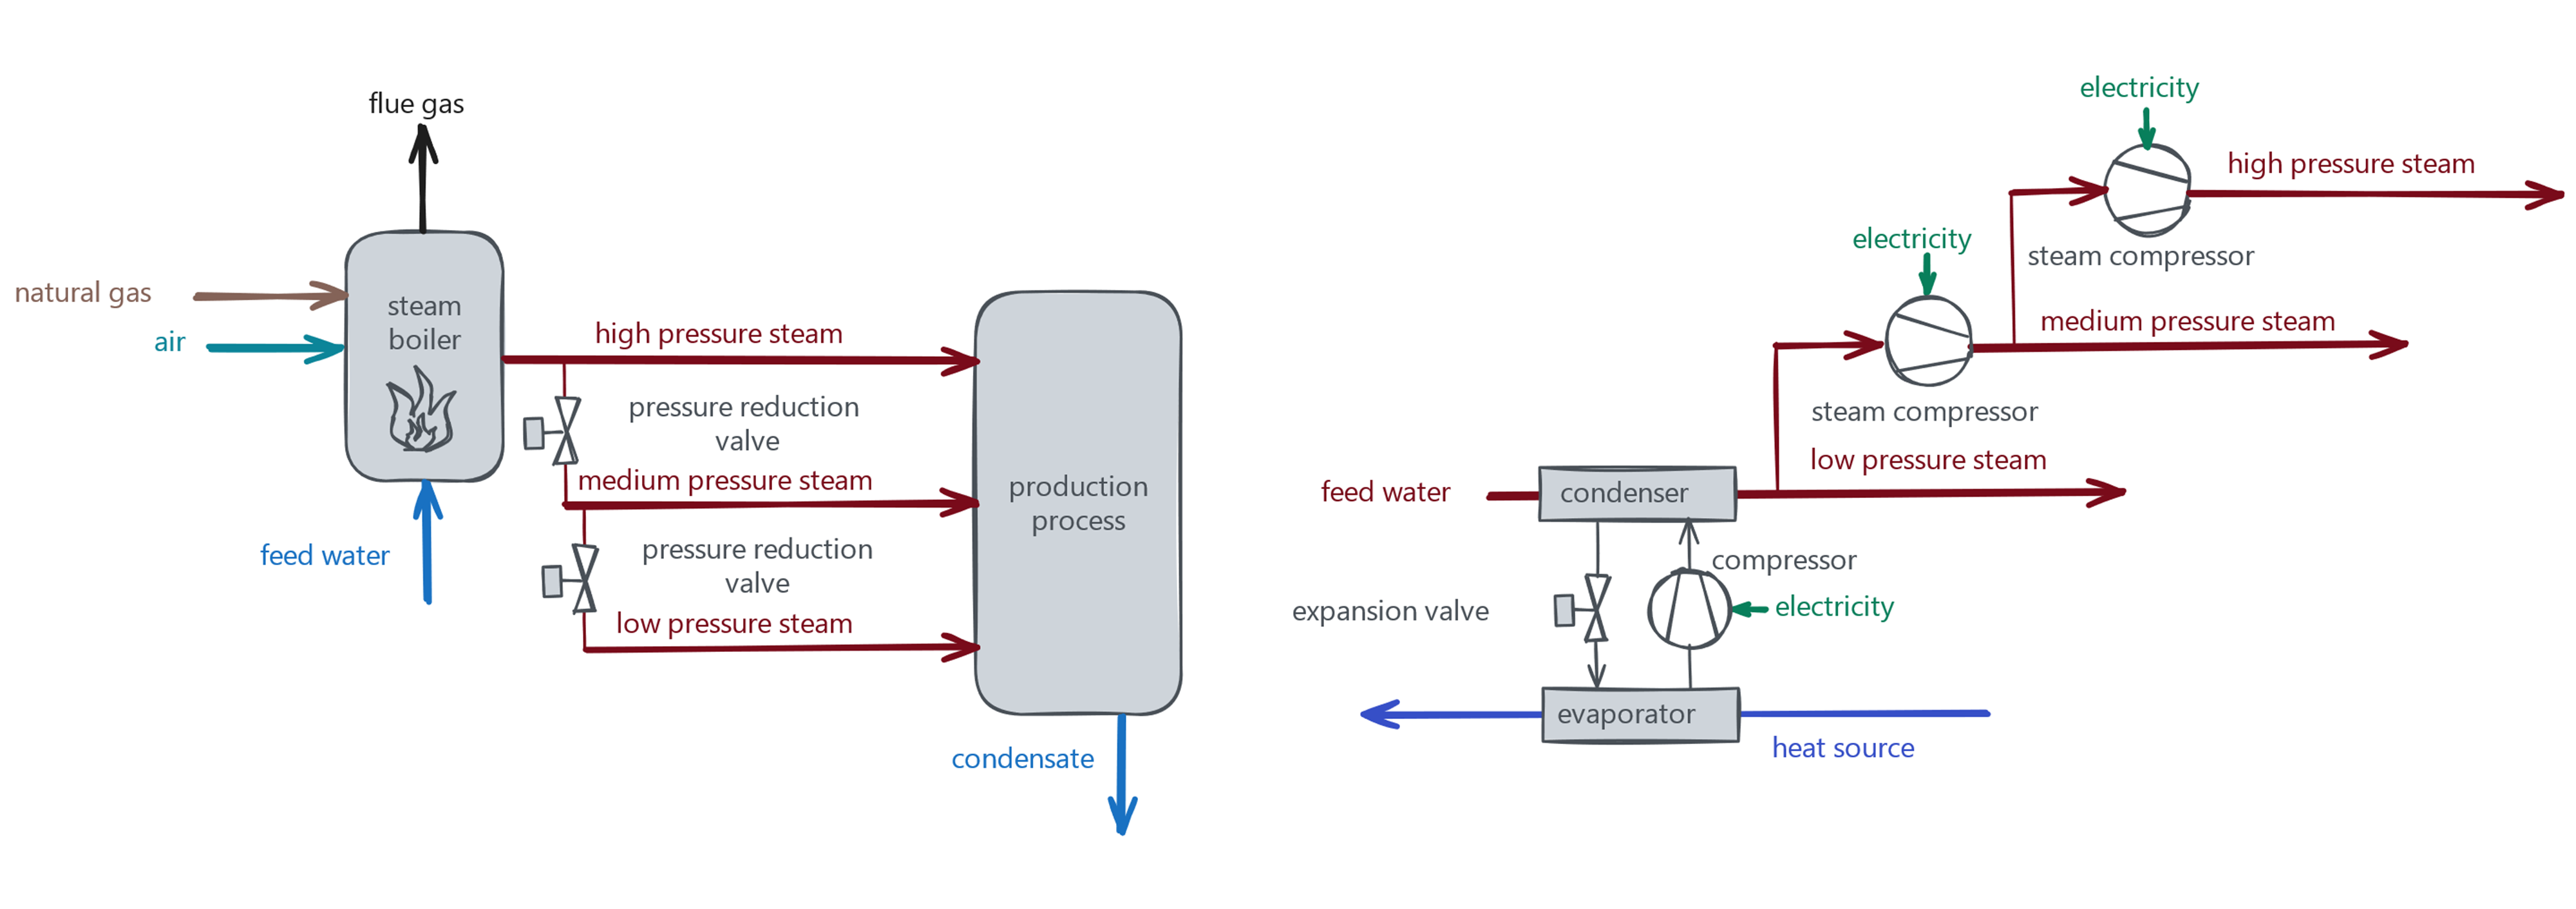
General comparison between steam generation with natural gas-fired boilers and heat pump technologies
The graphic shows conventional steam generation with natural gas-fired boilers compared to steam generation with heat pump technologies. In steam generation with natural gas-fired boilers, the steam is generated at least at the highest pressure level needed in the production process and then expanded to lower pressure levels. In comparison, when generating steam with a heat pump, it is advantageous if only the amount of steam required at the corresponding pressure level is also generated at this pressure level. Expansion to a lower temperature level should be avoided when using heat pumps. More information on steam generation with heat pumps can be found in the IEA HPT Annex 58 Task 2 report (https://heatpumpingtechnologies.org/annex58/task-2-integration-concepts/).
Copyright: AIT Austrian Institute of Technology GmbH

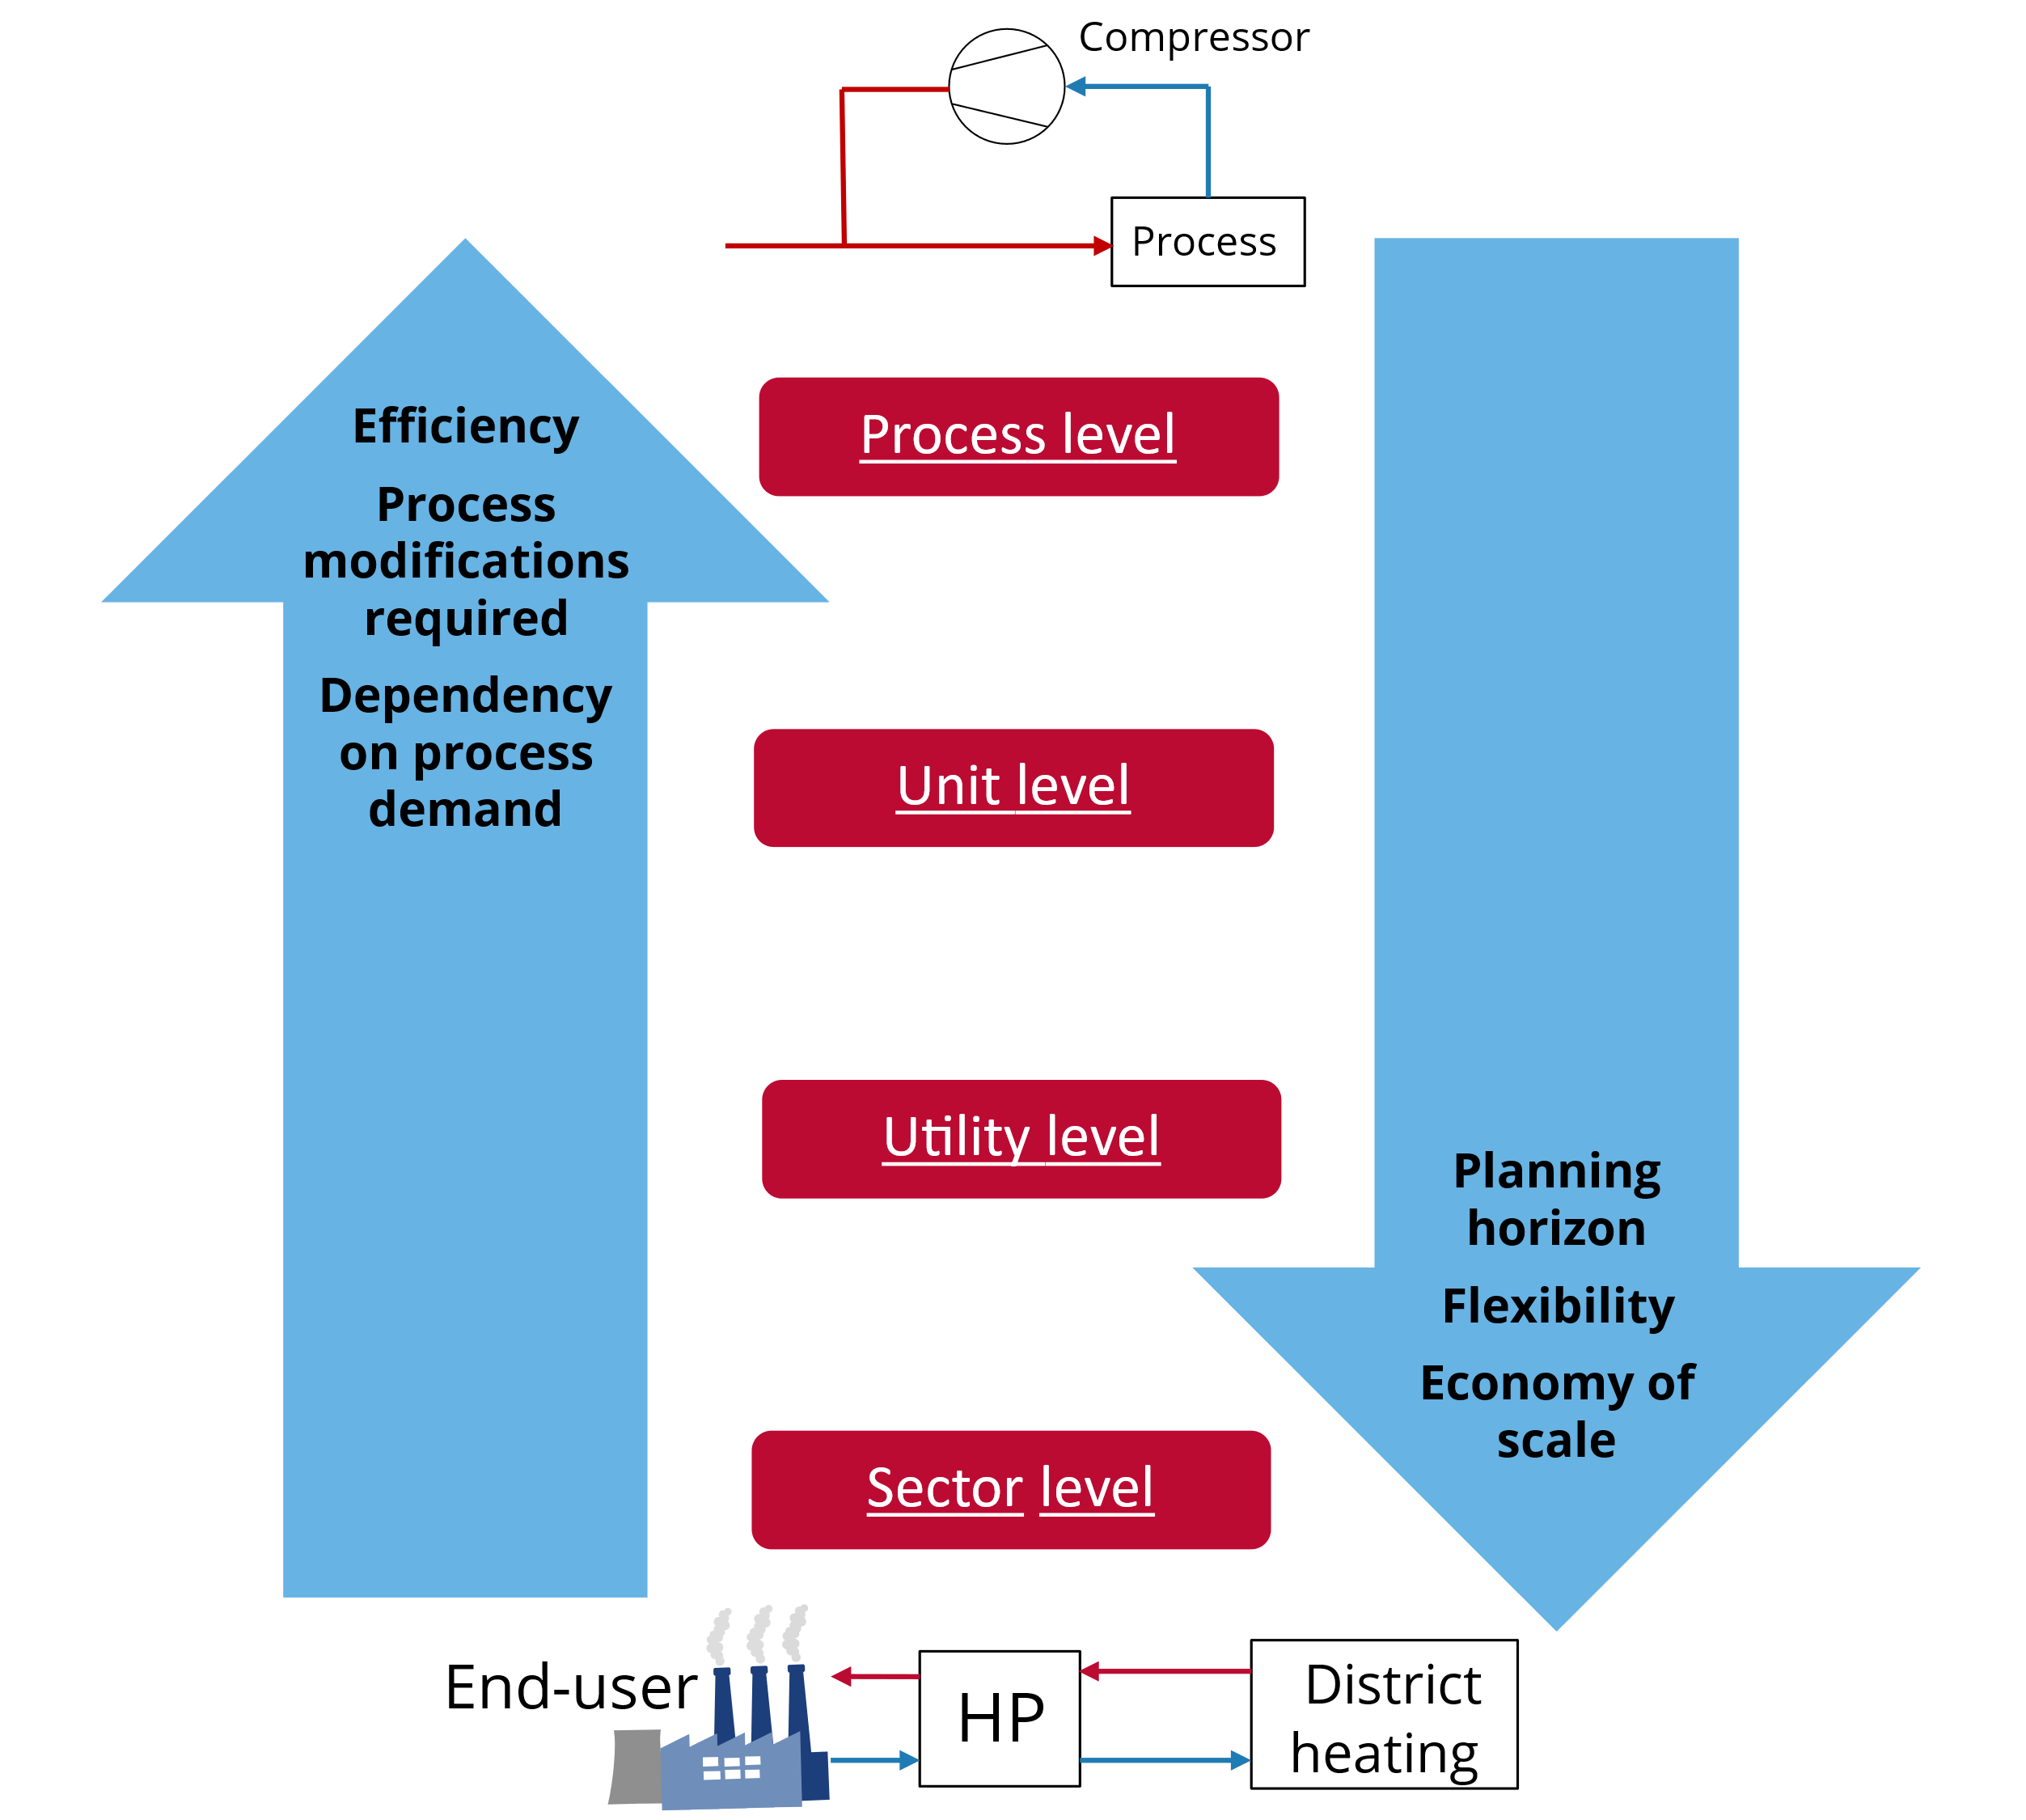
Different integration levels of high-temperature heat pumps and their effects
The graphic shows various levels at which the integration of a high-temperature heat pump can take place, as well as the effects. A more detailed description can be found in the Task 3 report of the IEA HPT Annex 58 and in the guideline for the development of a decarbonization strategy (https://heatpumpingtechnologies.org/annex58/task-3/).
Copyright: Danish Technological Institute

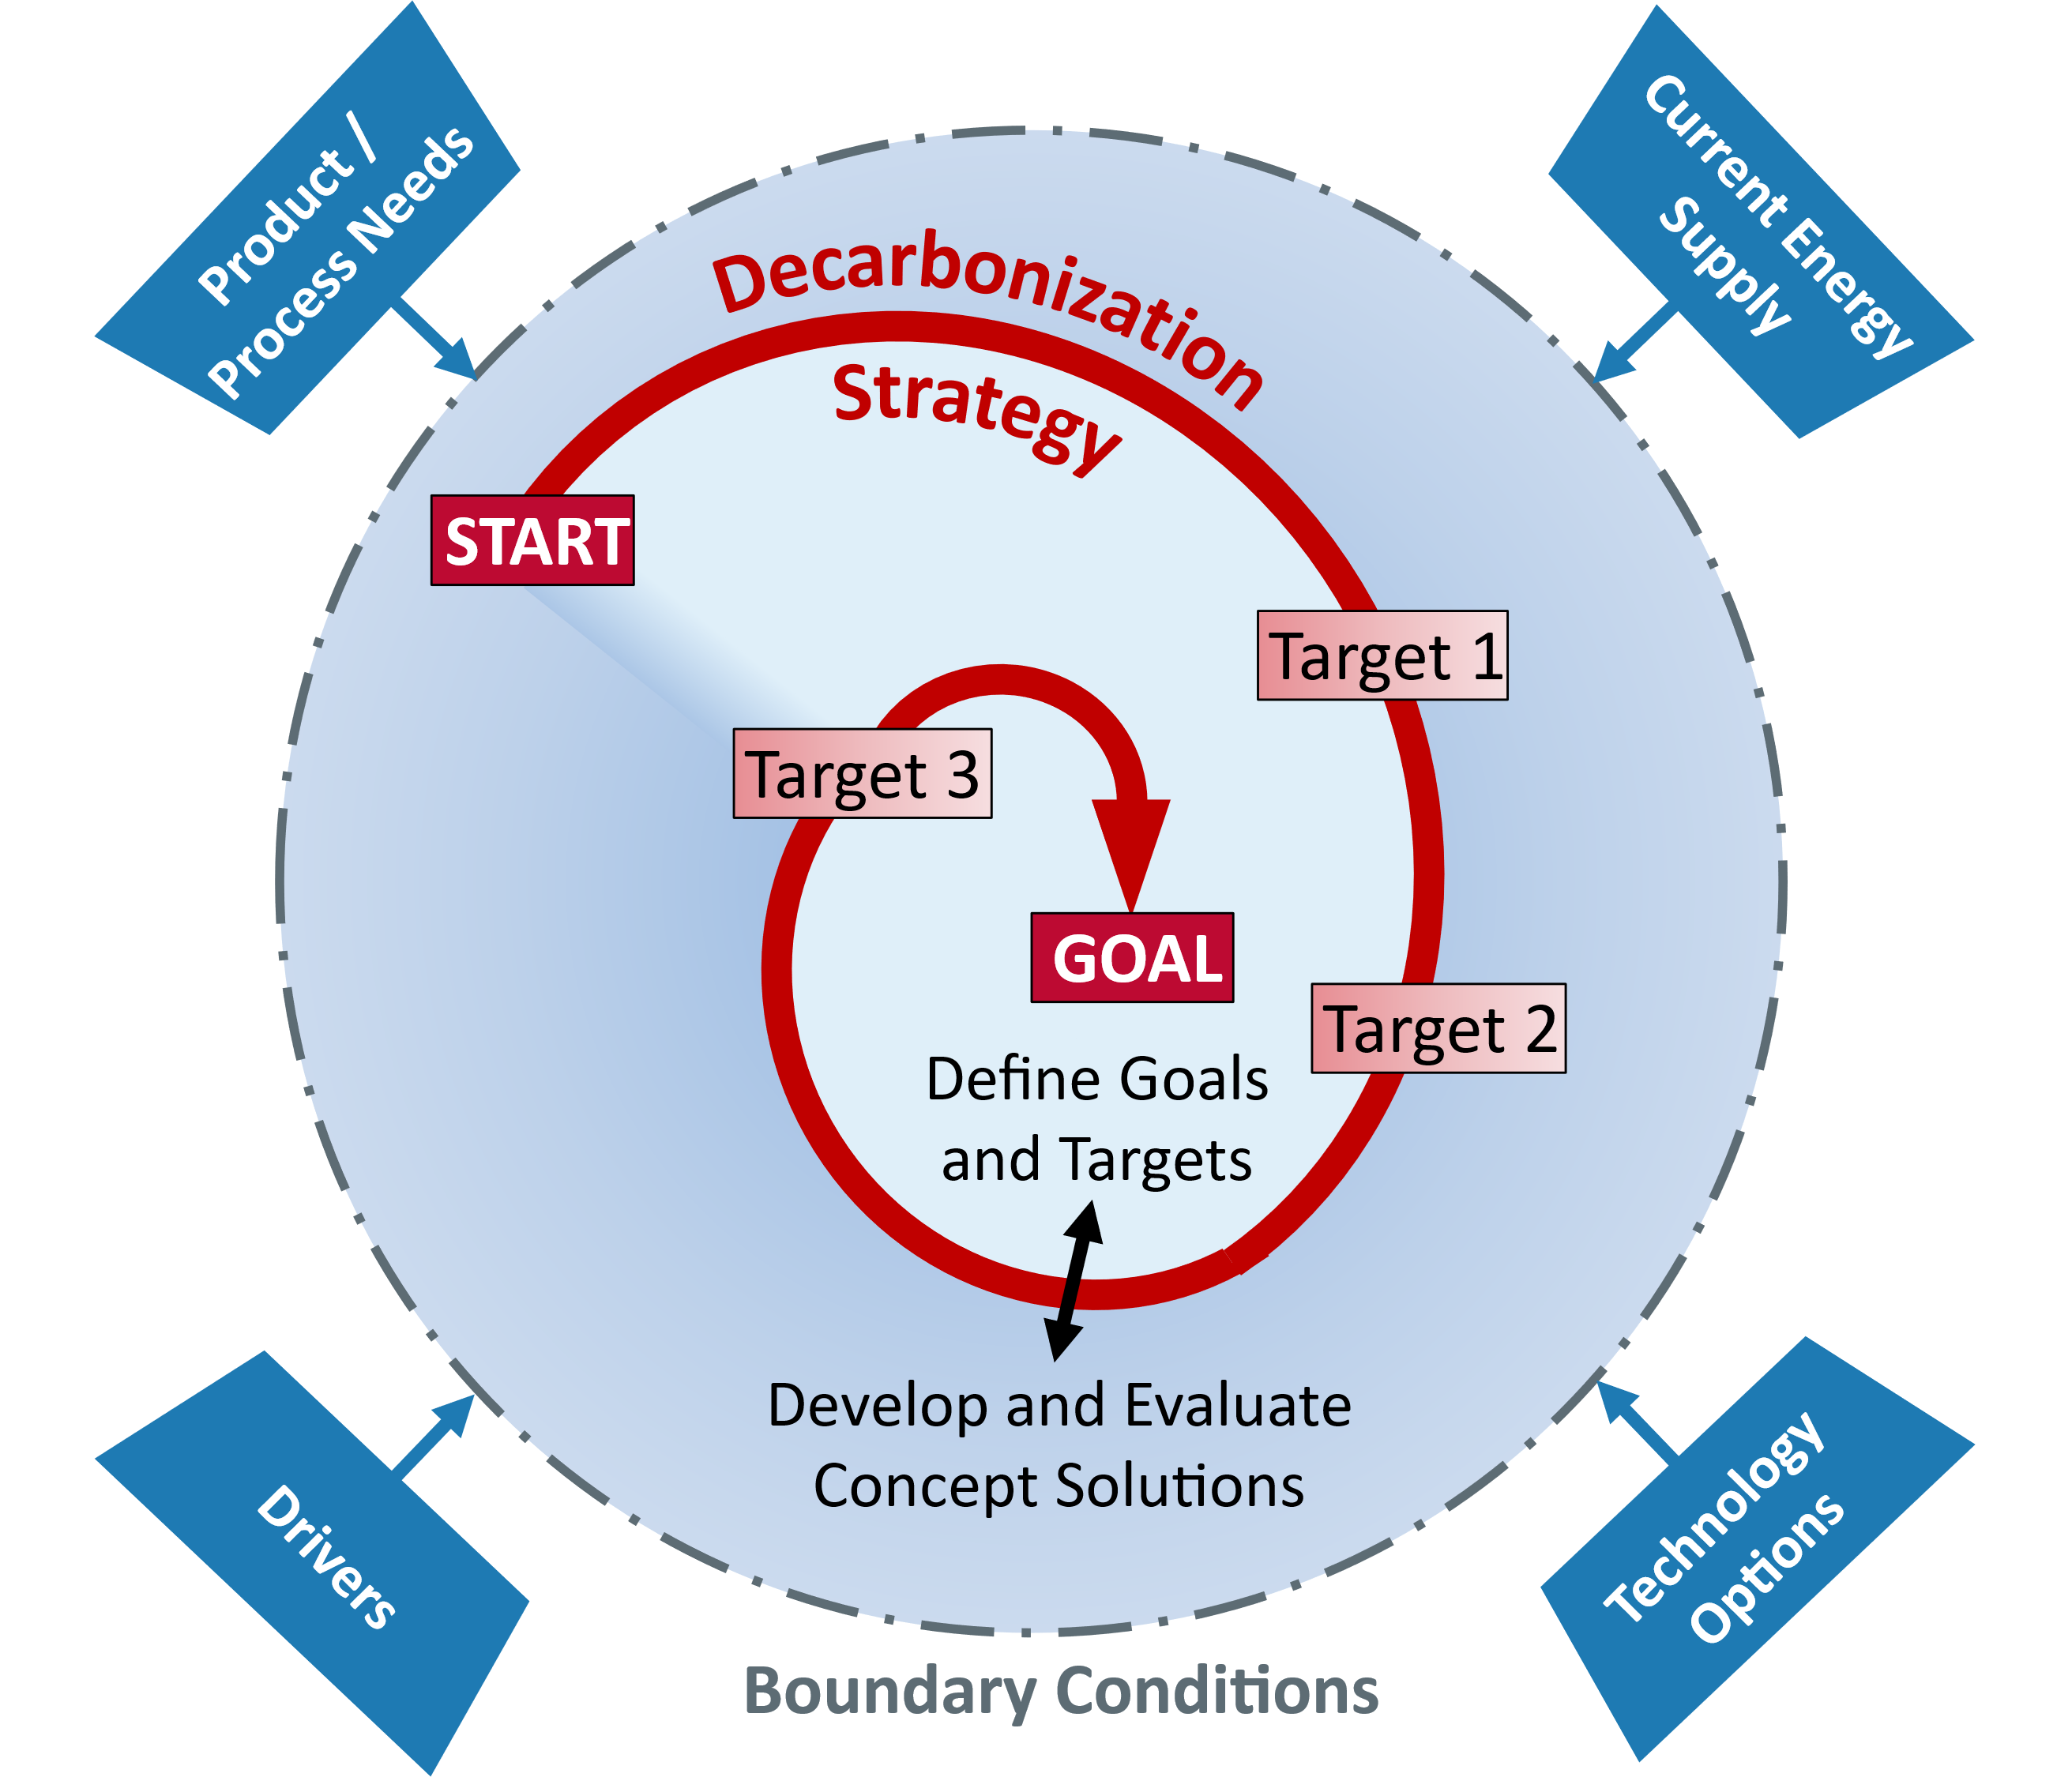
Connections in the development of a decarbonization strategy
The graphic shows different parts and influencing factors in the development of a decarbonization strategy for an industrial company. More information can be found in the Task 3 report of the IEA HPT Annex 58 (https://heatpumpingtechnologies.org/annex58/task-3/).
Copyright: TU Graz und AIT Austrian Institute of Technology GmbH
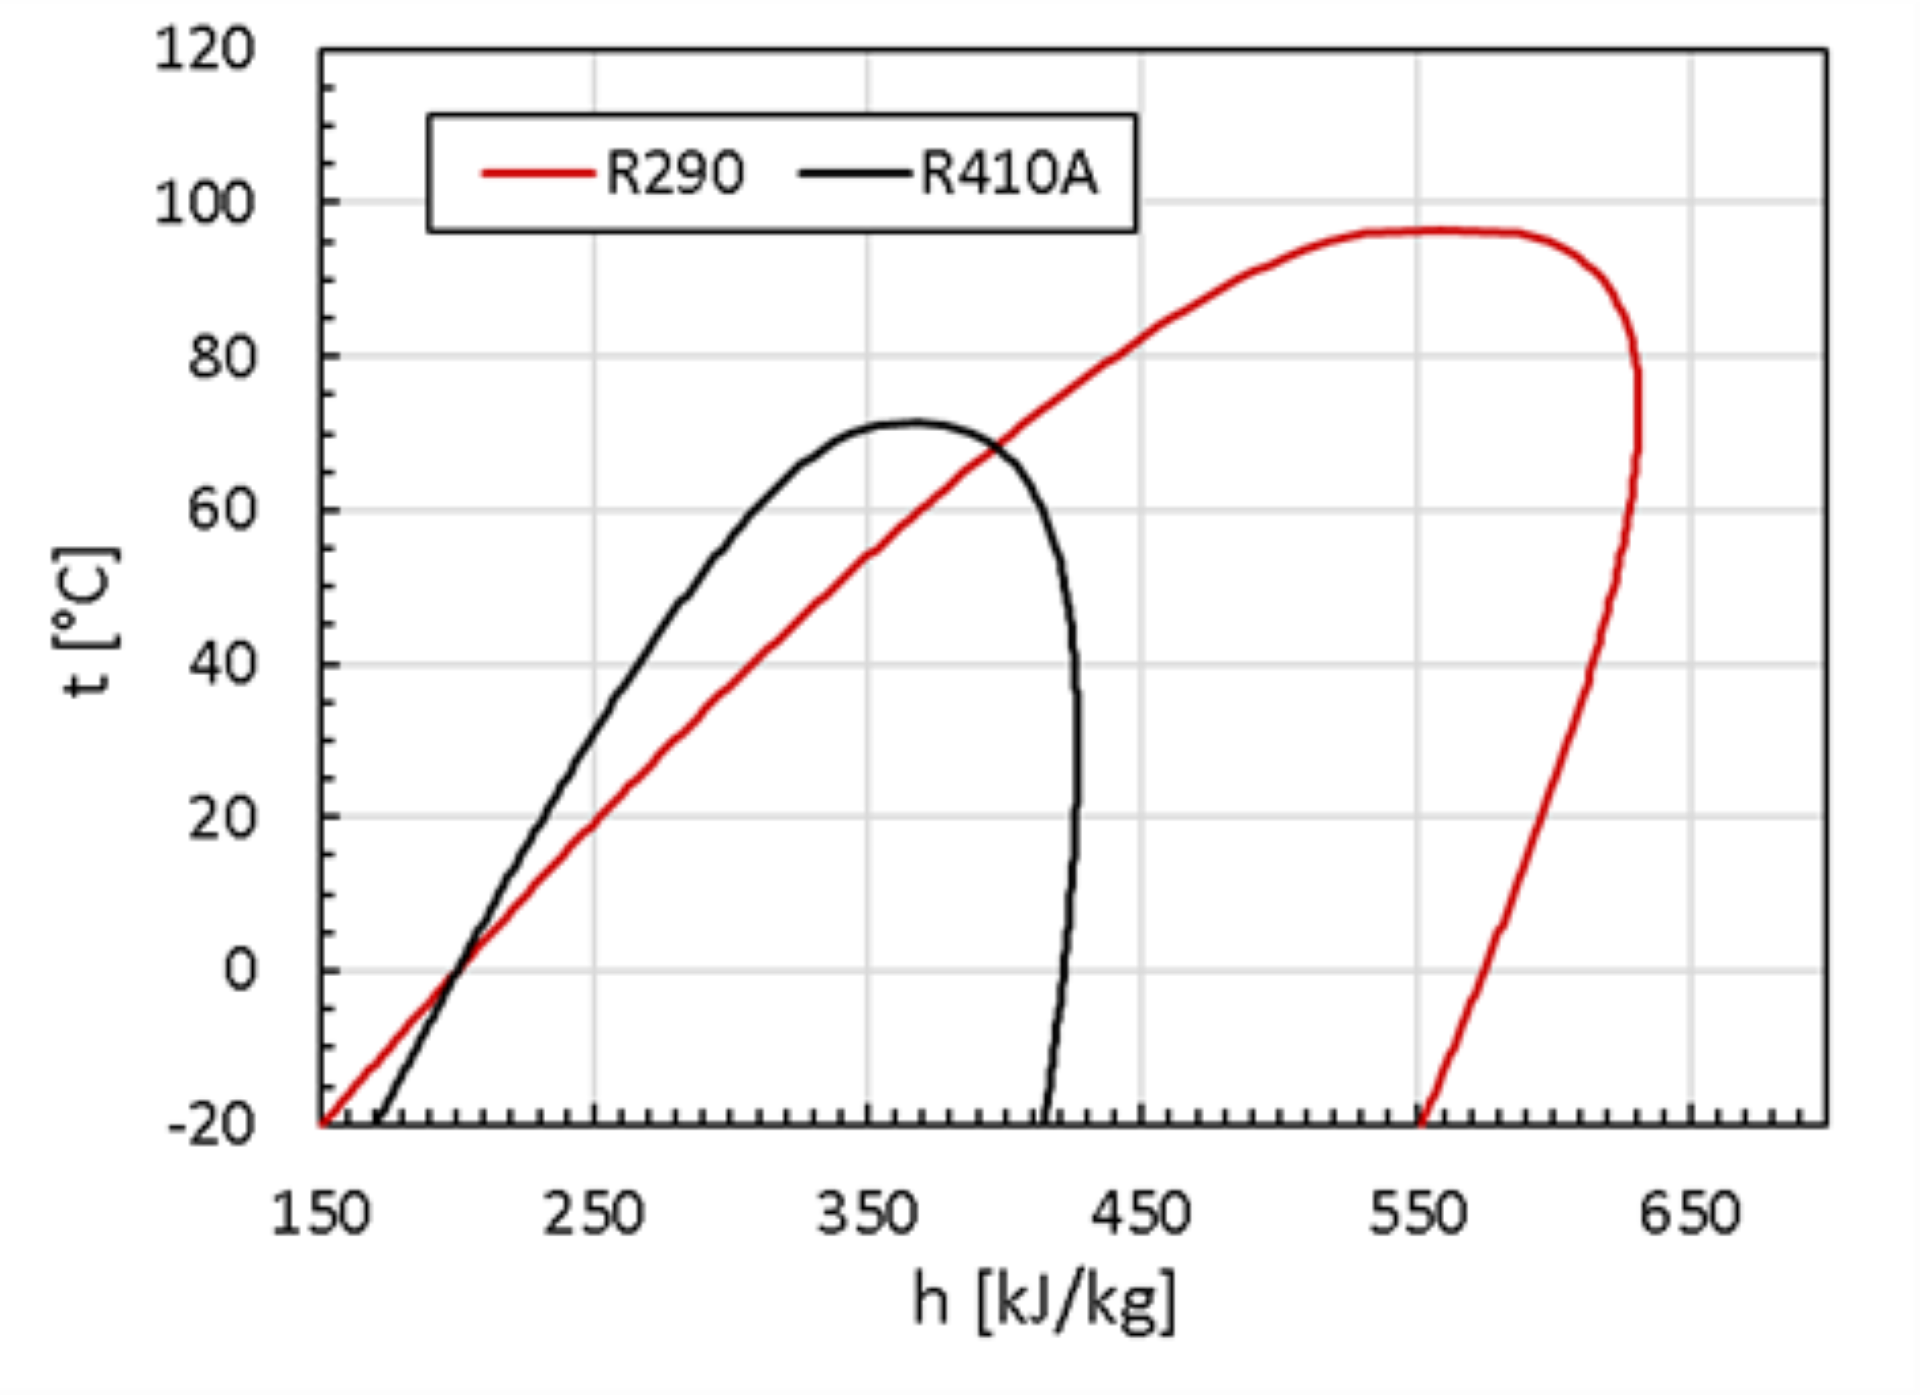
t/h diagrams of the refrigerants R290 and R410A
The comparison of the t/h diagrams of the refrigerants R410A and R290 shown in the figure shows the higher evaporation enthalpy of R290 and the difference in the critical temperatures.
Copyright: Institut für Wärmetechnik, TU Graz
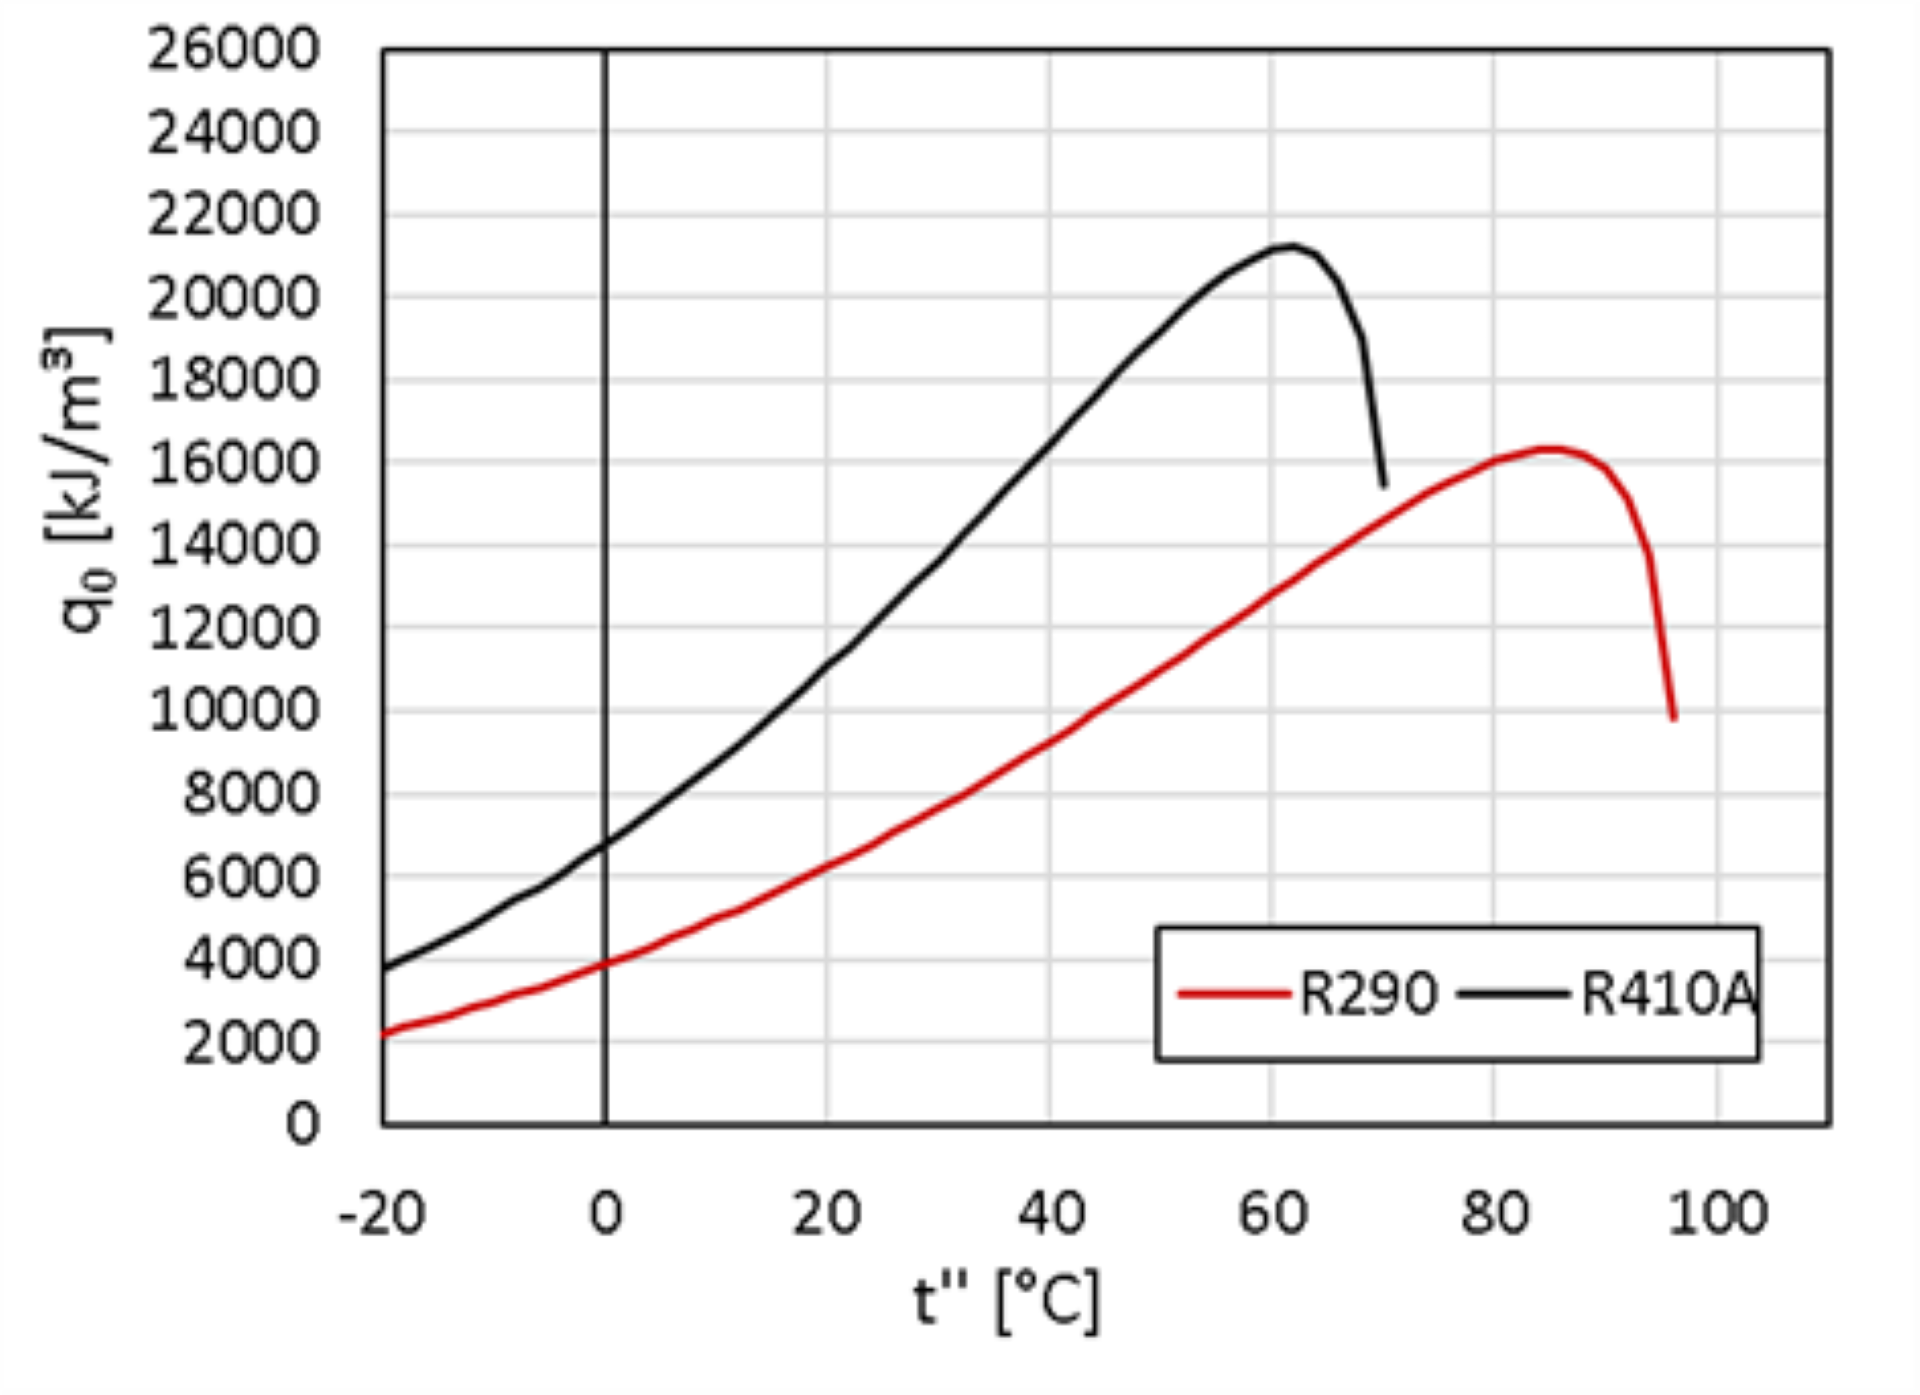
Volumetric cooling capacity of the refrigerants R290 and R410A
The figure shows the volumetric cooling capacity of R290 and R410A as a function of the dew point temperature.
Copyright: Institut für Wärmetechnik, TU Graz
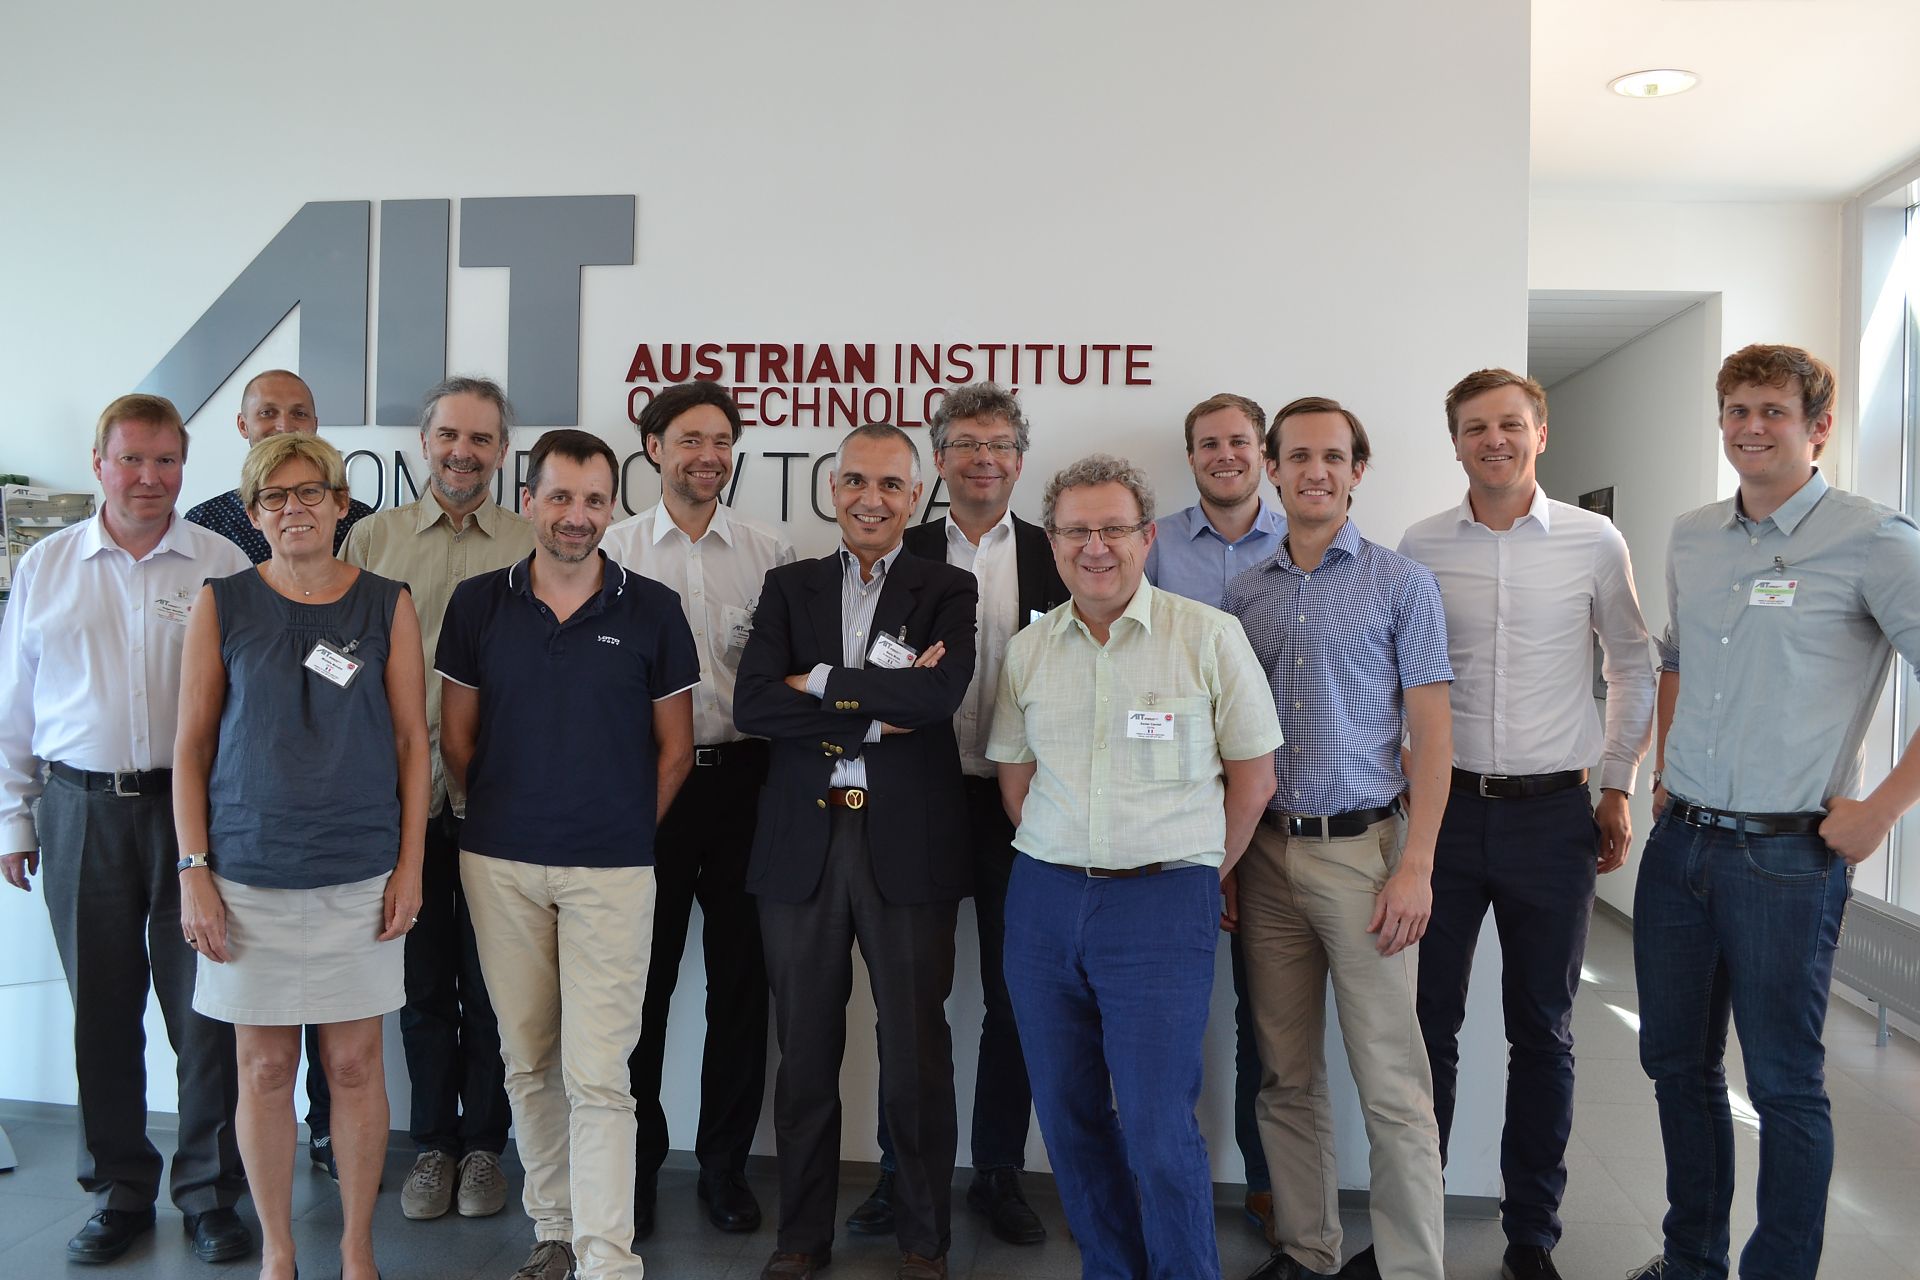
Group photo of the IEA HPT Annex 51 team
Group photo of the IEA HPT Annex 51 team at the kickoff meeting at AIT in Vienna from 20-21 June 2017.
Copyright: AIT, Österreich

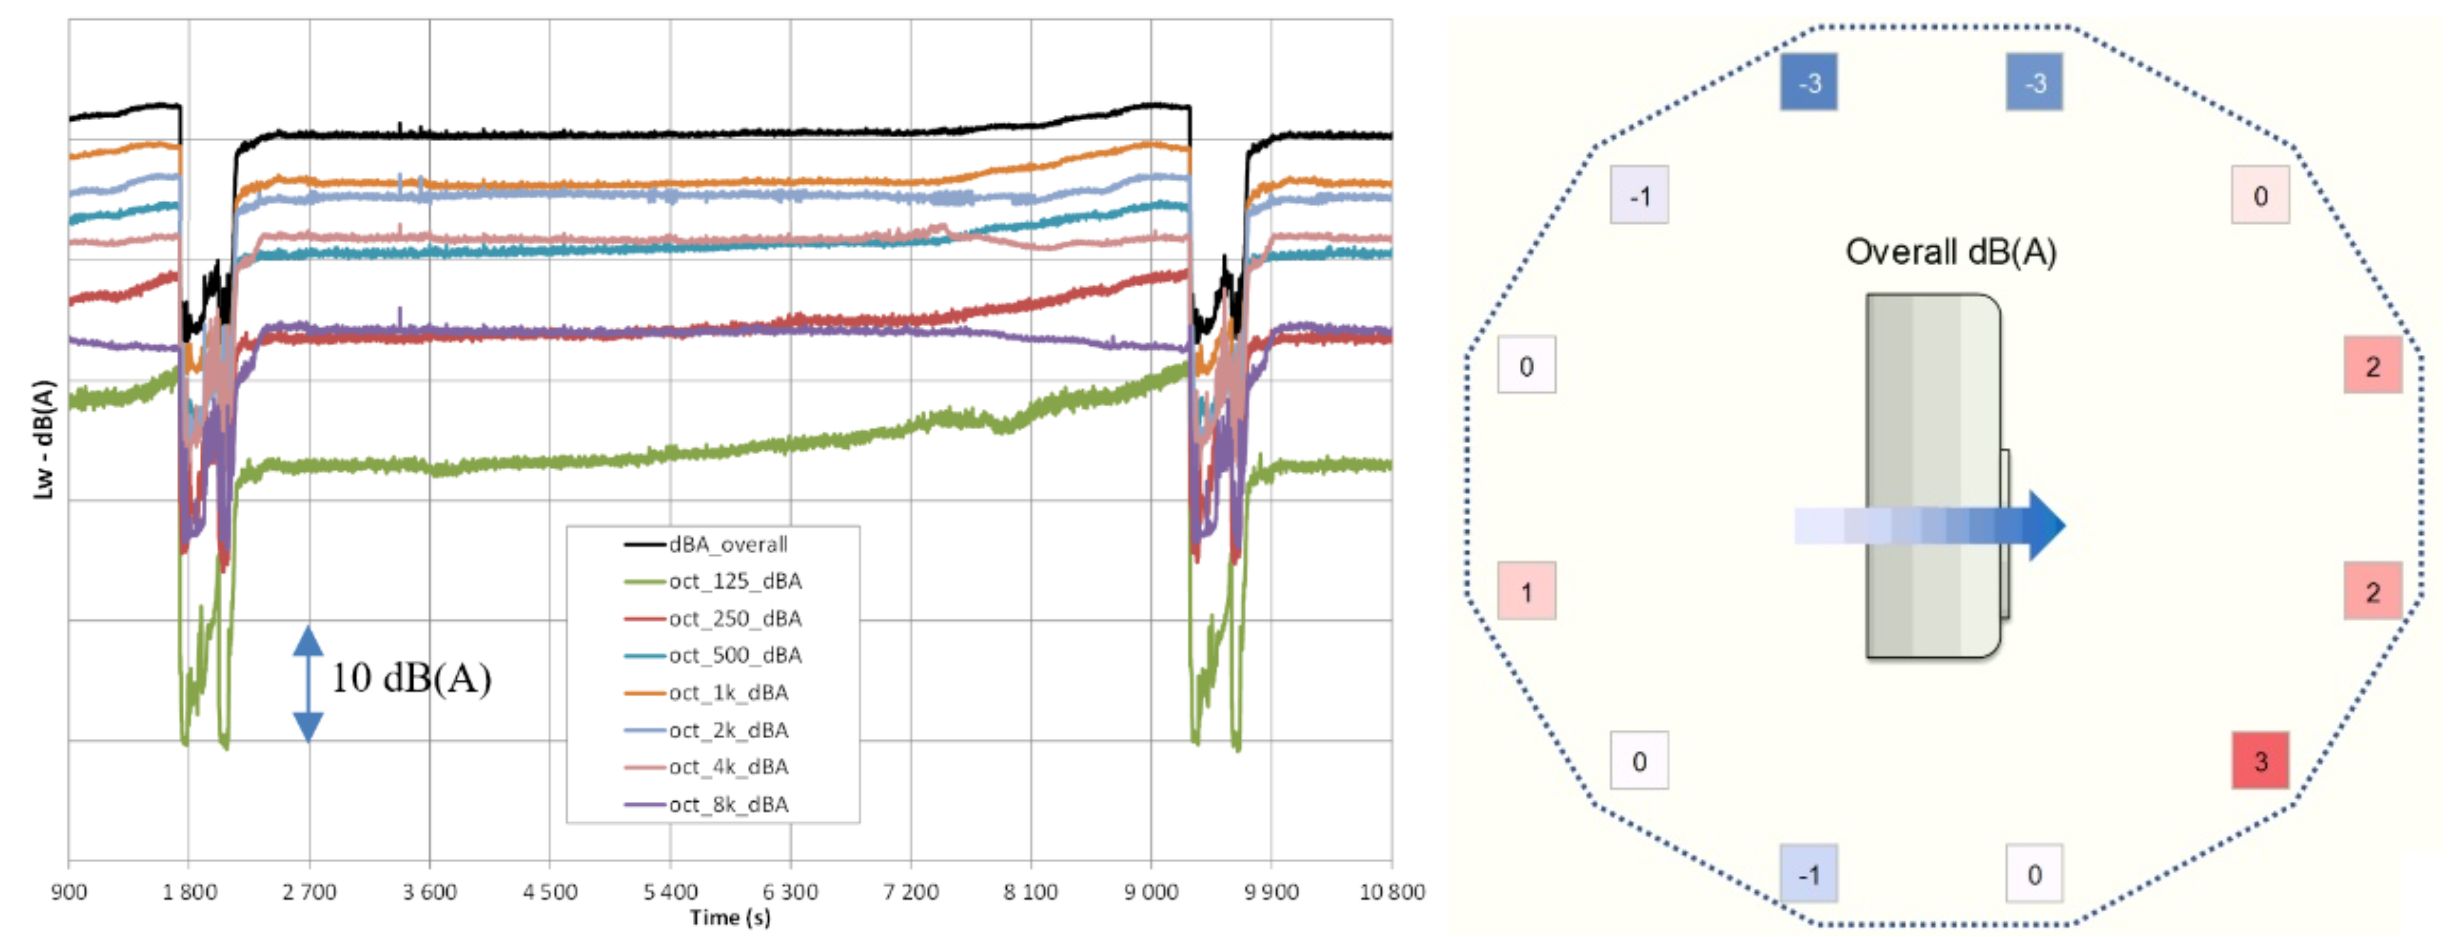
Time evolution of sound power level and radiation pattern
(left) Time-dependent A-weighted sound power level (in octave bands) between two de-frosting phases. (right) Directivity for the A-weighted total sound pressure level at a height of 75 cm.