Project Image Pool
There are 98 results.
Terms of use: The pictures on this site originate from the projects in the frame of the programmes City of Tomorrow, Building of Tomorrow and the IEA Research Cooperation. They may be used credited for non-commercial purposes under the Creative Commons License Attribution-NonCommercial (CC BY-NC).

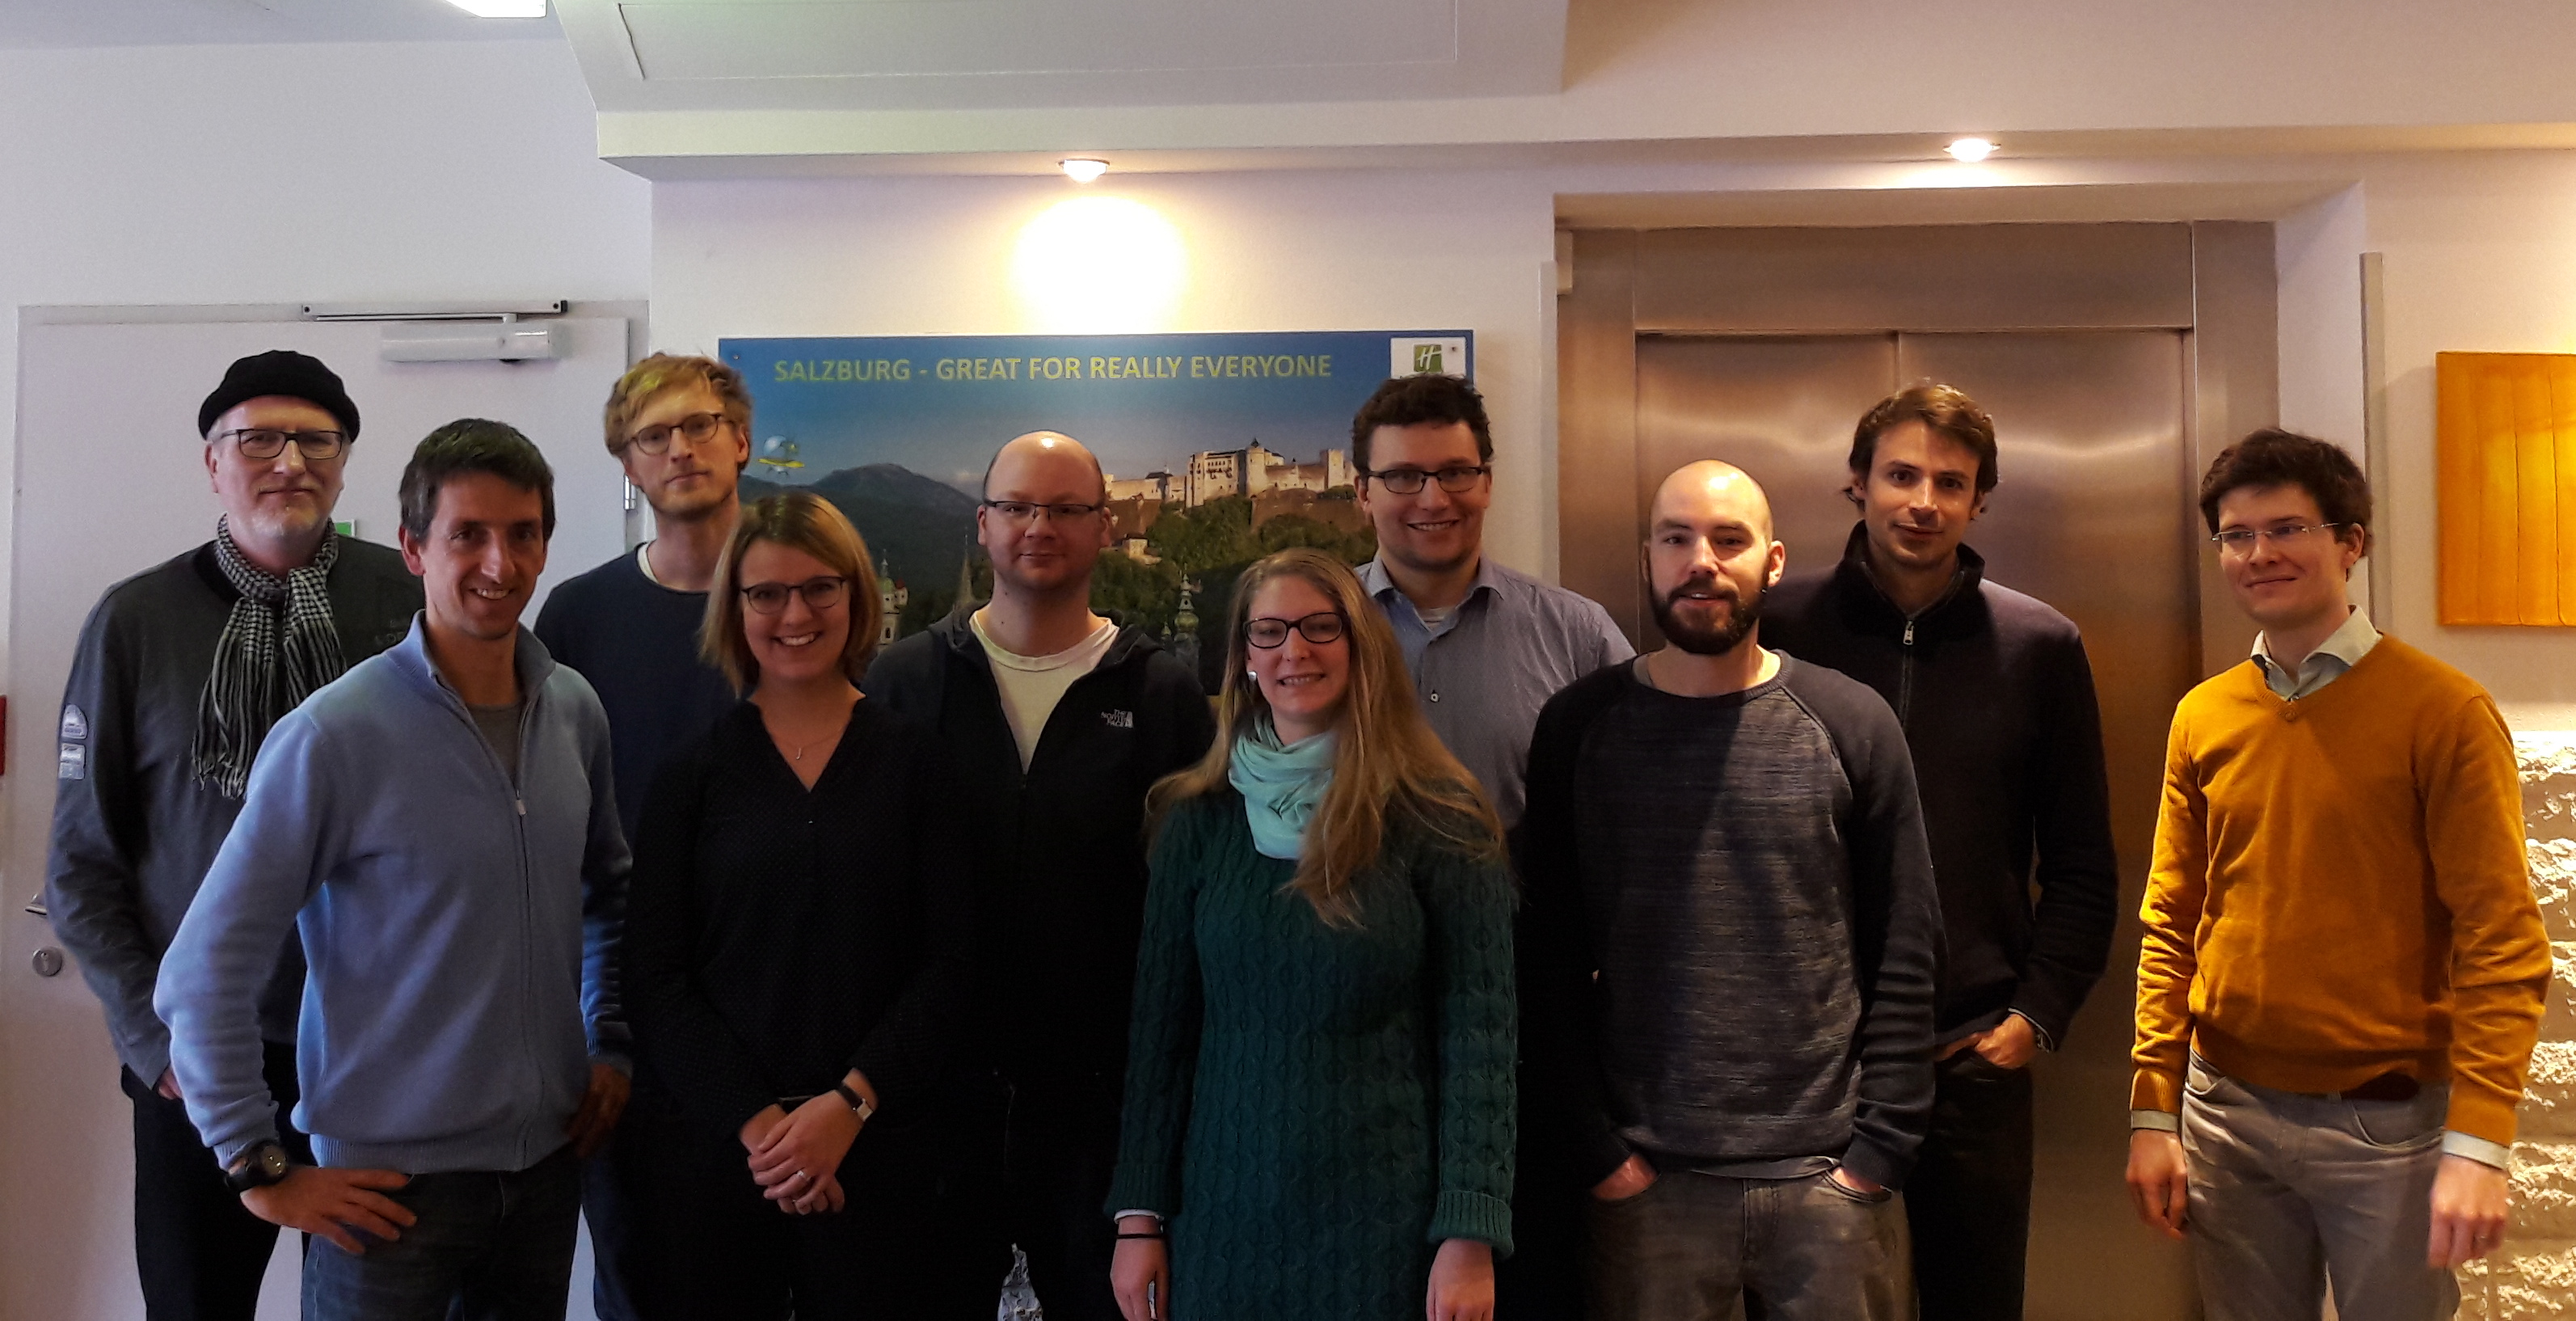
Poject meeting Salzburg
Participants in the Task 19 Workshop on risk analysis and risk assessment which was held in January 2018 in Salzburg.
Copyright: Energiewerkstatt Verein, IEA Wind Task 19
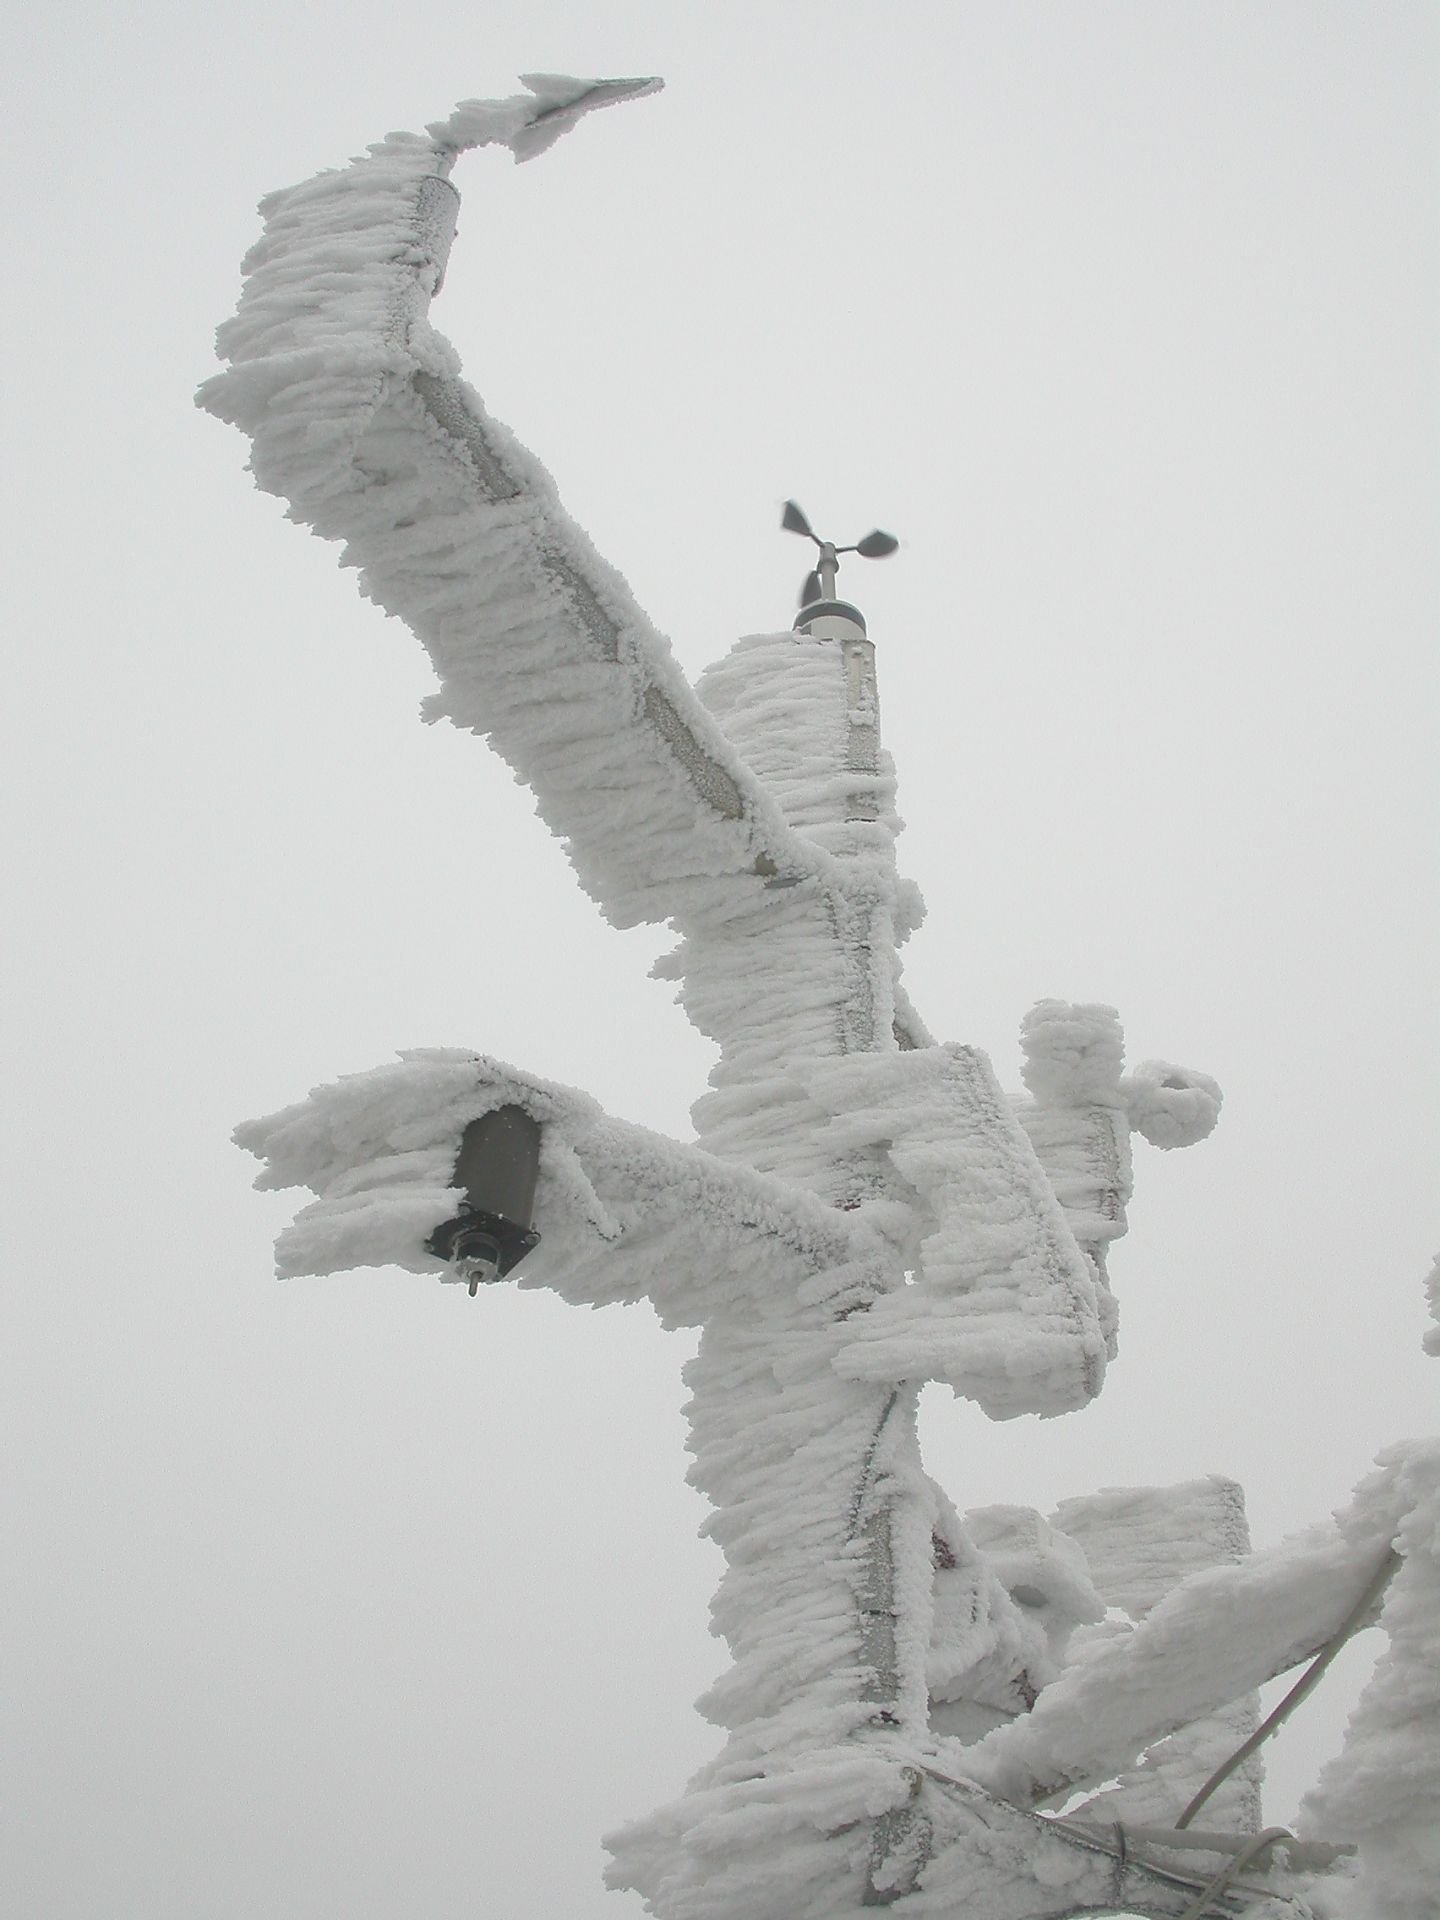
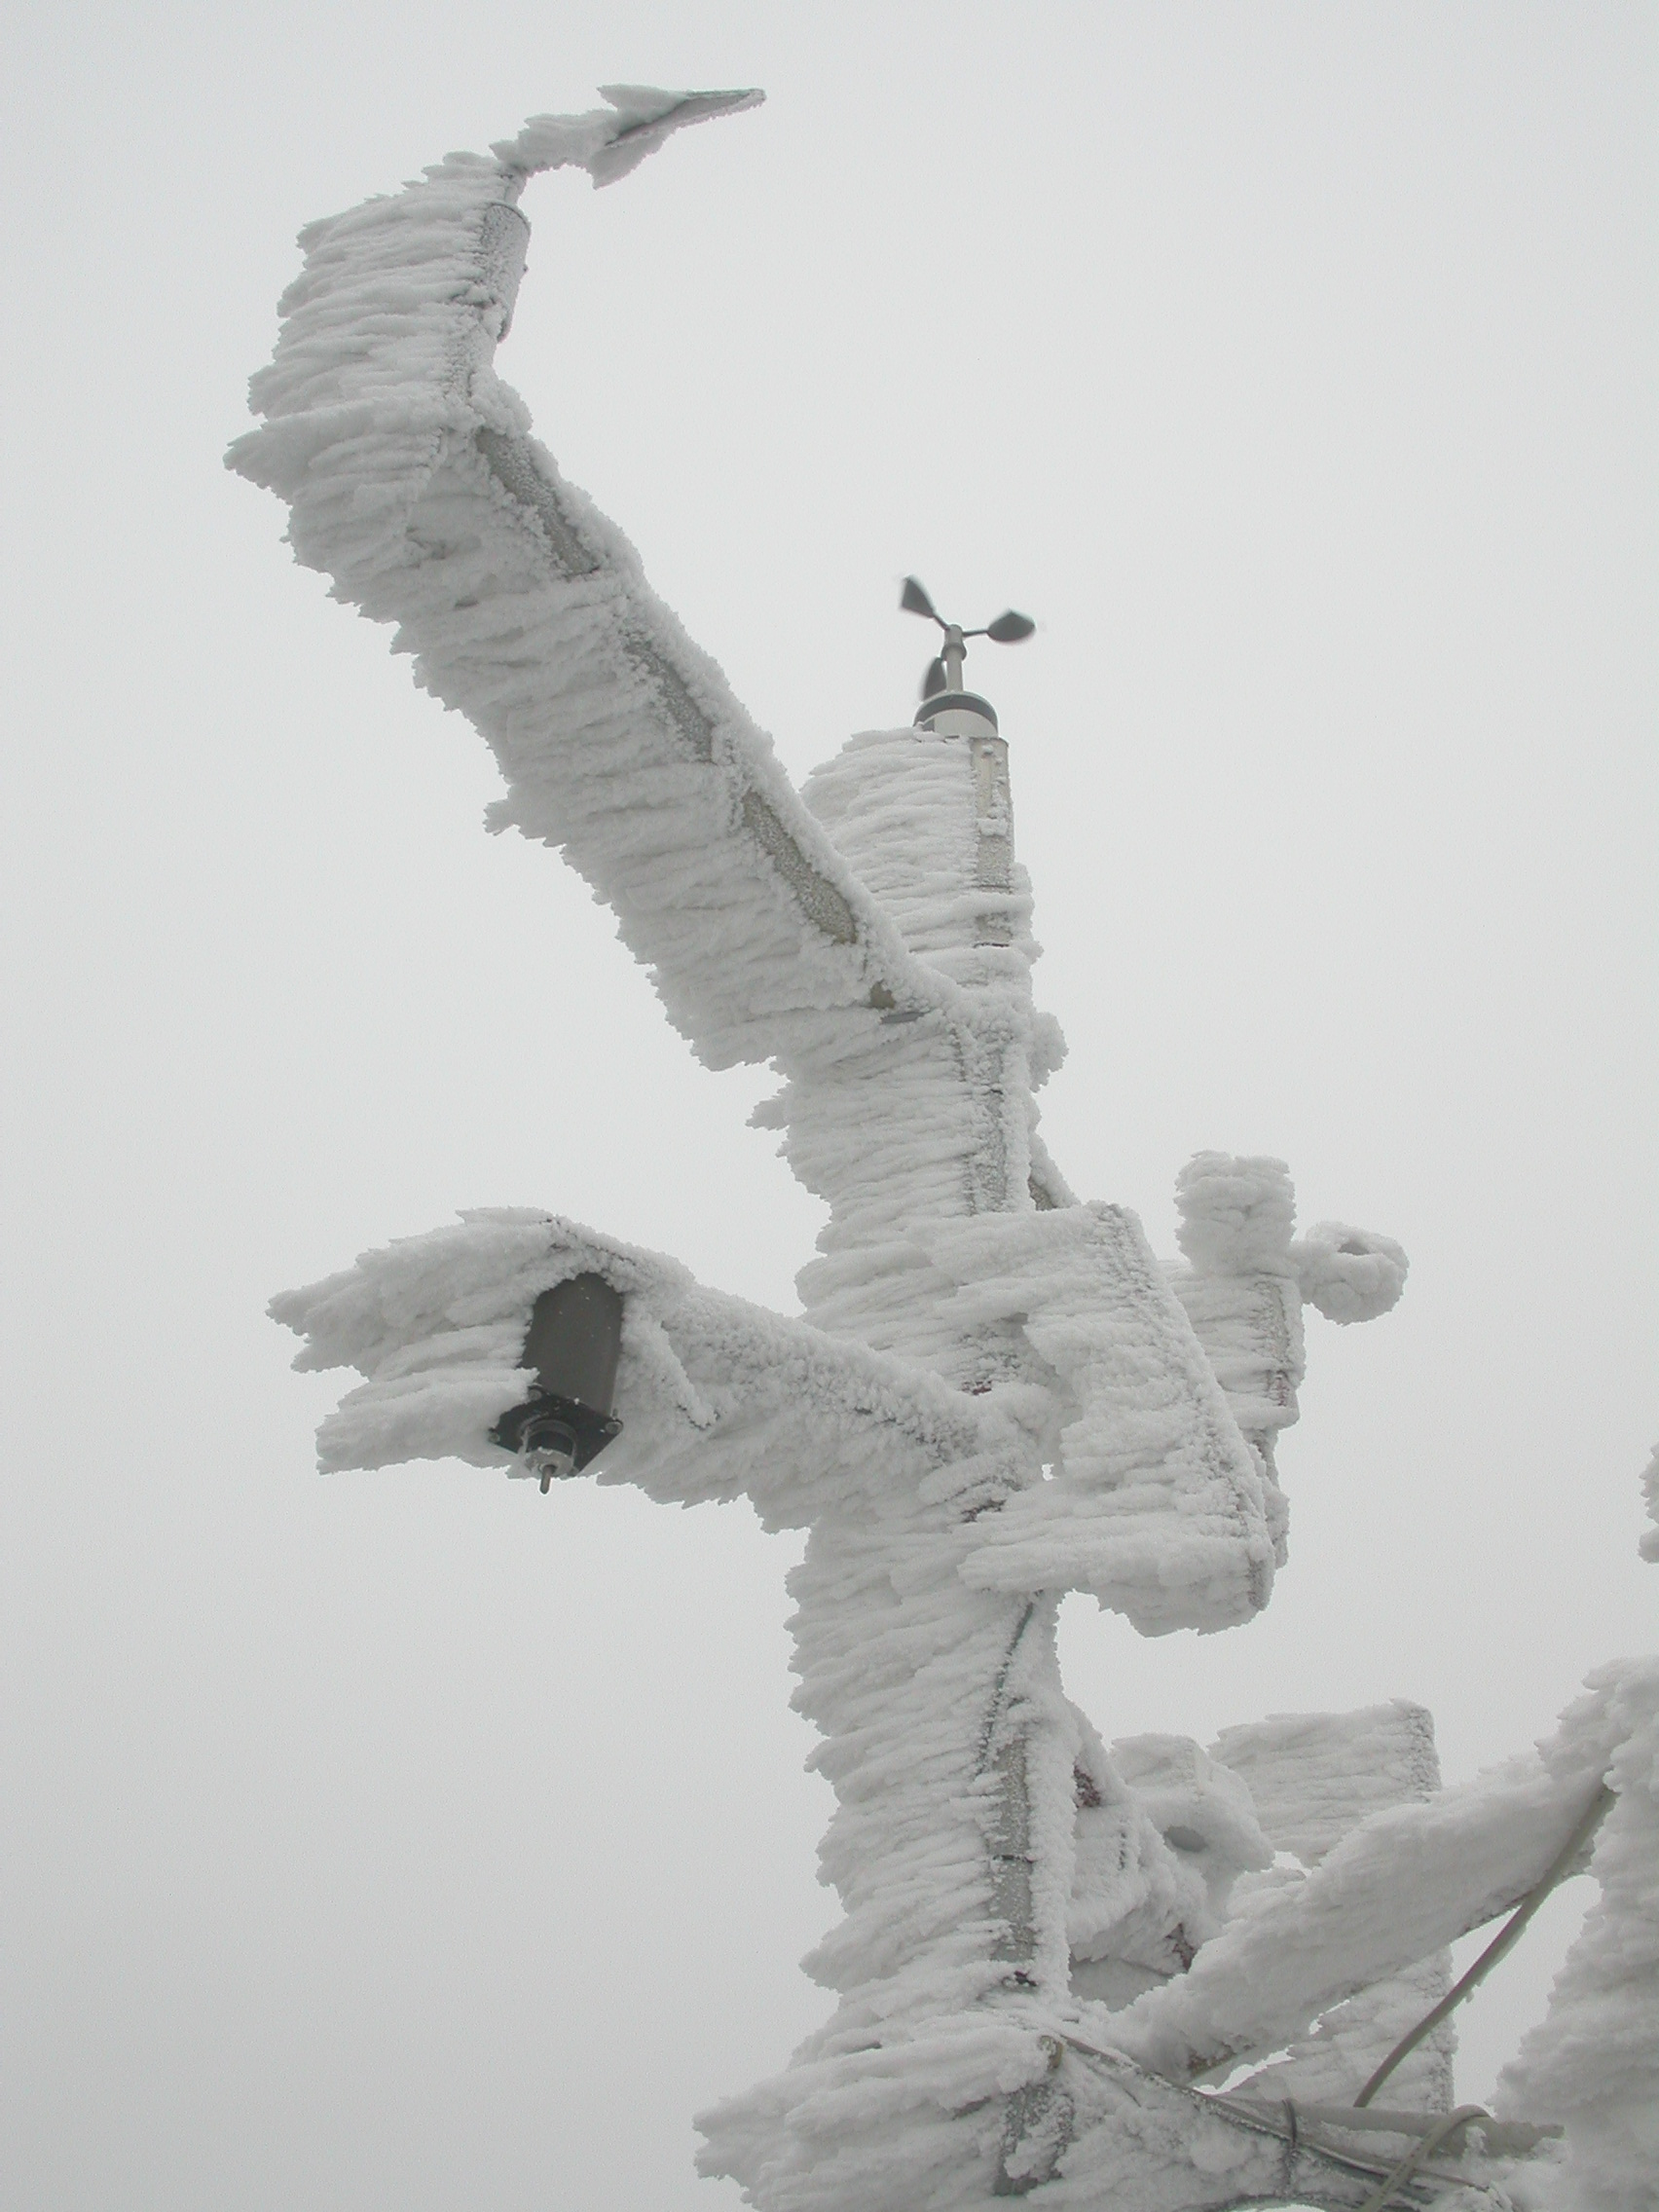
Iced-up measurement
Severe icing on a meteorological measurement site. The sole instrument free of ice is the heated anemometer in the upper center of the picture.
Copyright: Energiewerkstatt Verein

IEA-PVPS Task Grid Integration workshop in Tokyo, Japan
International Experts from Task 14 and Experts from the Japanese electricity sector and research attending the NEDO/Task 14 workshop in November 2022
Copyright: IEA-PVPS Task 14 - NEDO

Tailem Bend Solar Power Farm, South Australia
187 MW Solar Power Farm in Tailum Bend, South Australia
Copyright: AIT Austrian Institute of Technology

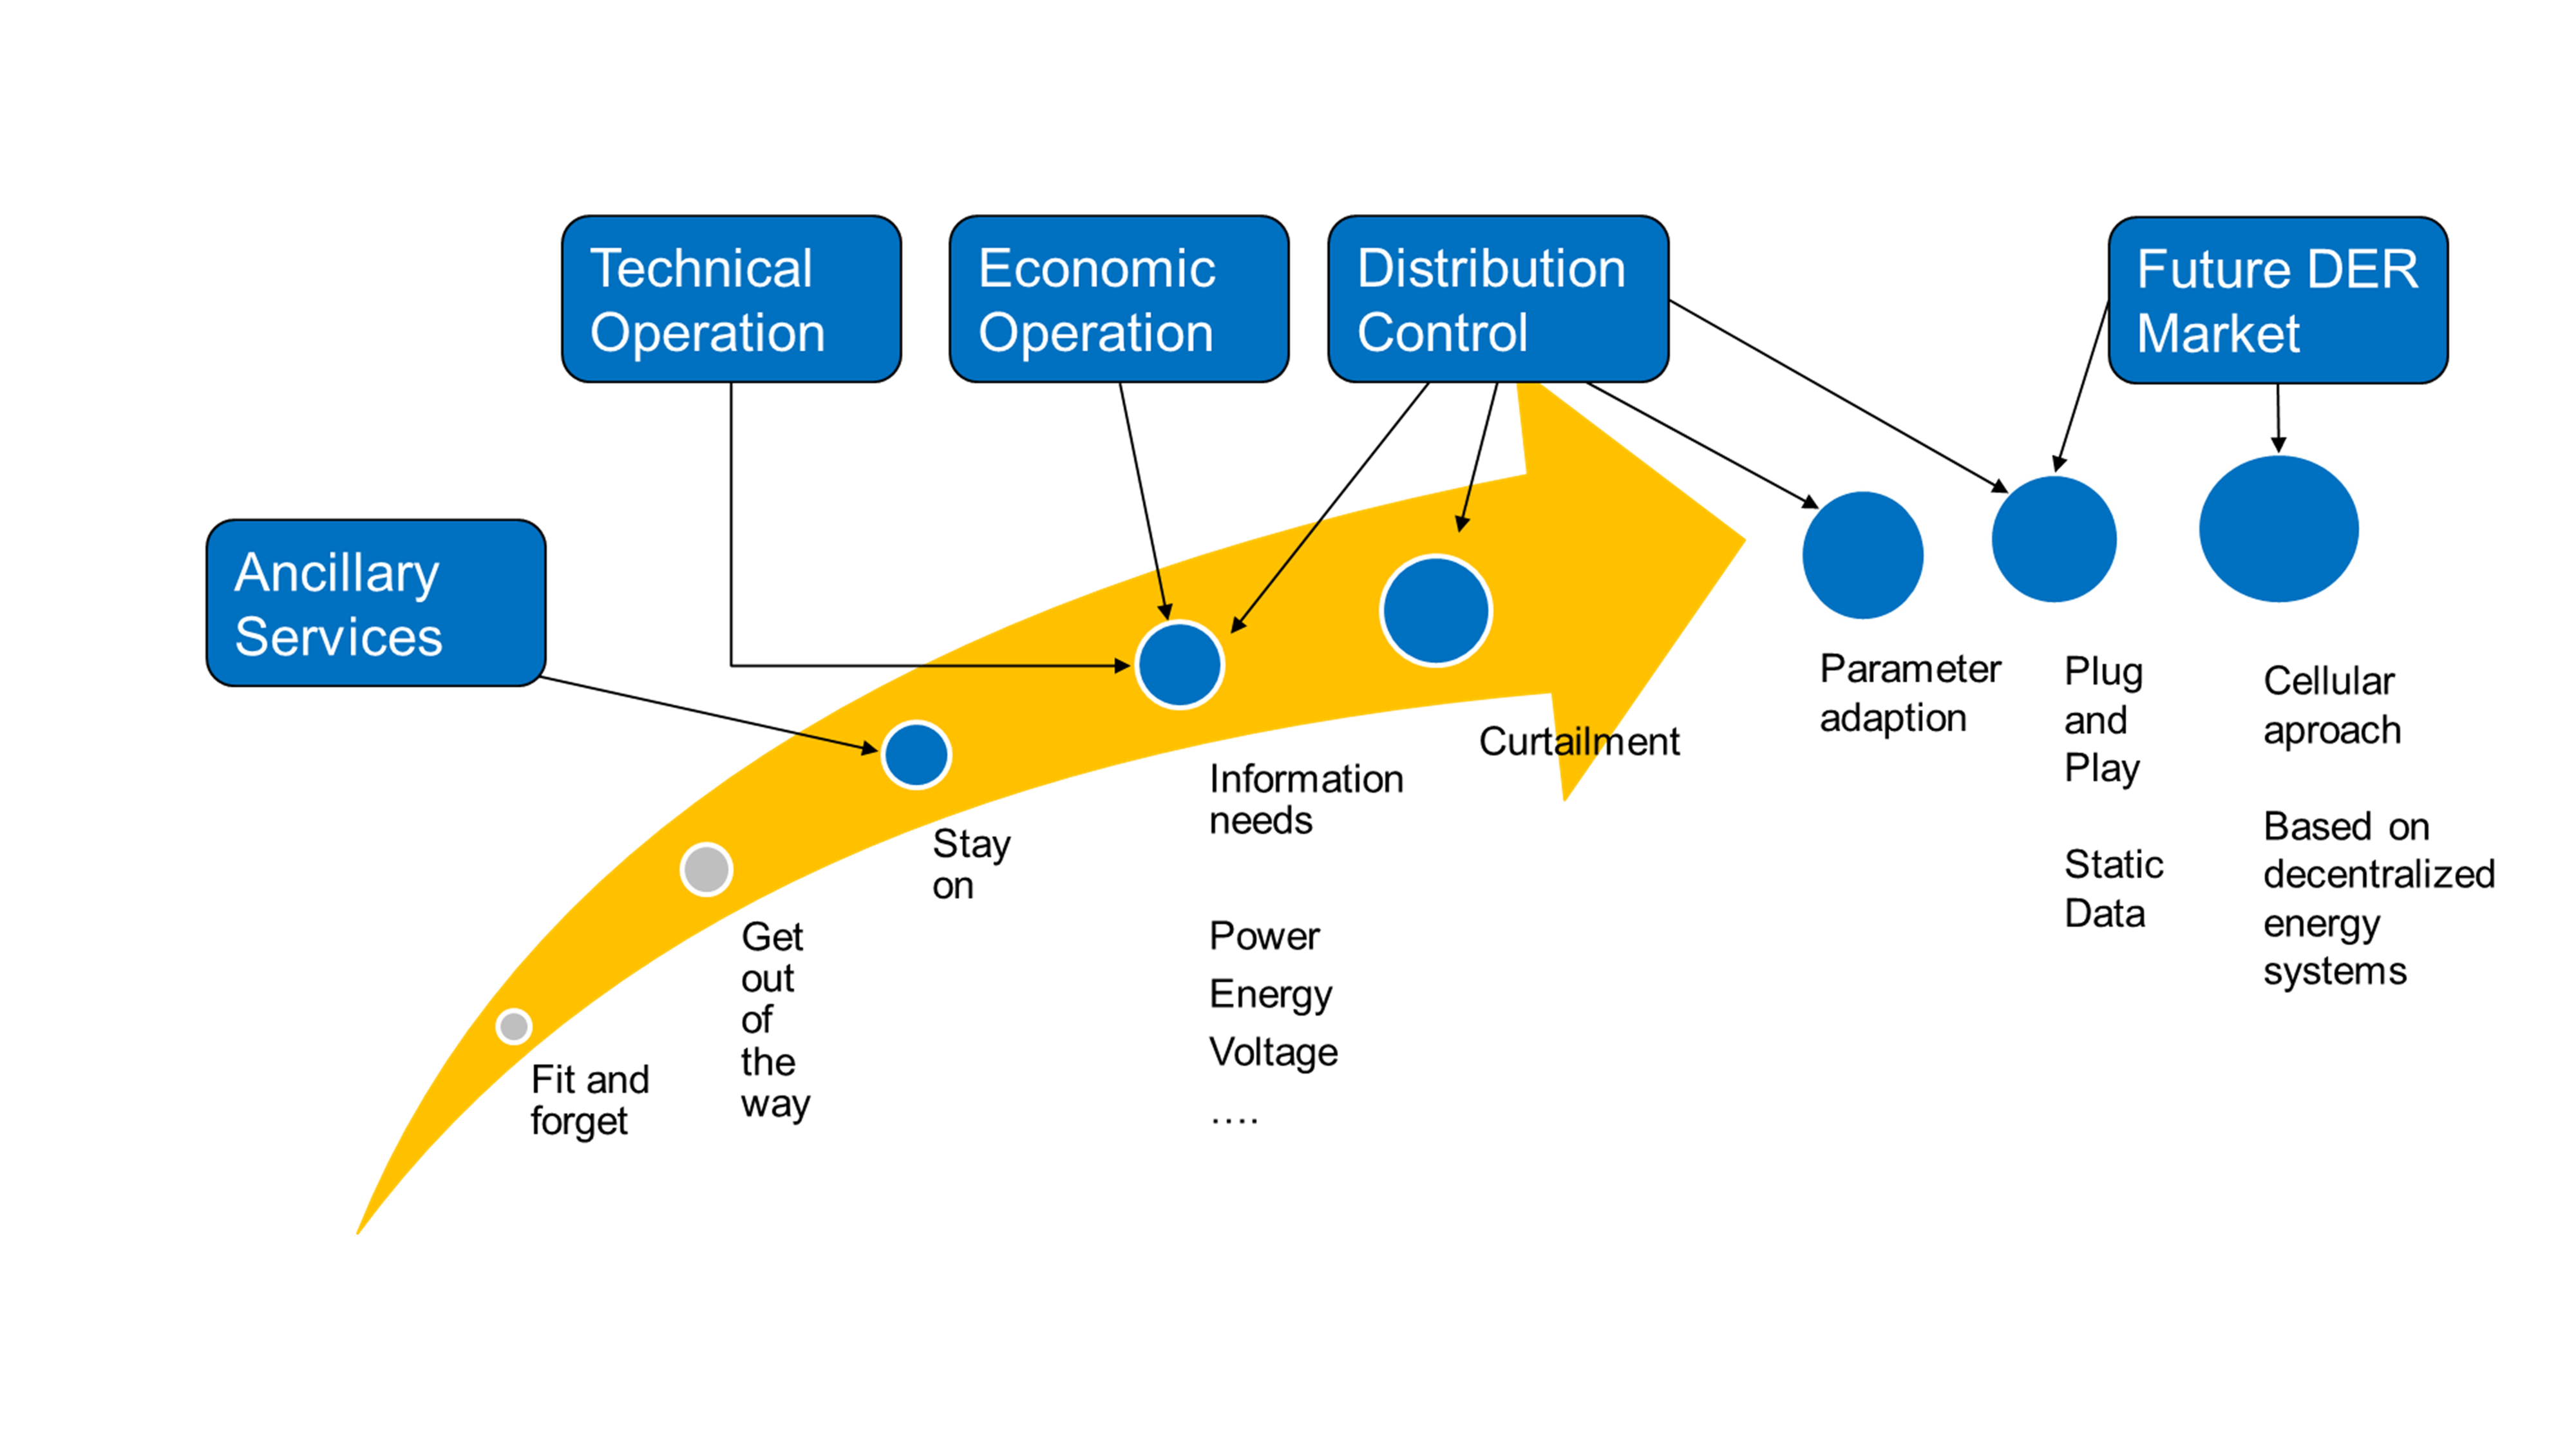
Development path of photovoltaics in the future Smart Grid
As part of the international cooperation in Task 14, an overview of current demonstration projects of communication and control concepts with a focus on ICT-related aspects of smart grid integration of photovoltaics was compiled. Based on these experiences, a universal development path was outlined, which describes the possible integration of photovoltaics into a future Smart Grid and the transition from a purely passive role to an active integration into grid control and energy markets.
Copyright: IEA-PVPS Task 14
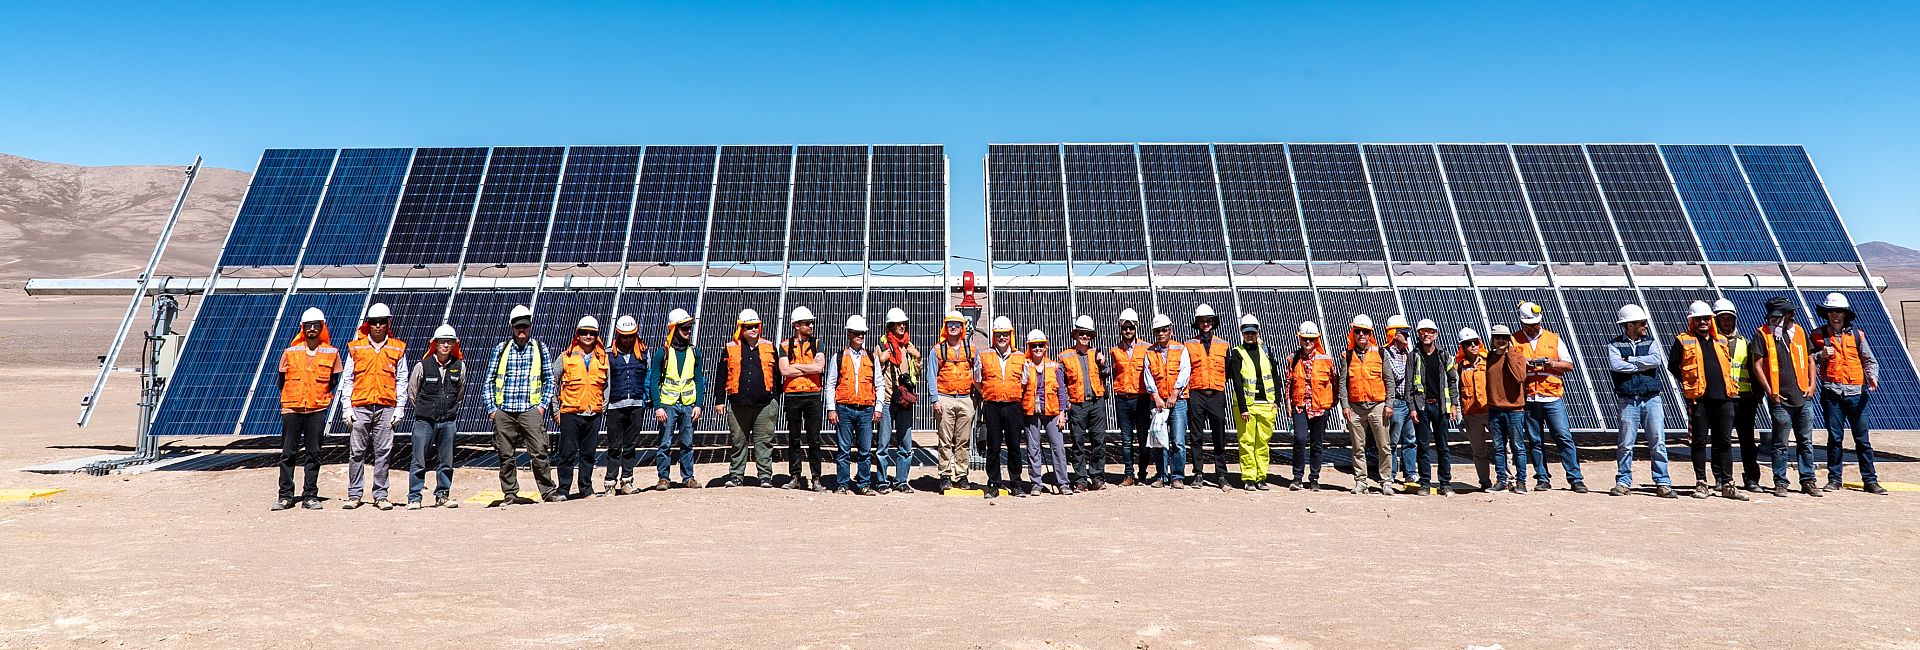
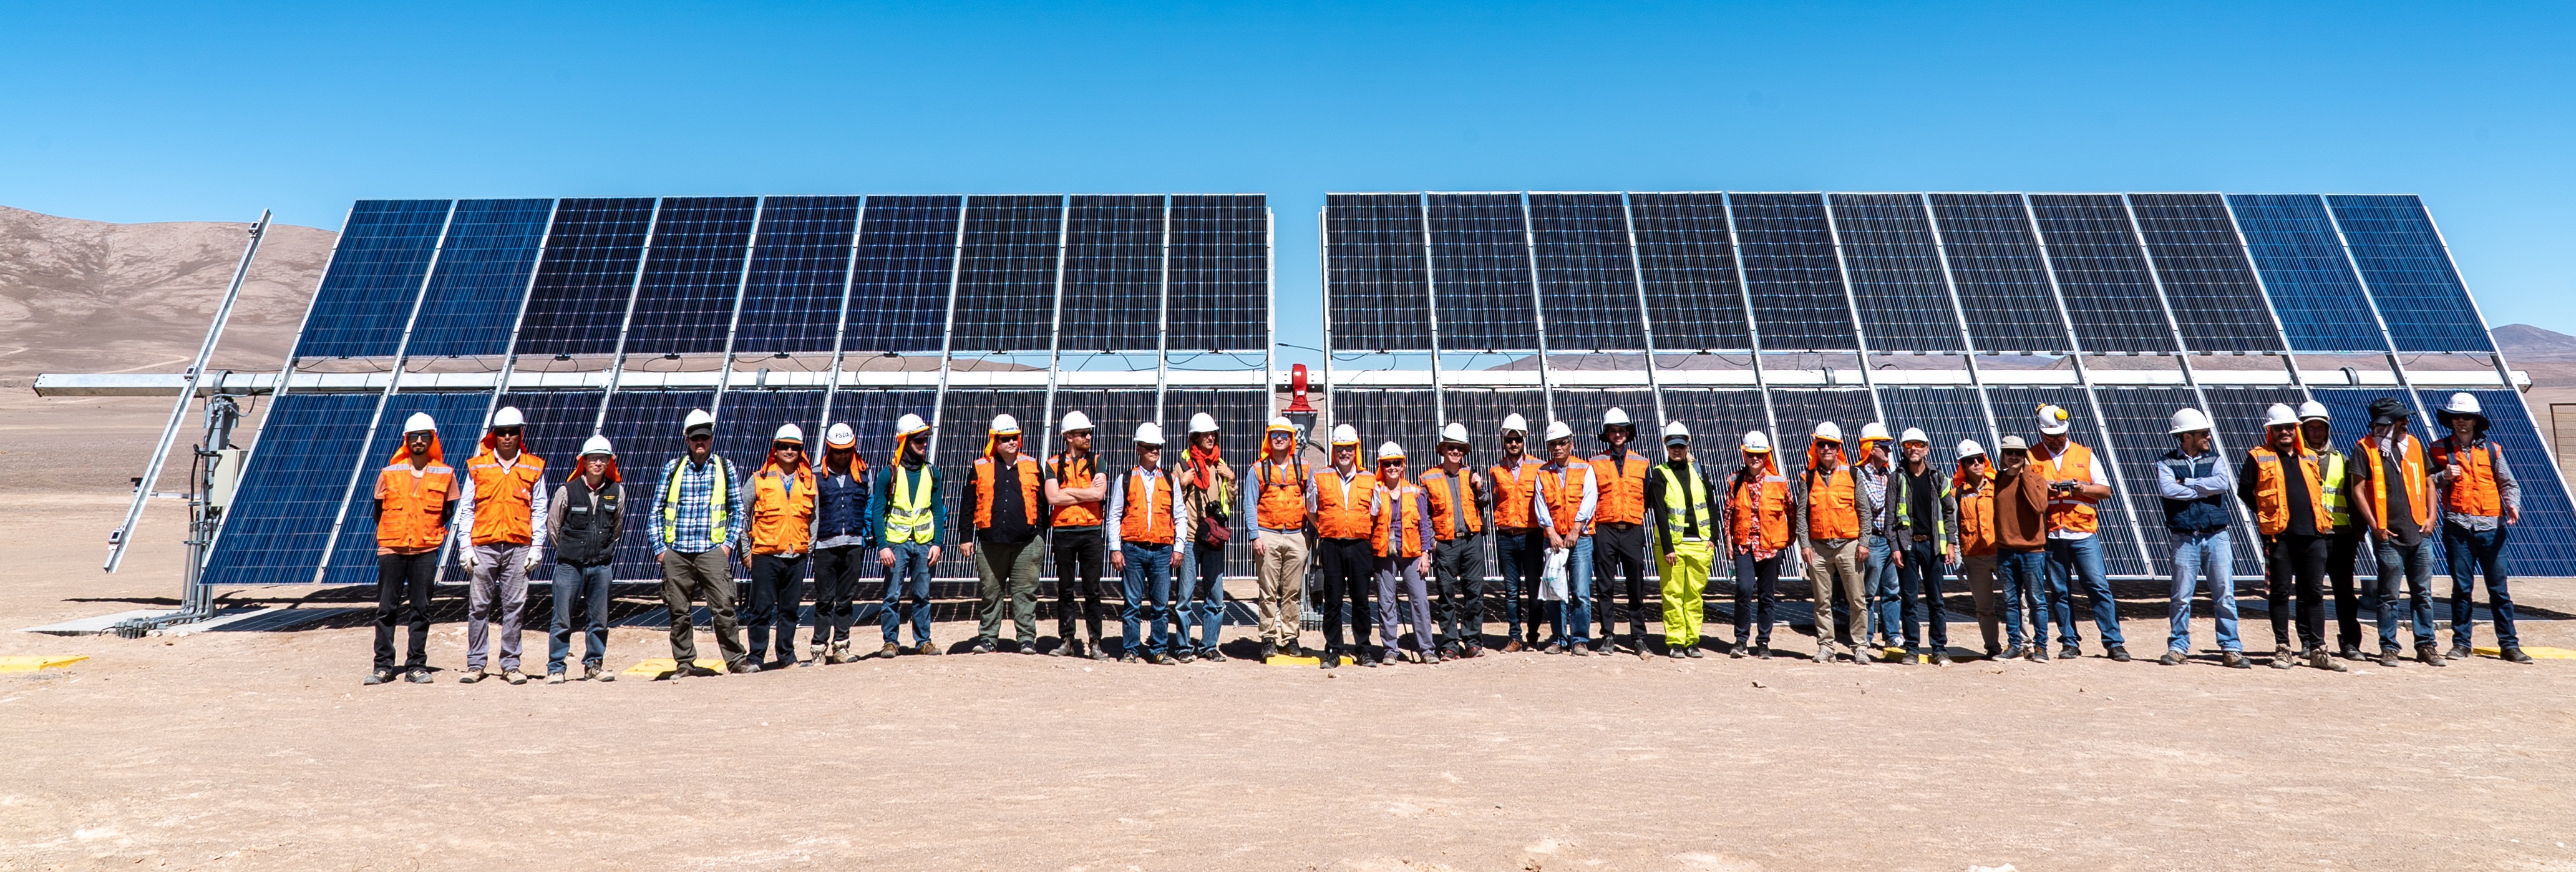
22nd IEA PVPS Task 13 Meeting, October 2019, Chile
Technical tour of the IEA PVPS Task 13 people visiting Atamos-Tec in the Atacama desert, near Antofagasta, Chile.
Copyright: Bernhard Kubicek (AIT)

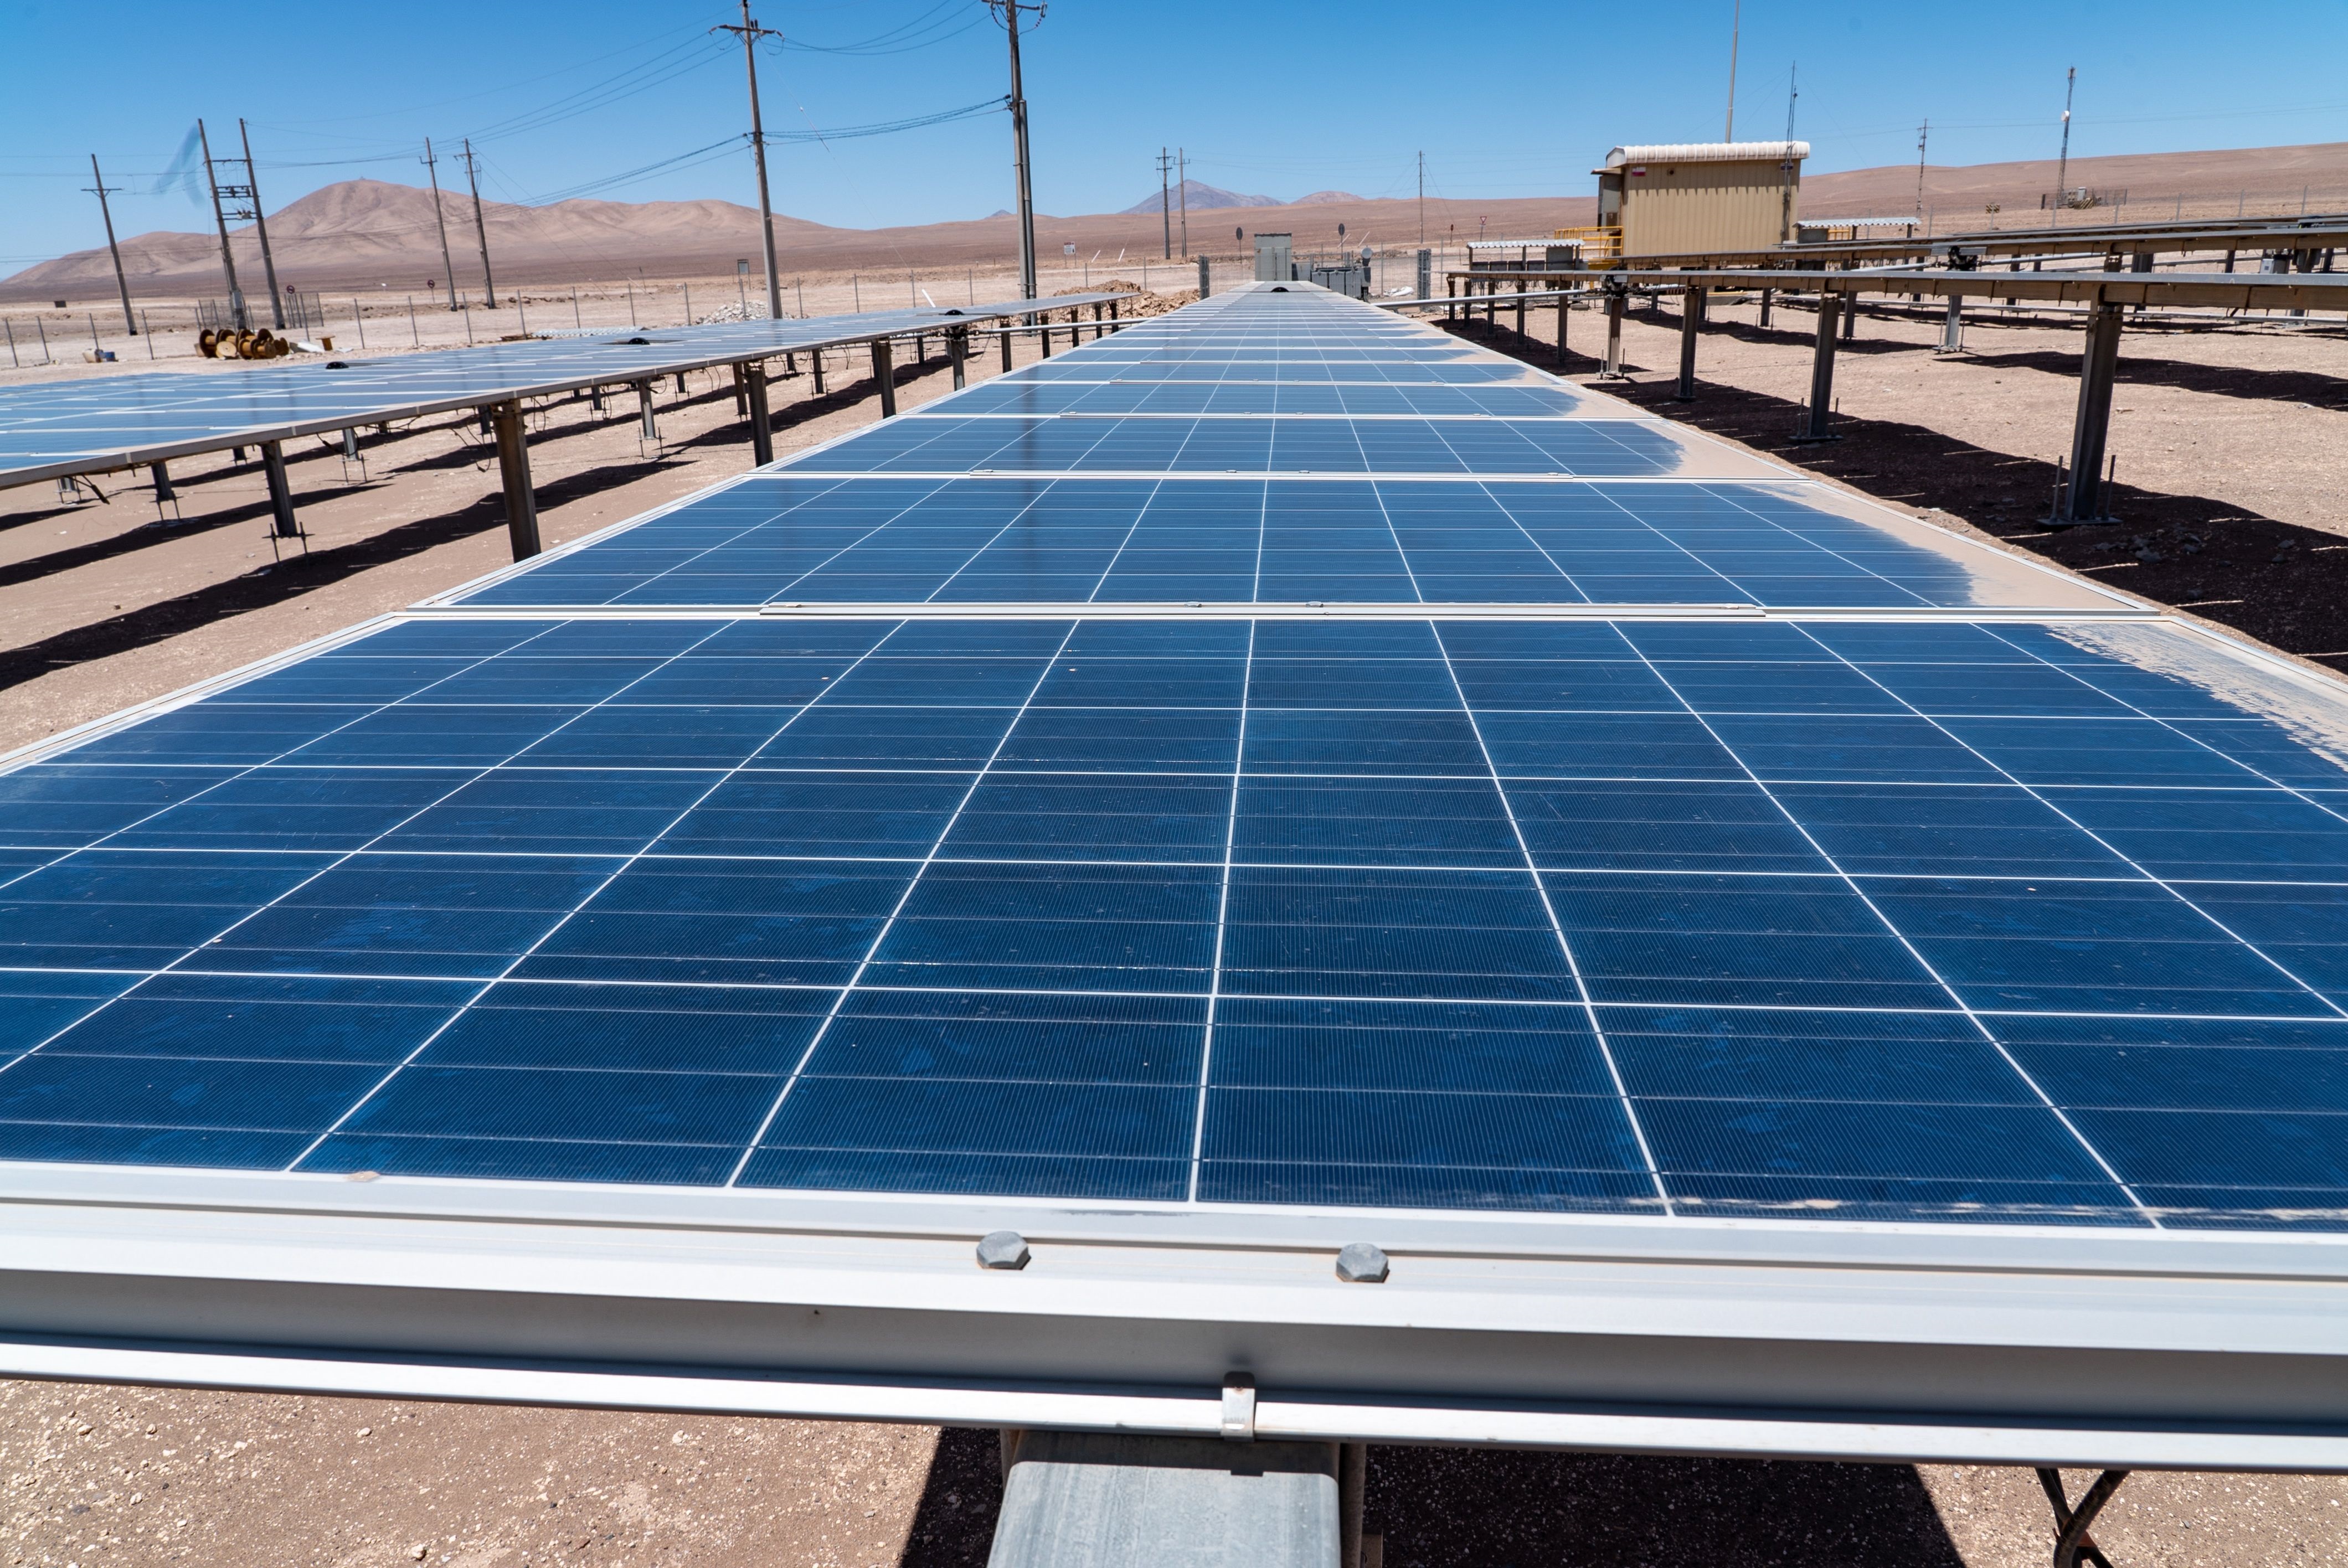
Drifting Sand on Photovoltaic Modules
Horizontal single axis tracker photovoltaic system in the Atacama desert affected by drifting sand accumulation on modules. See also Report IEA-PVPS-T13-21:2022 "Soiling Losses Impact on the Performance of Photovoltaic Power Plants" and Report IEA-PVPS-T13-25:2022 "Guidelines for Operation and Maintenance of Photovoltaic Power Plants in Different Climates". Download at: https://iea-pvps.org/research-tasks/performance-operation-and-reliability-of-photovoltaic-systems/.
Copyright: Bernhard Kubicek (AIT)

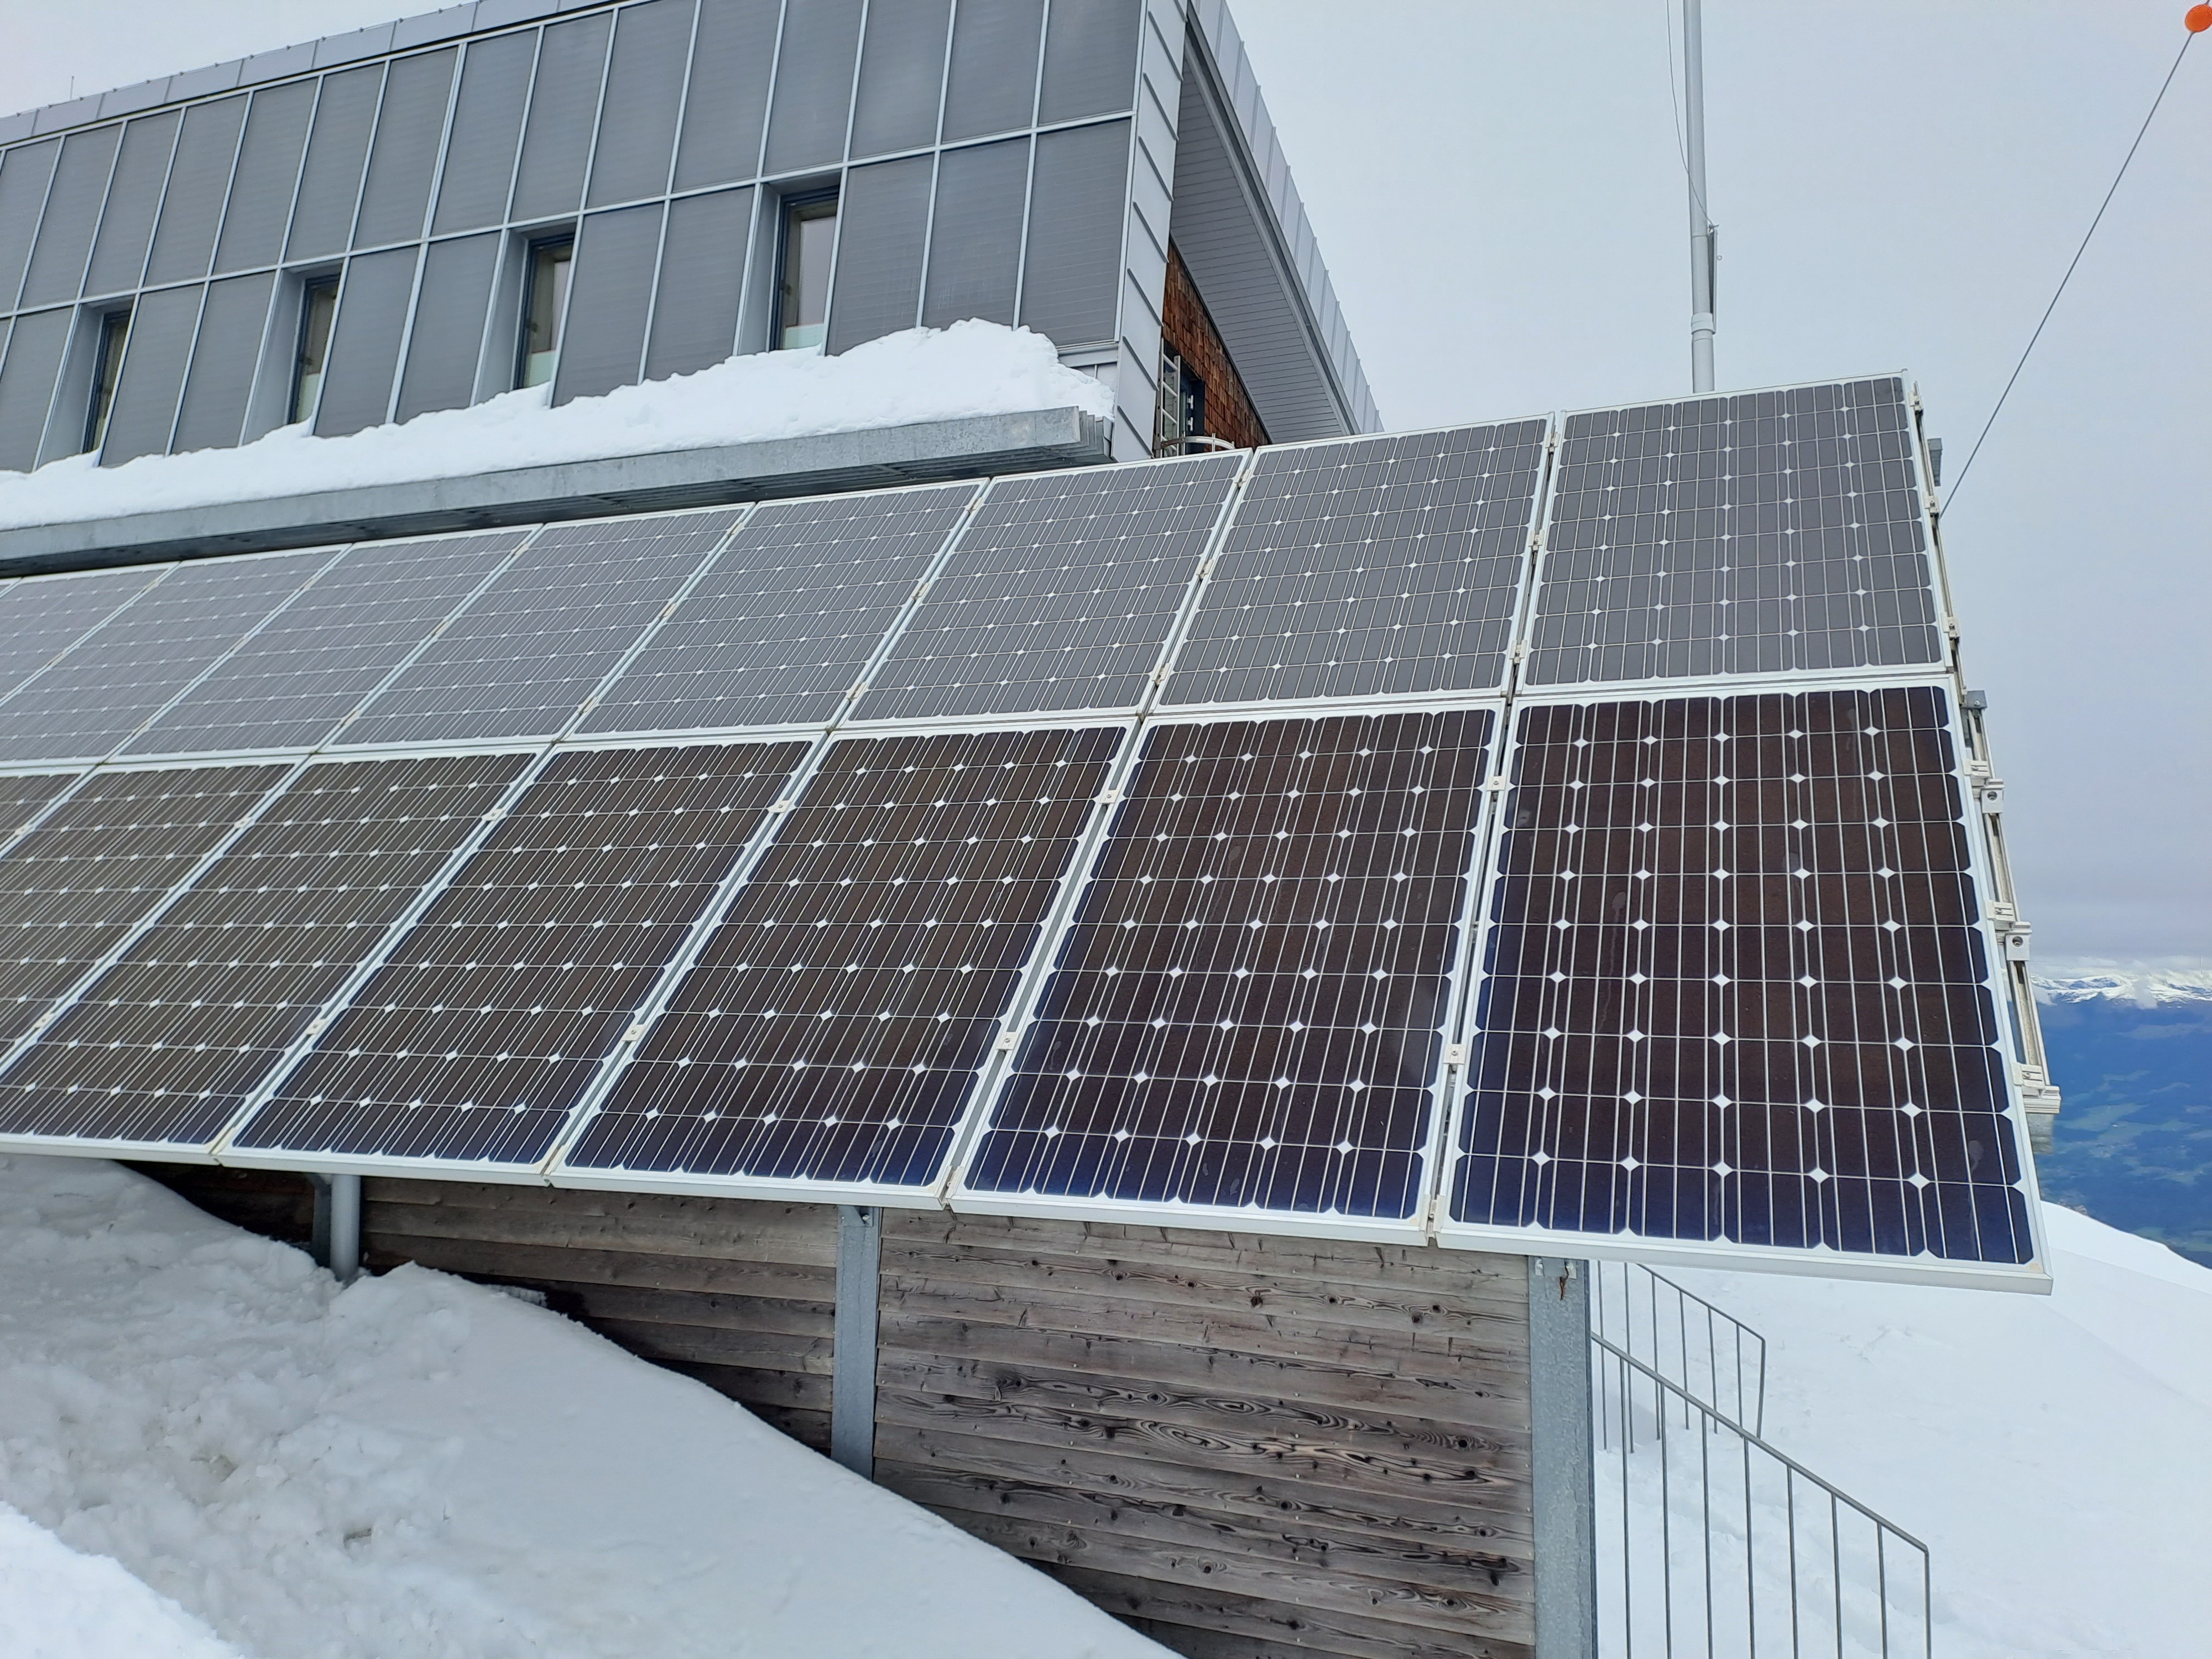
Photovoltaic system installation in the Alps
At a photovoltaic system in the Alps having two different types of glass-backsheet modules, one type shows after a few years cracks at the backsheets outer layer, while the others are free of failures. See Report T13-24:2021 „Qualification of Photovoltaic (PV) Power Plants using Mobile Test Equipment“ and Report IEA-PVPS-T13-25:2022 "Guidelines for Operation and Maintenance of Photovoltaic Power Plants in Different Climates". Download at: https://iea-pvps.org/research-tasks/performance-operation-and-reliability-of-photovoltaic-systems/.
Copyright: Gabriele Eder (OFI)
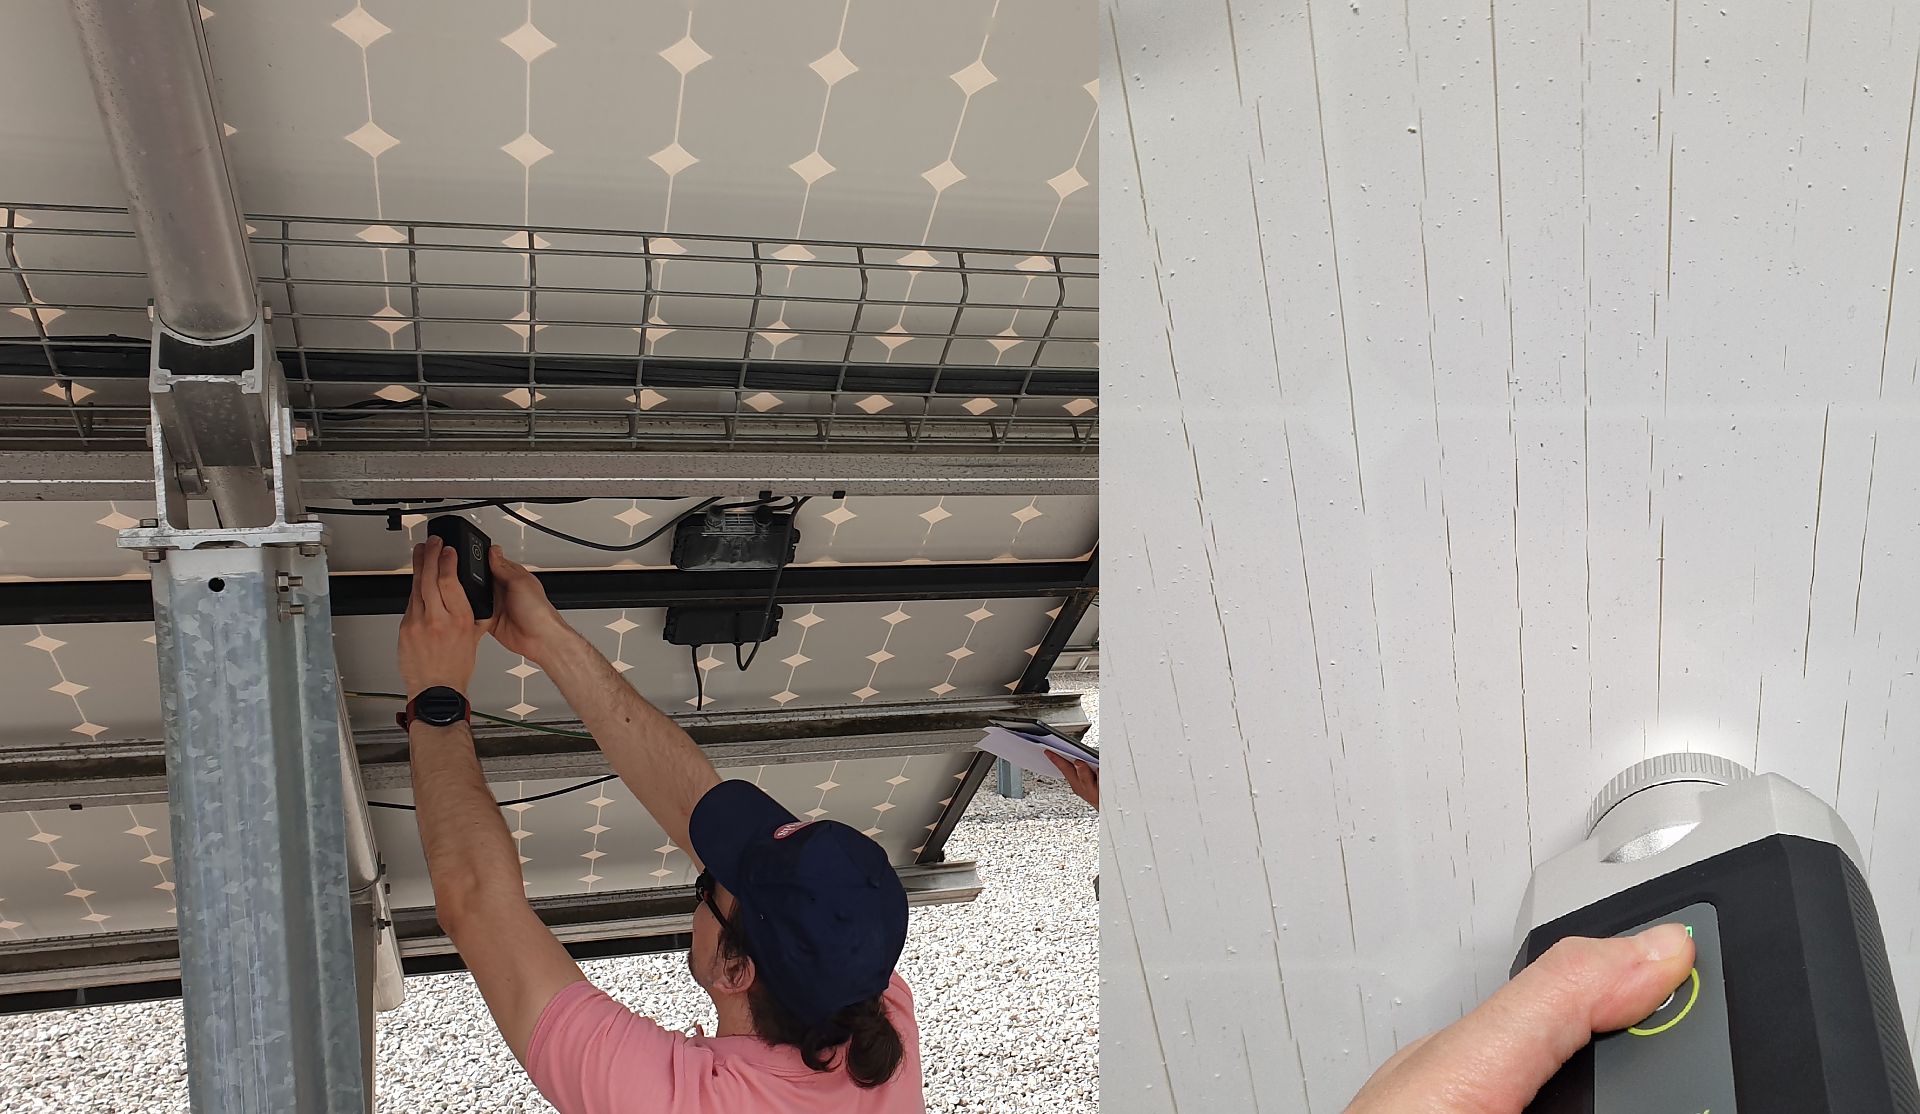
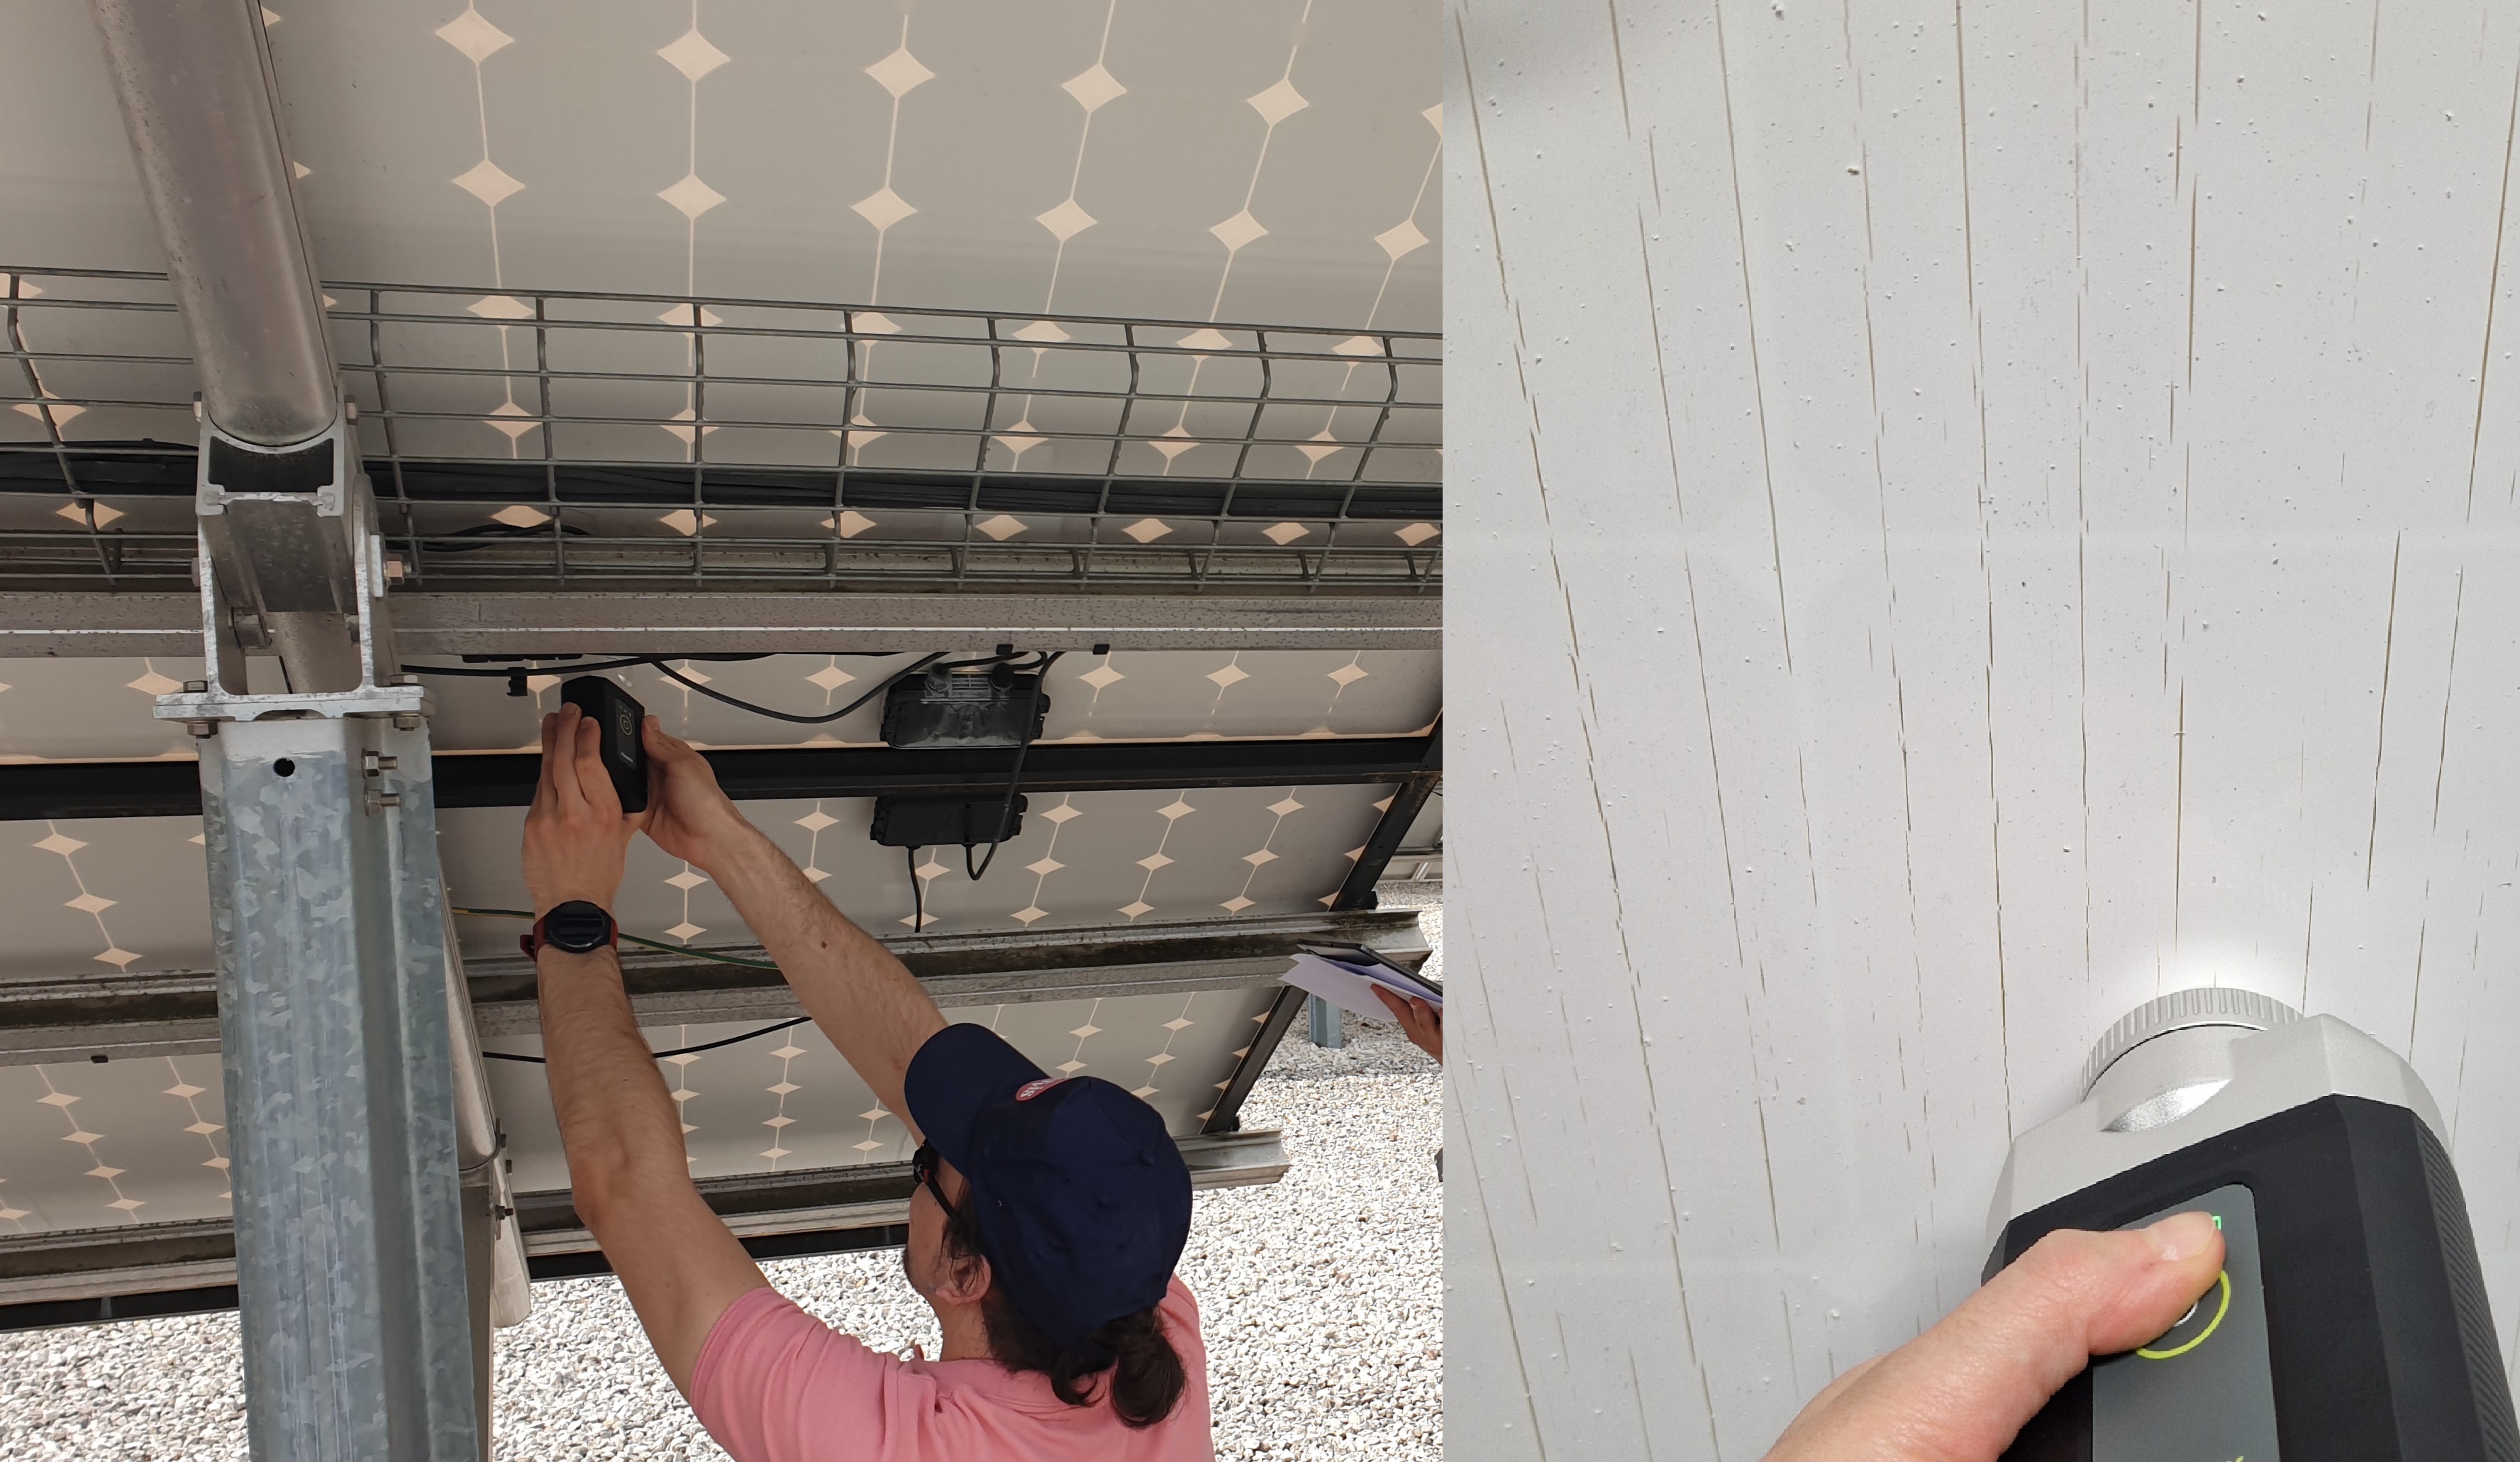
On-site inspection of photovoltaic modules
Left hand side: Hand-held devices can be used to get insight in polymer materials composition and degradation processes. Right hand side: Module backsheet with multiple parallel cracks of the outer layer. See Report T13-24:2021 „Qualification of Photovoltaic (PV) Power Plants using Mobile Test Equipment“ and Report T13-13:2021 "Designing New Materials for Photovoltaics: Opportunities for Lowering Cost and Increasing Performance through Advanced Material Innovations". Download-Link: https://iea-pvps.org/research-tasks/performance-operation-and-reliability-of-photovoltaic-systems/
Copyright: Gernot Oreski (PCCL)

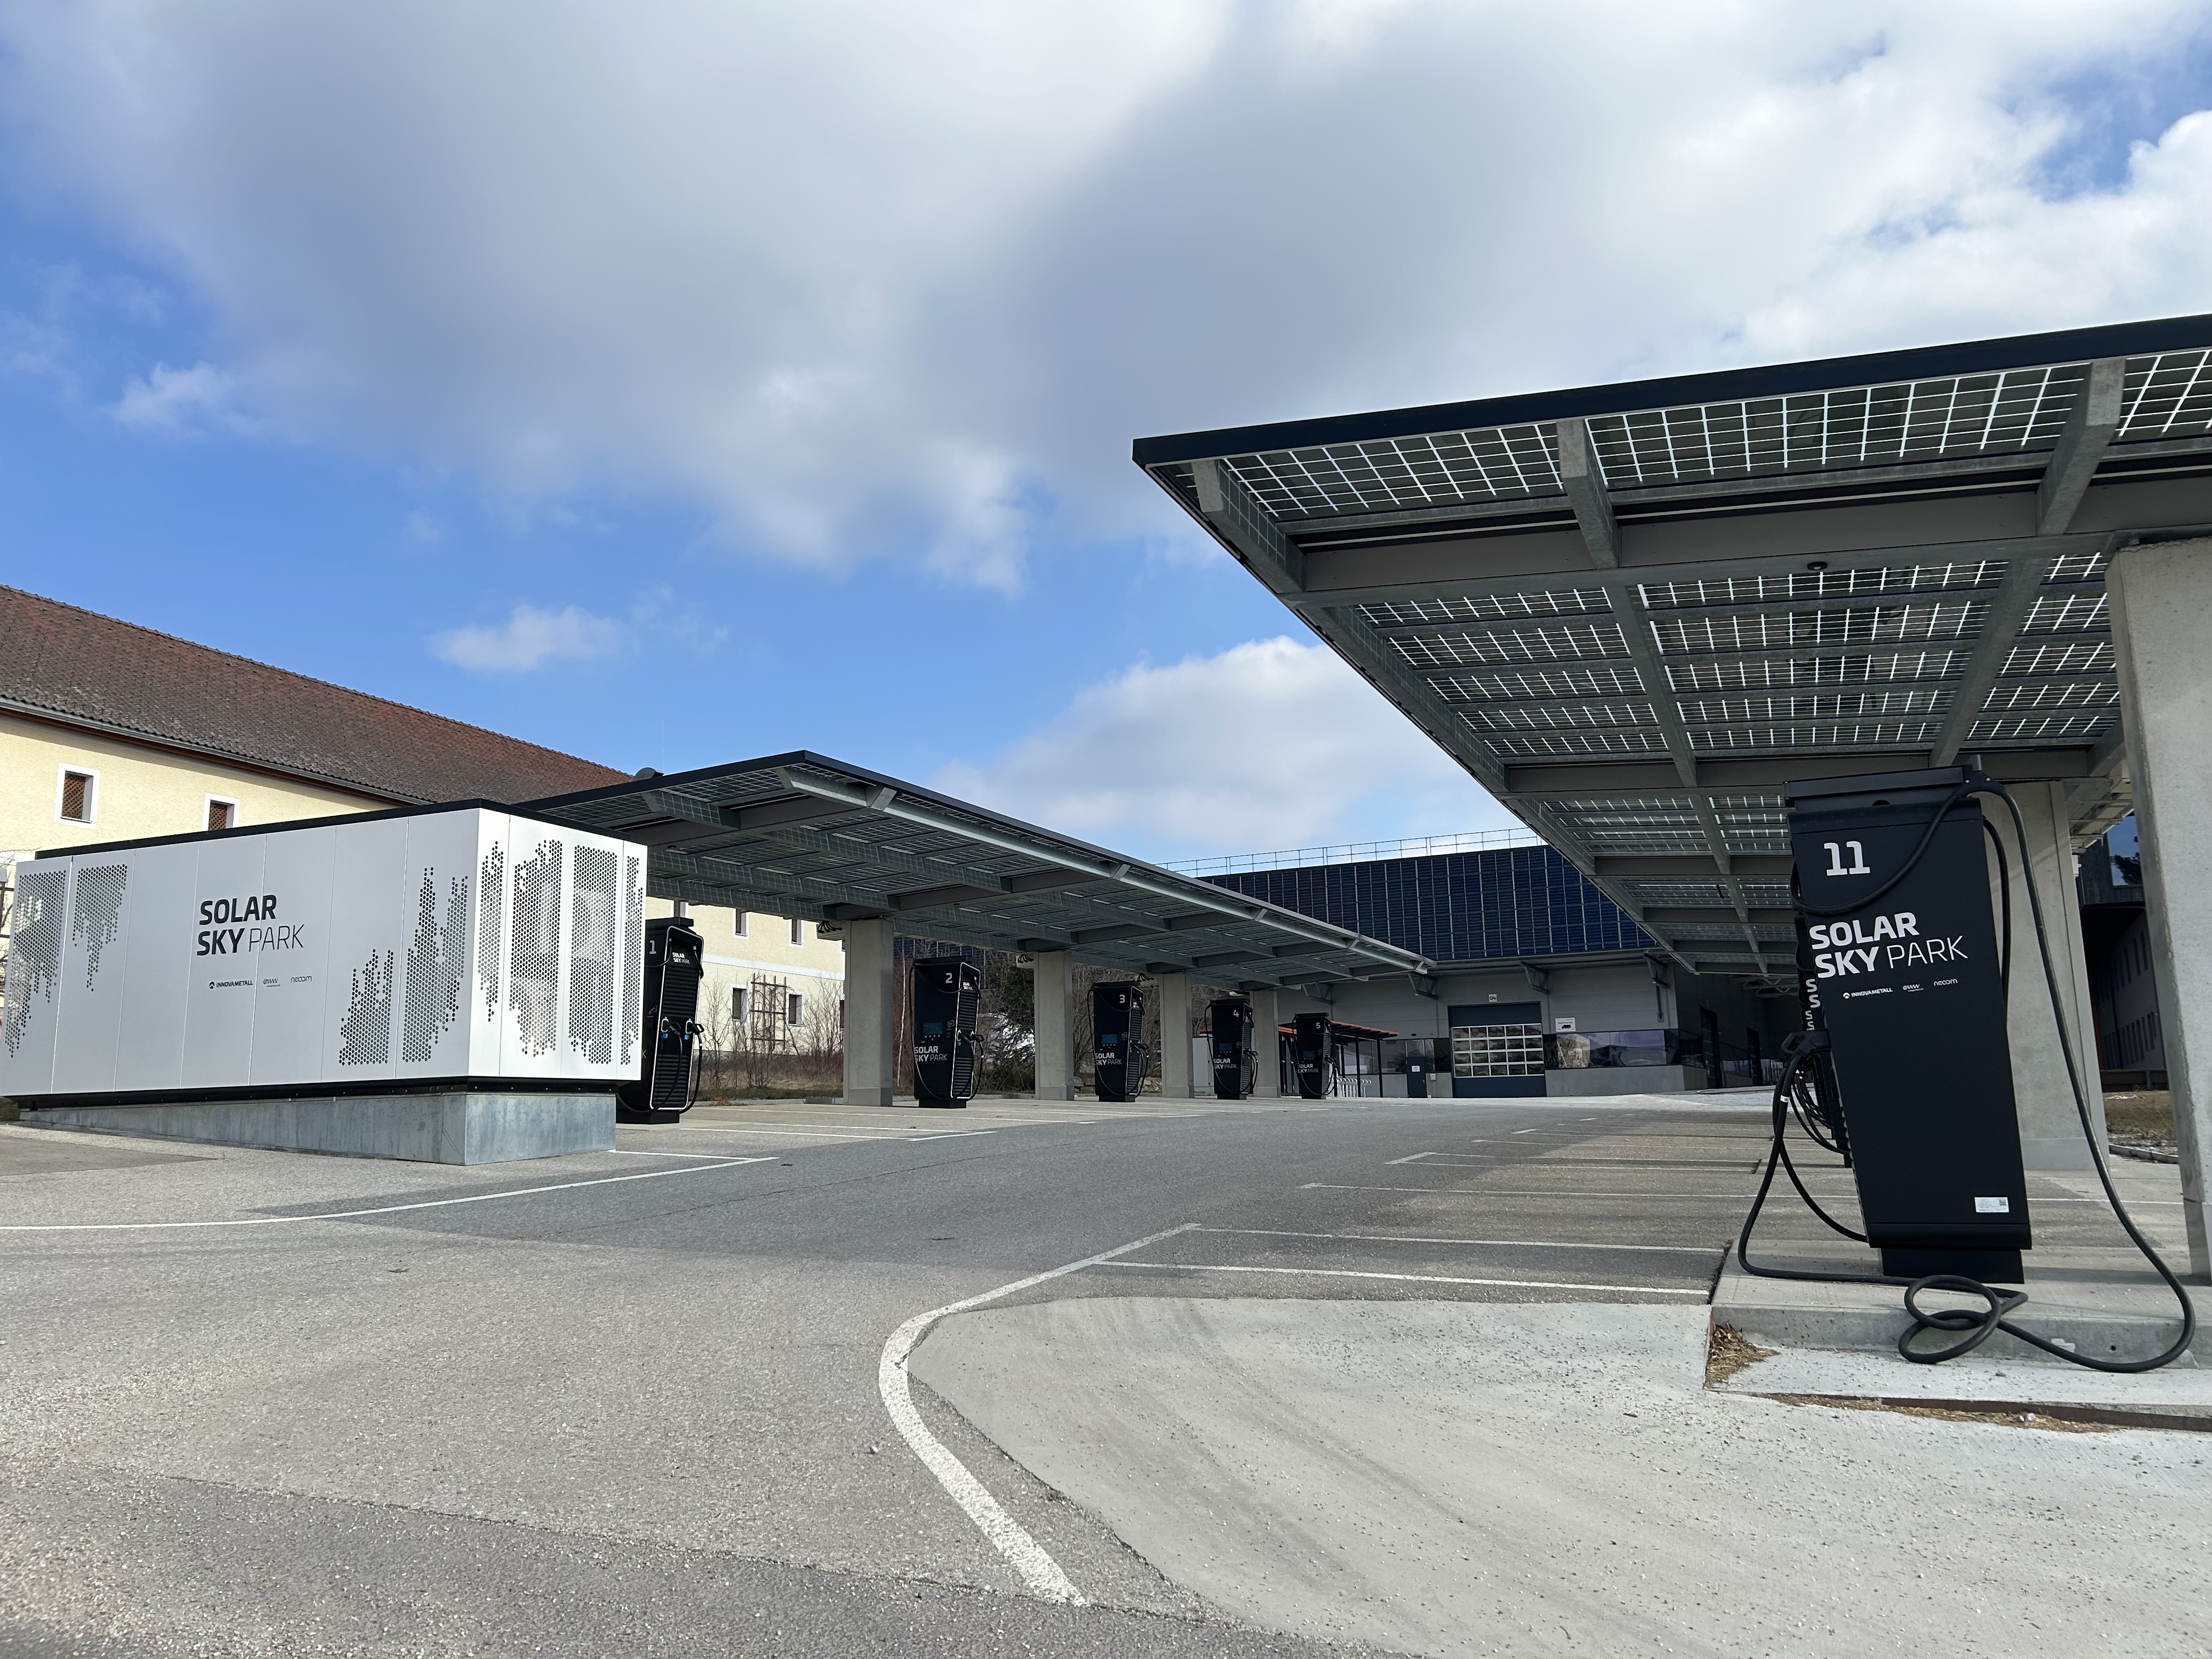
SOLARSKYPARK Fast-E-Chargingpark for E-Mobility, Freistadt Upperaustria
PV Carport with E-charging and Energystorage • 176kW/597kWh Outdoorstorage by neoom • 11 Stk 300 kW E-Charging stations
Copyright: Fa. Neoom
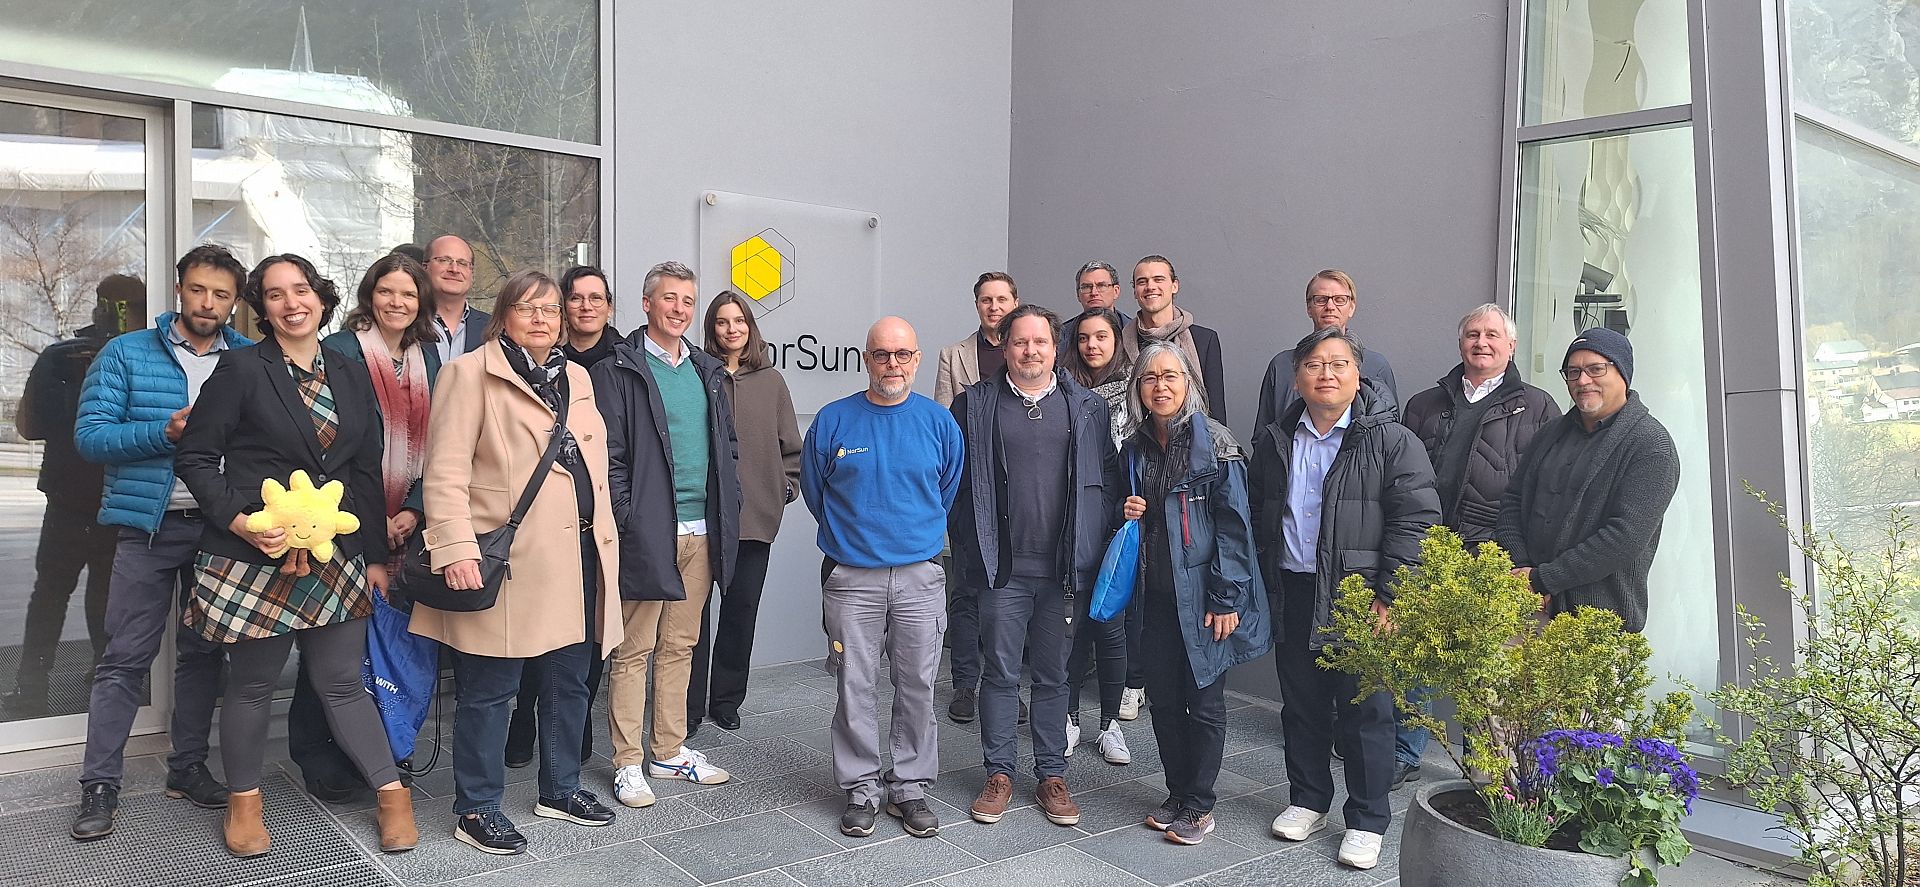
IEA-PVPS Task 1 Expert Group in front of the Norwegian PV-Wafer production NorSun
The IEA-PVPS Task 1 Expert Group during the technical visit in front of the Nor Sun wafer factory building in Ardalstangen/Norway. Due to strong Chinese competition in PV wafer production, this plant had to be shut down in 2023; as part of the European Net Zero Industry Act, it should be possible to resume production.
Copyright: Fechner

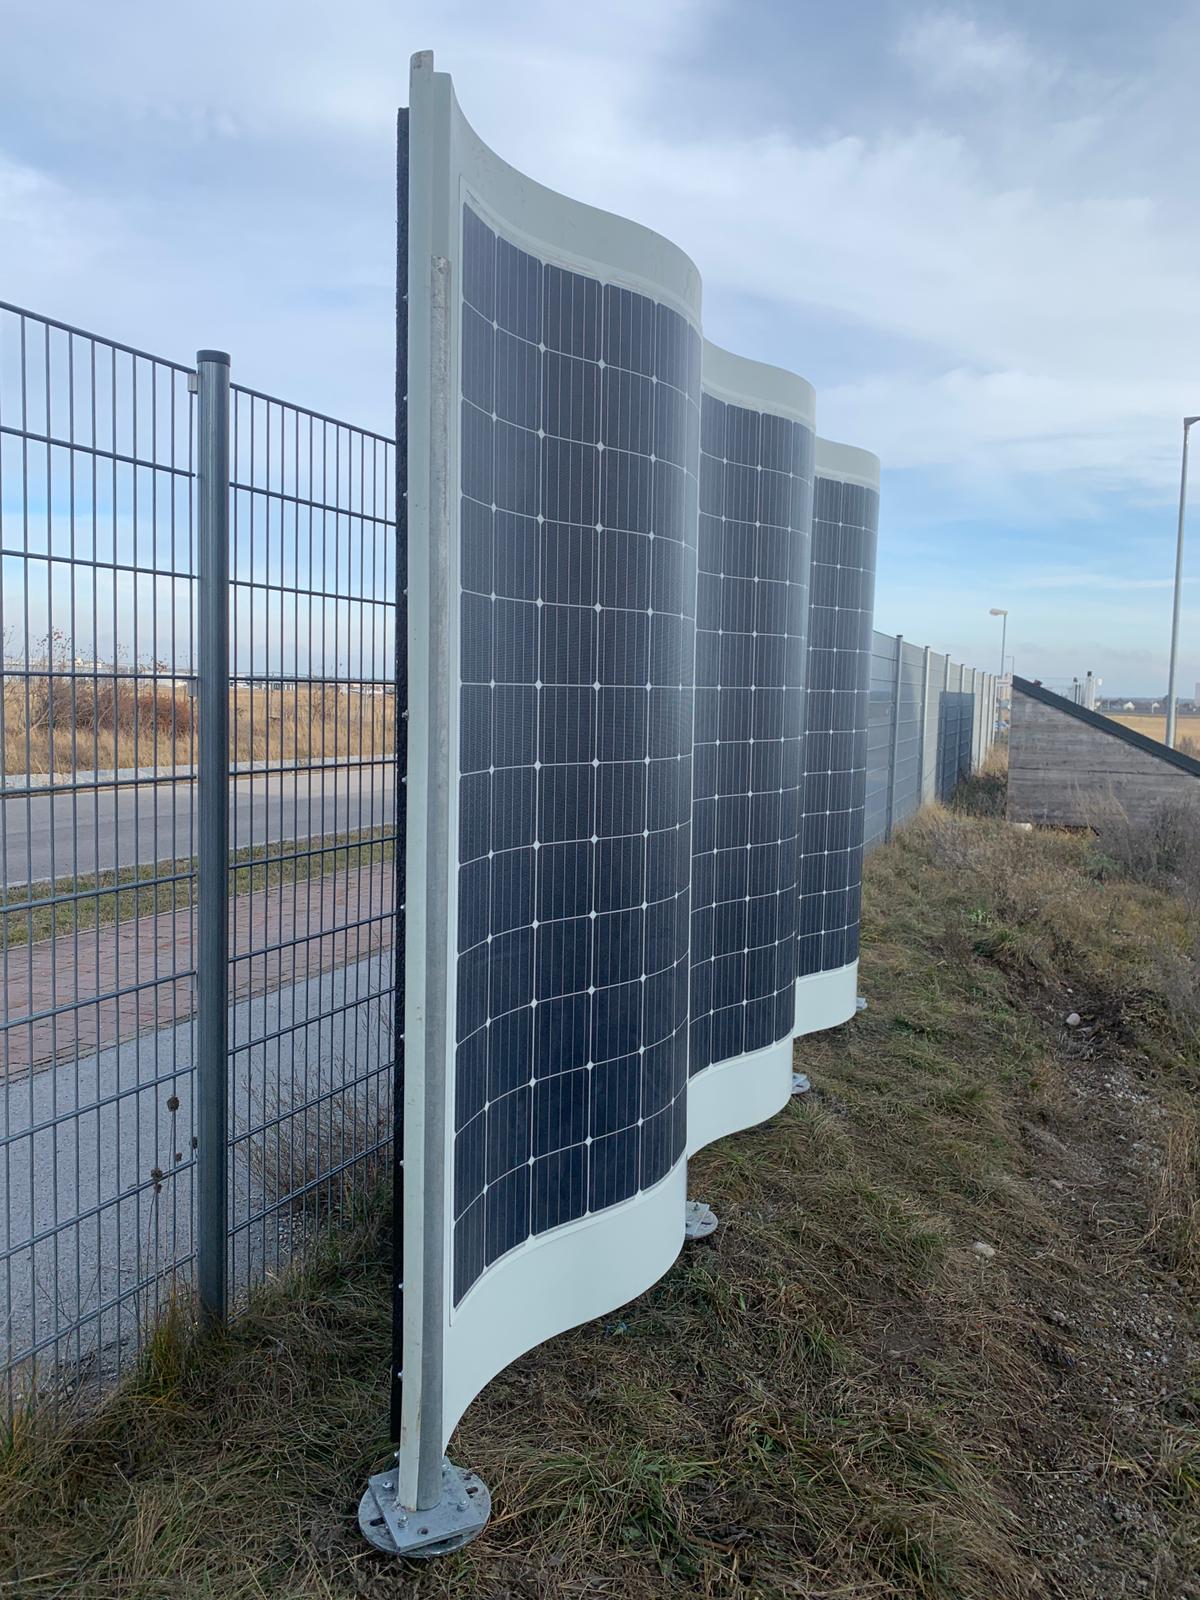
Sonnenkraft _Campus
Sonnenkraft-Campus in St.Veit/Glan, Austria – PV-Facade with certified Kromatix Solar Glas - Photo credit: Sonnenkraft
Copyright: Photo credit: Sonnenkraft

The large-scale thermal solar plant of Silkeborg, Dk
Overview over the large-scale solar thermal plant in Silkeborg, Denmark (left) and schematic showing the different sections and piping of the installation (right)
Copyright: © Silkeborg Forsyning AB
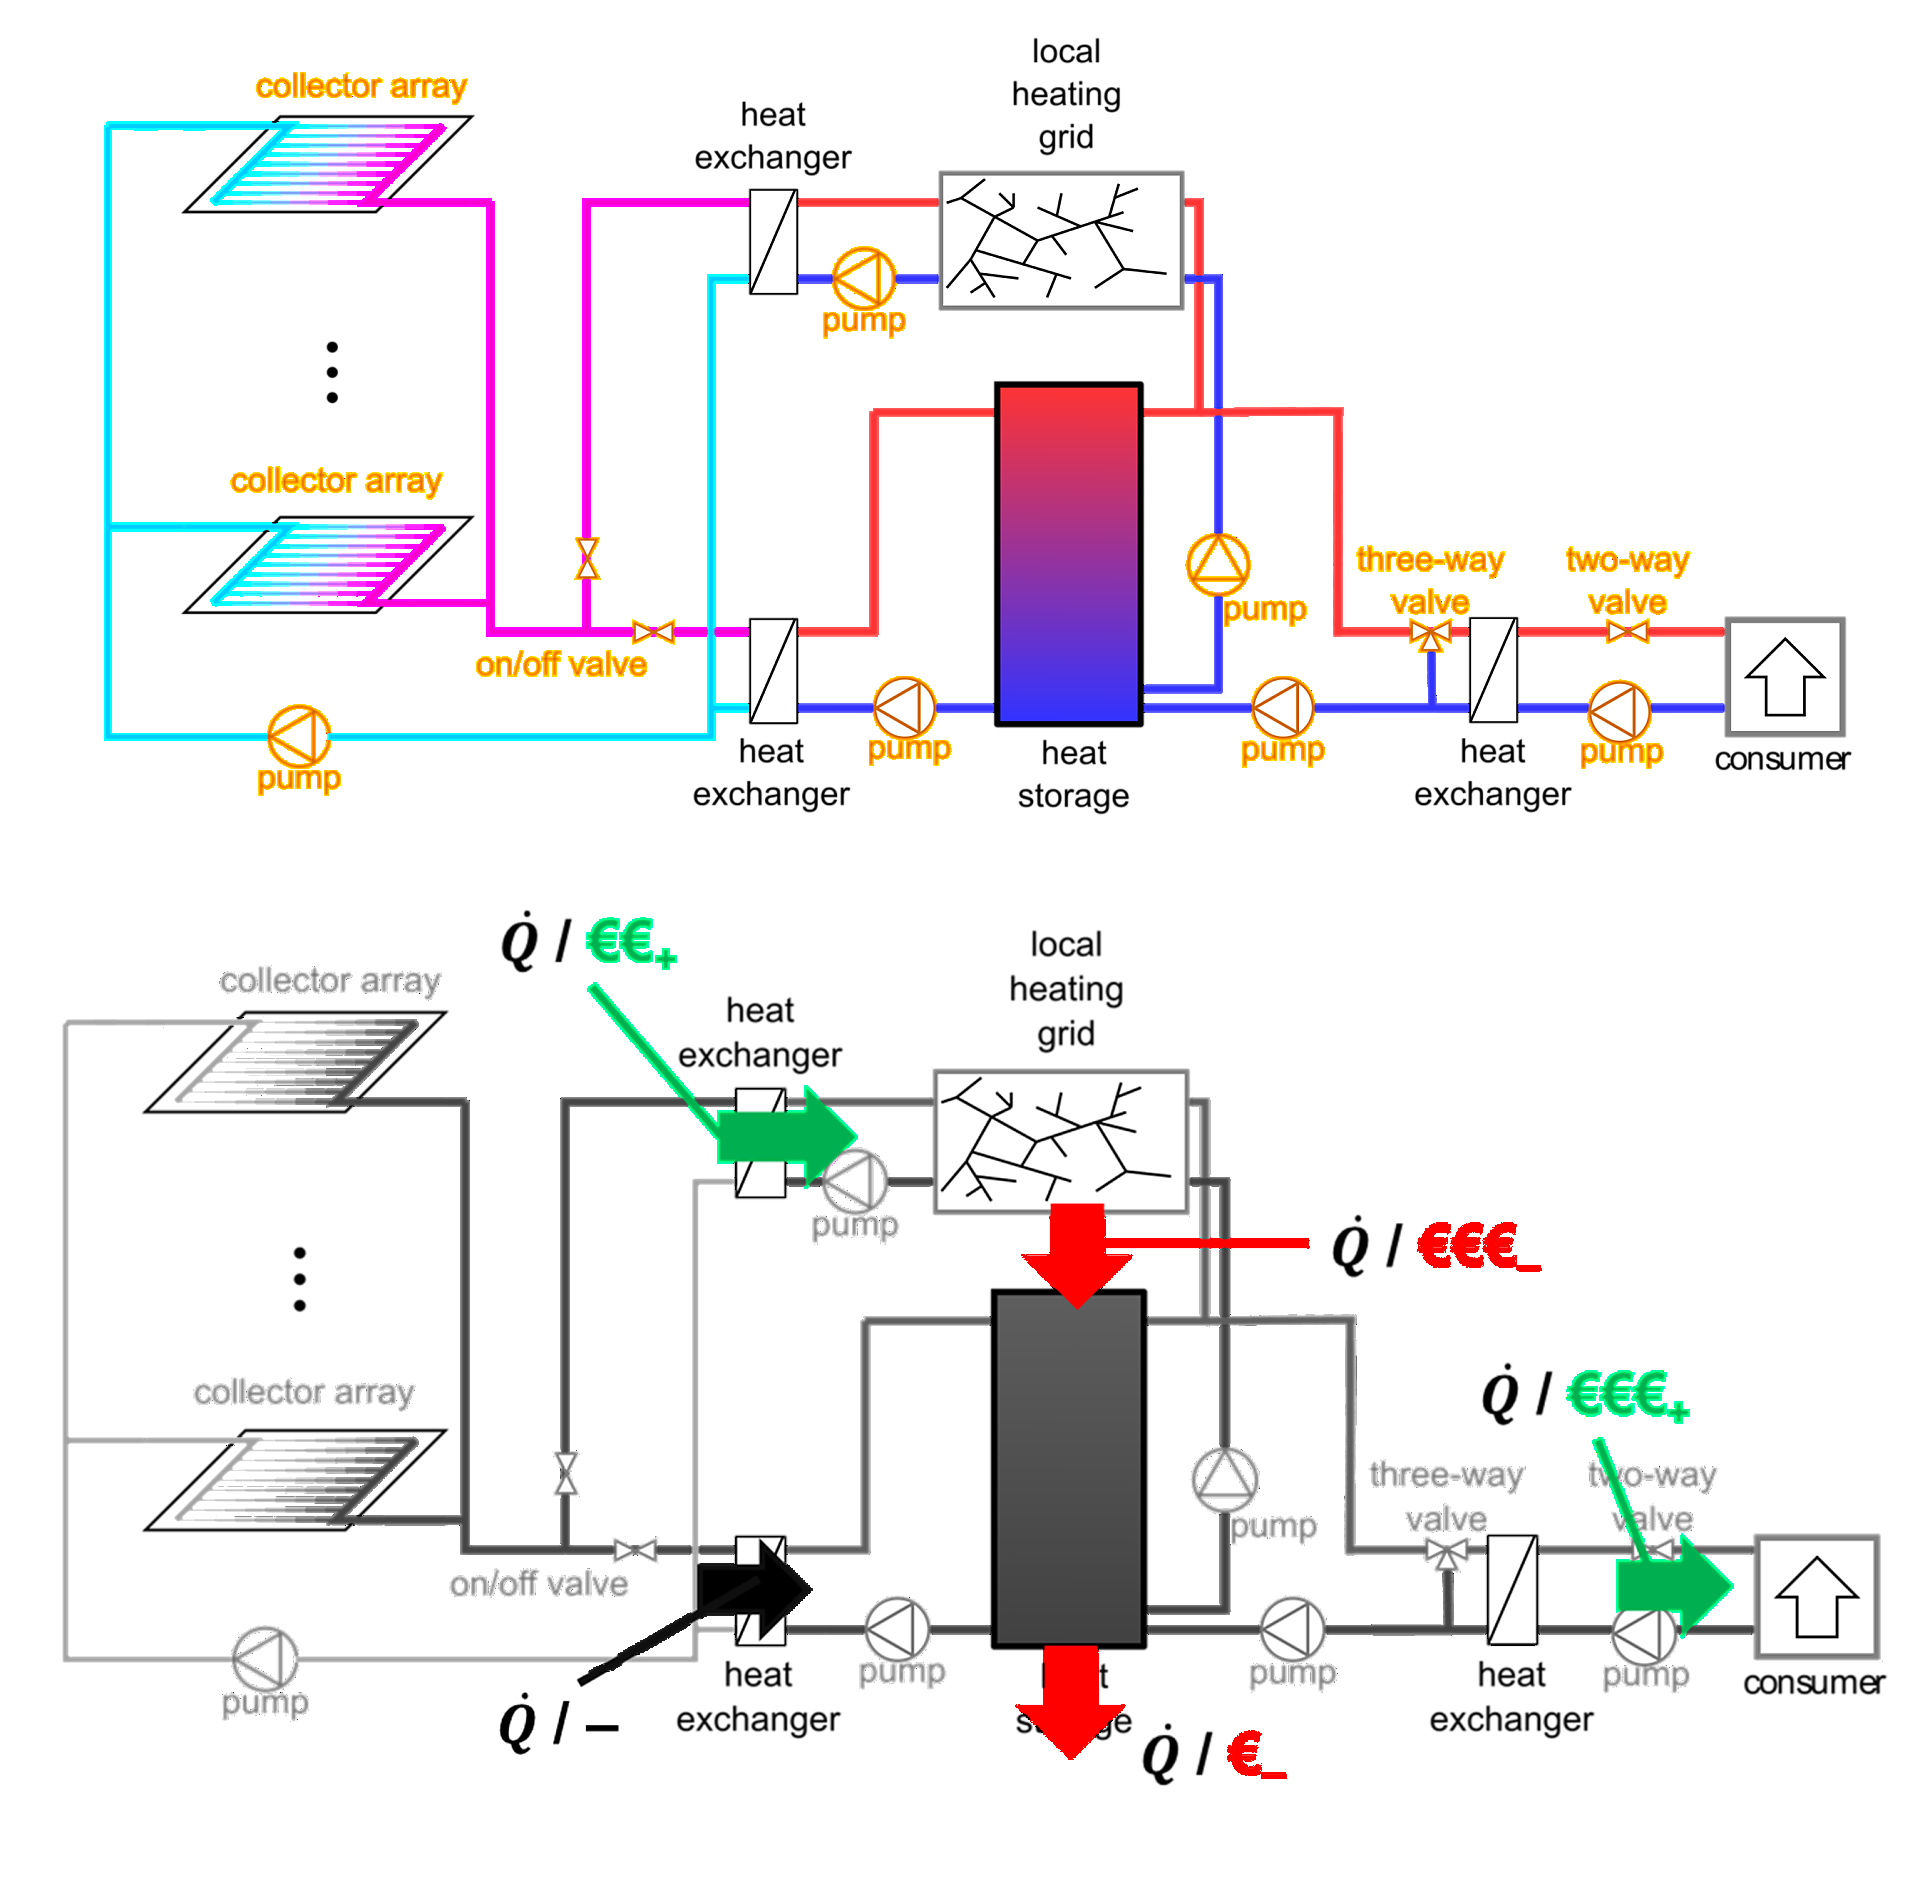
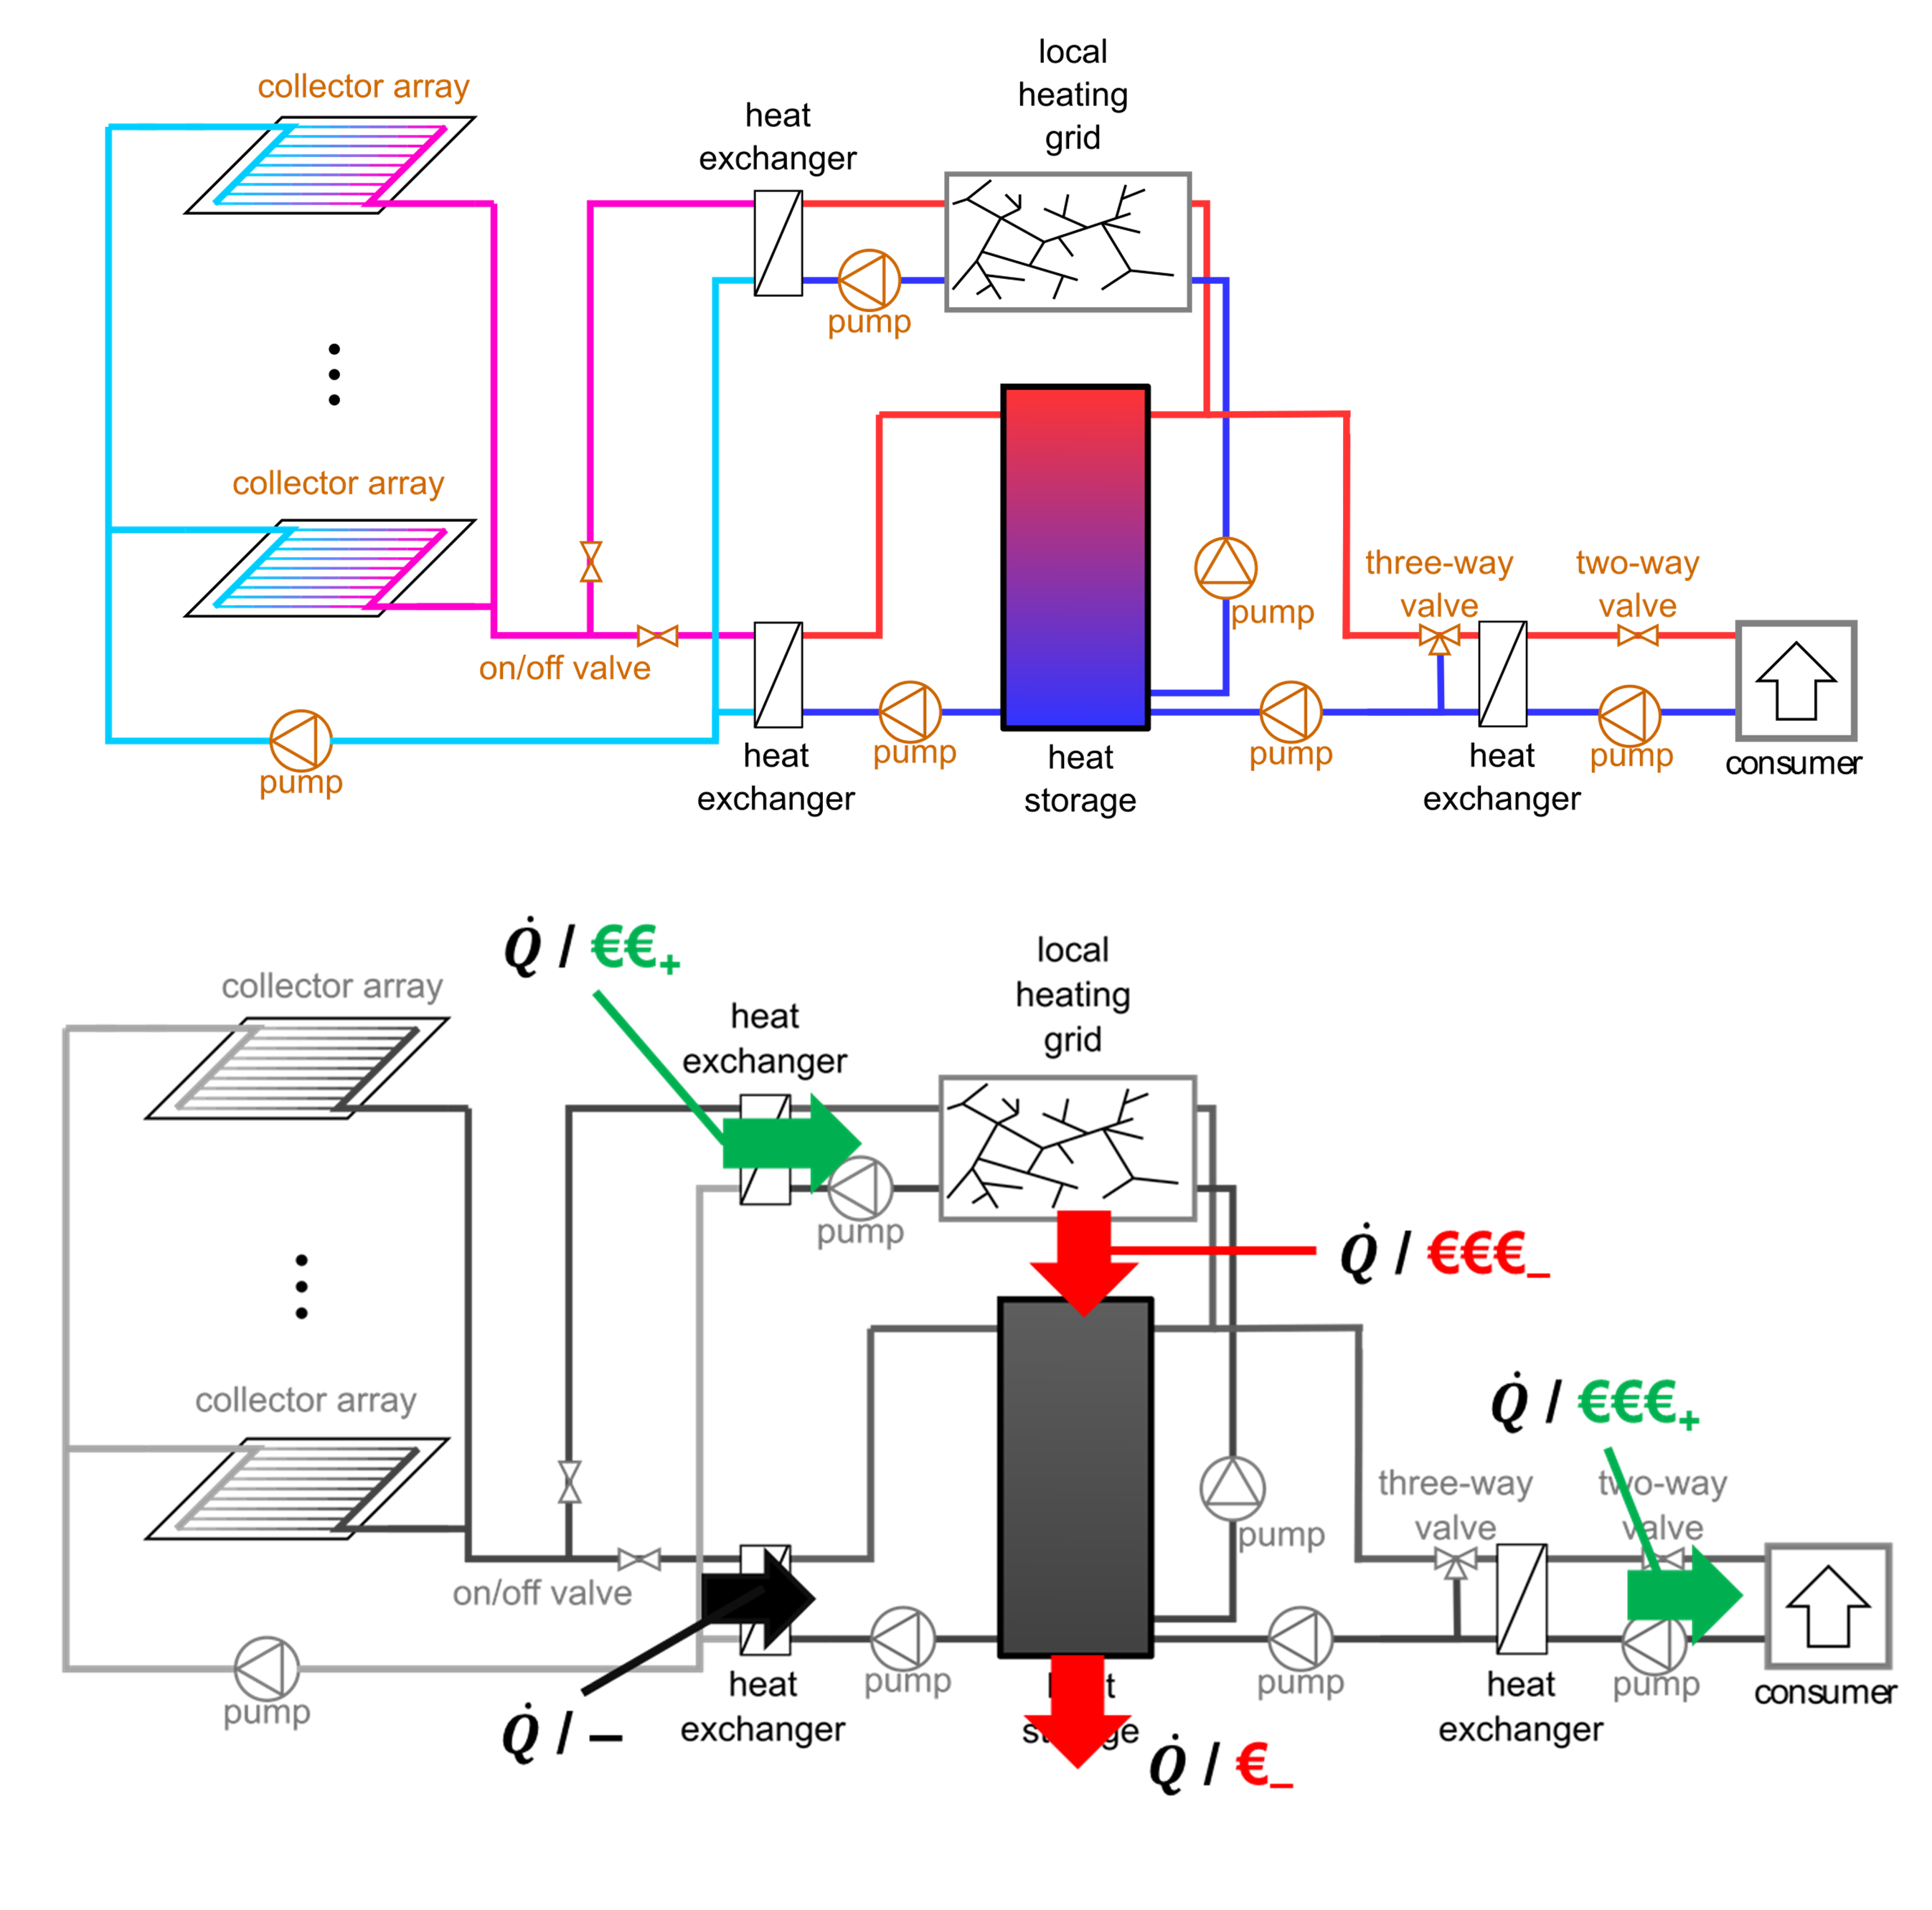
Solare District Heating: Structure, Heat and Revenue Streams
General structure of solar district heating (top) as well as important heat and revenue streams (bottom): The figure shows solar collectors, heat exchangers, a buffer storage, pumps, valves, the grid and consumers.
Copyright: © Dr. Viktor Unterberger / BEST GmbH
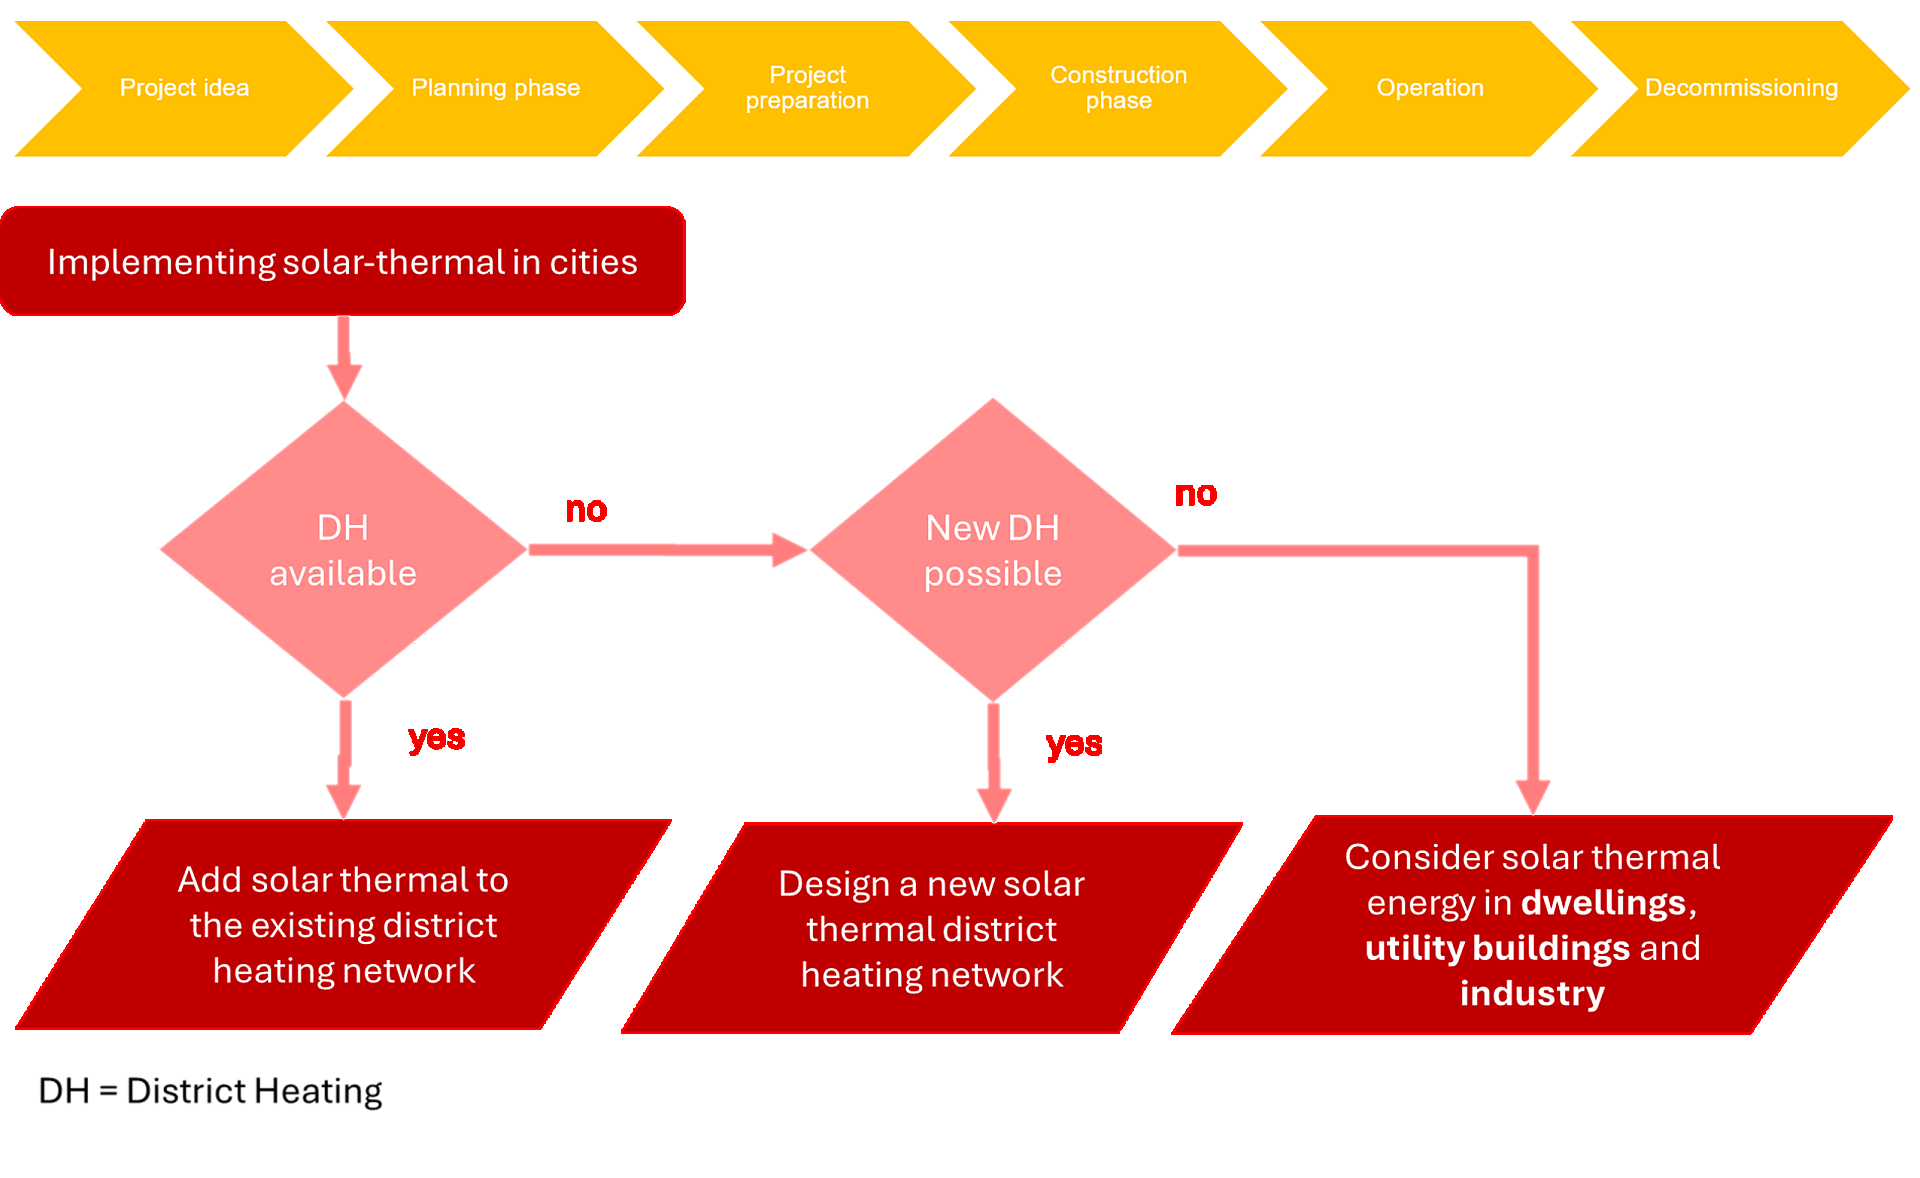
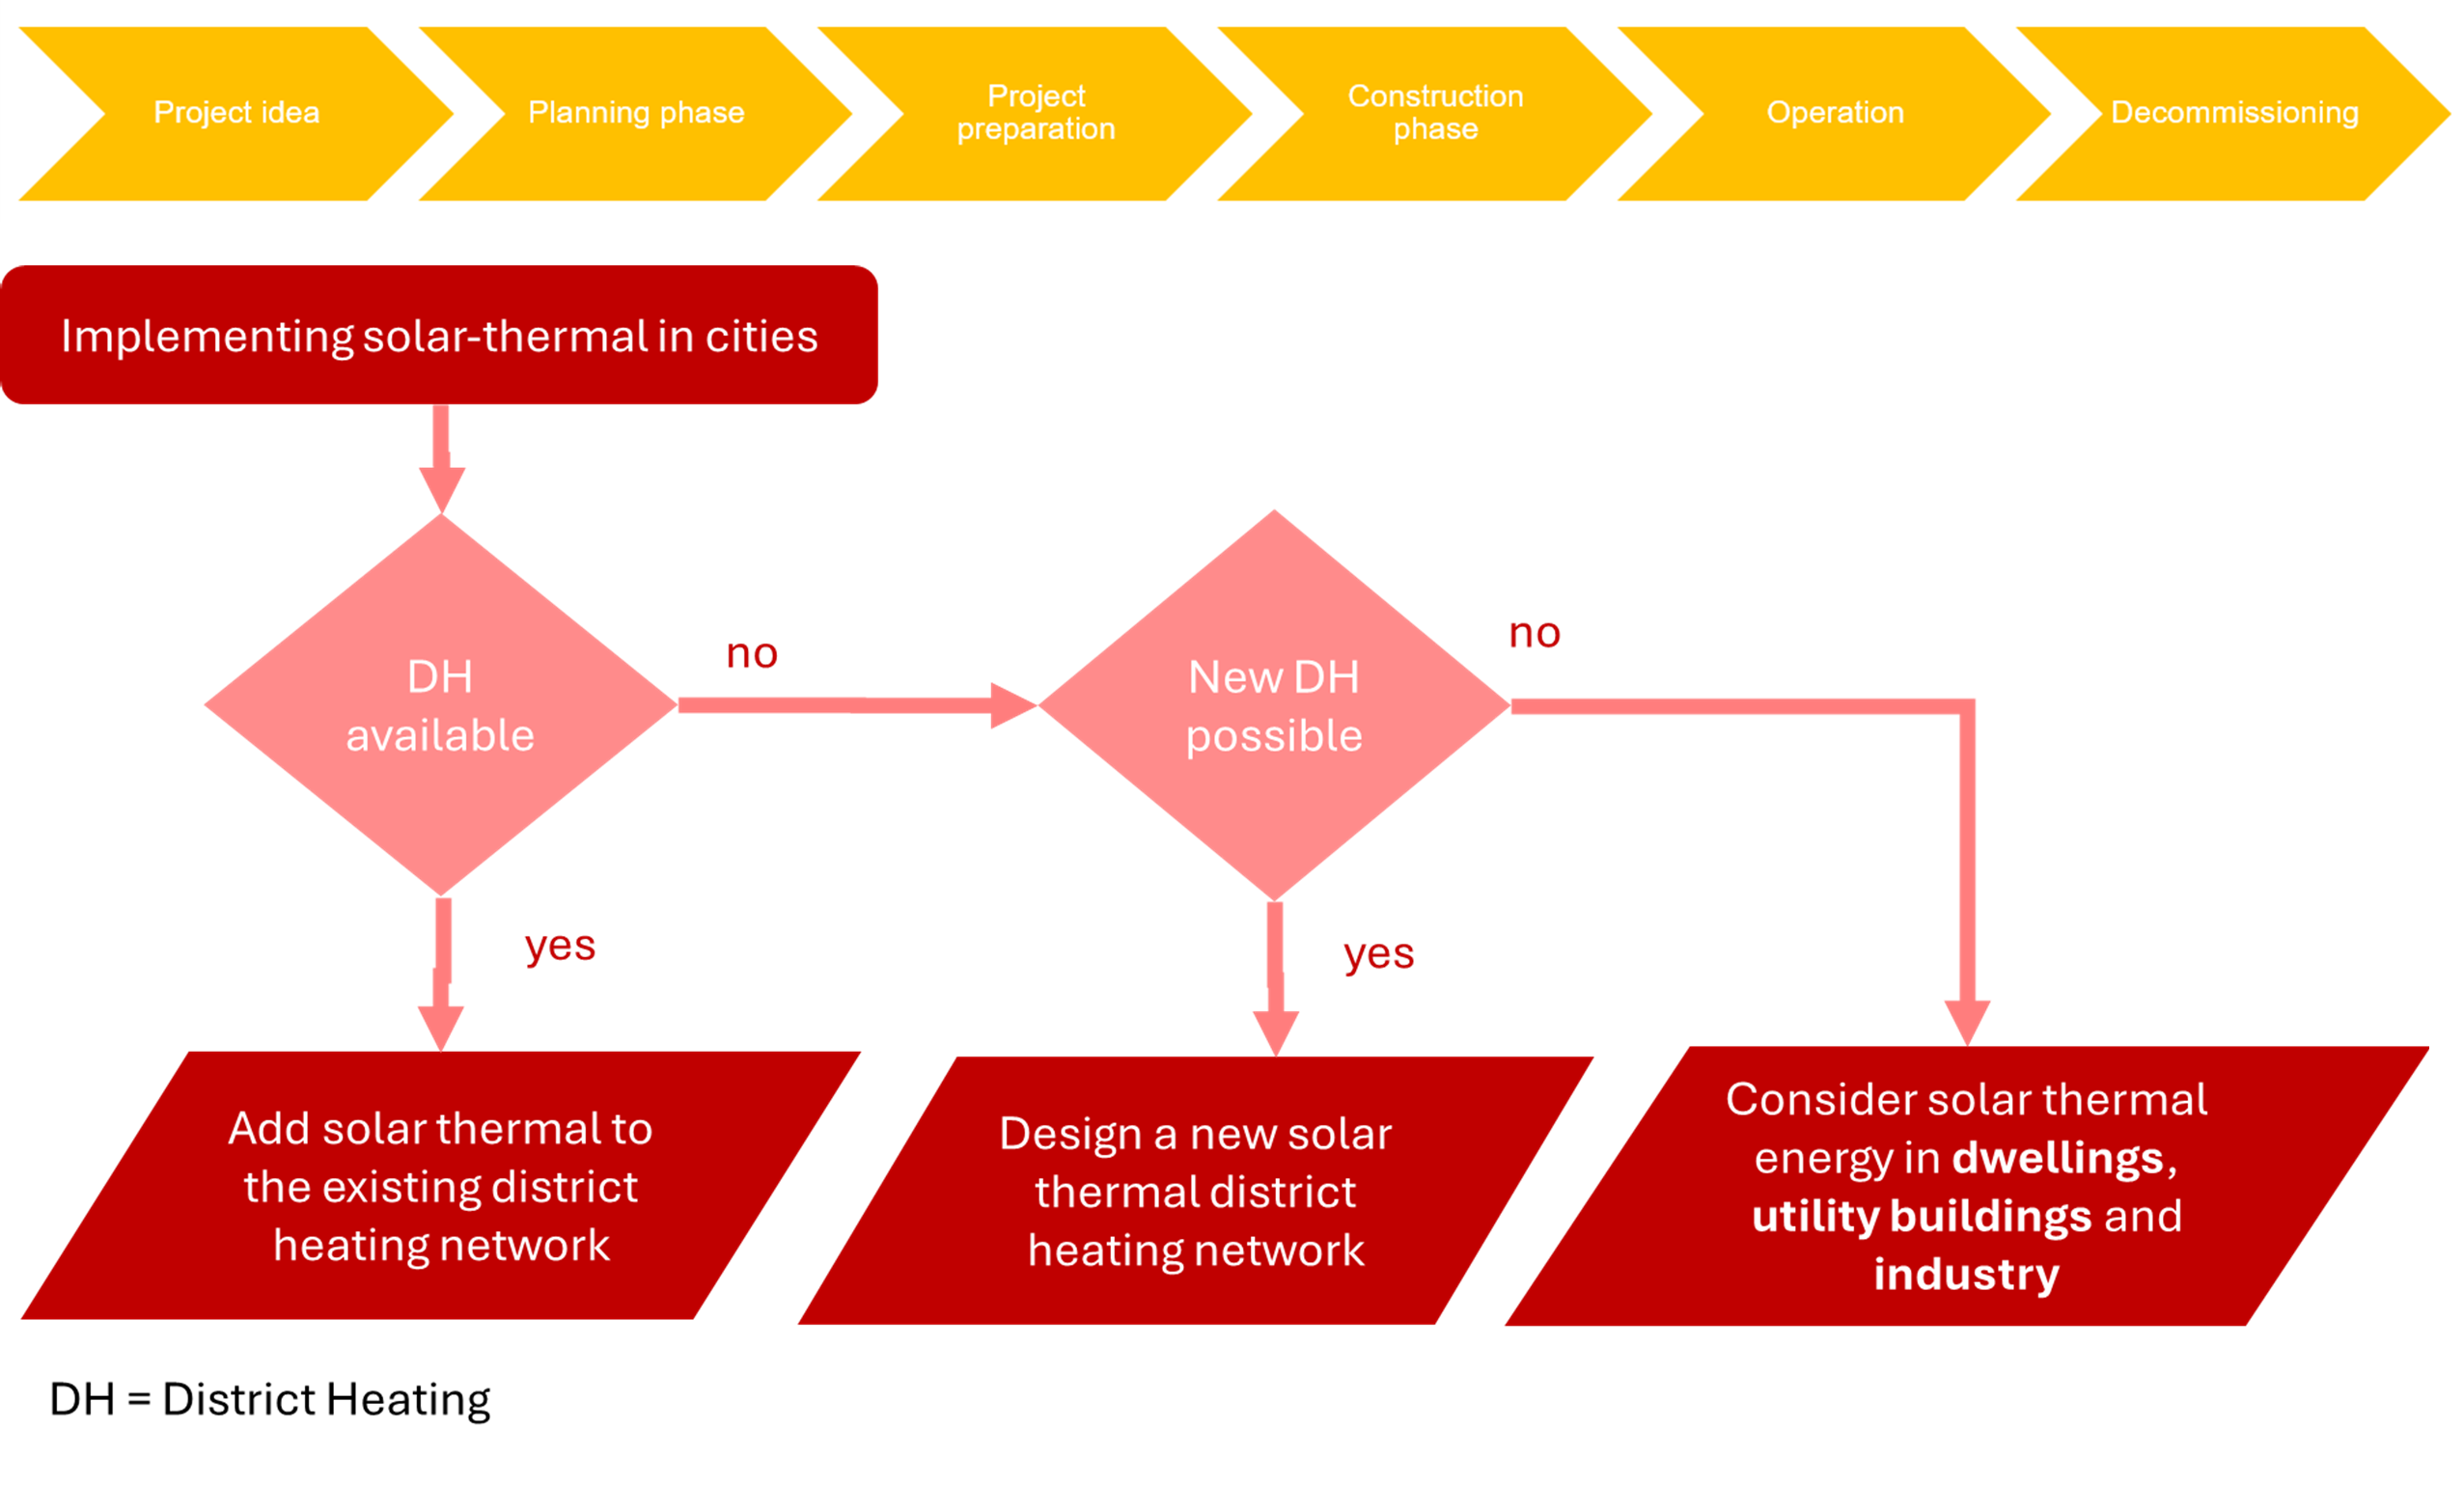
Thermal Solar Plants: Life Cycle and Planning
Stages in the solar thermal plant life cycle (top), flow chart for the decision about implementation of solar district heating (bottom)
Copyright: © IEA SHC Task 68 – Subtask C

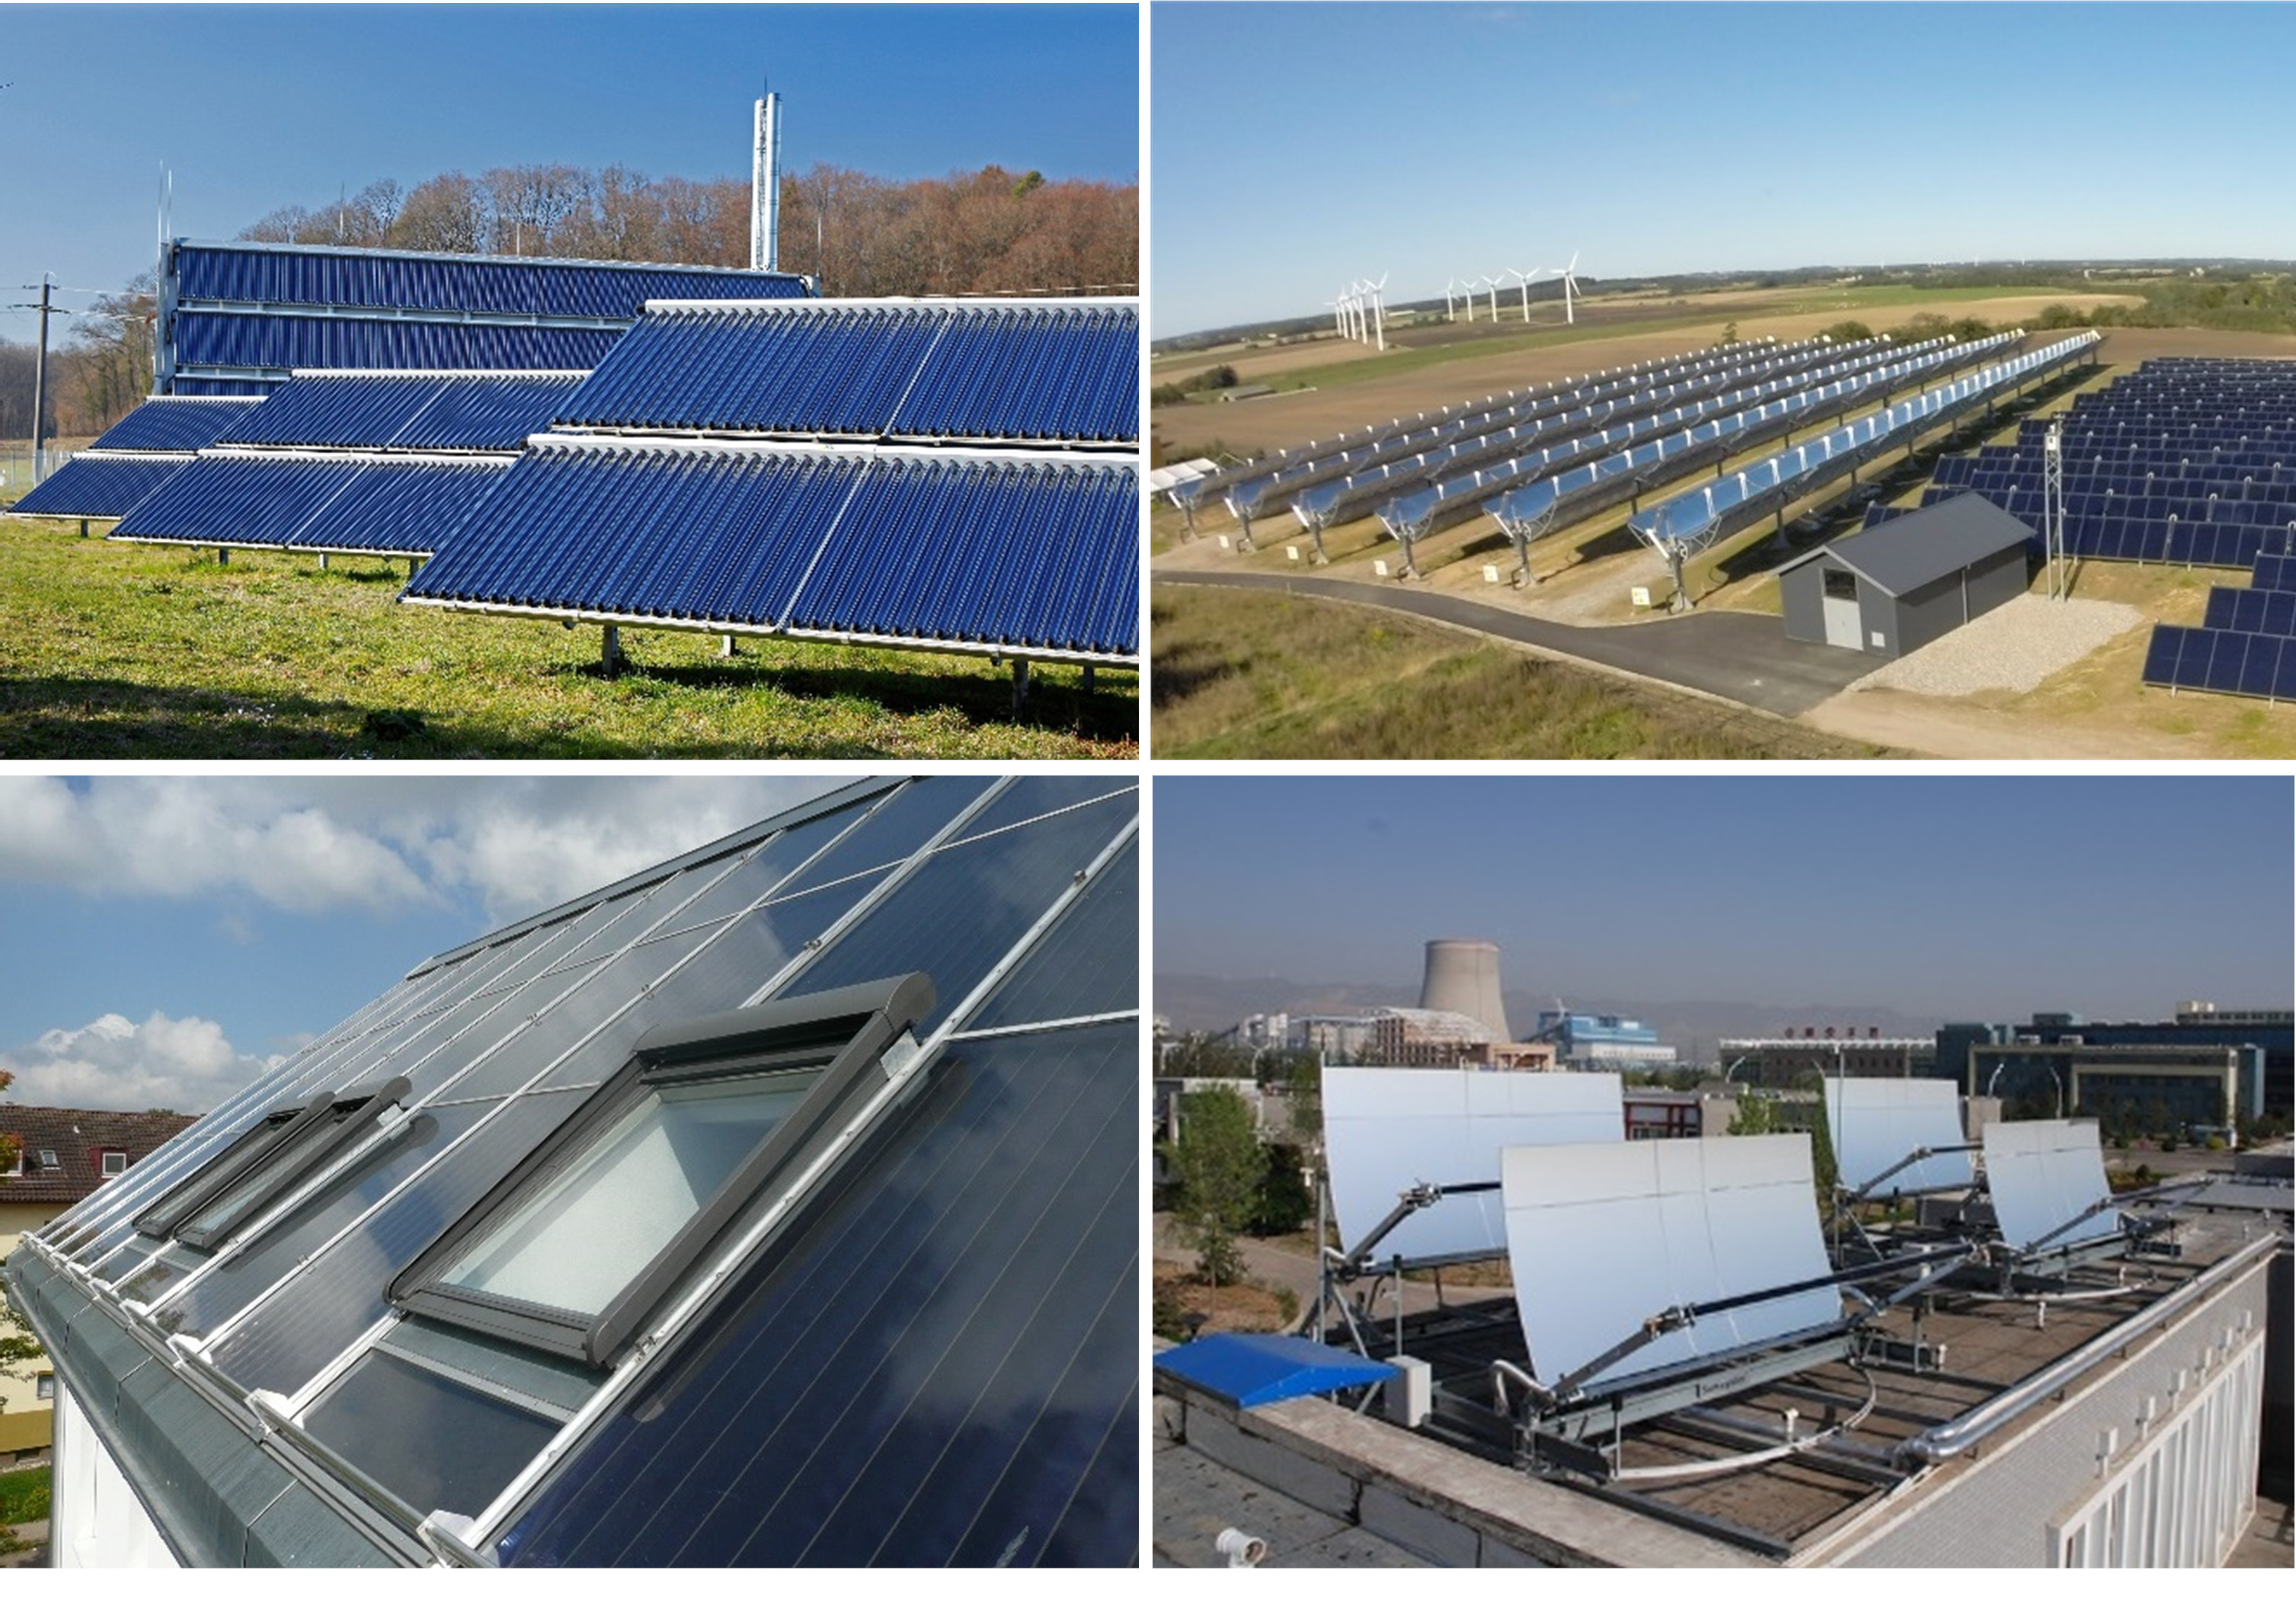
Examples for modern solar thermal collectors
Ground mounted evacuated tube collectors in Büsingen, Germany; combination of flat plate collectors and parabolic trough collectors in Taars, Denmark; roof integrated solar thermal collectors on “solar@home” building in Crailsheim, Germany; demo system of Sun Oyster on a flat roof in Zhangjiakou, China
Copyright: © Solites, Aalborg CSP und sunoyster.com

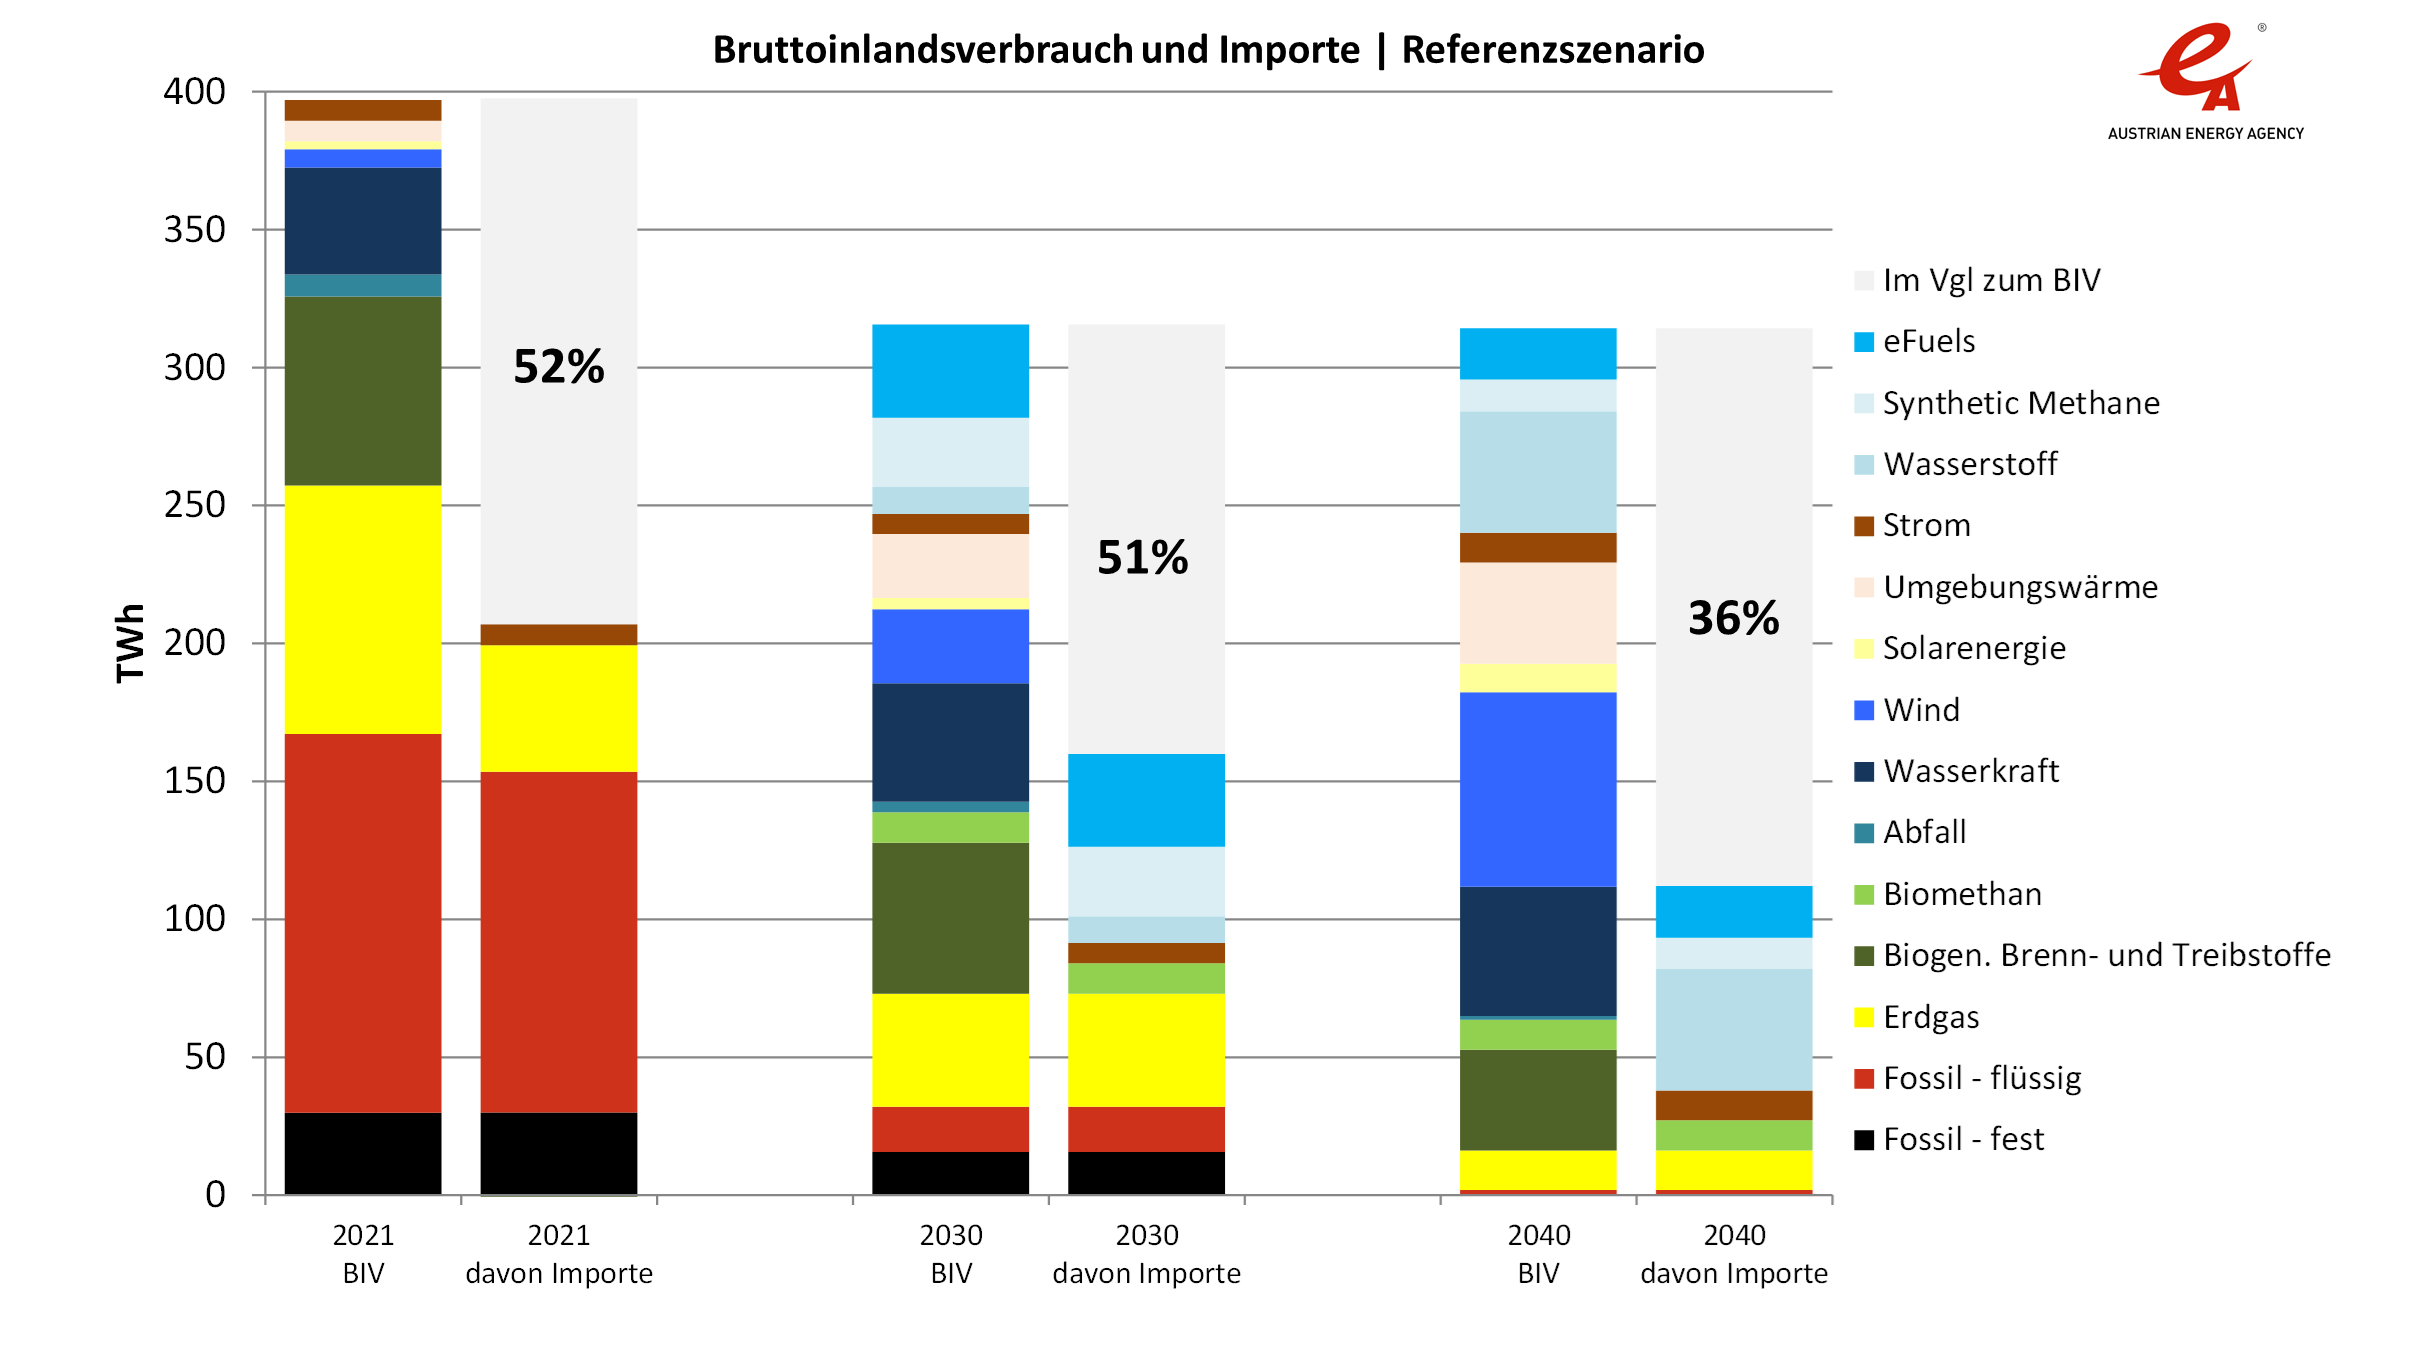
Gross domestic consumption in the reference scenario
The figure shows the gross domestic consumption of the individual energy sources in 2021, 2030 and 2040 in the Reference scenario. The quantitative description of the figure can be found in the report in section 5.4.1 in the text for Figure 9.
Copyright: Martin Baumann/Österreichische Energieagentur

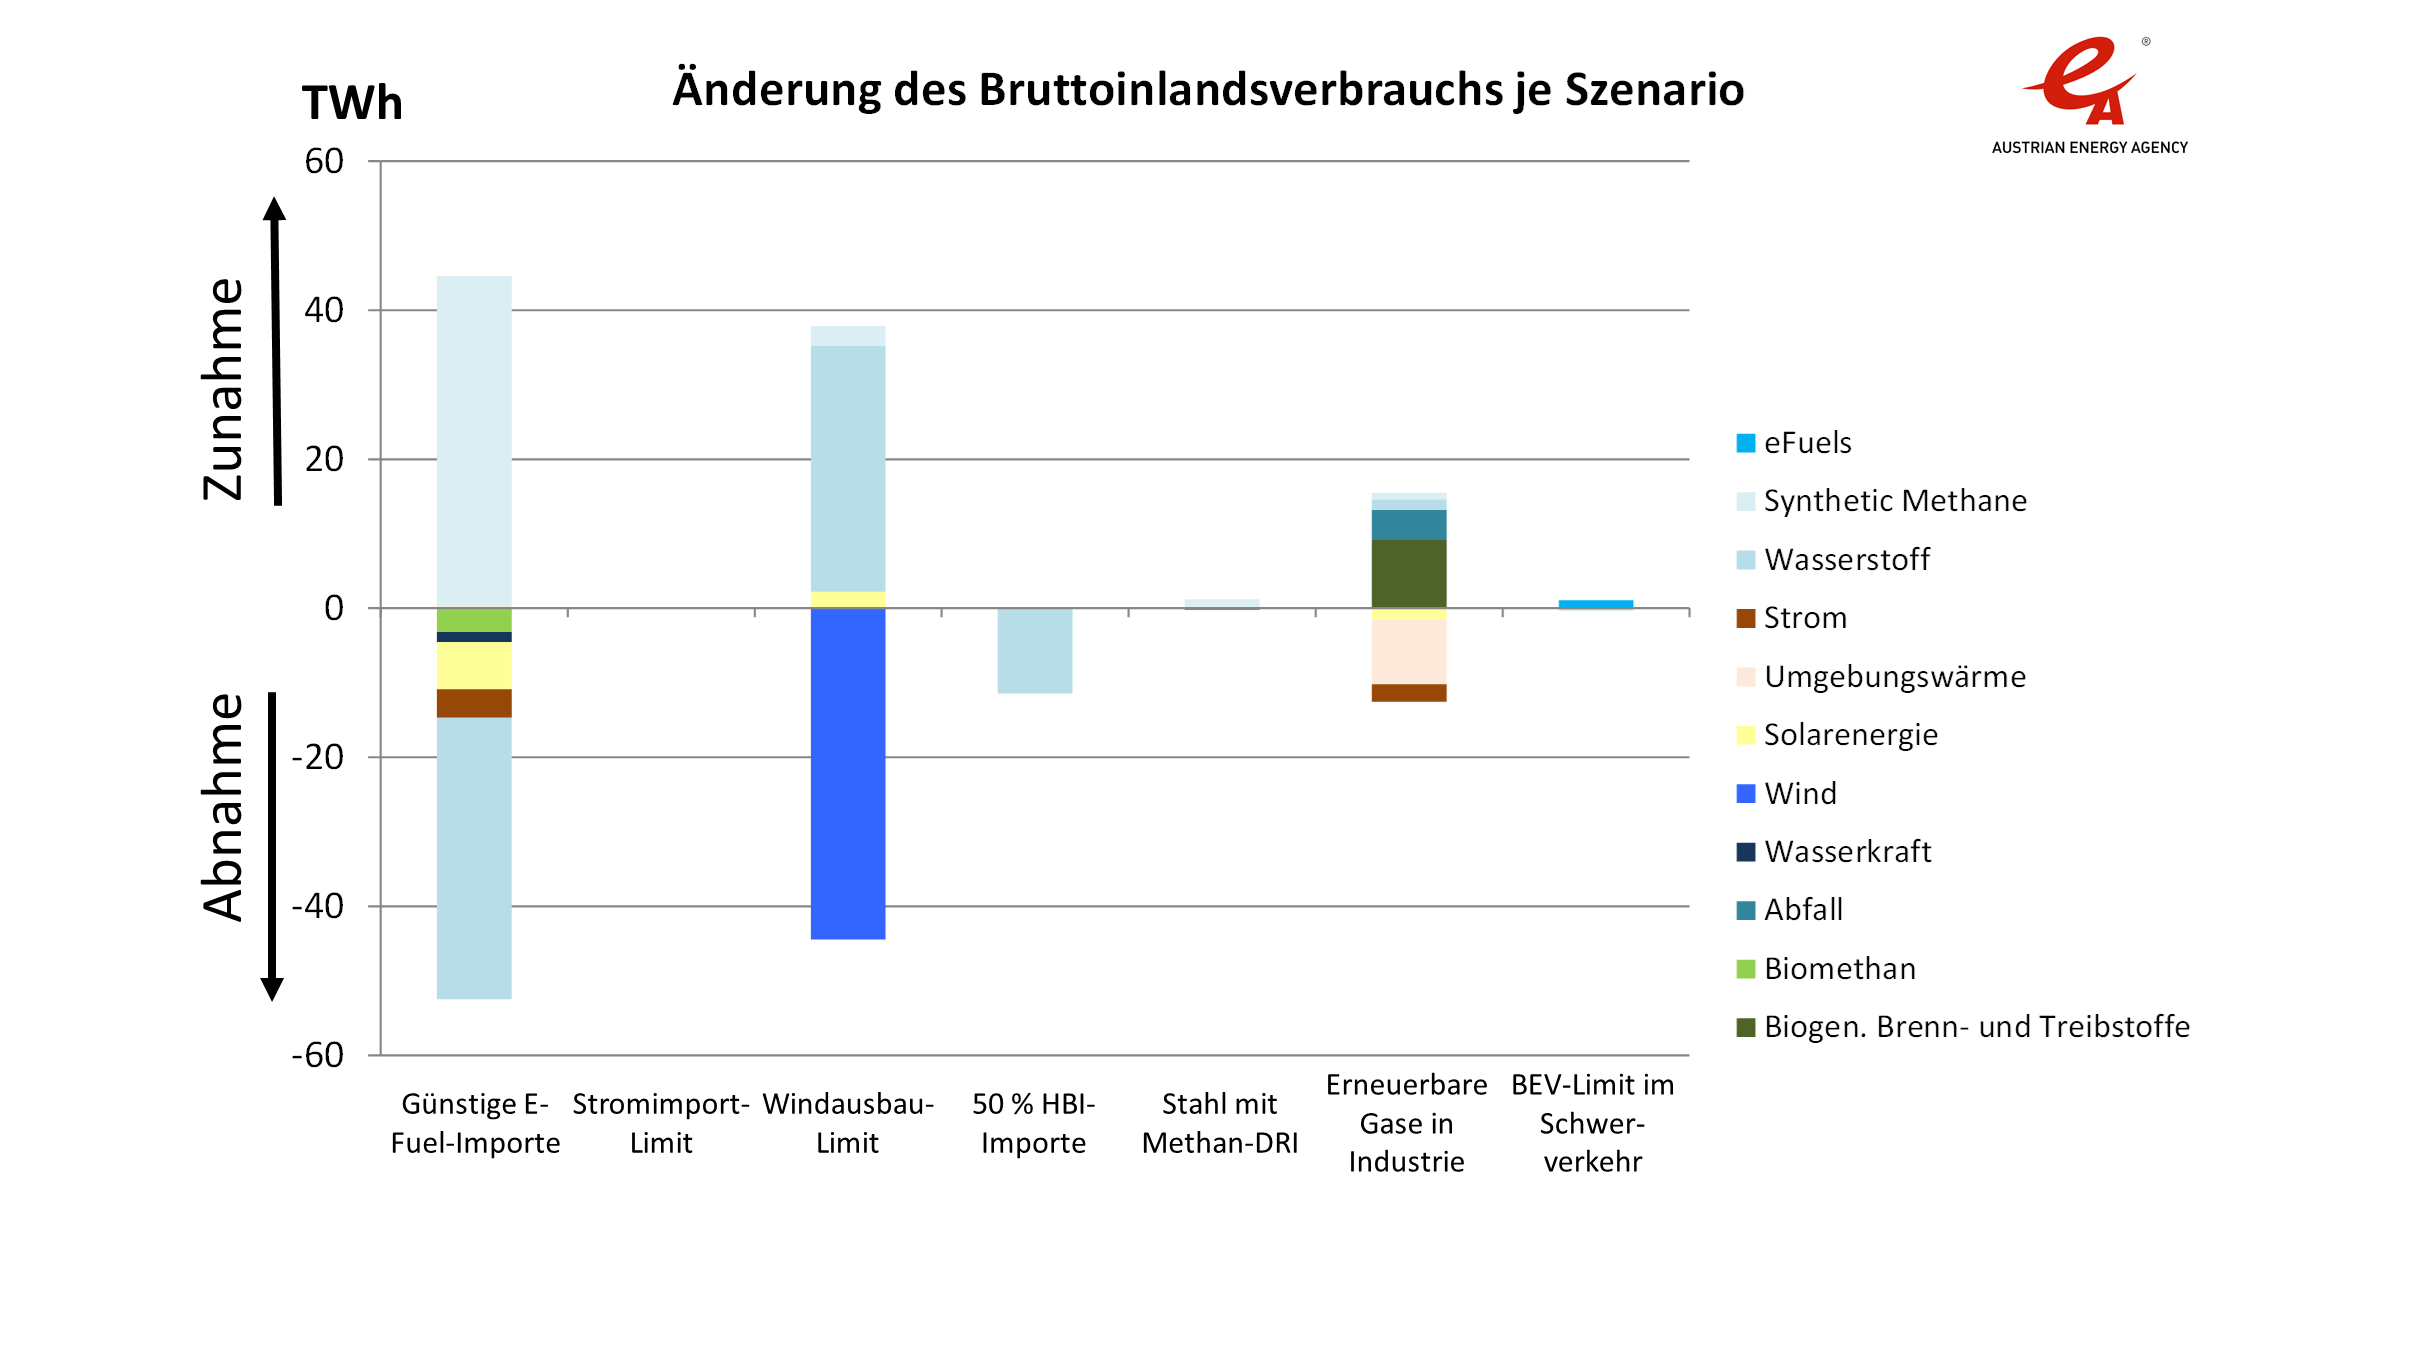
Change in gross domestic consumption in 2040 in the scenario variants
The figure shows the change in gross domestic consumption of the individual energy sources in 2040 due to the variation in scenario assumptions. The quantitative description of the figure can be found in the report in Section 5.4.2 in the text for Figure 15.
Copyright: Martin Baumann/Österreichische Energieagentur
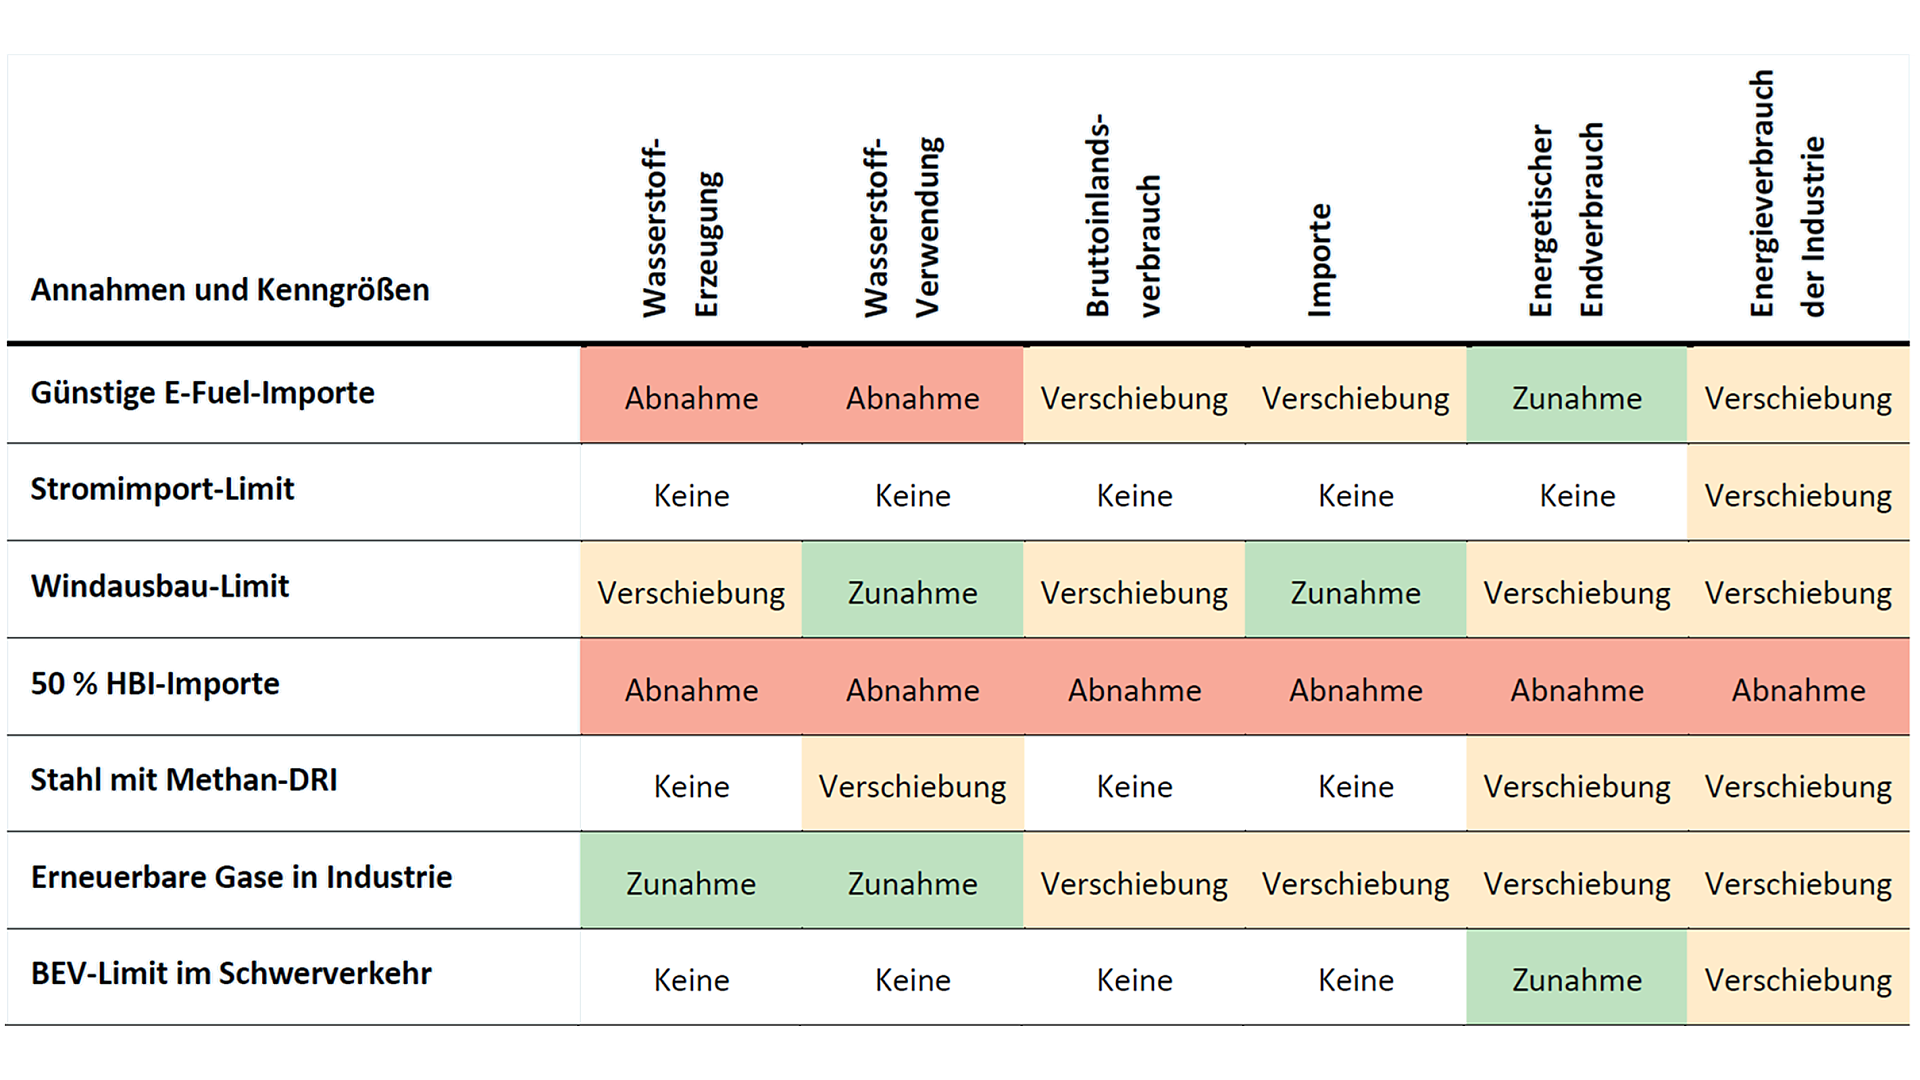
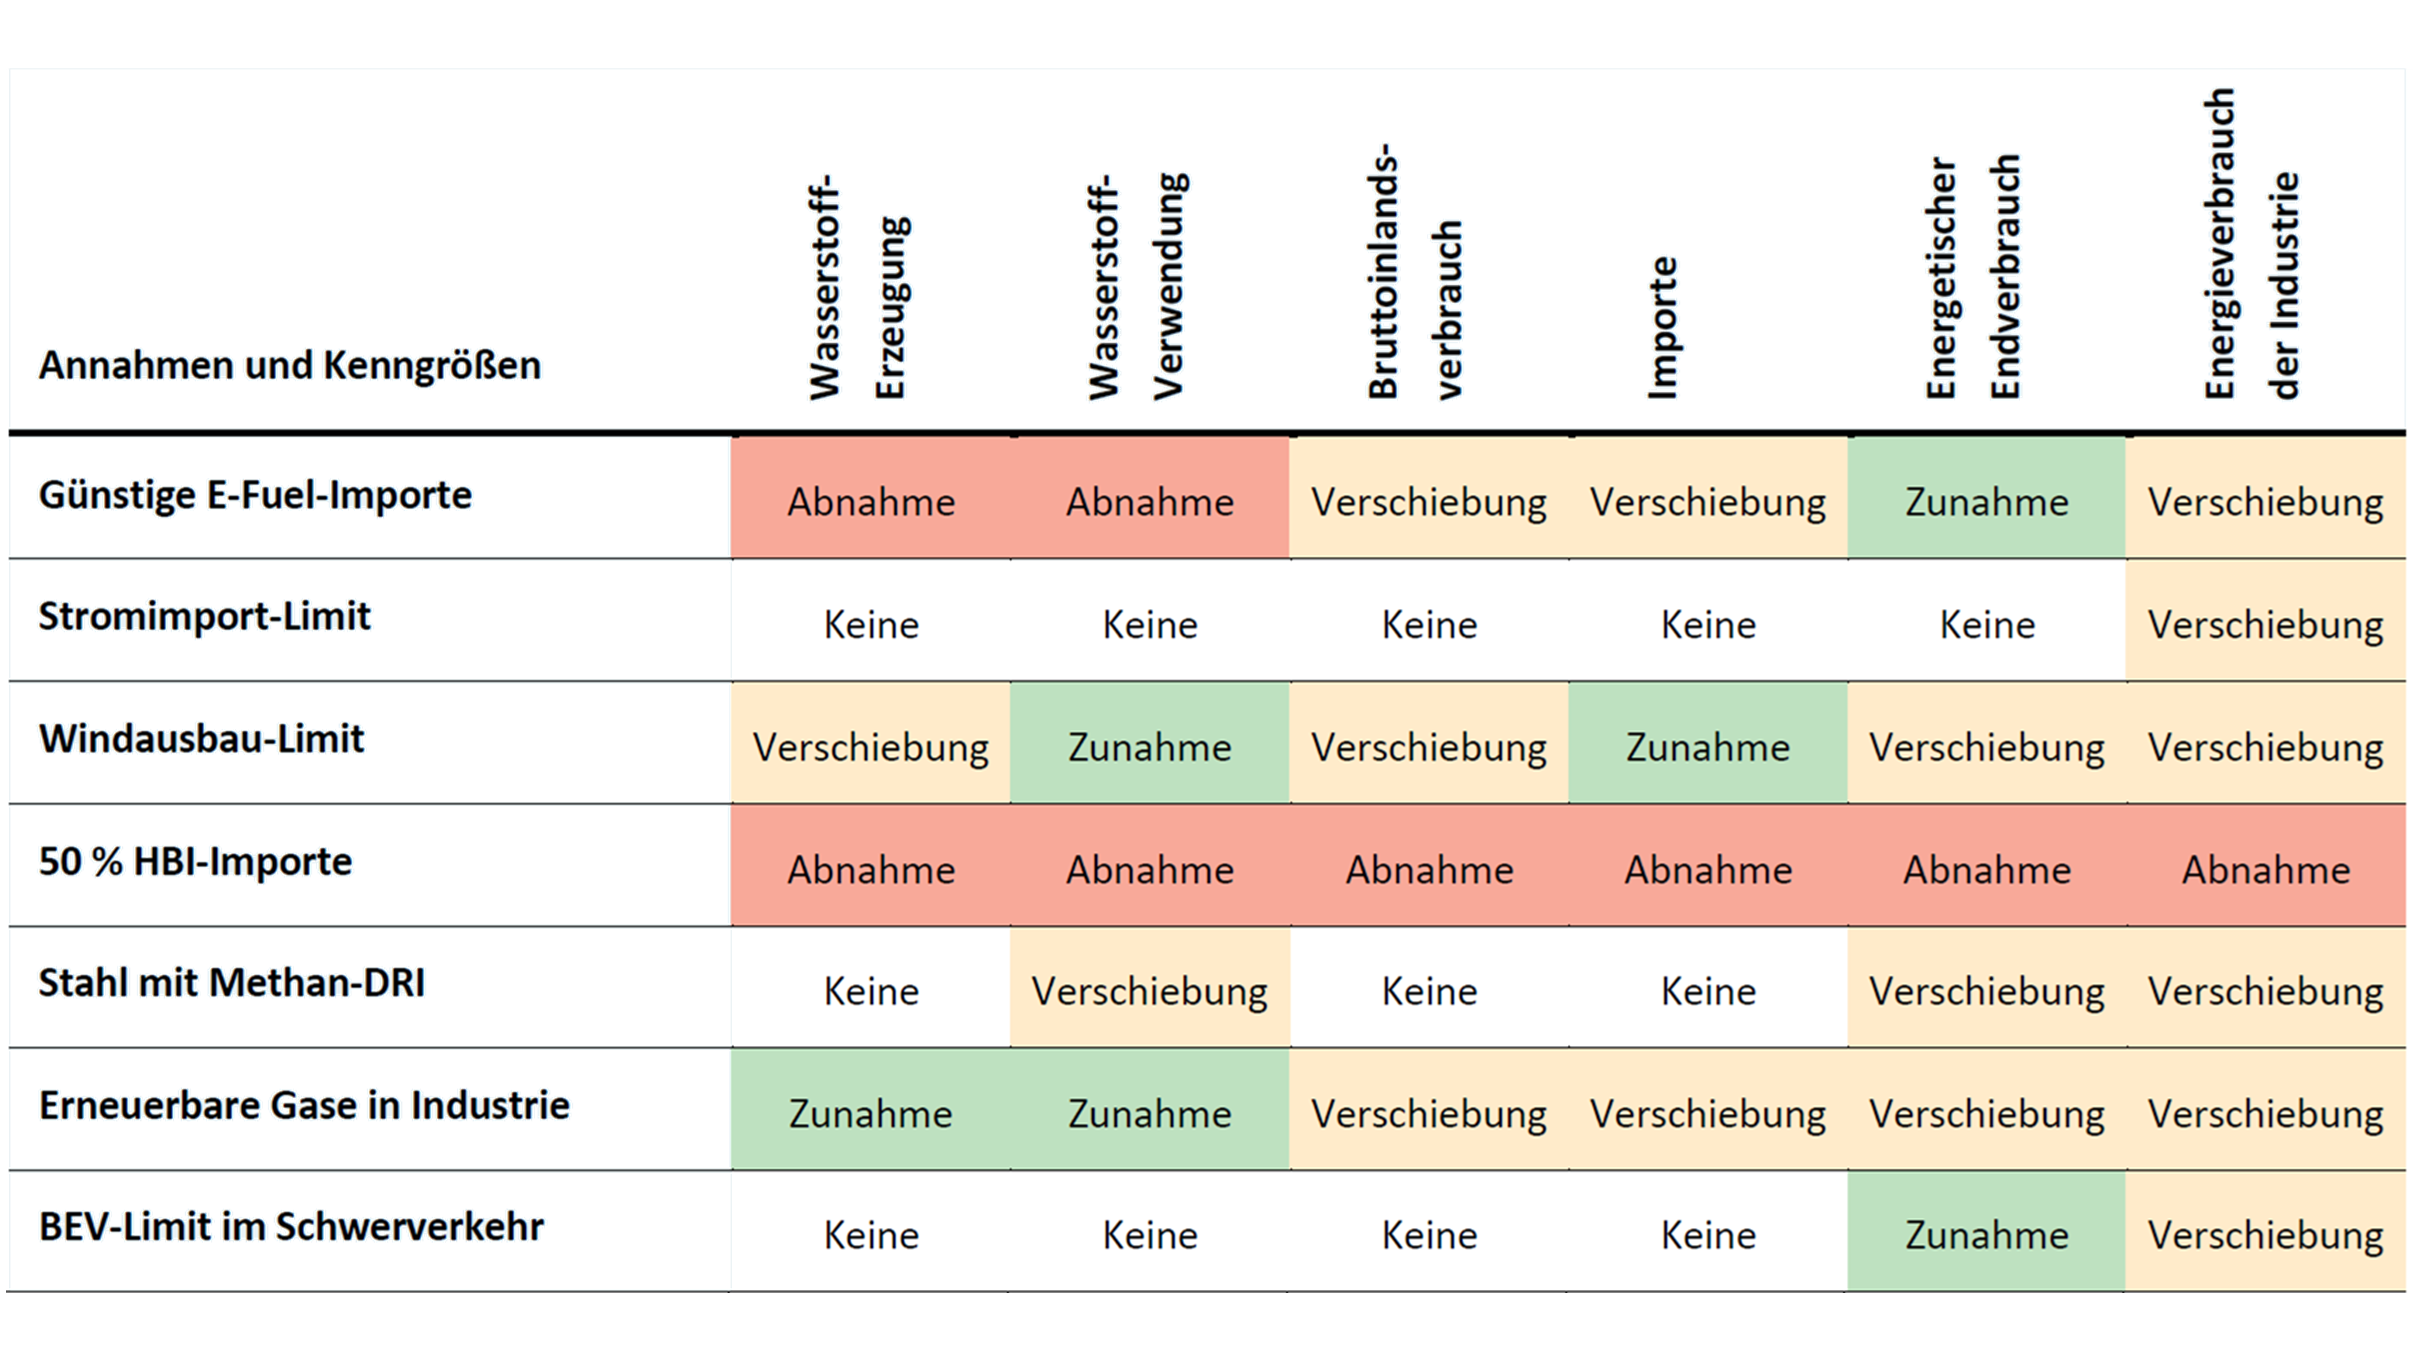
Qualitative effects of varying the scenario assumptions on selected scenario results
The figure shows the qualitative effects of varying the scenario assumptions on selected scenario results in a table. The quantitative description of the figure can be found in the report in Section 5.4.3 in Table 20.