Project Image Pool
There are 13 results.
Terms of use: The pictures on this site originate from the projects in the frame of the programmes City of Tomorrow, Building of Tomorrow and the IEA Research Cooperation. They may be used credited for non-commercial purposes under the Creative Commons License Attribution-NonCommercial (CC BY-NC).
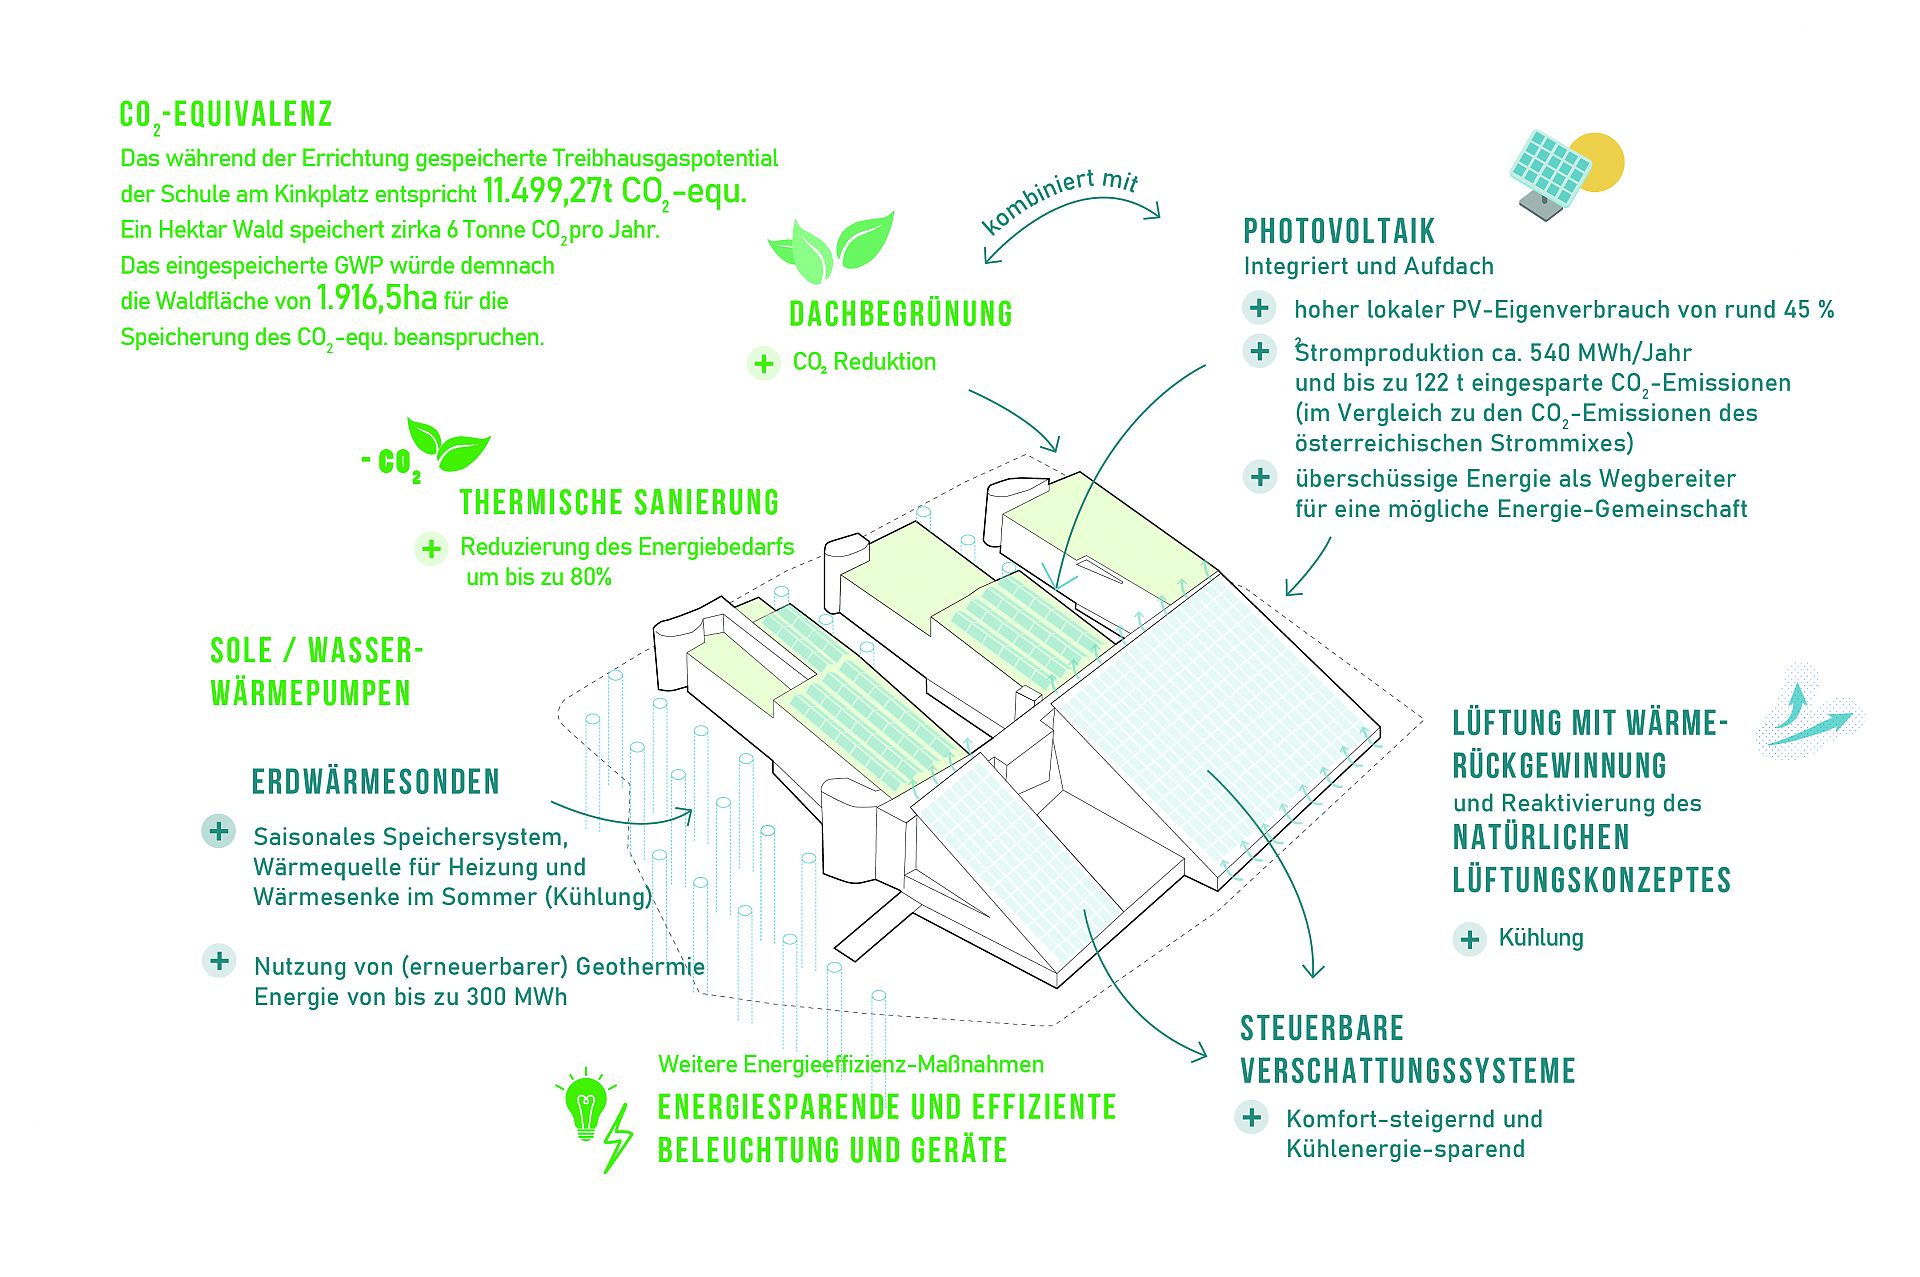
Benefits of energy-efficient refurbishment using the example of the school at Kinkplatz
The transferability of the project helps to accelerate the renovation wave and focuses particularly on difficult buildings with high energy consumption. The strategies and findings from GreenTech-Renovation can be transferred to all buildings dating from the last 70 years with high proportions of glass and with intelligent adaptations even further.
Copyright: GreenTech-Renovation Konsortium
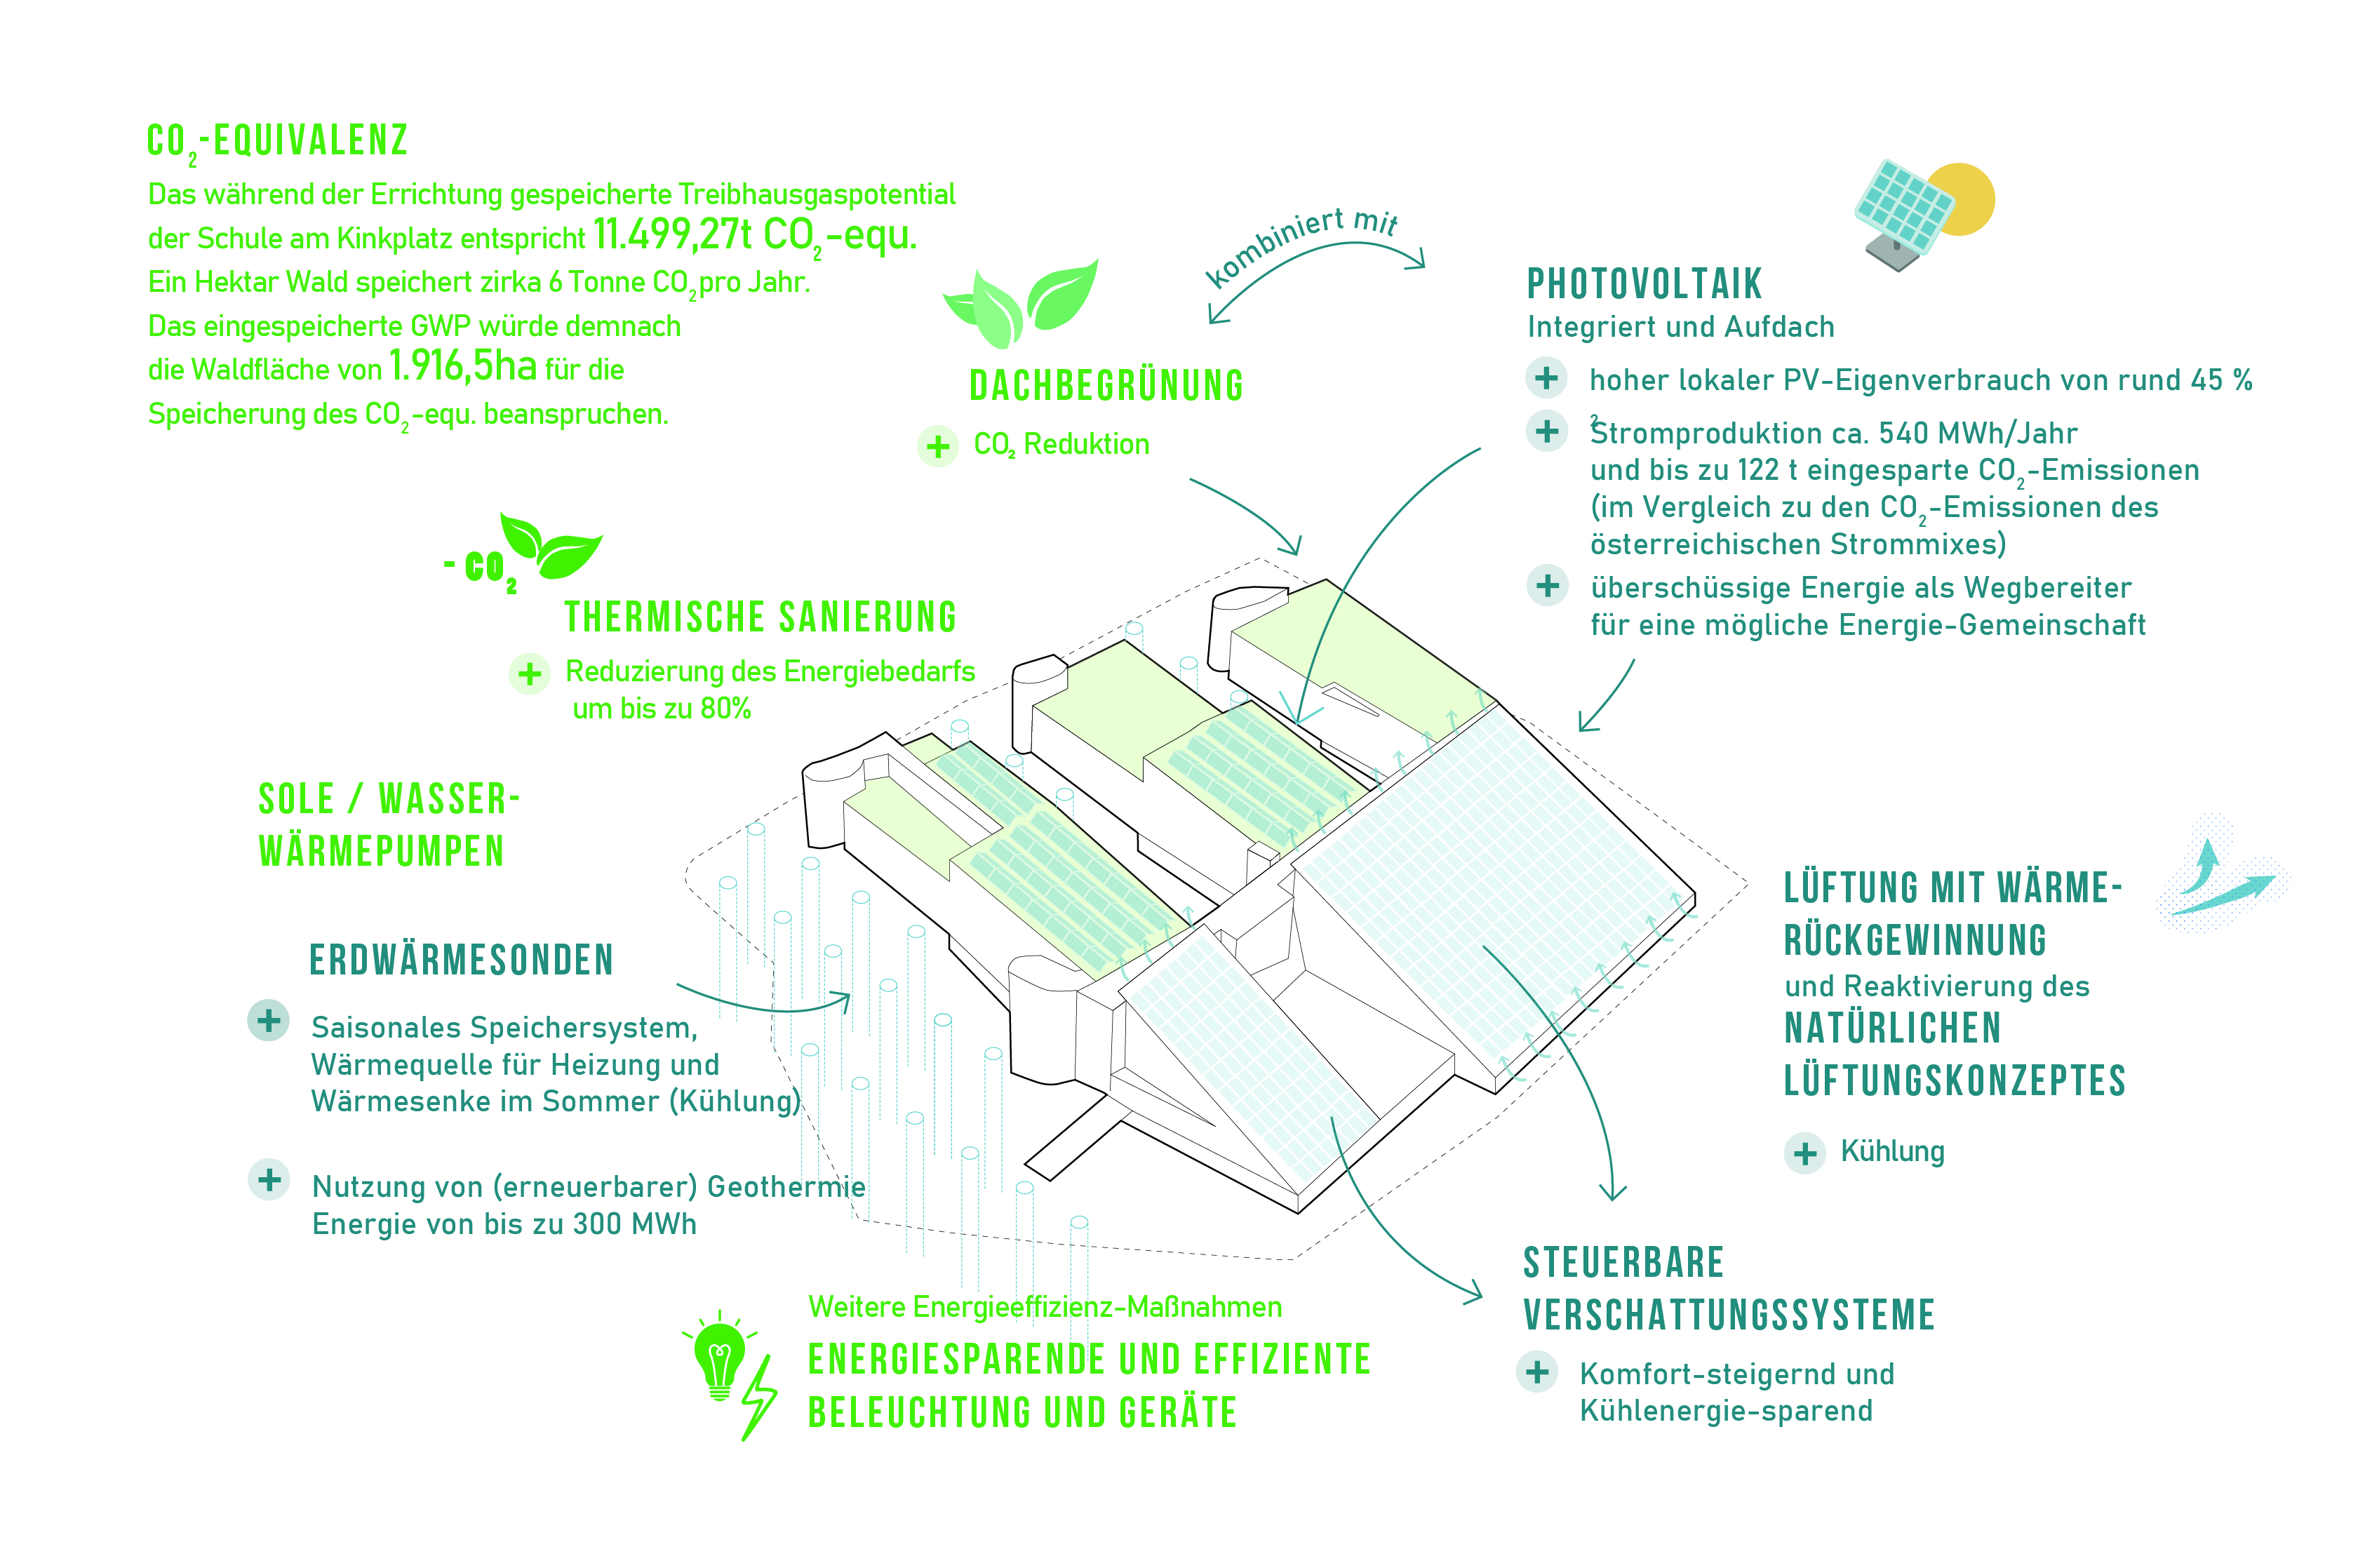
Greening concept of the School at Kinkplatz
In addition to the climate and energy concept and the utilisation concept, effective synergies are created with greening measures on the façade, on the roof and in the interior. With innovative and coordinated integration of vegetation, the performance potential of building optimisation and energy measures can be increased.
Copyright: GreenTech-Renovation Konsortium

Vertical farming concept for the School at Kinkplatz
During the exploratory project, the idea arose to use the school at Kinkplatz as a training centre for future urban farmers or vertical farmers. Special significance is attributed to the possibility of seeing food production as a central component of an overarching typological further development of the existing building as a training centre for urban vertical farming. This gives the school at Kinkplatz a unique selling point worldwide.
Copyright: vertical farm institute
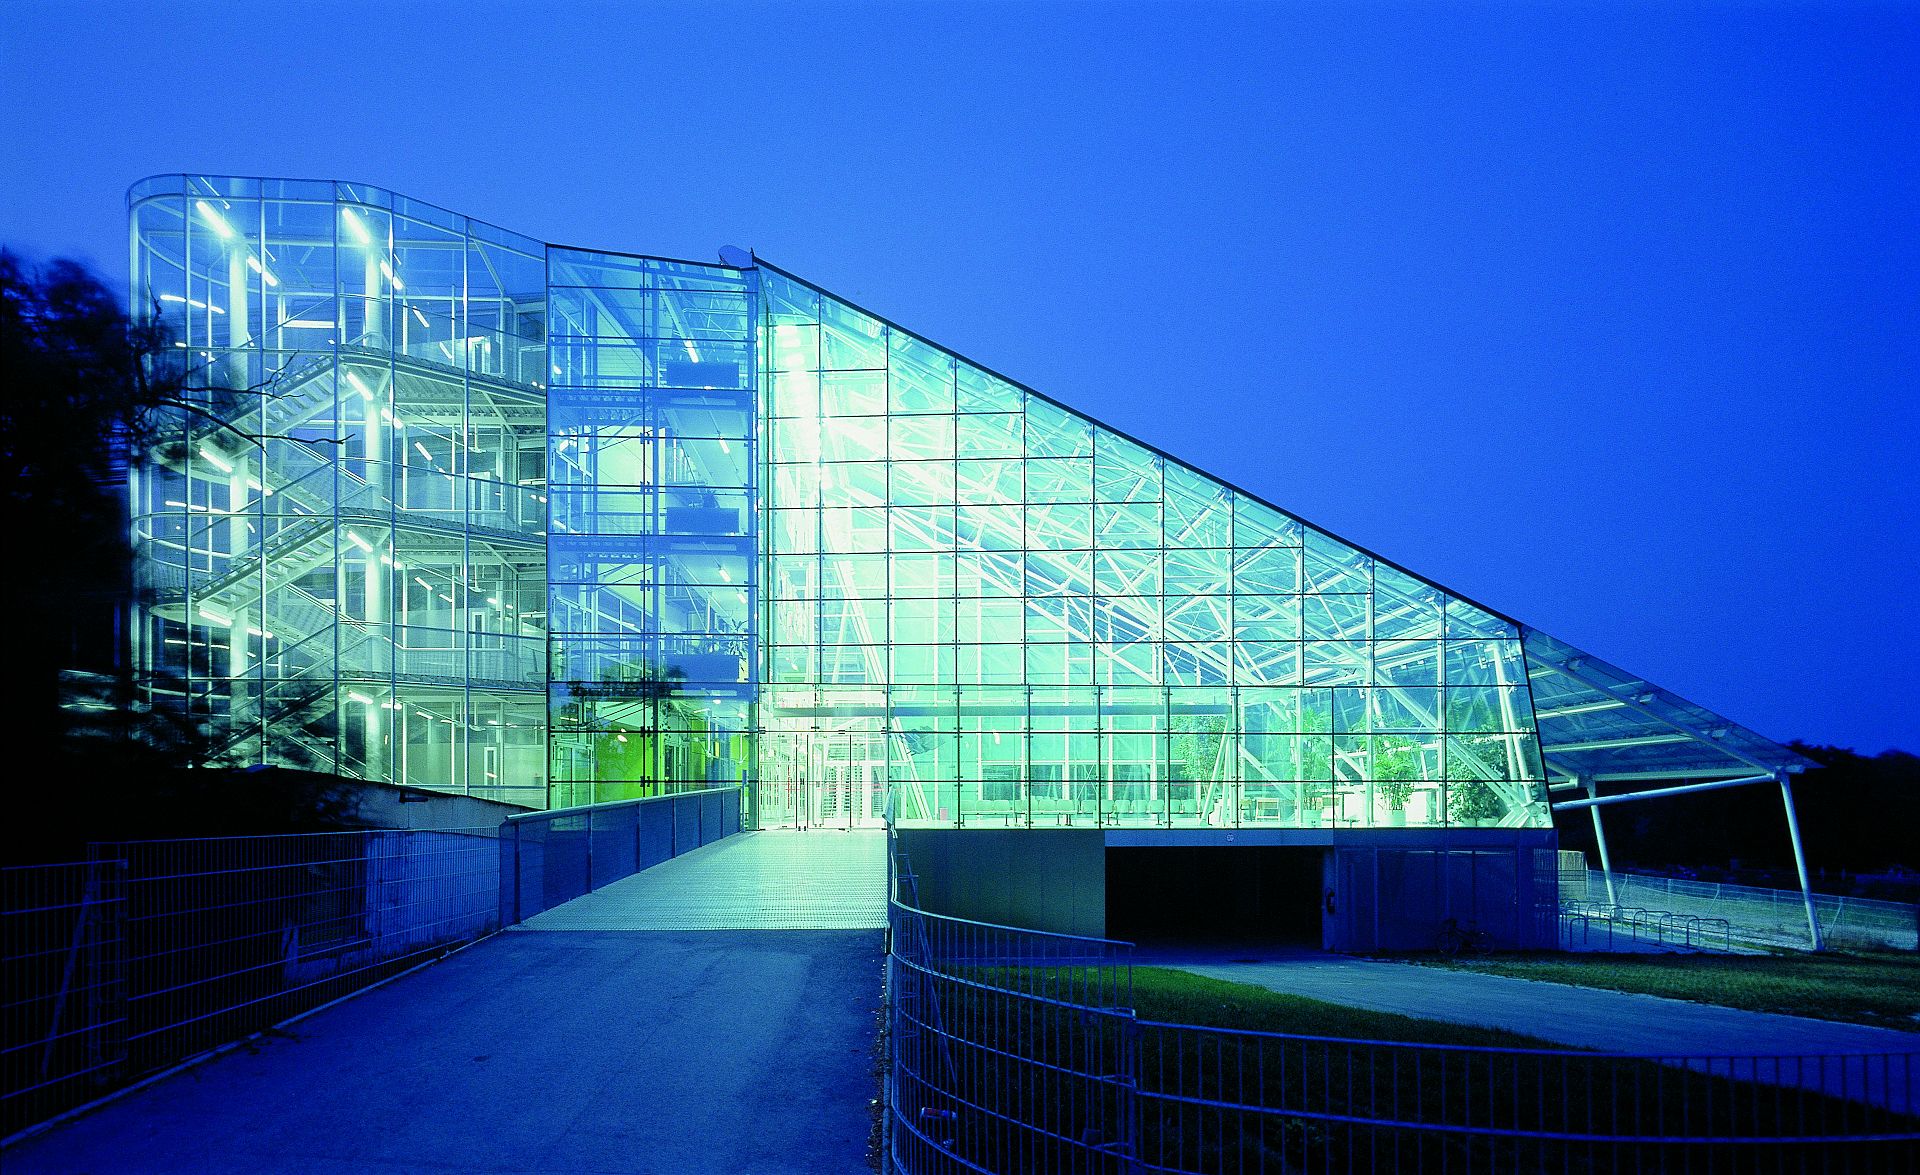
The former School at Kinkplatz at Night
Helmut Richter's school at Kinkplatz serves as a demonstration project for the GreenTech-Renovation exploratory project, as this building is a prime example of how topics can be dealt with in terms of sensible energy renovation.
Copyright: Mischa Erben
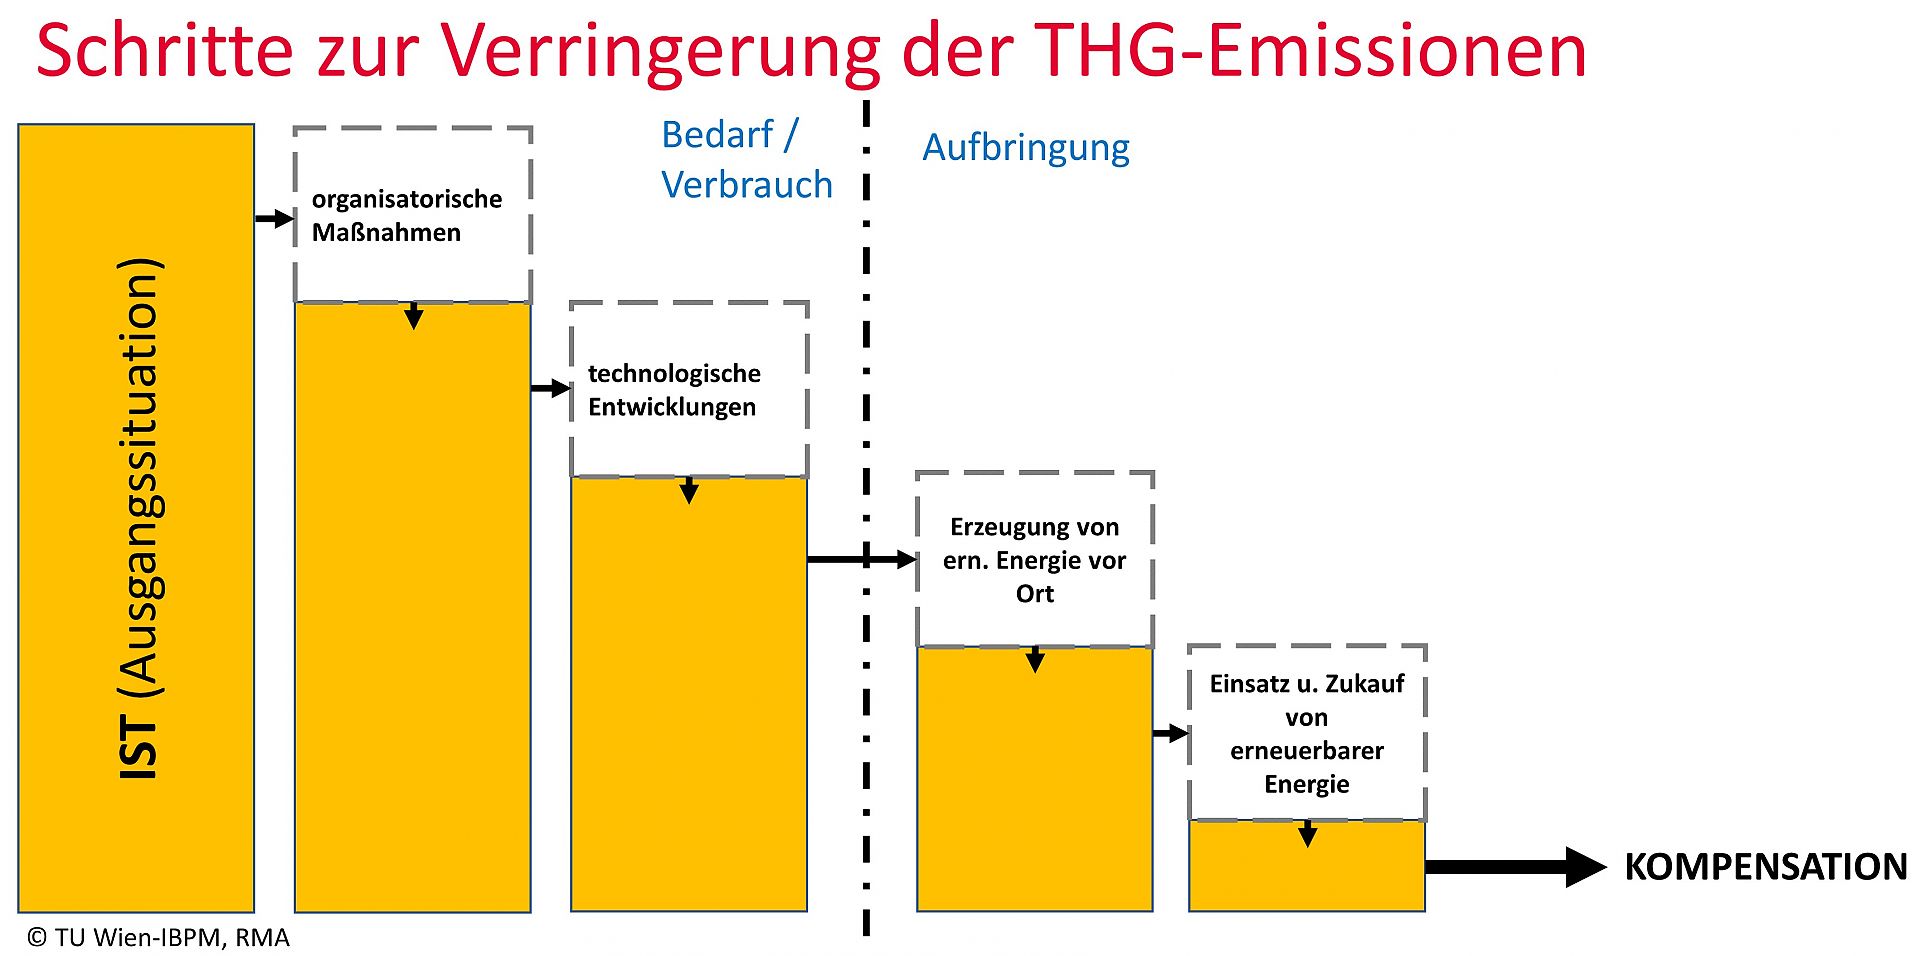
Steps to reduce GHG emissions on construction sites
A number of steps are needed to achieve substantial GHG emission reductions on construction sites. The term "reduction" is used when GHG emissions are reduced by avoiding (energy) demand and consumption on the one hand and by shifting (energy) input from non-renewable energy to renewable energy on the other. The steps to reduce GHG emissions on construction sites are defined in a step-by-step plan. Energy consumption is reduced in the first steps through organisational measures and technological developments. The shift in energy generation can be achieved by generating renewable energy directly on the construction site or by purchasing it. The final step to achieve the goal CO2 neutral construction sites is the CO2-Compenstion. Translated with www.DeepL.com/Translator (free version)
Copyright: TU Wien-IBPM, RMA
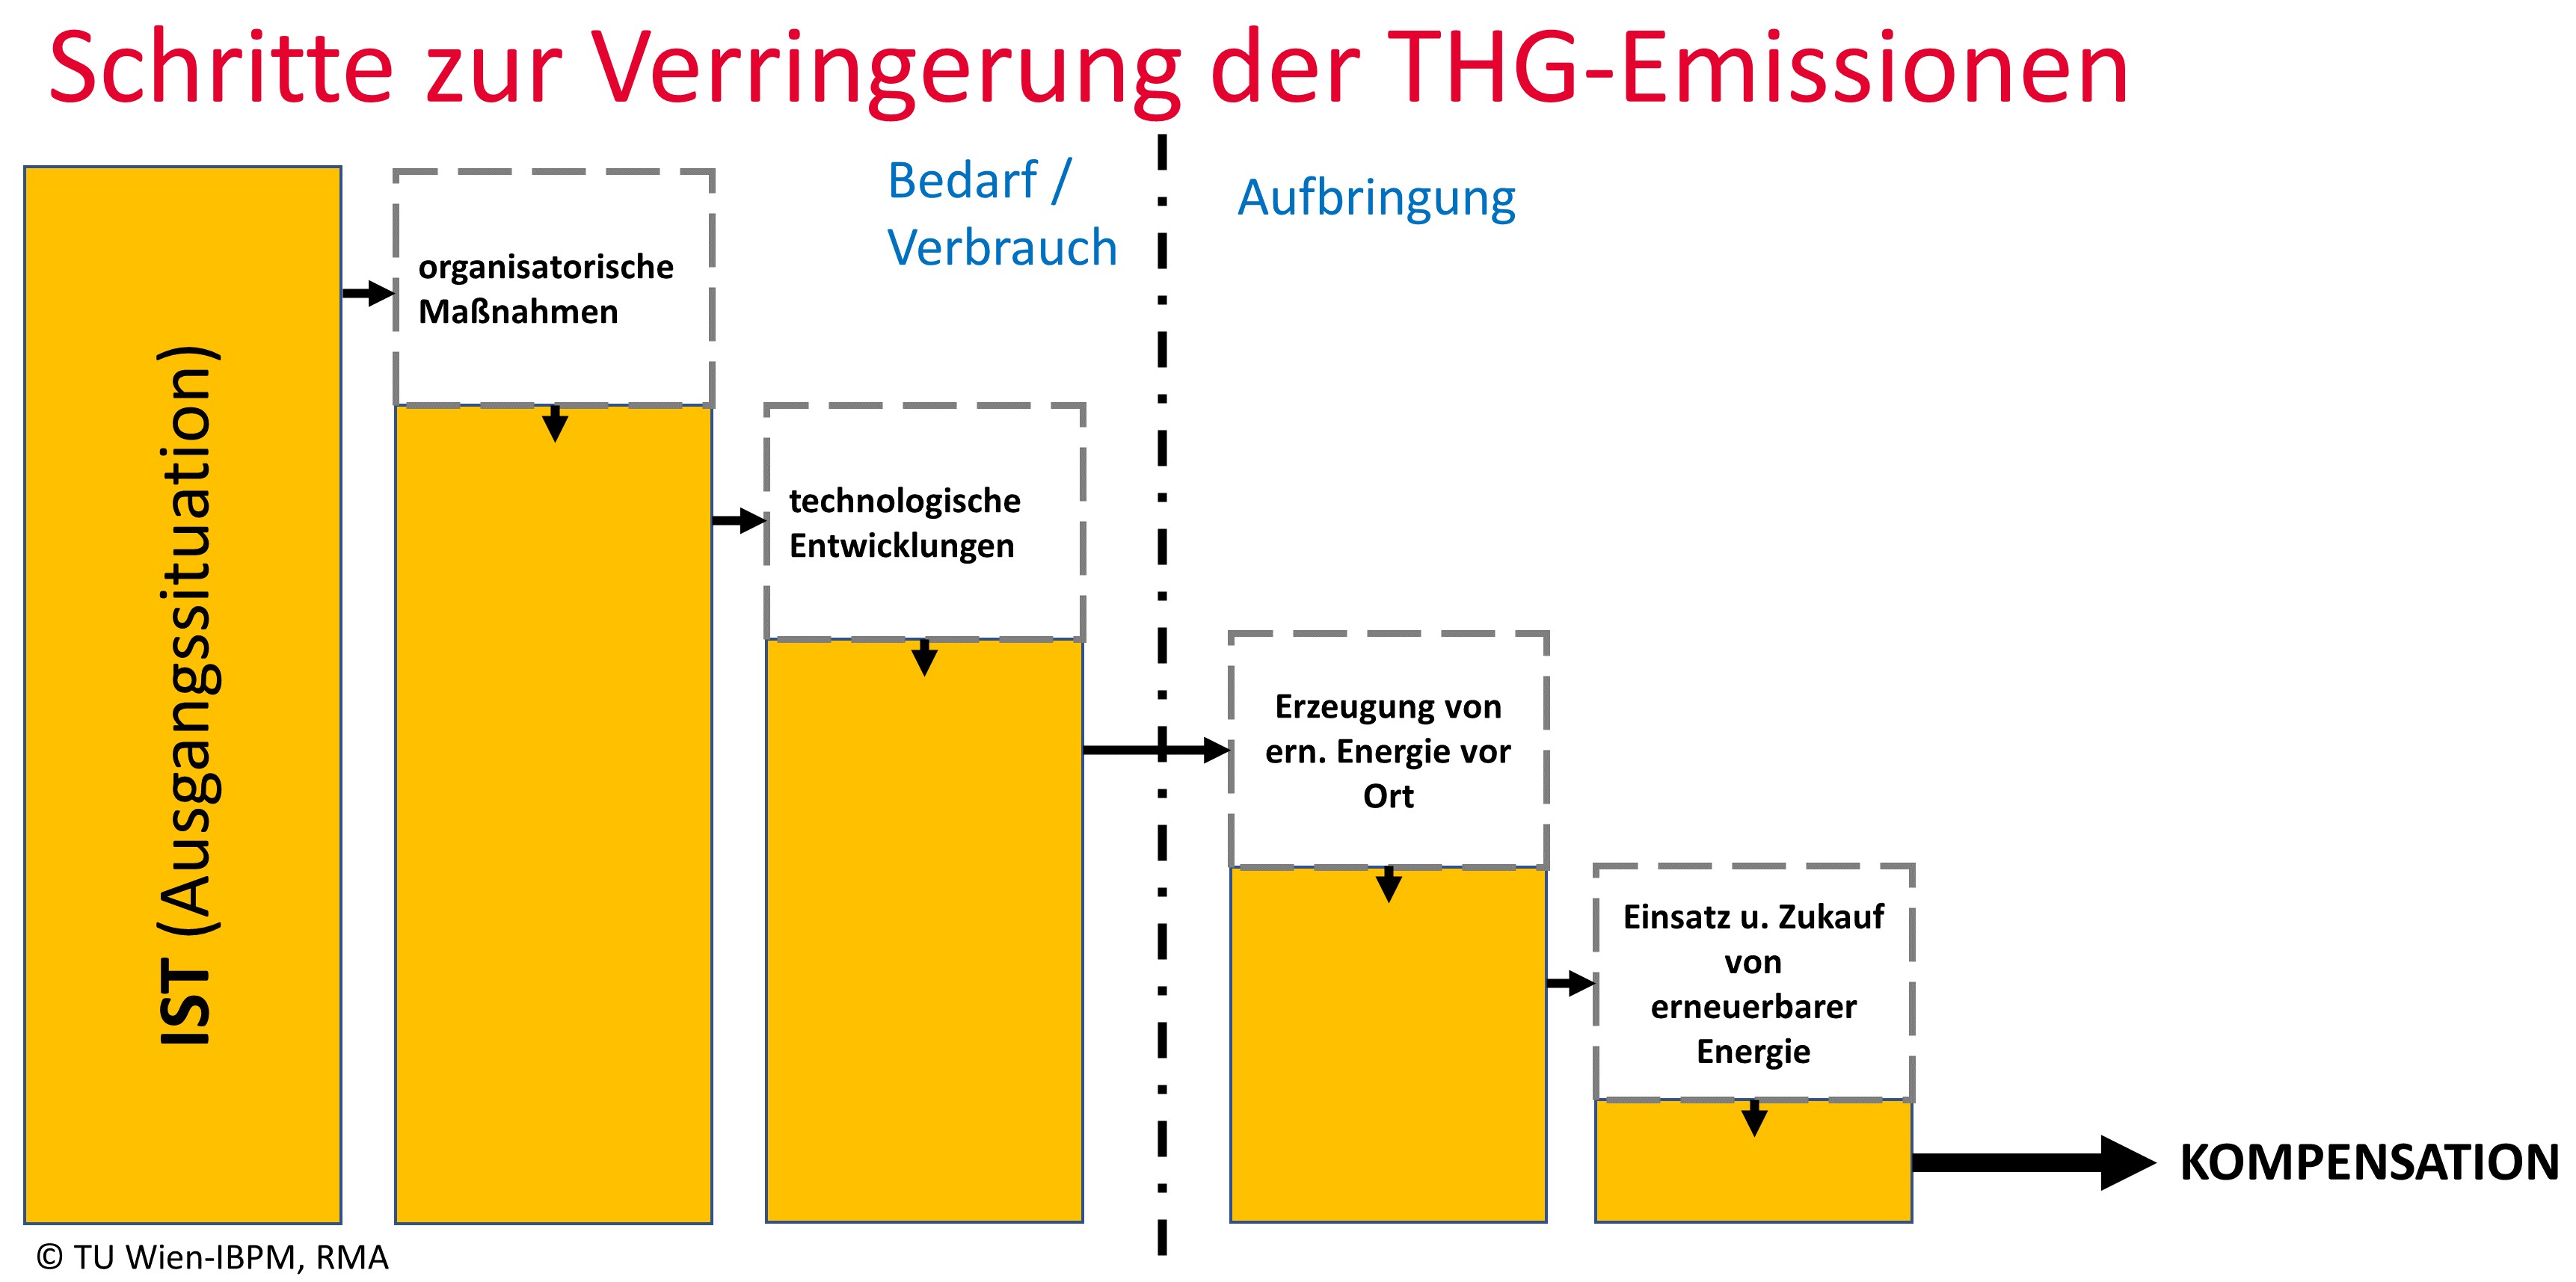
GHG emissions of a Viennese residential building broken down by processes
The GHG emissions of a construction site are illustrated using a fictitious construction site of a Viennese residential building with almost 200 apartments and a gross floor area of 17,000 m². These amount to almost 700,000 kg CO2-eq, of which about 300,000 kg CO2-eq (42 %) are attributable to module A4 "Transportation" and around 400,000 kg CO2-eq (58 %) to module A5 "On-site processes". The allocation of GHG emissions to the individual processes can be seen in the figure. In total, around 77 % of the GHG emissions are transport activities. The calculation values are to be understood as project-specific potentials and have no general validity. Translated with www.DeepL.com/Translator (free version)
Copyright: TU Wien-IBPM, RMA
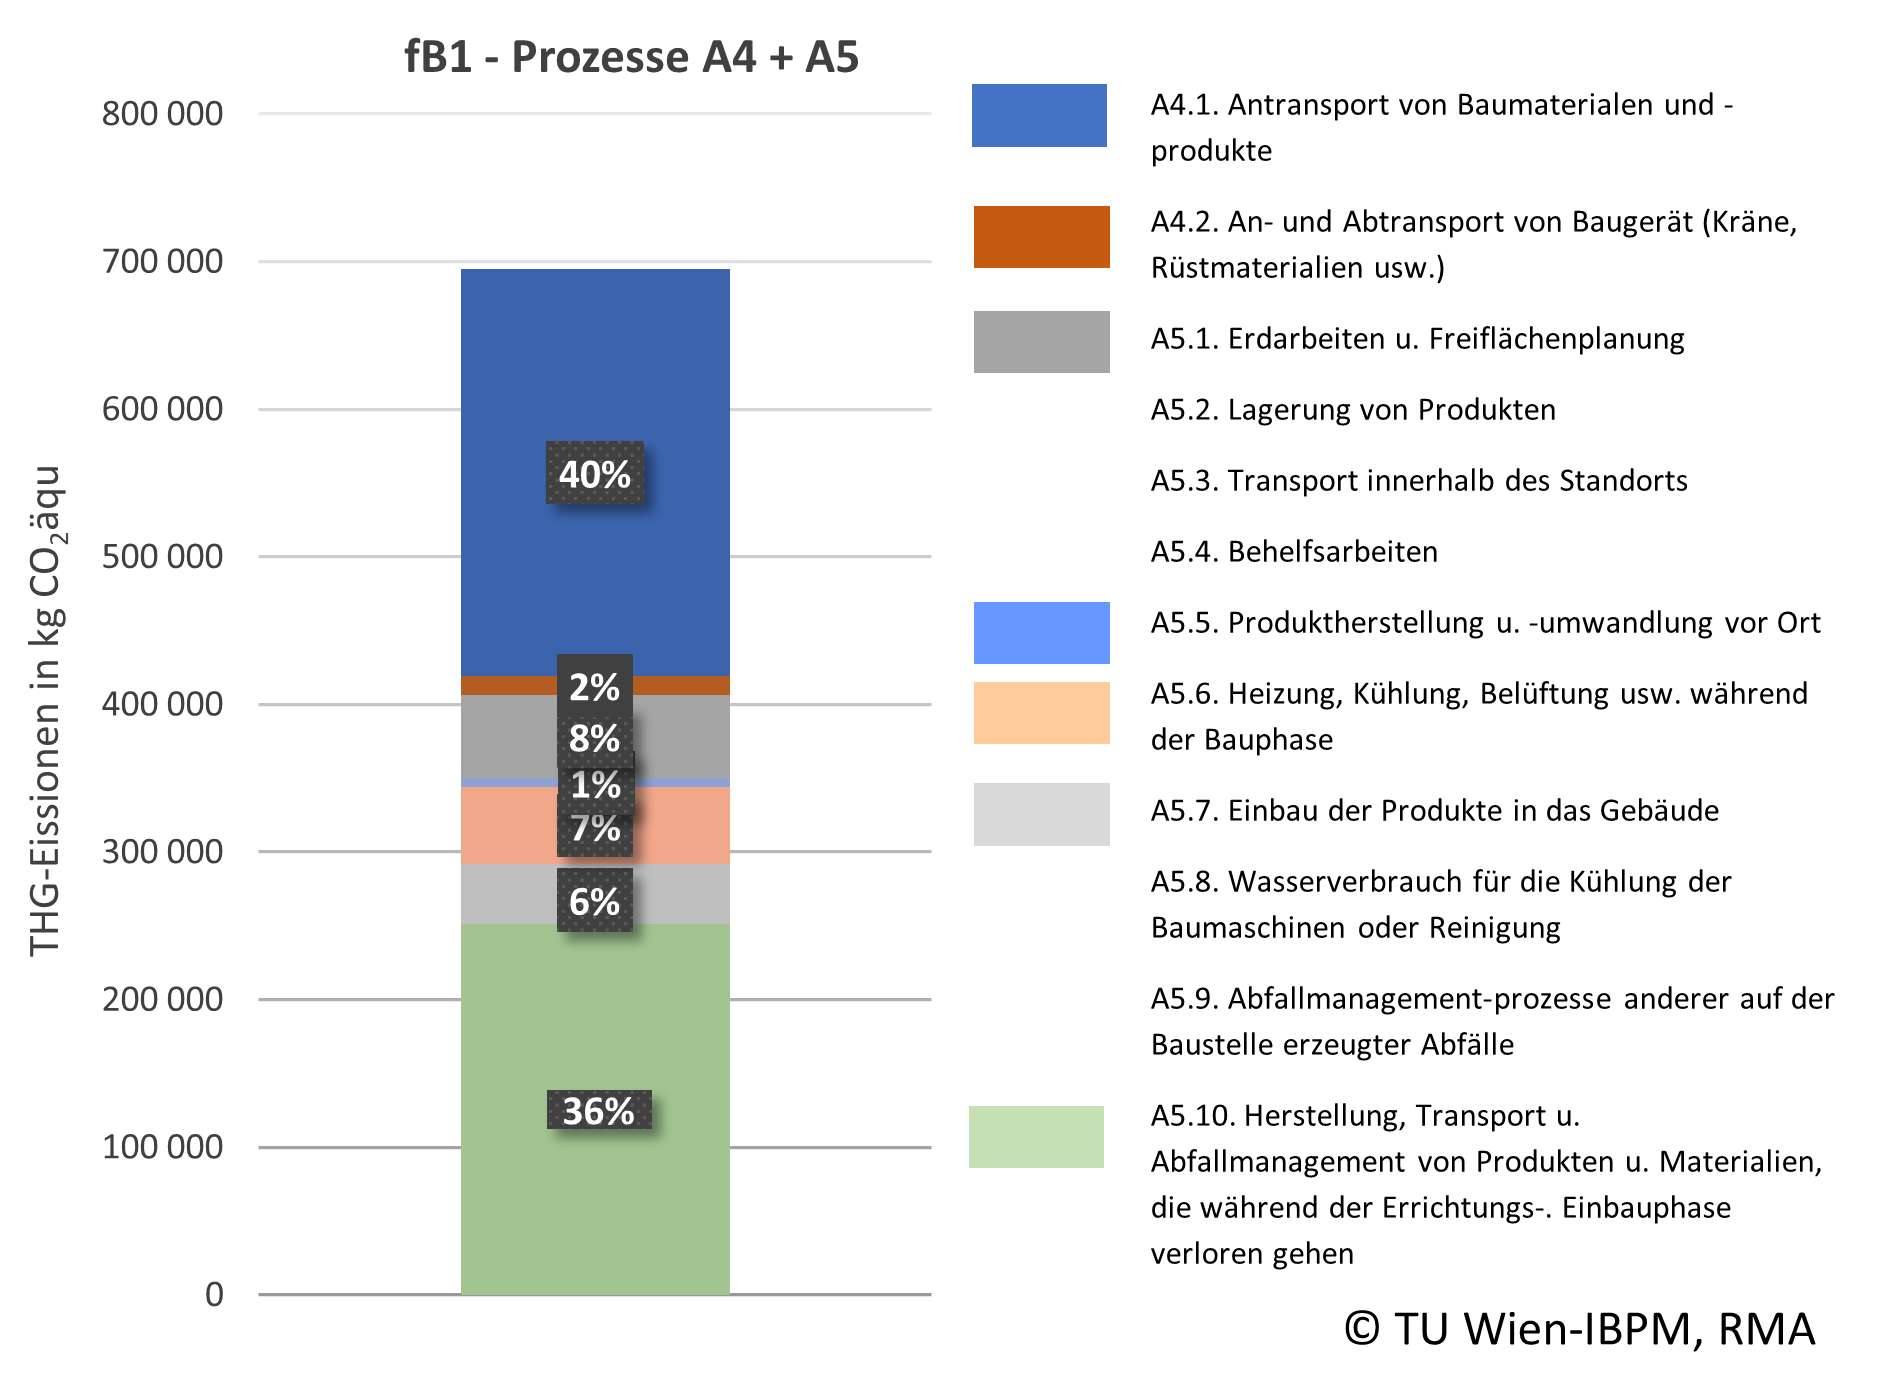
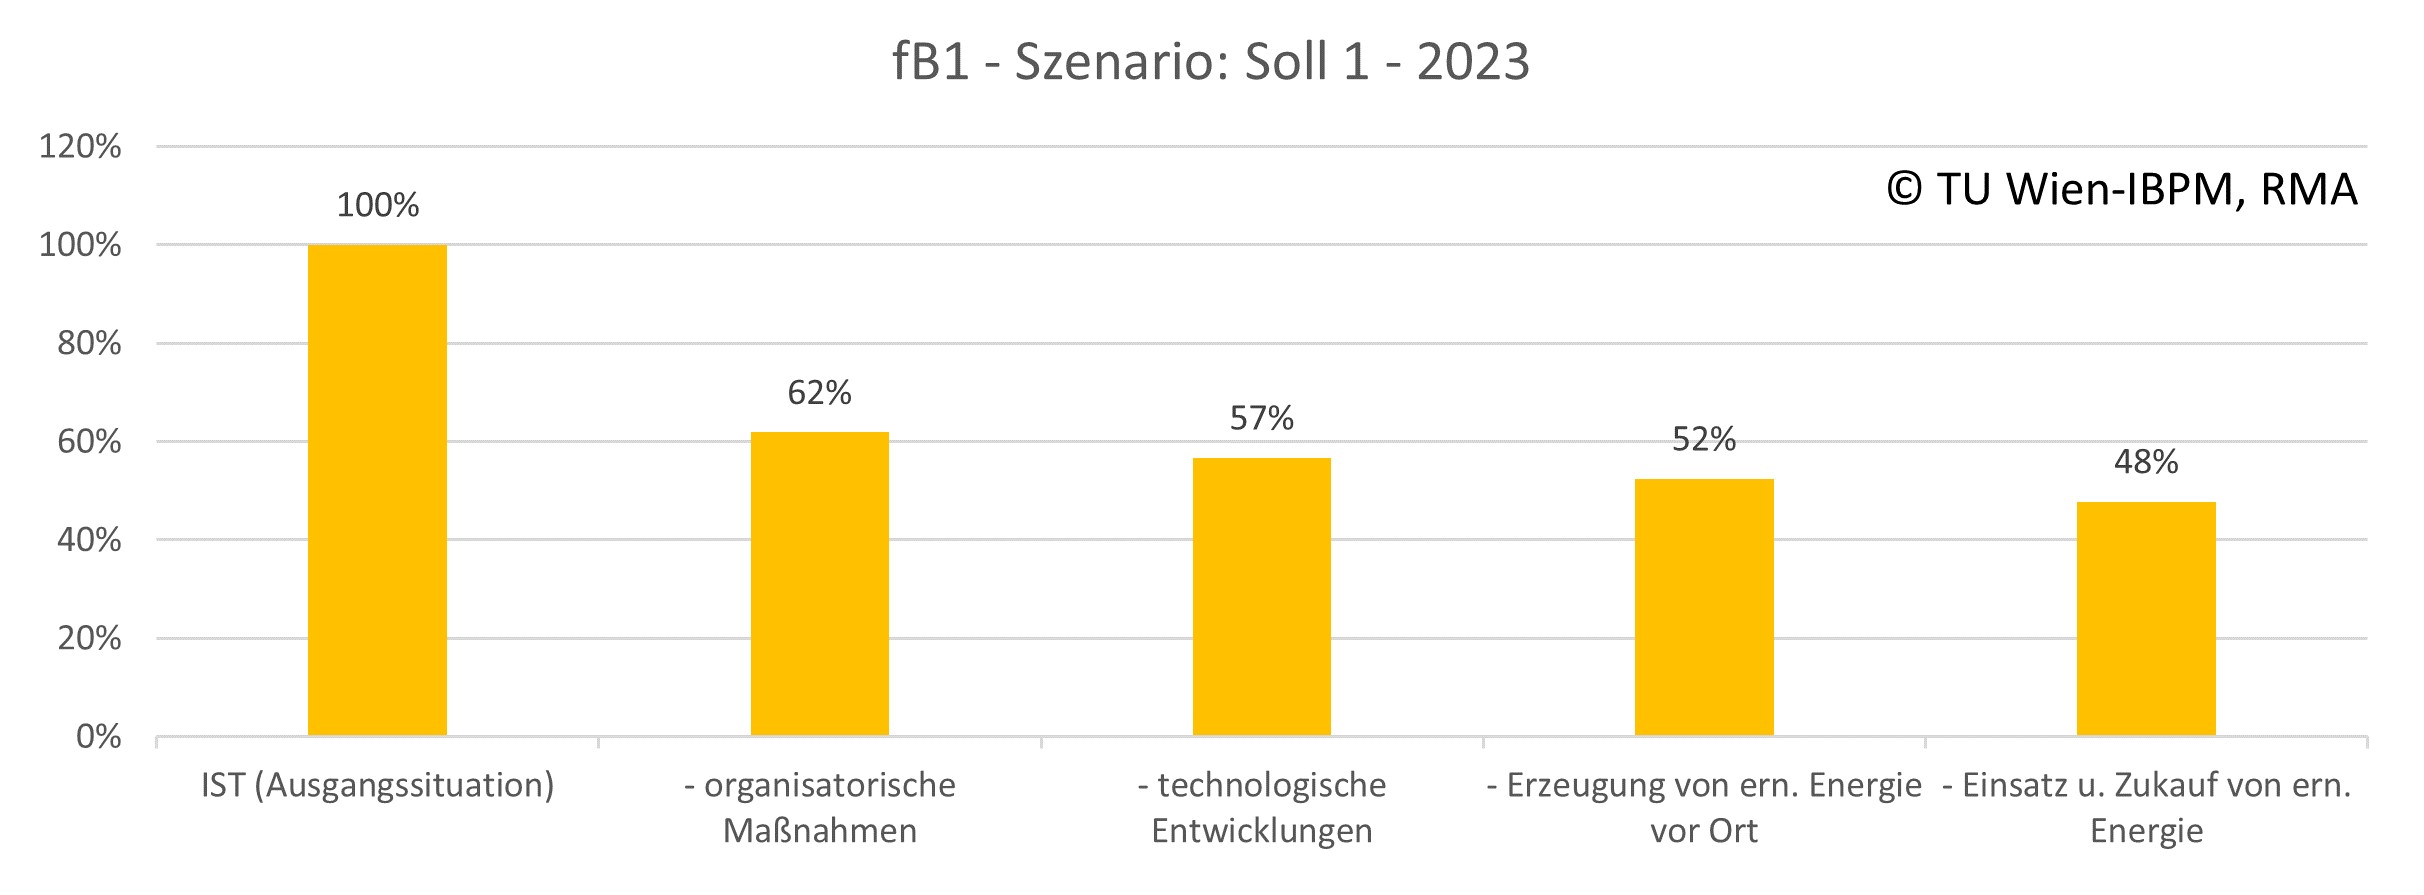
Scenario 2023 for the reduction of GHG emissions for the sample housing construction site in Vienna.
The figure shows the evaluation of a realistic scenario 2023 of the fictitious residential construction site according to the steps to reduce GHG emissions. GHG emissions are reduced by 38 % in the first step "organizational measures". These consist of 36 % points reduction in transport distances and 2 % points savings in processes on the construction site. A further around 5% is saved in the "technological developments" step. GHG emissions are reduced by an additional 5% through "on-site renewable energy (electricity) generation." The remaining electricity demand is covered by UZ46 "Green" electricity. In total, these action steps add up to 48% of the original (ACTUAL) emissions. For these remaining approximately 333 t CO2-eq, at a price of 25 EUR / t CO2-eq, approximately 8,325 EUR would have to be paid in compensation in order to achieve the goal of the "CO2 neutral construction site". The calculation values are to be understood as project-specific potentials and have no general validity. Translated with www.DeepL.com/Translator (free version)
Copyright: TU Wien-IBPM, RMA
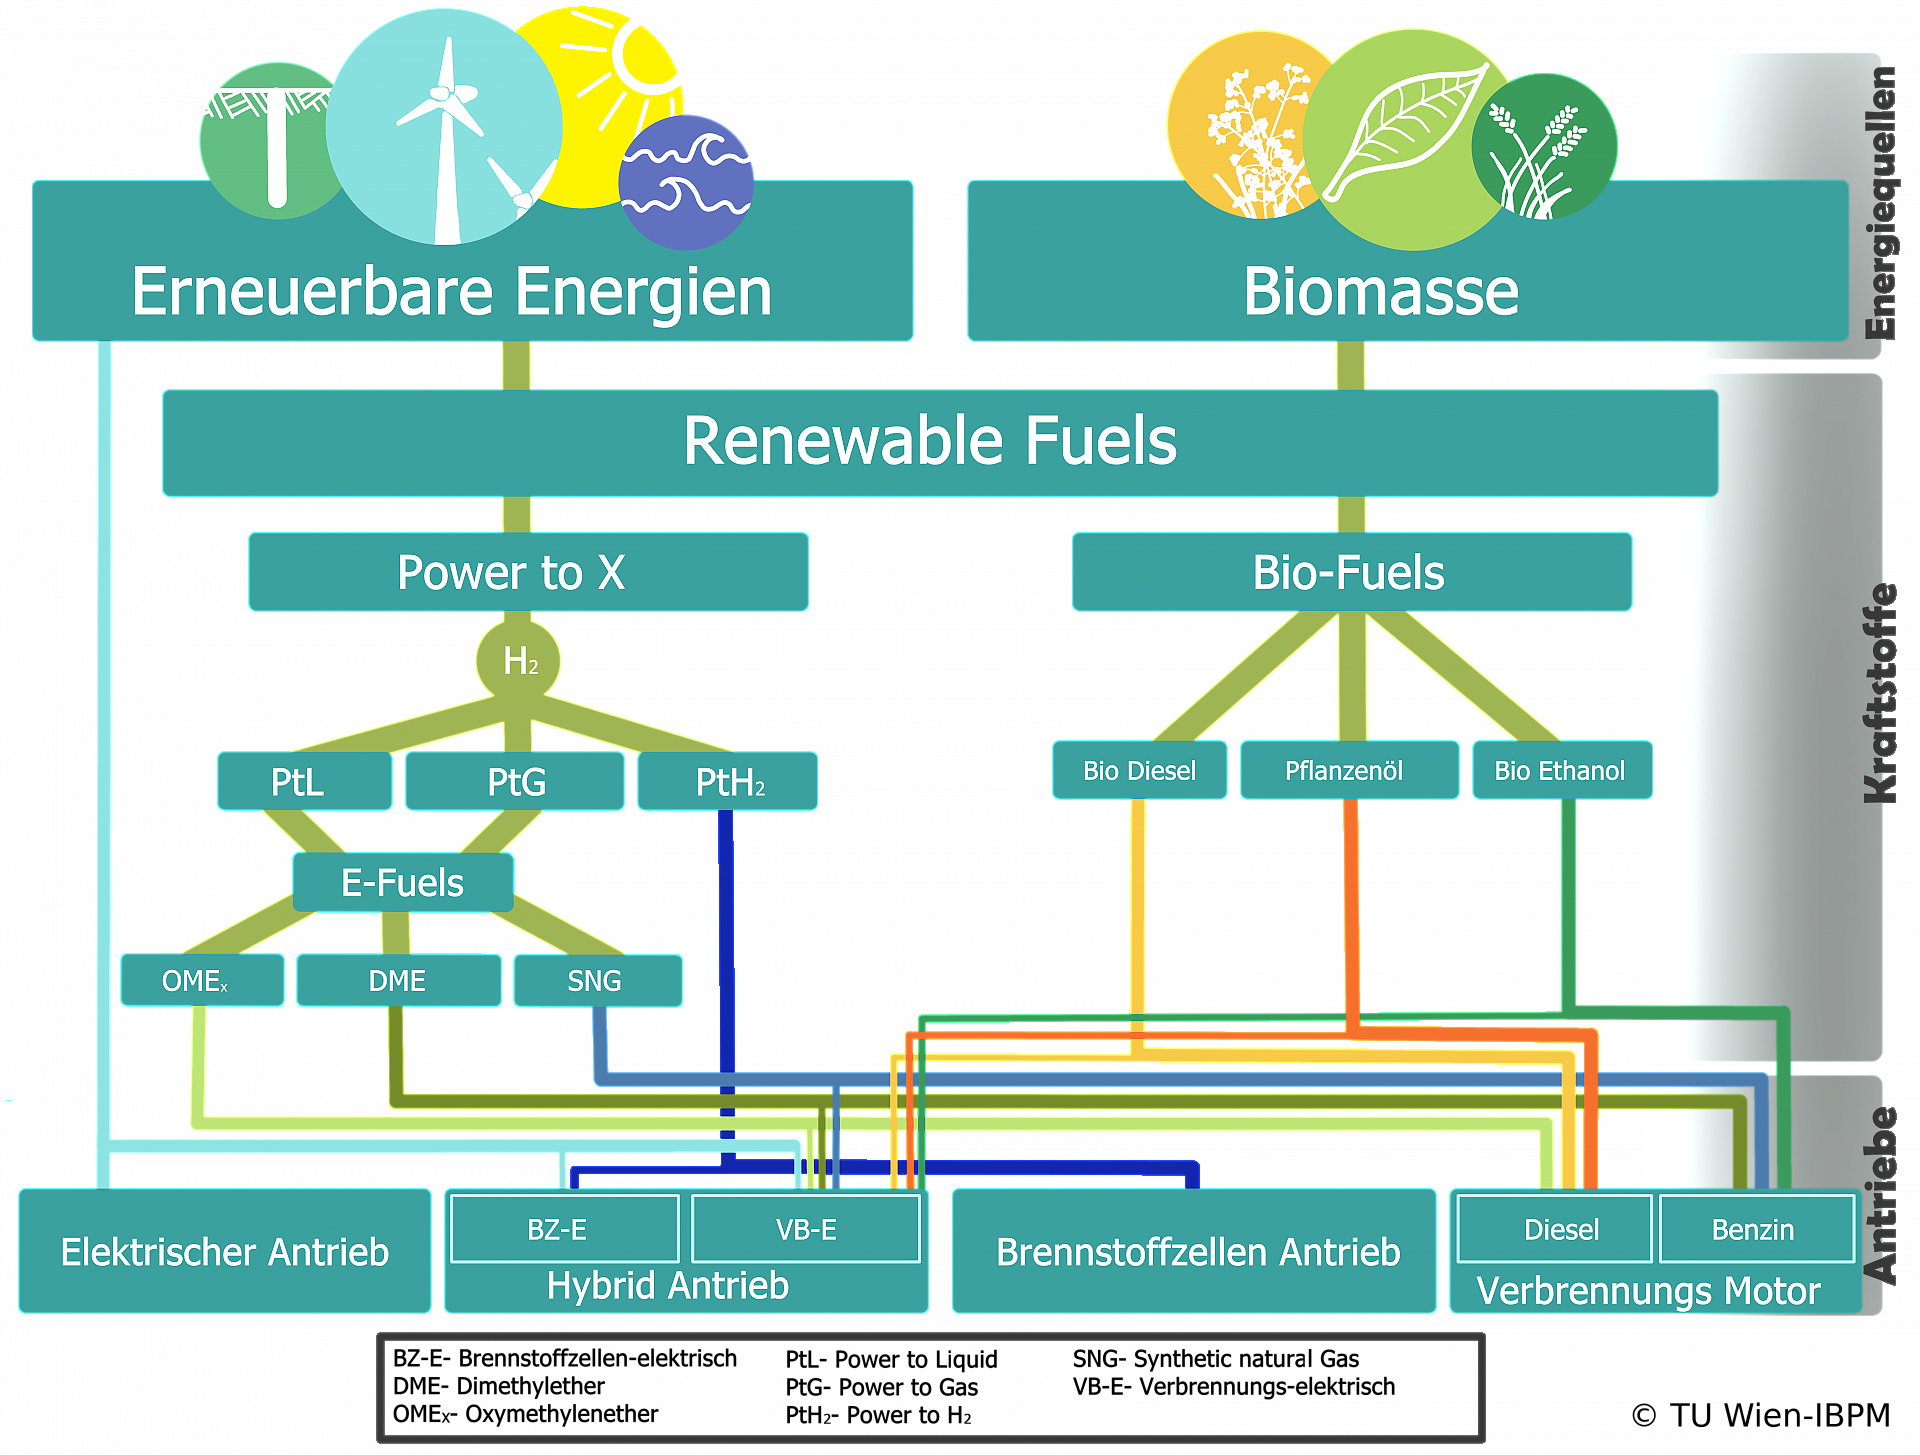
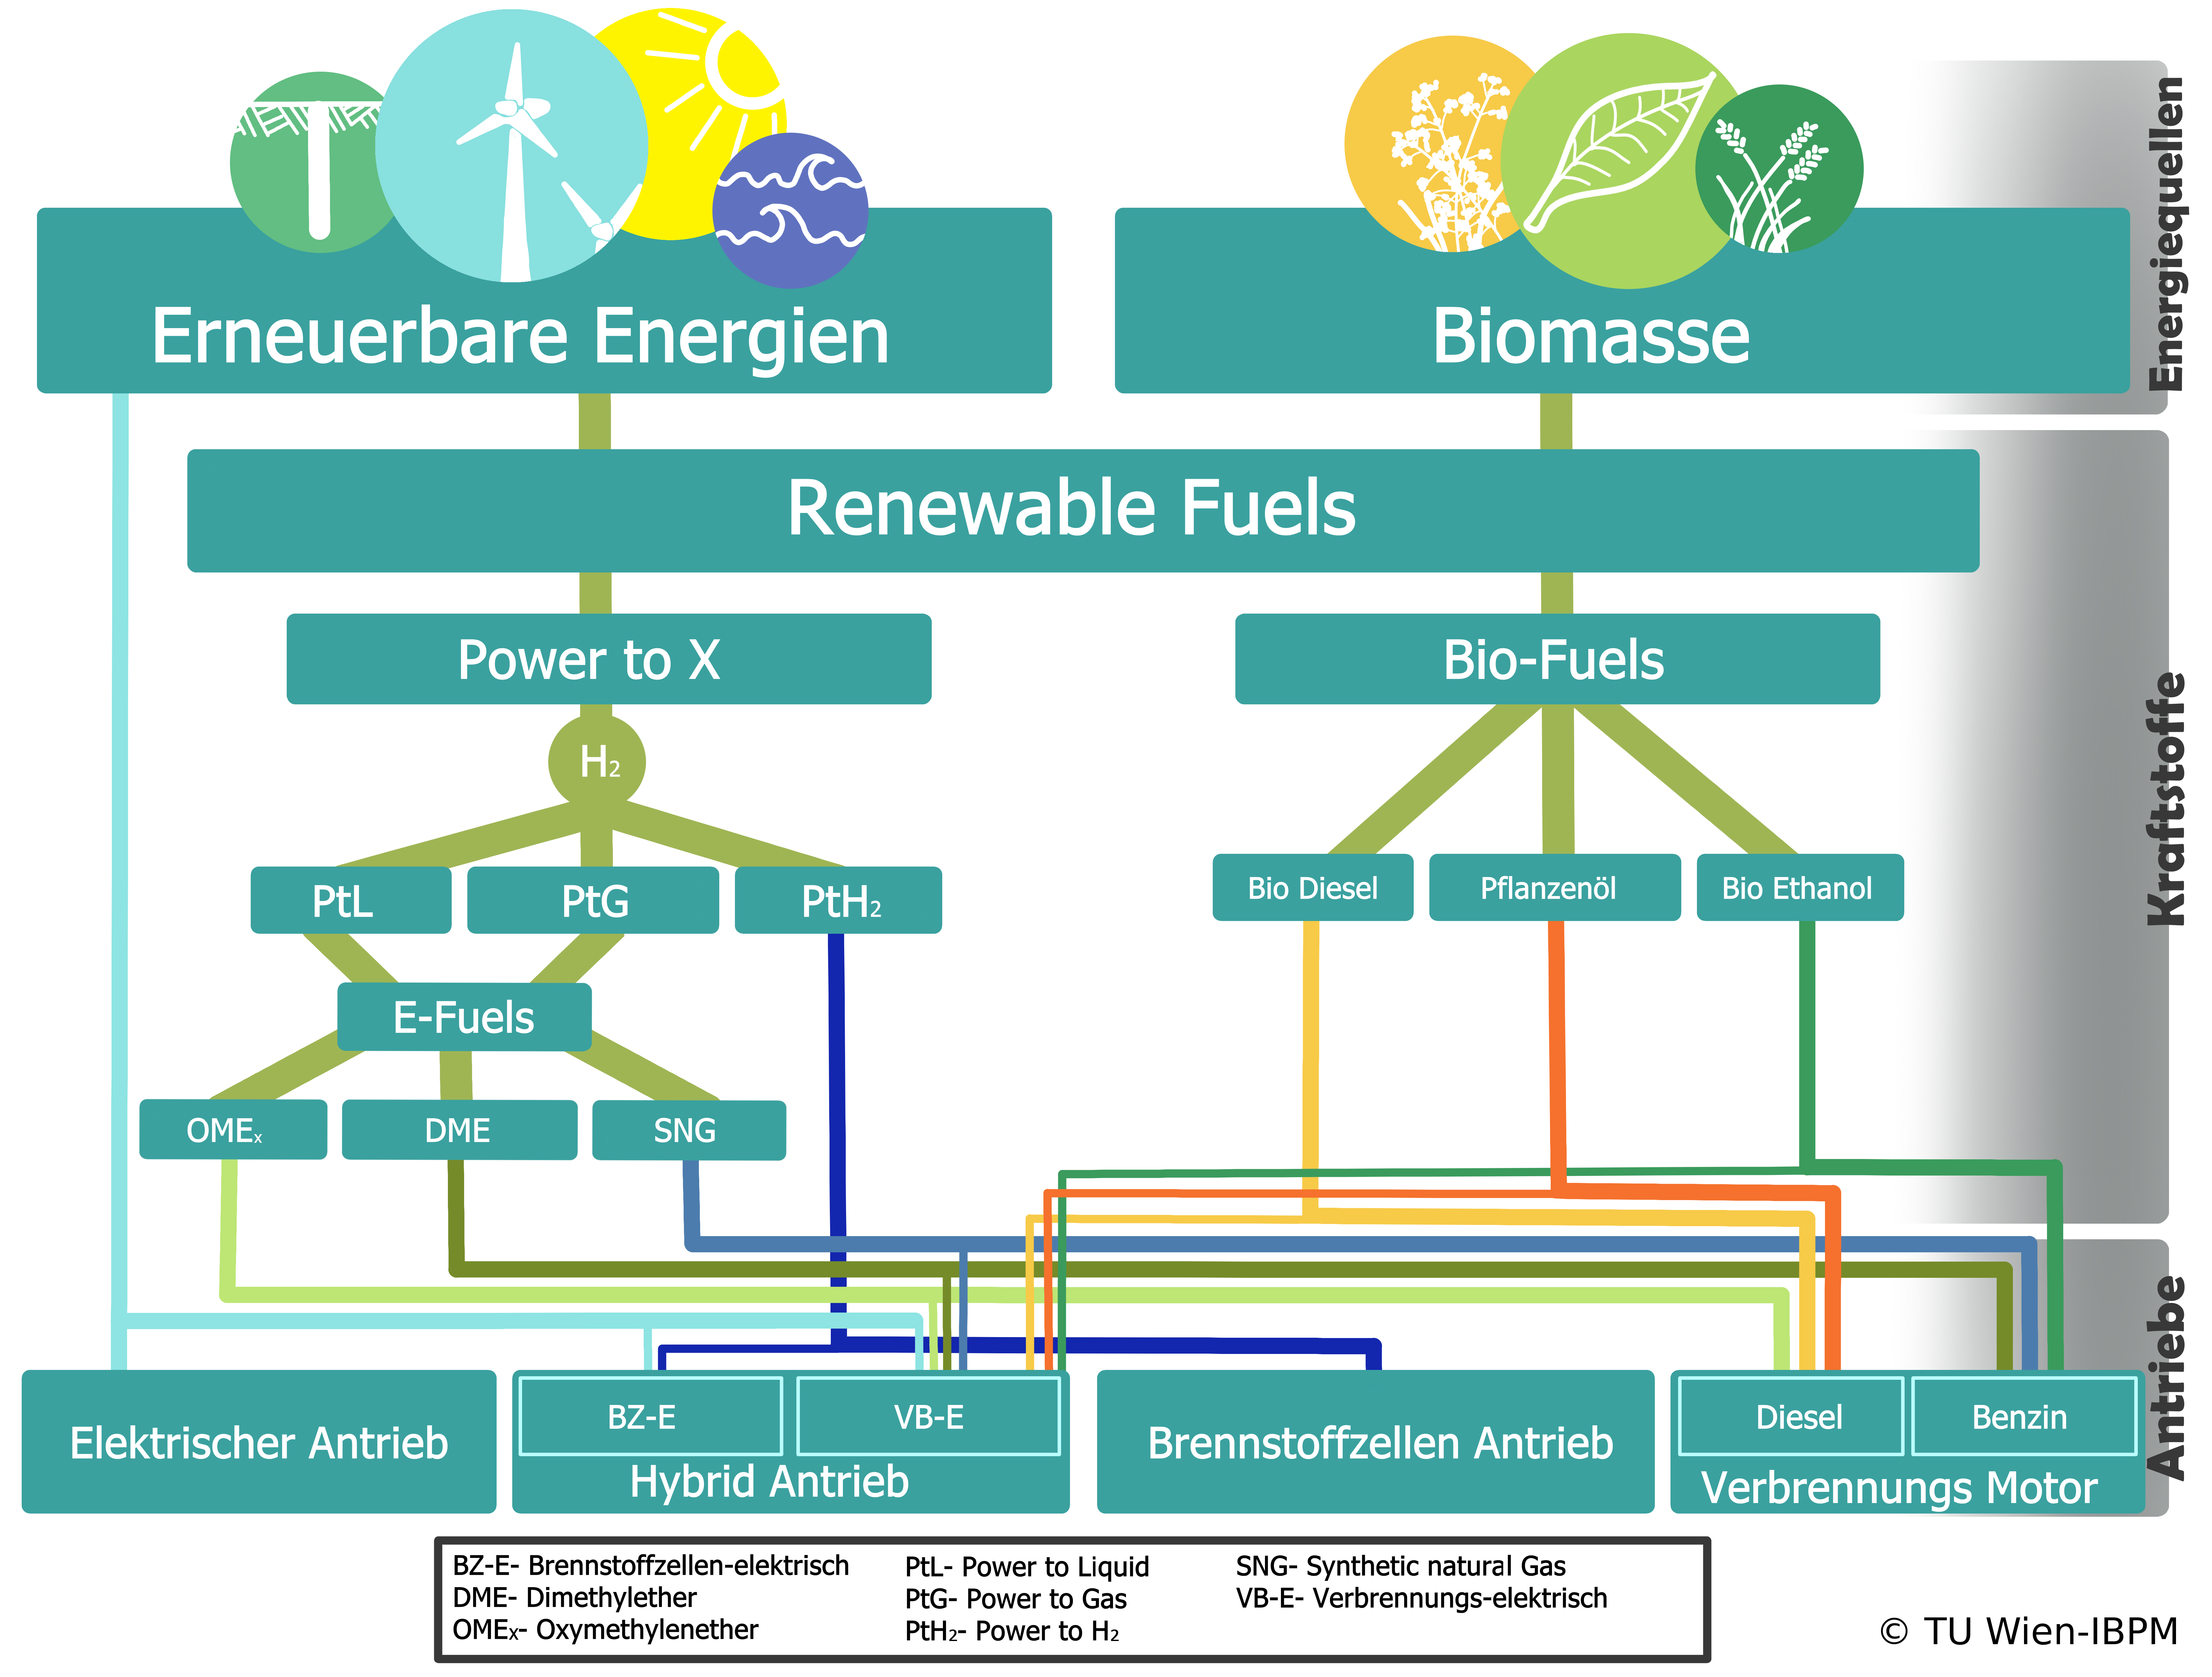
Overview of drive forms for light equipment
Overview of drive forms for light equipment Emissions caused by building machines can be reduced by CO2-neutral drive systems or renewable fuels. The energy source for obtaining or producing renewable fuels can come from (natural) renewable energy sources, for example by generating electricity from wind, solar radiation or hydropower, or can be obtained directly from biomass. These biomass-derived bio-fuels power internal combustion engines. Some of them can be used directly in conventional combustion engines - in this case, diesel engines. Others, for example ethanol, require a dedicated or modified engine. The CO2 savings for bio-fuels range from 80 to 90% in the literature. Sustainably generated electricity can be used to power vehicles or machines with electric drives, either directly via cables or with rechargeable batteries. The other renewable fuel option is hydrocarbons or hydrogen (H2) produced with electrical energy. These processes are grouped under "Power to X". Translated with www.DeepL.com/Translator (free version)
Copyright: TU Wien-IBPM, RMA
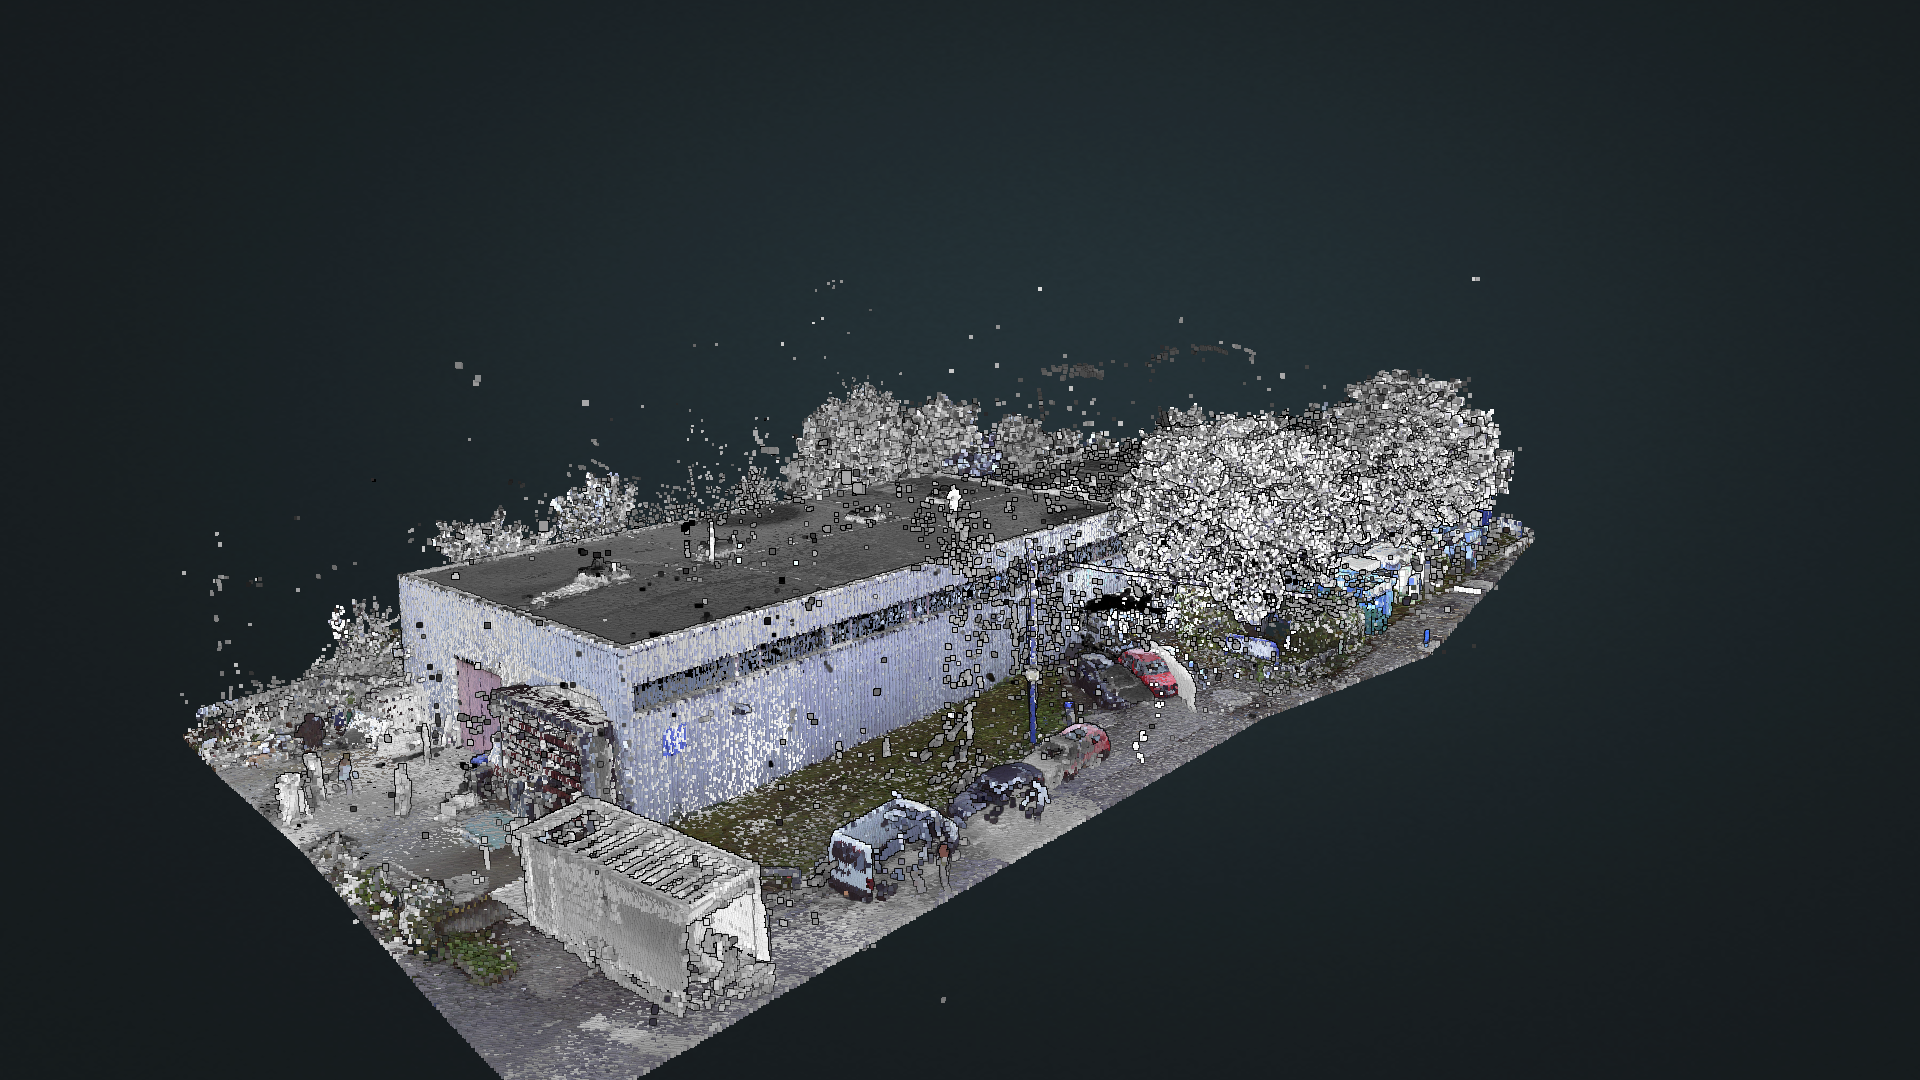
Point Cloud of the Use Case
The project figure 1 shows the point cloud of the use case at Aspanggründe, which was generated through laserscanning.
Copyright: Vermessung Meixner
WebGL visualisation of collected building data via the Gamification App
Data, collected by our mobile game (gamification), can be interactively mapped to 3D BIM model and visualized.
Copyright: Dr. Peter Kan, TU Wien, Institut für Architekturwissenschaften, Digitale Architektur und Raumplanung

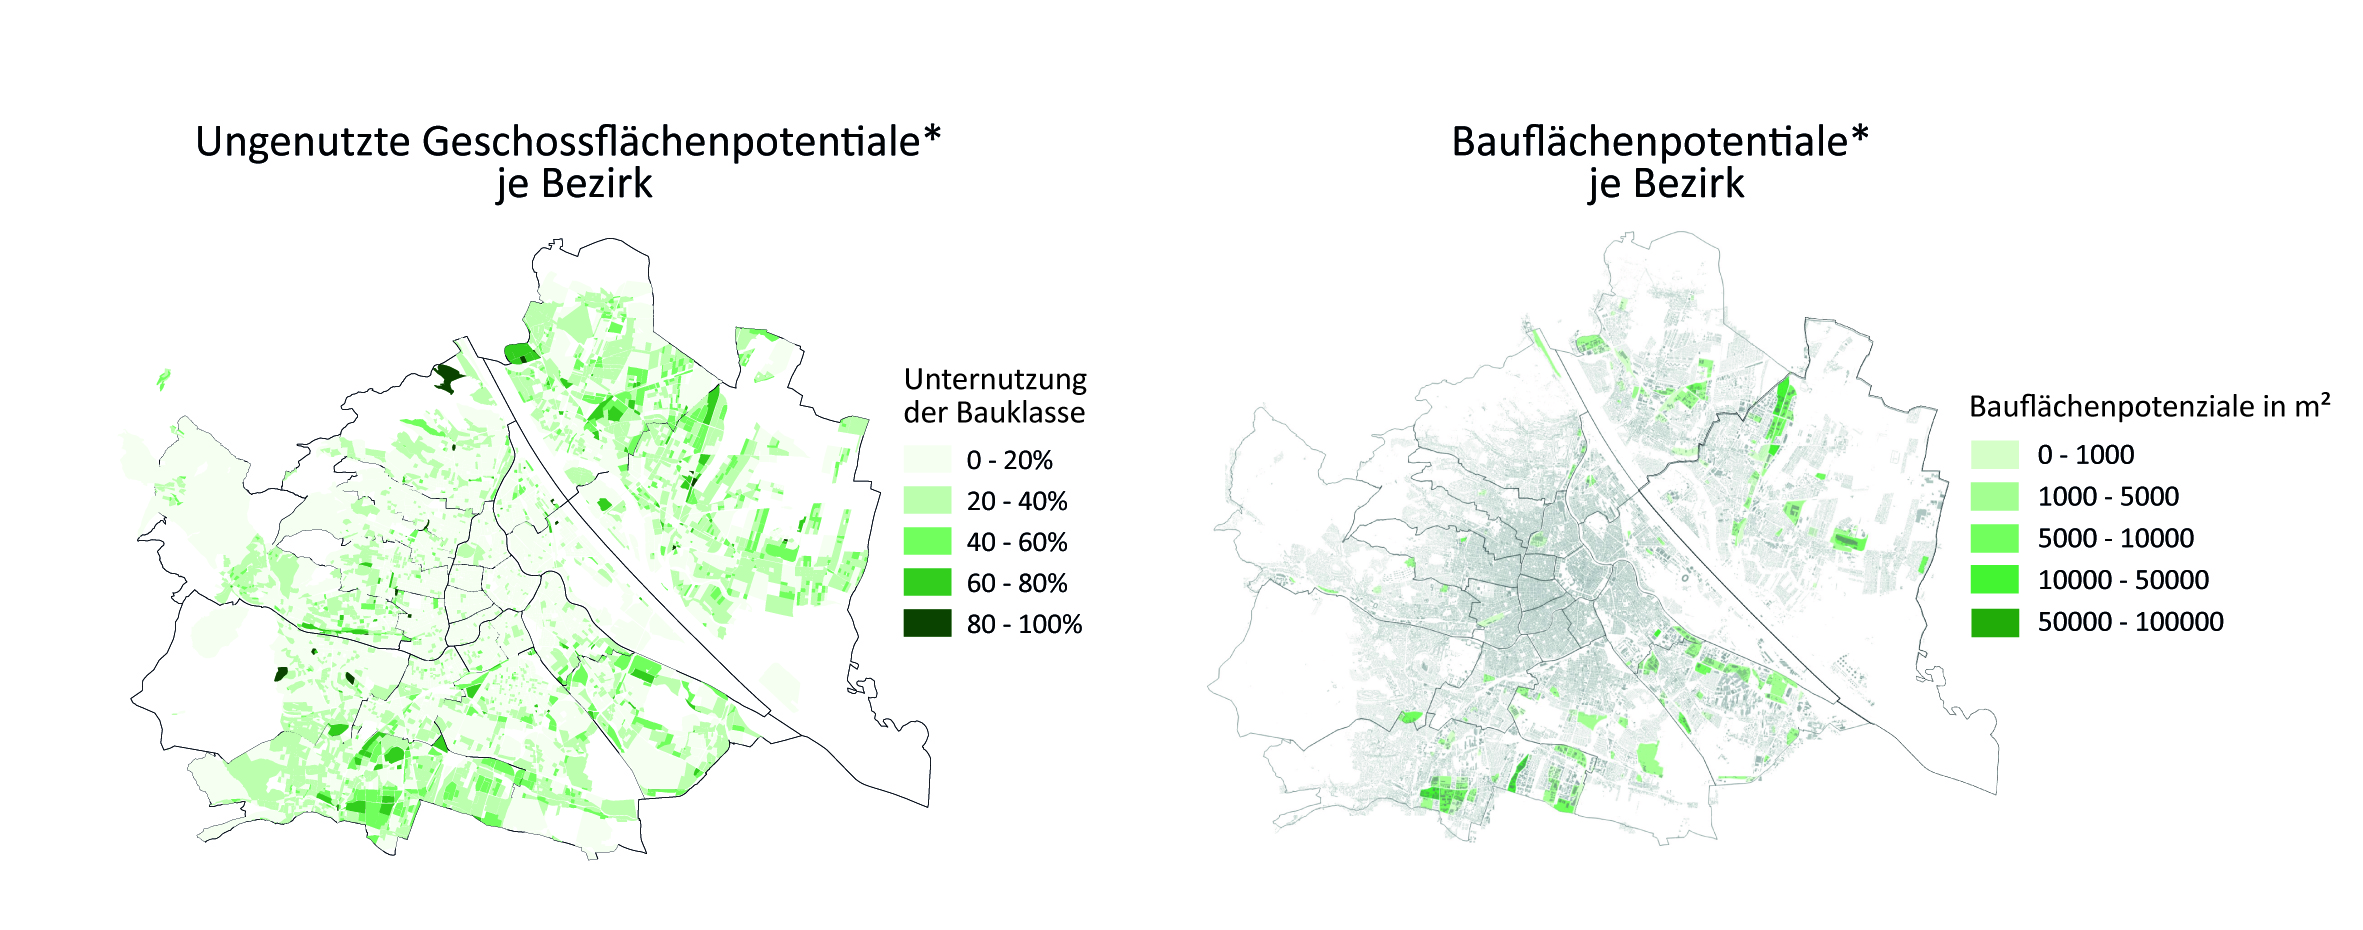
Floor and building area potentials (>550 m² floor area) per building block in Vienna.
This figure shows 2 choropleth maps of Vienna a) the "unused floor area potentials" in Vienna and b) building area potentials (in square meters), - unbuilt building land, each per building block. In both categories, the potentials are mainly found in the districts north of the Danube, but also in the south of Vienna and in Simmering, whereas floor area potentials can be found in the entire city area.
Copyright: S. Bindreiter et al. 2021
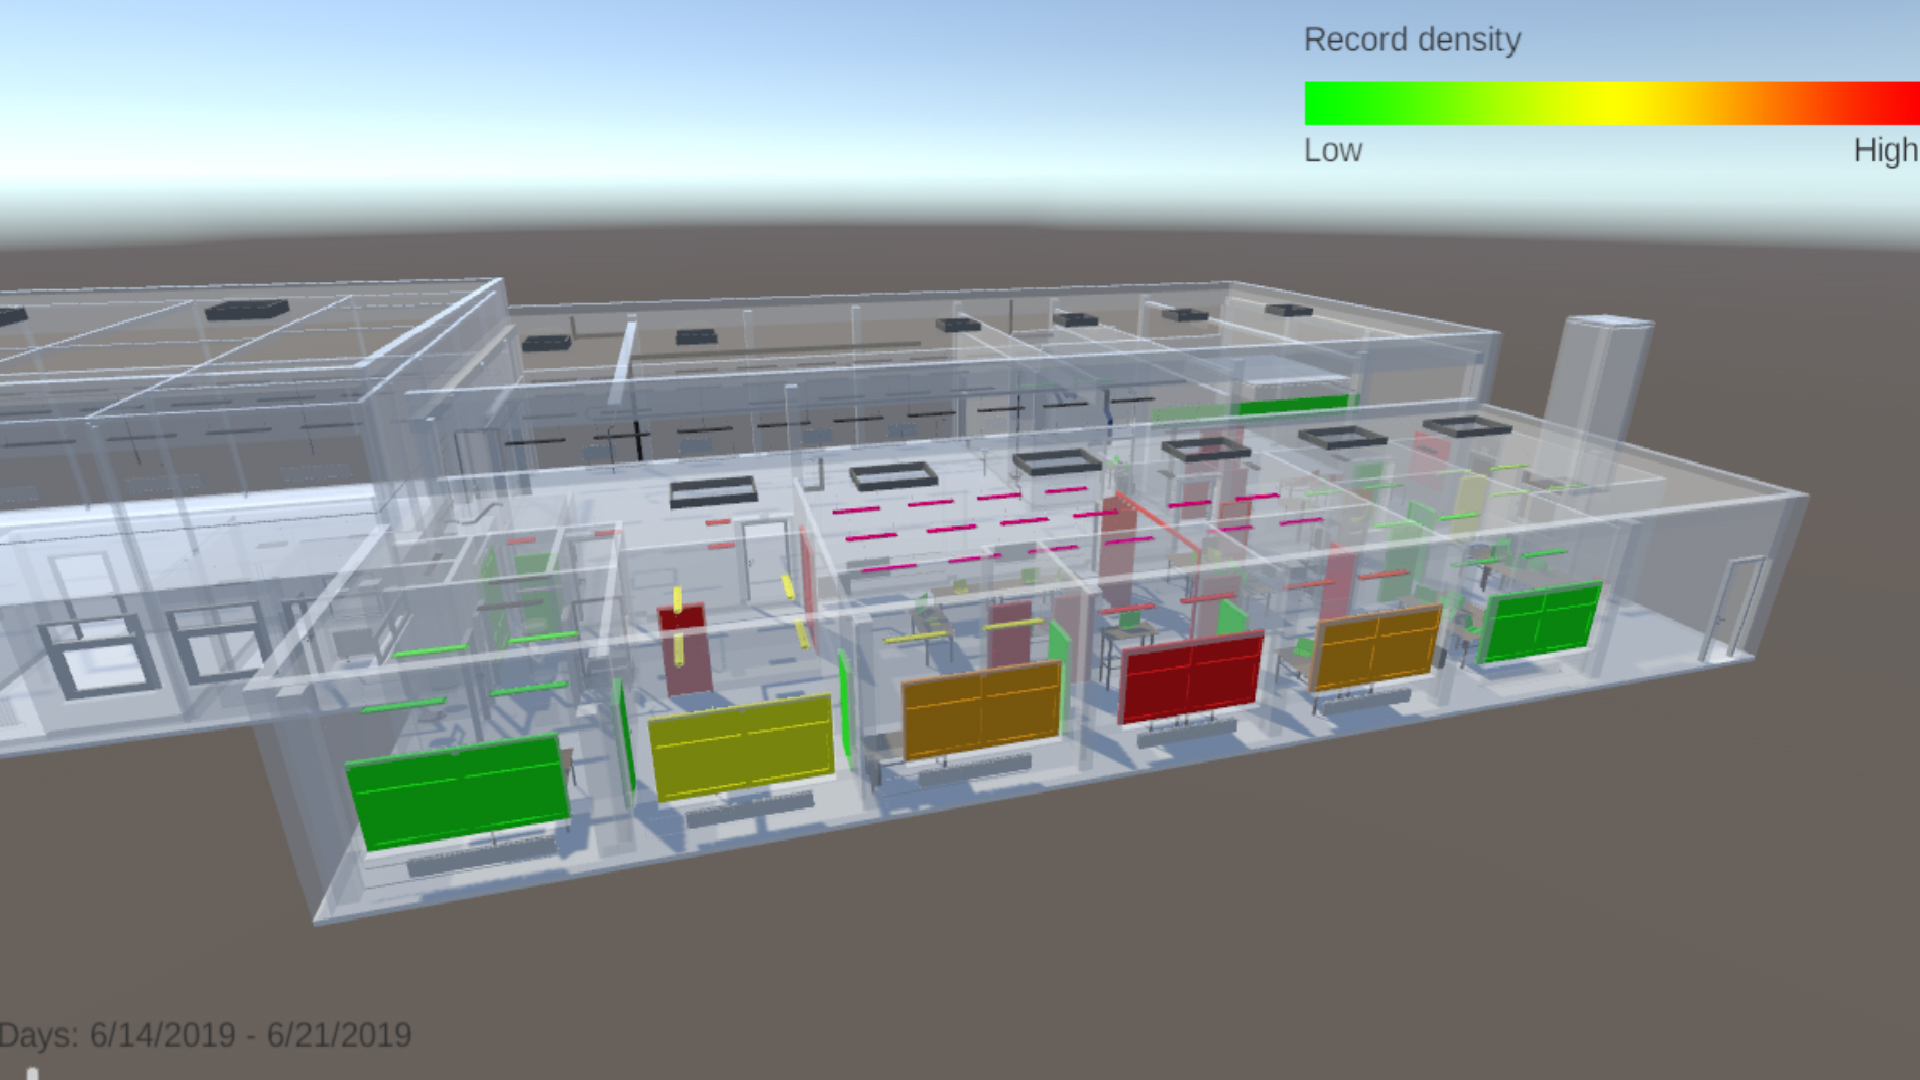
Simulation and visualization prototype
The figure shows a screenshot of the visualization prototype with a three-dimensional map representation of the calculated quantities of building materials per district. Thereby, district base areas are extruded in height depending on the material quantities. Colors indicate the dominating material group (in this representation predominantly concrete incl. screed). The color assignment follows ÖNORM A-6240. Left of the map, the scenario editor is shown, which allows setting of demolition rates for buildings of different construction periods as well as assumptions for the future population growth and the housing demand per inhabitant. Right of the map is a detailed analysis for the 22nd district of Vienna marked on the map. A bar chart shows the material quantities per material group in tons. In the navigation bar on top of the map, scenarios from the scenario editor can be loaded and saved, and it is also possible to switch between the map view and other diagram views. Below the map is a time slider that can be used to track the calculated values of the scenarios over time between the year 2020 and the year 2050.
Copyright: S. Bindreiter et al. 2021
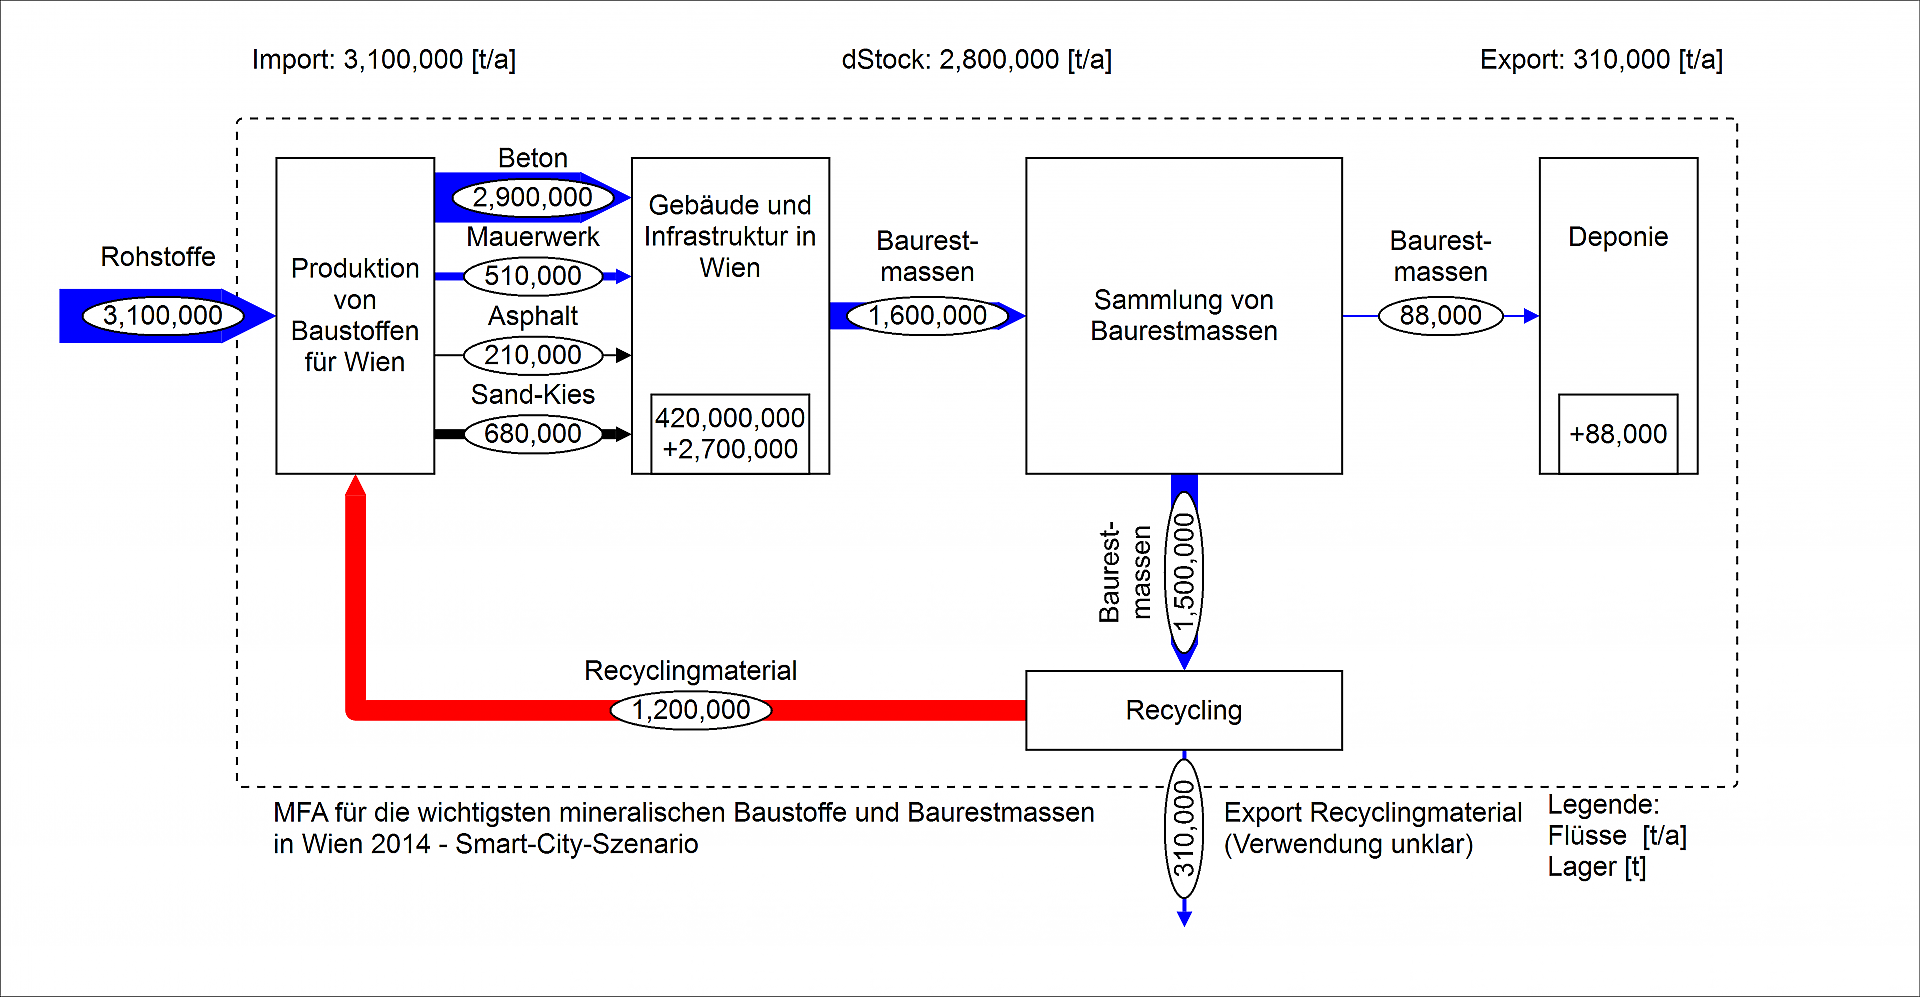
Scenario for future, cycle-oriented management of construction waste in Vienna (reference year 2014, material flows in t/a)
The figure shows a material flow diagram of the main mineral building materials and construction waste in Vienna for the reference year 2014, assuming that the system is optimized with regard to cycle-oriented criteria. The figures refer to one year and are given in tons. The system boundary includes the city of Vienna. A total of 3.1 million tons of building materials are imported into the system per year, 0.31 million tons are exported as recycled material with unknown use. The material stock (buildings and infrastructure in Vienna) increases by 2.8 million tons. The following five processes are mapped within the system boundary: (1) production of construction materials for Vienna, (2) buildings and infrastructure in Vienna, (3) collection of construction waste, (4) landfill, and (5) recycling). In (1), 3.1 million tons of raw materials are imported (as input to the system), and in addition, 1.2 million tons of recycled materials from process (5) Recycling enter the process as an input stream. The following quantities of building materials are exported from process (1) to process (2): 2.9 million tons of concrete, 0.51 million tons of masonry, 0.21 asphalt, and 0.68 million tons of sand-gravel. Process No. (2) Building and Infrastructure in Vienna includes a material stock of 420 million tons of building materials, which increases by 2.7 million tons. Leaving this process is 1.6 million t of construction waste, which is the input to process (3). From process (3) collection of construction waste 0.088 million t. Construction waste masses are exported to process (4) Landfill and deposited there, and the remaining 1.5 million t of construction waste masses enter process (5) Recycling. Since 1.2 million t in this scenario are reused as recycled building materials within the system boundary and substitute primary raw materials, only the remaining 0.310 million t are exported from process (5) Recycling outside the system boundary and thus constitute the export from the system (Vienna Construction Industry - Smart City Scenario).