Project Image Pool
There are 44 results.
Terms of use: The pictures on this site originate from the projects in the frame of the programmes City of Tomorrow, Building of Tomorrow and the IEA Research Cooperation. They may be used credited for non-commercial purposes under the Creative Commons License Attribution-NonCommercial (CC BY-NC).

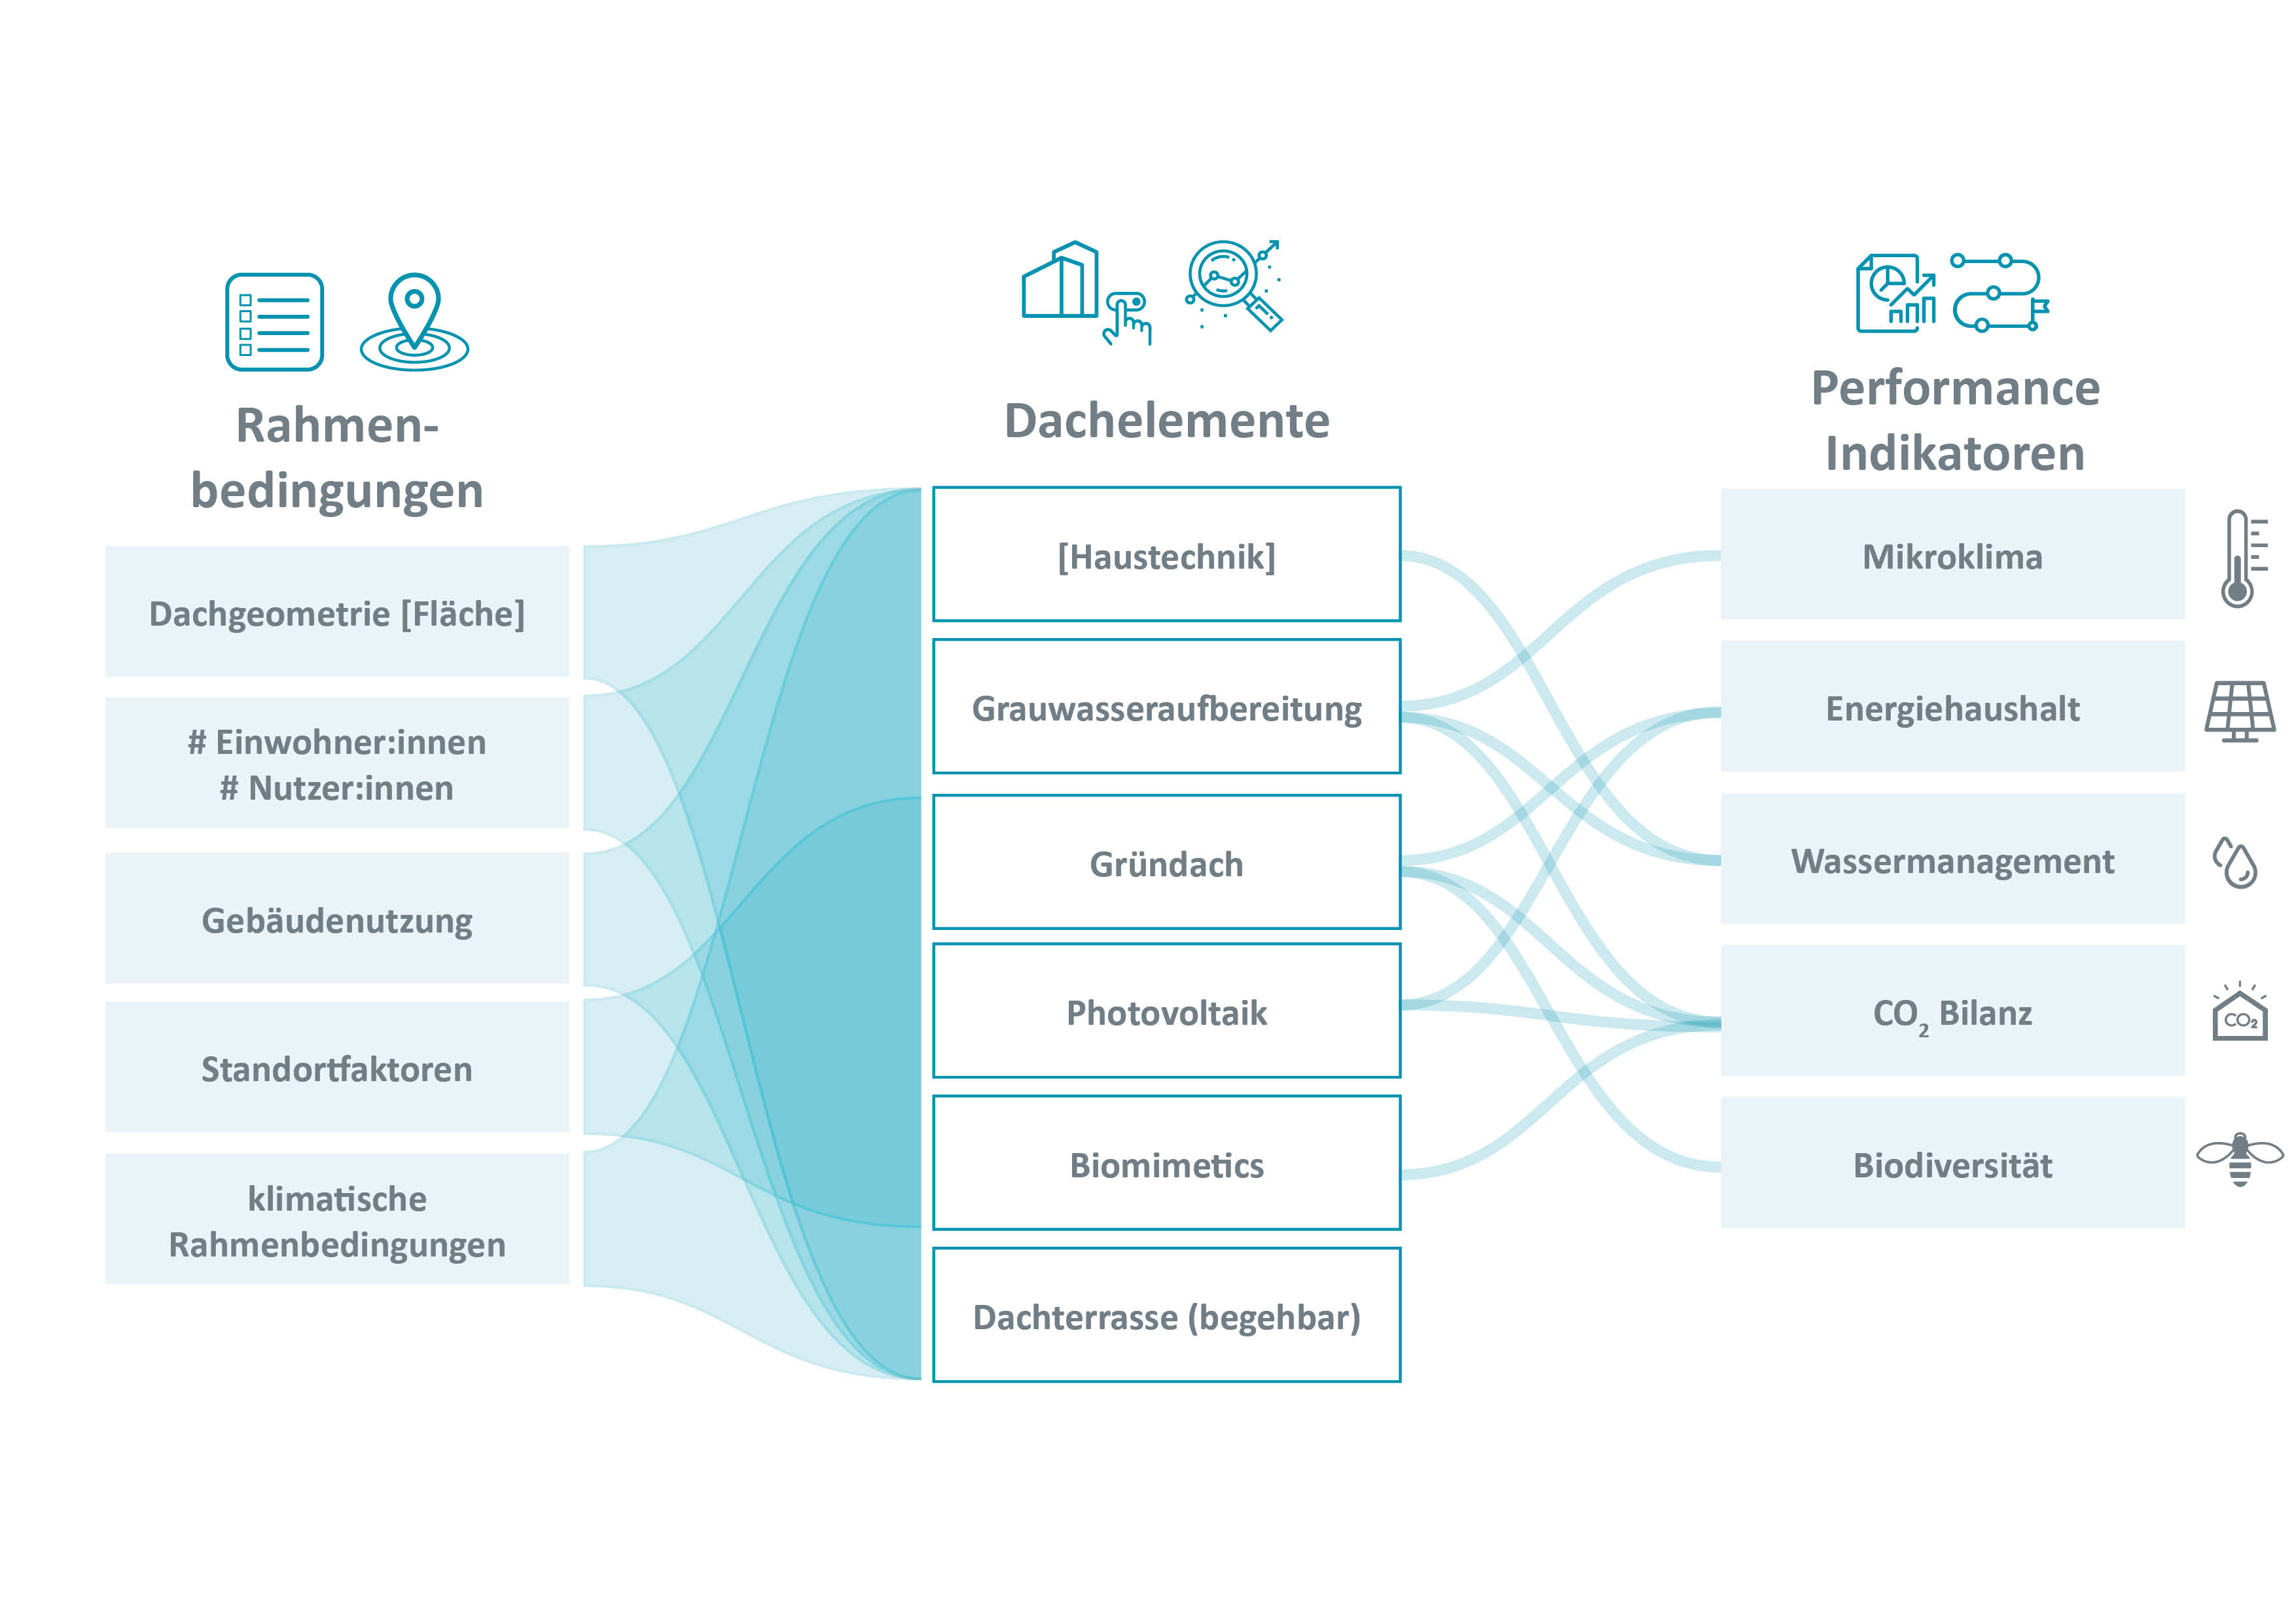
Concept of NaNu3 framework, selected roof elements, and performance indicator groups.
The figure shows the concept on the framework, the selected roof elements and the performance indicator groups.
Copyright: AIT

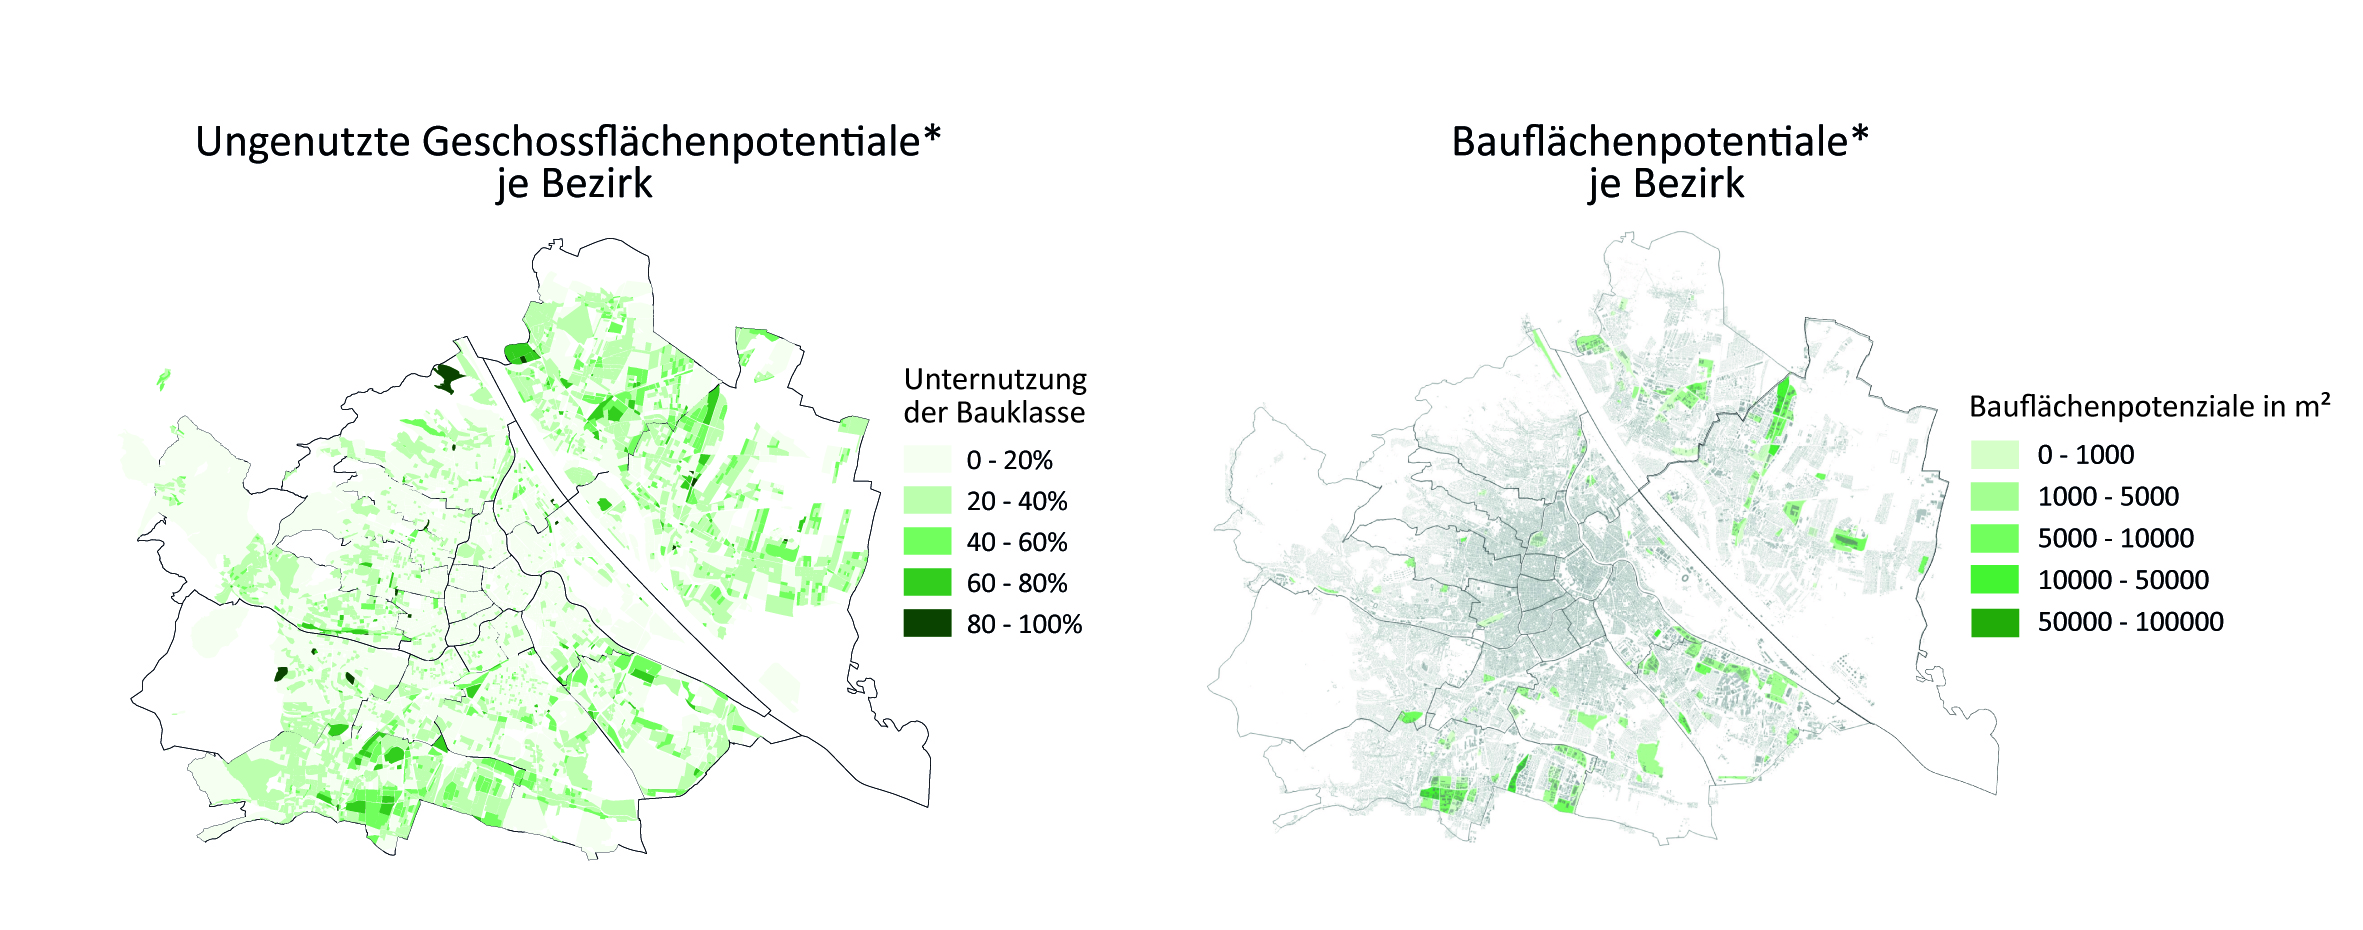
Floor and building area potentials (>550 m² floor area) per building block in Vienna.
This figure shows 2 choropleth maps of Vienna a) the "unused floor area potentials" in Vienna and b) building area potentials (in square meters), - unbuilt building land, each per building block. In both categories, the potentials are mainly found in the districts north of the Danube, but also in the south of Vienna and in Simmering, whereas floor area potentials can be found in the entire city area.
Copyright: S. Bindreiter et al. 2021
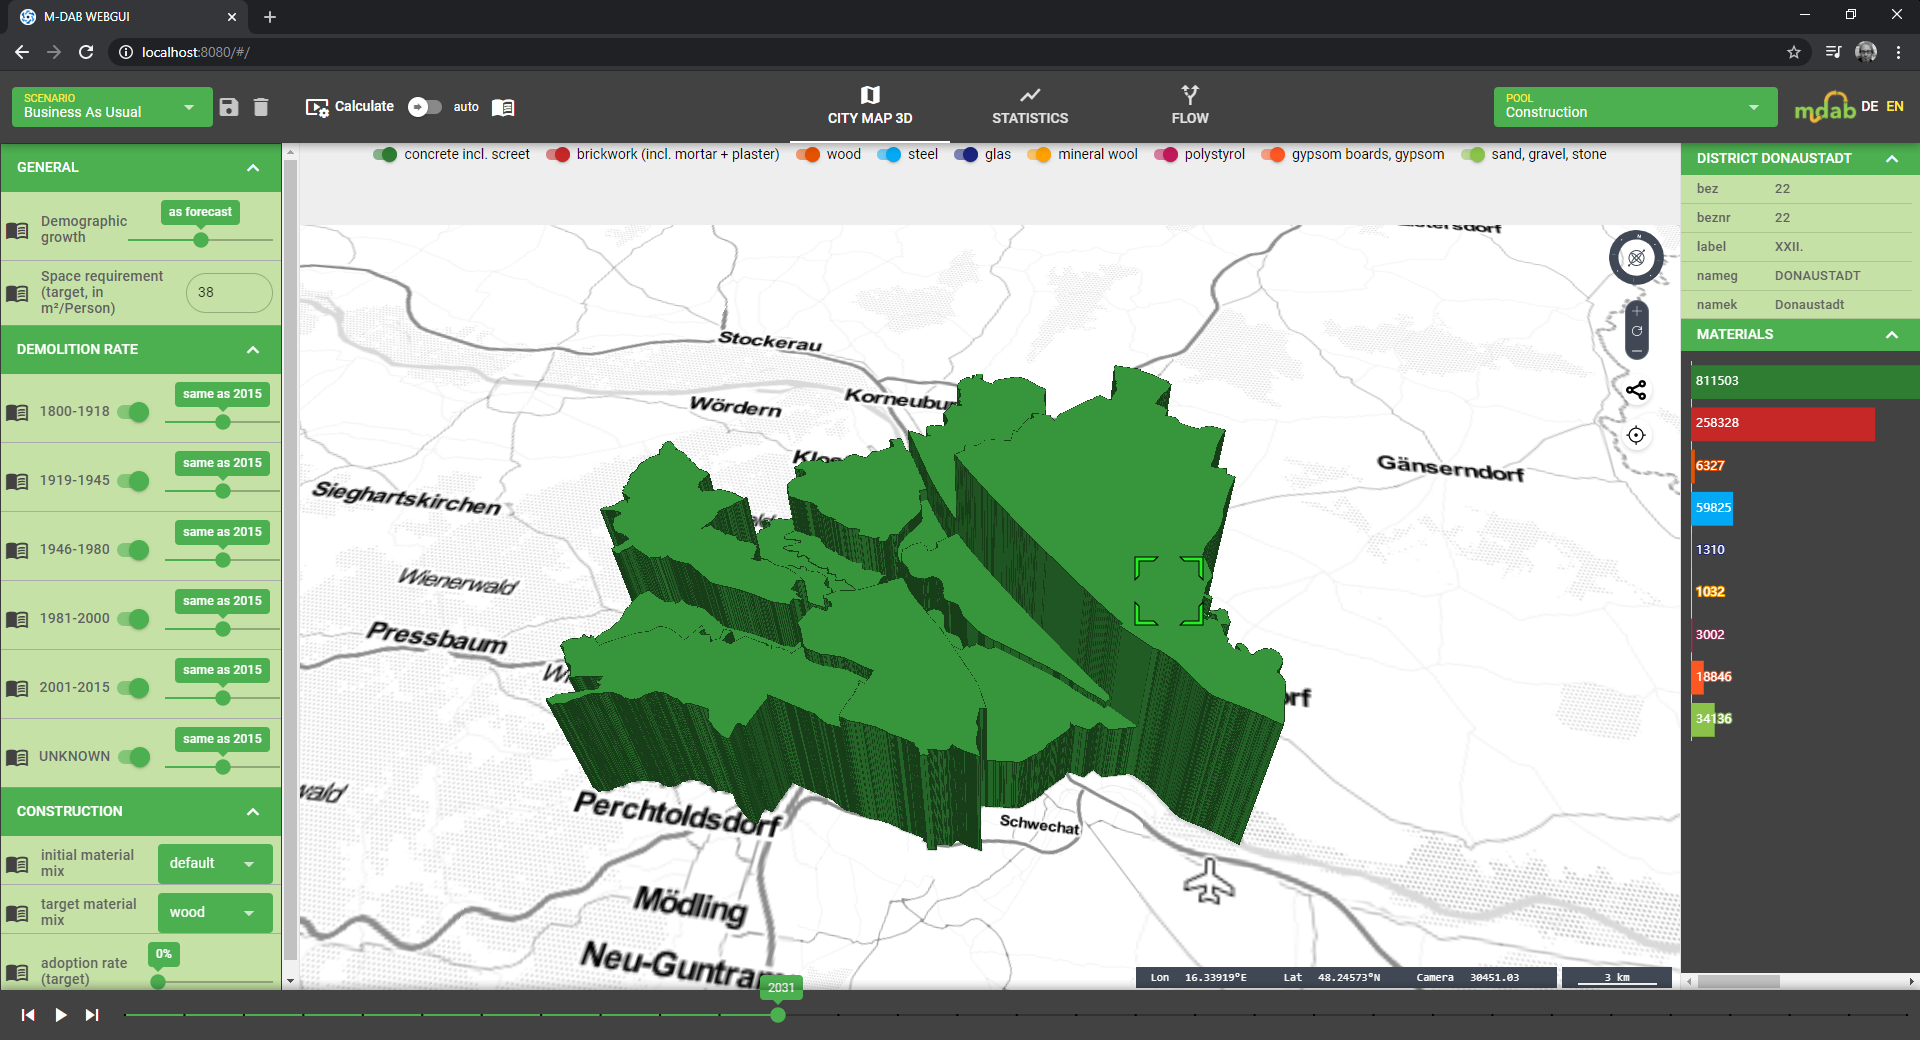
Simulation and visualization prototype
The figure shows a screenshot of the visualization prototype with a three-dimensional map representation of the calculated quantities of building materials per district. Thereby, district base areas are extruded in height depending on the material quantities. Colors indicate the dominating material group (in this representation predominantly concrete incl. screed). The color assignment follows ÖNORM A-6240. Left of the map, the scenario editor is shown, which allows setting of demolition rates for buildings of different construction periods as well as assumptions for the future population growth and the housing demand per inhabitant. Right of the map is a detailed analysis for the 22nd district of Vienna marked on the map. A bar chart shows the material quantities per material group in tons. In the navigation bar on top of the map, scenarios from the scenario editor can be loaded and saved, and it is also possible to switch between the map view and other diagram views. Below the map is a time slider that can be used to track the calculated values of the scenarios over time between the year 2020 and the year 2050.
Copyright: S. Bindreiter et al. 2021
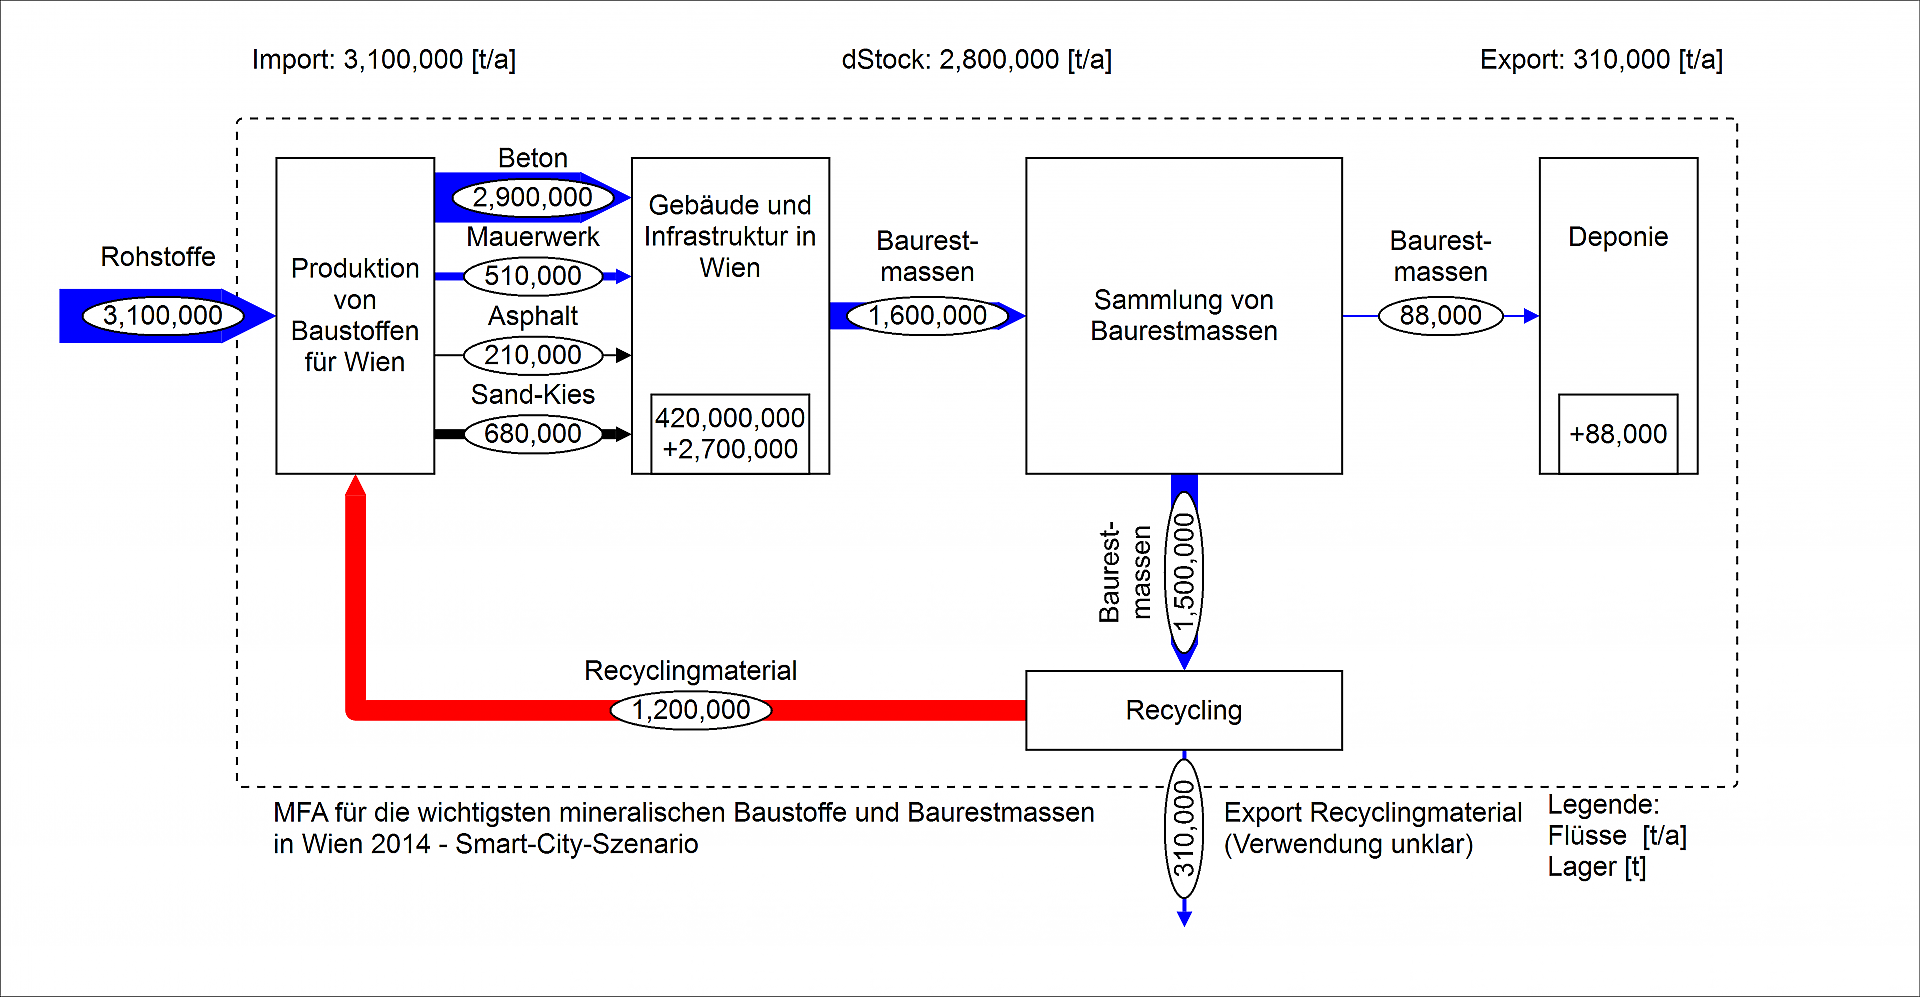
Scenario for future, cycle-oriented management of construction waste in Vienna (reference year 2014, material flows in t/a)
The figure shows a material flow diagram of the main mineral building materials and construction waste in Vienna for the reference year 2014, assuming that the system is optimized with regard to cycle-oriented criteria. The figures refer to one year and are given in tons. The system boundary includes the city of Vienna. A total of 3.1 million tons of building materials are imported into the system per year, 0.31 million tons are exported as recycled material with unknown use. The material stock (buildings and infrastructure in Vienna) increases by 2.8 million tons. The following five processes are mapped within the system boundary: (1) production of construction materials for Vienna, (2) buildings and infrastructure in Vienna, (3) collection of construction waste, (4) landfill, and (5) recycling). In (1), 3.1 million tons of raw materials are imported (as input to the system), and in addition, 1.2 million tons of recycled materials from process (5) Recycling enter the process as an input stream. The following quantities of building materials are exported from process (1) to process (2): 2.9 million tons of concrete, 0.51 million tons of masonry, 0.21 asphalt, and 0.68 million tons of sand-gravel. Process No. (2) Building and Infrastructure in Vienna includes a material stock of 420 million tons of building materials, which increases by 2.7 million tons. Leaving this process is 1.6 million t of construction waste, which is the input to process (3). From process (3) collection of construction waste 0.088 million t. Construction waste masses are exported to process (4) Landfill and deposited there, and the remaining 1.5 million t of construction waste masses enter process (5) Recycling. Since 1.2 million t in this scenario are reused as recycled building materials within the system boundary and substitute primary raw materials, only the remaining 0.310 million t are exported from process (5) Recycling outside the system boundary and thus constitute the export from the system (Vienna Construction Industry - Smart City Scenario).